Jose Falck Zepeda Presentation Cambridge University December 2014 FINAL on Biotechnology and...
51
Program for Biosafety Systems – http://pbs.ifpri.info/ “Biotechnology and Developing Countries” José Falck Zepeda Senior Research Fellow / Leader PBS Policy Team International Food Policy Research Institute - Program for Biosafety Systems (IFPRI - PBS) Presentation made at Department of Politics and International Studies, Cambridge University, UK, December 2014.
-
Upload
jose-falck -
Category
Documents
-
view
4 -
download
1
description
This presentation made at the Department of Politics and International Studies, Cambridge University, UK on December 2014 by Jose Falck-Zepeda, highlights the need to continue investing in agricultural R&D in developing countries as a way to respond to existing and upcoming challenges. The presentation describes how biotechnology can be a tool contributing to the goal of food safety, food security, poverty alleviation and creating prosperity. This is followed by a description of the experience with socioeconomic assessments of Genetically Modified crops adoption in developing countries and a set of policy options and procedures for discussion.
Transcript of Jose Falck Zepeda Presentation Cambridge University December 2014 FINAL on Biotechnology and...
Program for Biosafety Systems – http://pbs.ifpri.info/
“Biotechnology and Developing Countries”
José Falck ZepedaSenior Research Fellow / Leader PBS Policy Team
International Food Policy Research Institute - Program for Biosafety Systems (IFPRI - PBS)
Presentation made at Department of Politics and International Studies,
Cambridge University, UK, December 2014.

Program for Biosafety Systems – http://pbs.ifpri.info/
Content
1. Background and conceptual framework
2. Biotechnology as a tool
3. GM biotechnology as the regulated technology
4. Socioeconomic assessment experiences
5. Policy guidance
Program for Biosafety Systems – http://pbs.ifpri.info/
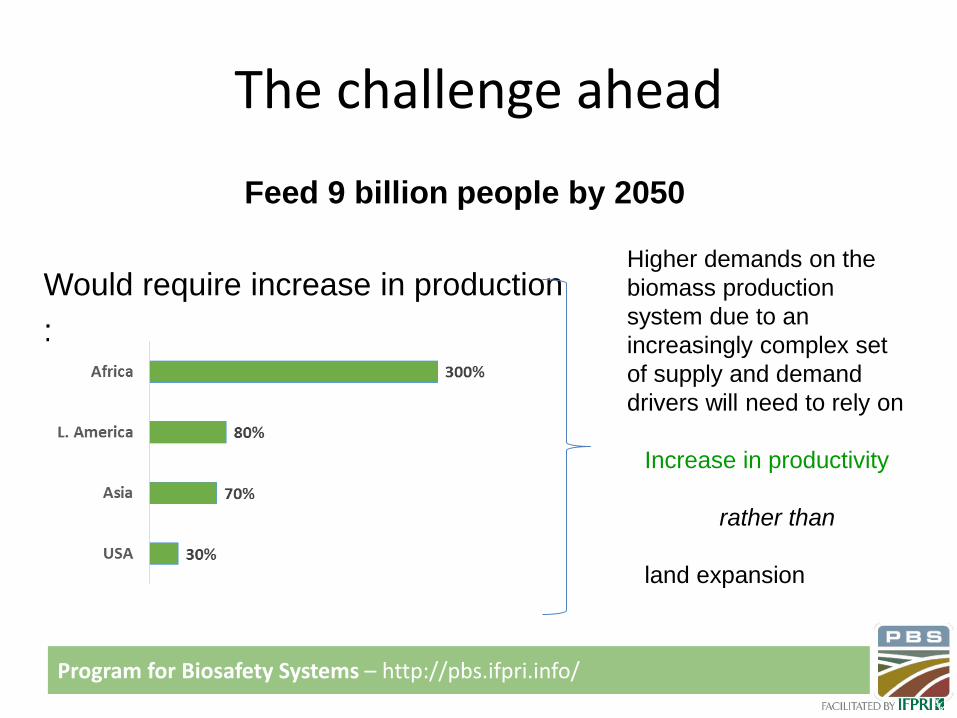
The challenge ahead
Feed 9 billion people by 2050
Would require increase in production
:
Higher demands on the
biomass production
system due to an
increasingly complex set
of supply and demand
drivers will need to rely on
Increase in productivity
rather than
land expansion

Program for Biosafety Systems – http://pbs.ifpri.info/
The role of agricultural technologies
http://www.ifpri.org/sites/defa
ult/files/publications/oc76.pdf
Key technology options to increase
cereal yields rapidly and sustainably
in the face of growing natural
resource scarcity and climate
change
Selected technologies and practices
have the potential to increase yields
while making better use of resources,
helping farmers adapt to a changing
climate, and reducing environmental
impacts by limiting pollution and
demands on ecosystem services
Program for Biosafety Systems – http://pbs.ifpri.info/
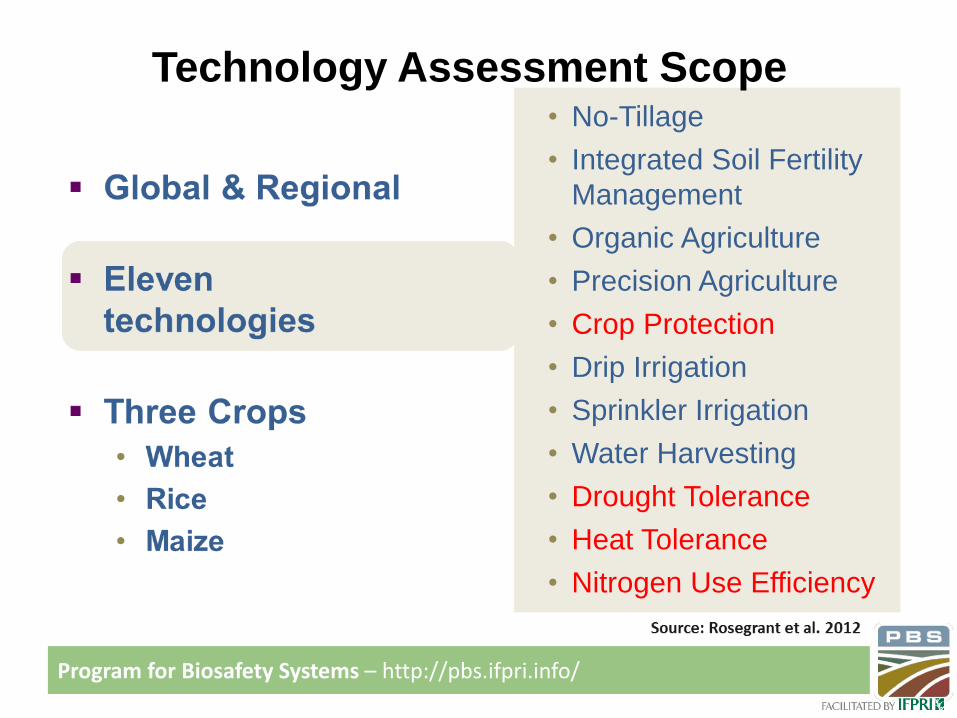
Technology Assessment Scope• No-Tillage
• Integrated Soil Fertility
Management
• Organic Agriculture
• Precision Agriculture
• Crop Protection
• Drip Irrigation
• Sprinkler Irrigation
• Water Harvesting
• Drought Tolerance
• Heat Tolerance
• Nitrogen Use Efficiency
Program for Biosafety Systems – http://pbs.ifpri.info/
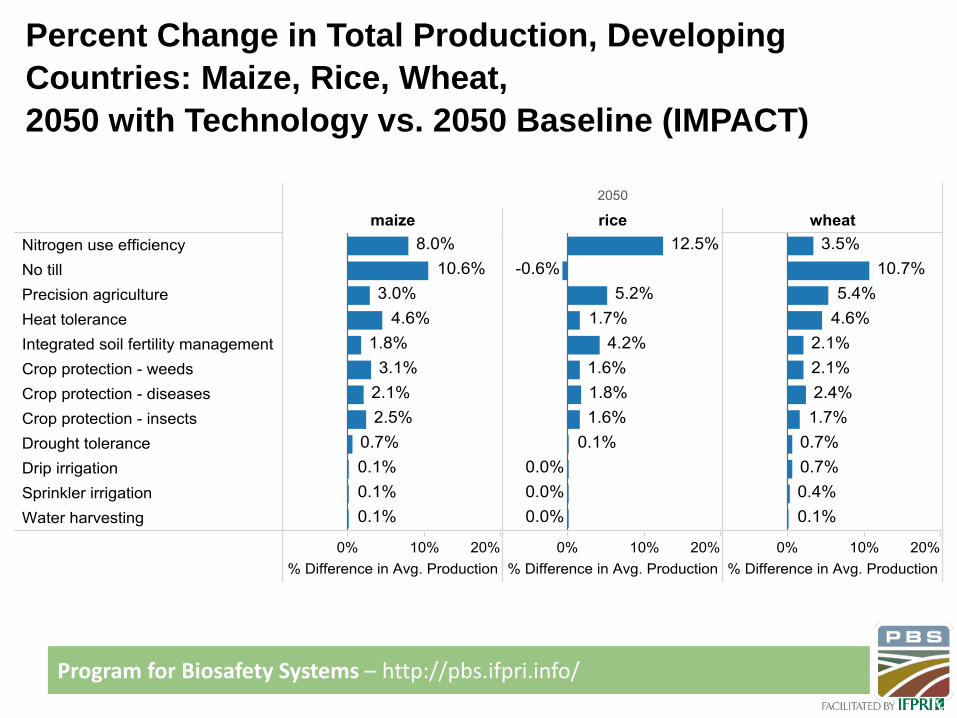
Percent Change in Total Production, Developing
Countries: Maize, Rice, Wheat,
2050 with Technology vs. 2050 Baseline (IMPACT)
CT)
Program for Biosafety Systems – http://pbs.ifpri.info/
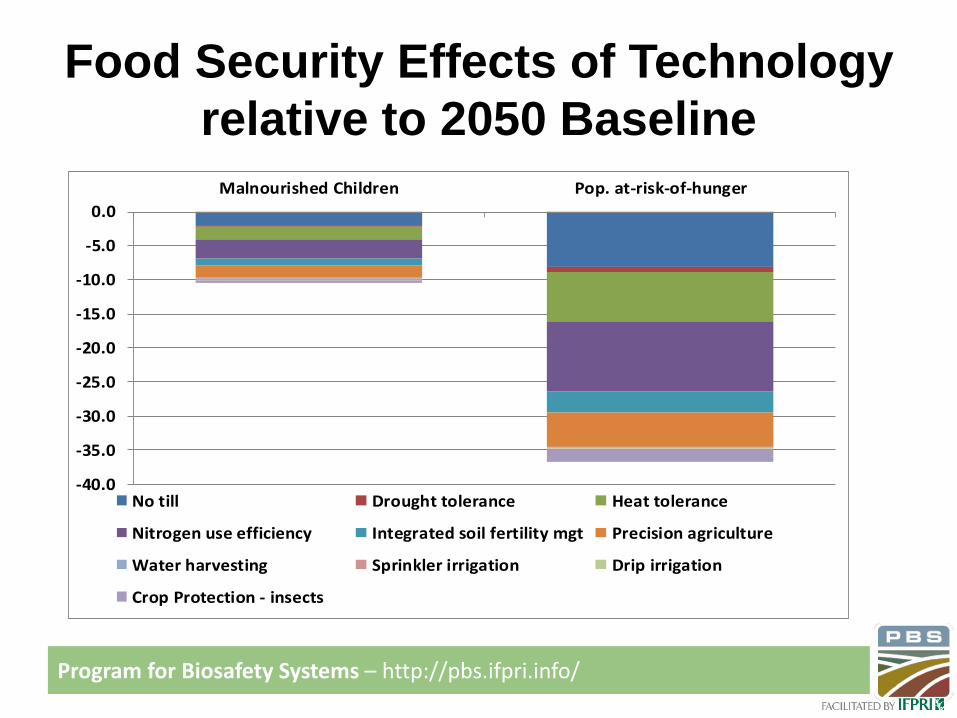
Food Security Effects of Technology
relative to 2050 Baseline
-40.0
-35.0
-30.0
-25.0
-20.0
-15.0
-10.0
-5.0
0.0
Malnourished Children Pop. at-risk-of-hunger
No till Drought tolerance Heat tolerance
Nitrogen use efficiency Integrated soil fertility mgt Precision agriculture
Water harvesting Sprinkler irrigation Drip irrigation
Crop Protection - insects
Program for Biosafety Systems – http://pbs.ifpri.info/
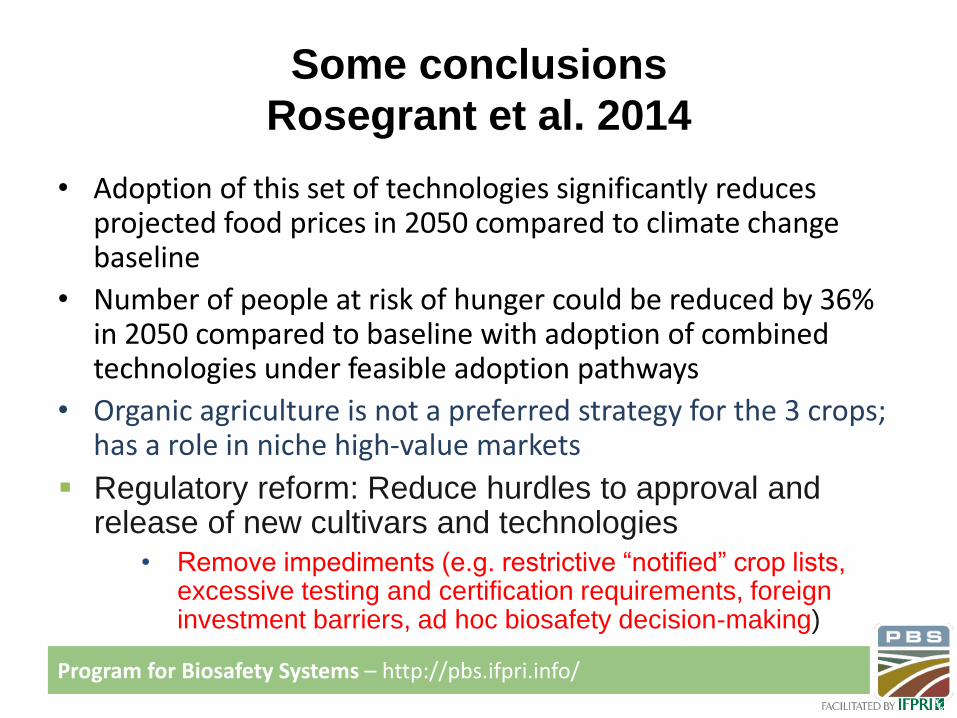
Some conclusions
Rosegrant et al. 2014
• Adoption of this set of technologies significantly reduces projected food prices in 2050 compared to climate change baseline
• Number of people at risk of hunger could be reduced by 36% in 2050 compared to baseline with adoption of combined technologies under feasible adoption pathways
• Organic agriculture is not a preferred strategy for the 3 crops; has a role in niche high-value markets
Regulatory reform: Reduce hurdles to approval and release of new cultivars and technologies
• Remove impediments (e.g. restrictive “notified” crop lists, excessive testing and certification requirements, foreign investment barriers, ad hoc biosafety decision-making)
Program for Biosafety Systems – http://pbs.ifpri.info/
2. Biotechnology as a tool
Program for Biosafety Systems – http://pbs.ifpri.info/
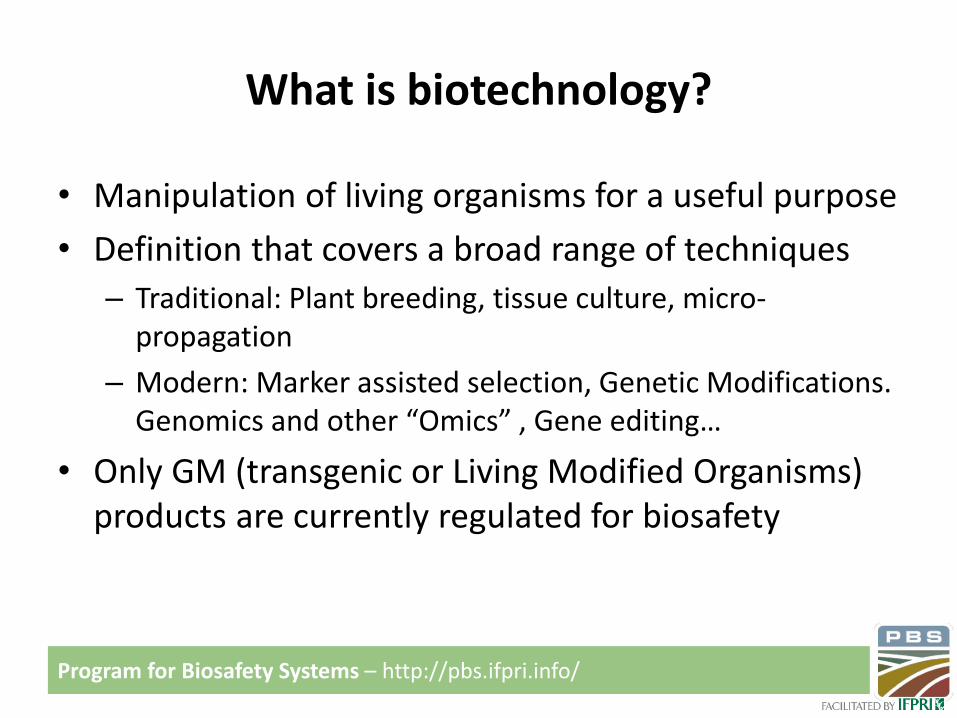
What is biotechnology?
• Manipulation of living organisms for a useful purpose
• Definition that covers a broad range of techniques
– Traditional: Plant breeding, tissue culture, micro-propagation
– Modern: Marker assisted selection, Genetic Modifications. Genomics and other “Omics” , Gene editing…
• Only GM (transgenic or Living Modified Organisms) products are currently regulated for biosafety
Program for Biosafety Systems – http://pbs.ifpri.info/
Program for Biosafety Systems – http://pbs.ifpri.info/
Implications for developing country agriculture
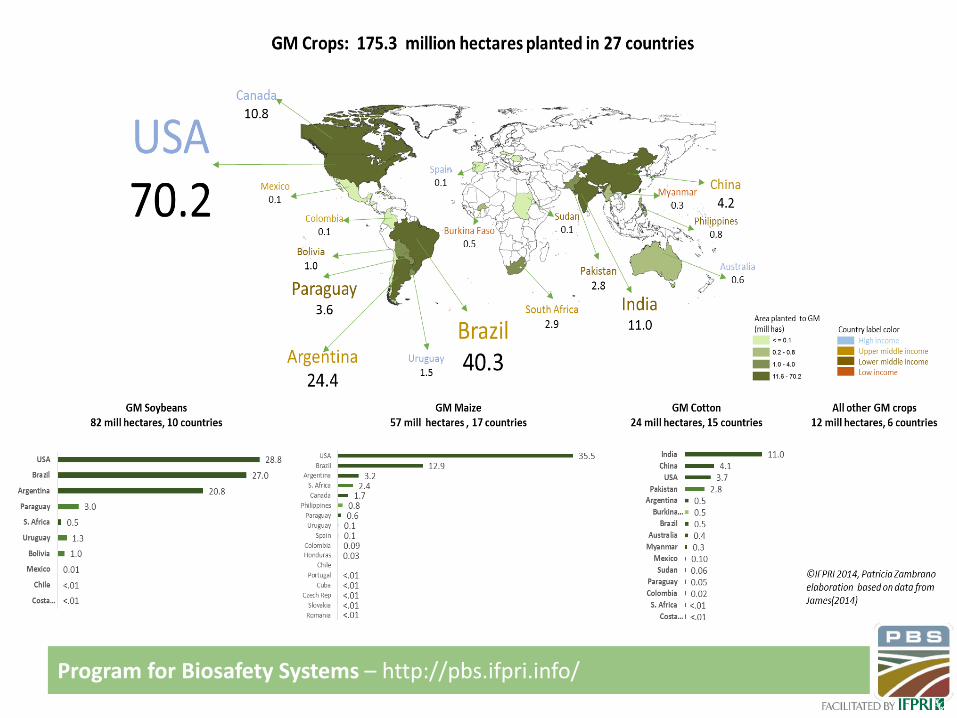
• Majority expansion is in four crops and two traits (insect protection and herbicide tolerance) produced by industrialized countries for its agriculture
• Diffusion to developing has been a (fortunate) development
• Challenge now is meeting explicit needs of
– Developing countries
– Smallholder / resource poor farmers
– Crop / traits
Program for Biosafety Systems – http://pbs.ifpri.info/
R&D and innovation for and by developing countries
• Crops and traits of interest/value have been produced
• Capacity to develop GM crops and other biotechnologies
– Advanced => China, Brazil, Mexico, India, Argentina
– Medium- Advanced => Philippines, Thailand, Indonesia
• Next Harvest documented 270 technologies in 16 developing countries
Why aren’t these technologies in the hands of famers?
Program for Biosafety Systems – http://pbs.ifpri.info/
3. Biotechnology as a regulated R&D activity
Program for Biosafety Systems – http://pbs.ifpri.info/
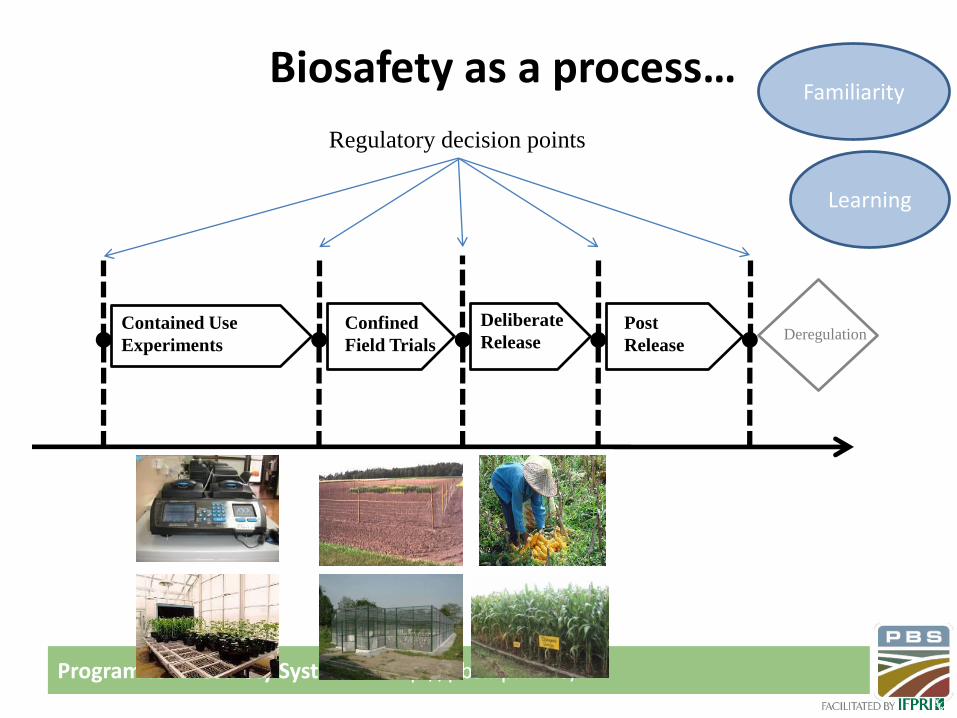
Biosafety as a process…
Contained Use
Experiments
Confined
Field Trials
Deliberate
ReleasePost
ReleaseDeregulation
Regulatory decision points
Familiarity
Learning

Program for Biosafety Systems – http://pbs.ifpri.info/
R&D and product development life cycle
1 – 3 yrs. 1 – 3 yrs. 1 – 3 yrs.
Product Concept
Discovery Early Product Testing & Development
Integration & Product Selection
Product Ramp Up
Market Introduction
1 2 3 4 5 6
Confined Field Trials
Author: Ramaeker-Zahn

Program for Biosafety Systems – http://pbs.ifpri.info/
Regulatory processes, decision making and assessments
Environmental and Food/Feed
Safety Assessment
Socio-Economic
Assessments (plus others?)
Decision Making

Program for Biosafety Systems – http://pbs.ifpri.info/
Assessment FrameworksType International protocol / conceptual framework
Impacts on biodiversity and ecosystem services
- Biodiversity Indicators Partnership- Millenium Ecosystem Assessment- Convention on Biological Diversity 9(CBD)
Environmental biosafety Cartagena Protocol on Biosafety
Food/feed safety - CODEX ALIMENTARIUS- OECD Documentns
Socio-economicconsiderations
Some guidance documents and elements of best practice- International Association of Impact Assessments- CGIAR
Emerging conceptual frameworks- Sustainable Livelihoods- Value Chains analysis- Institutional analysis- Innovation Systems- Institutional Feasibility Studies
Program for Biosafety Systems – http://pbs.ifpri.info/
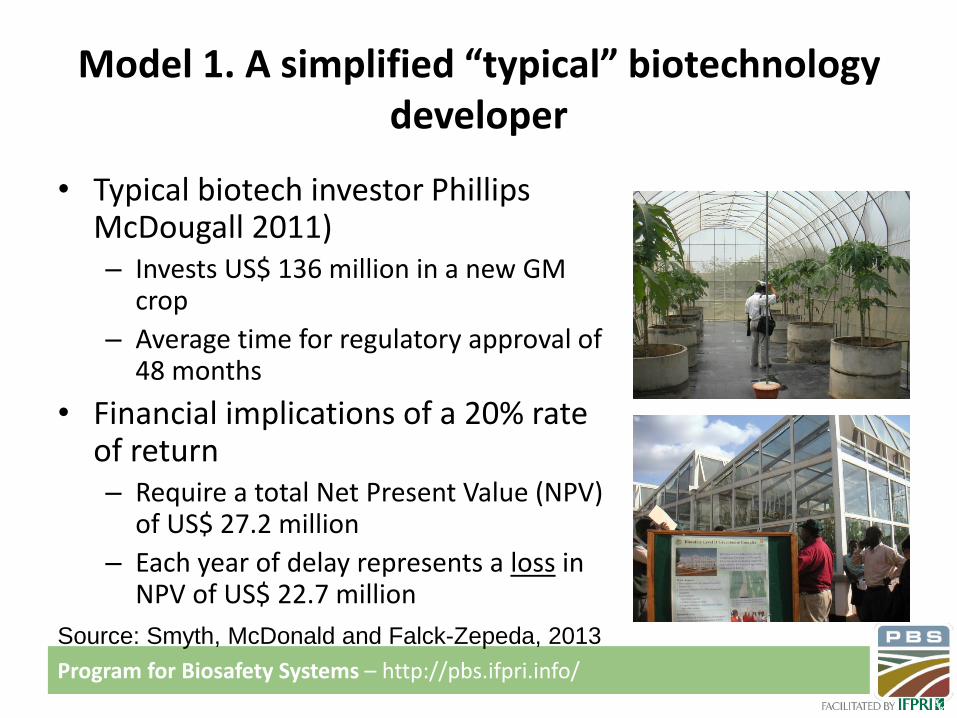
Model 1. A simplified “typical” biotechnology developer
• Typical biotech investor Phillips McDougall 2011)– Invests US$ 136 million in a new GM
crop
– Average time for regulatory approval of 48 months
• Financial implications of a 20% rate of return– Require a total Net Present Value (NPV)
of US$ 27.2 million
– Each year of delay represents a loss in NPV of US$ 22.7 million
Source: Smyth, McDonald and Falck-Zepeda, 2013
Program for Biosafety Systems – http://pbs.ifpri.info/
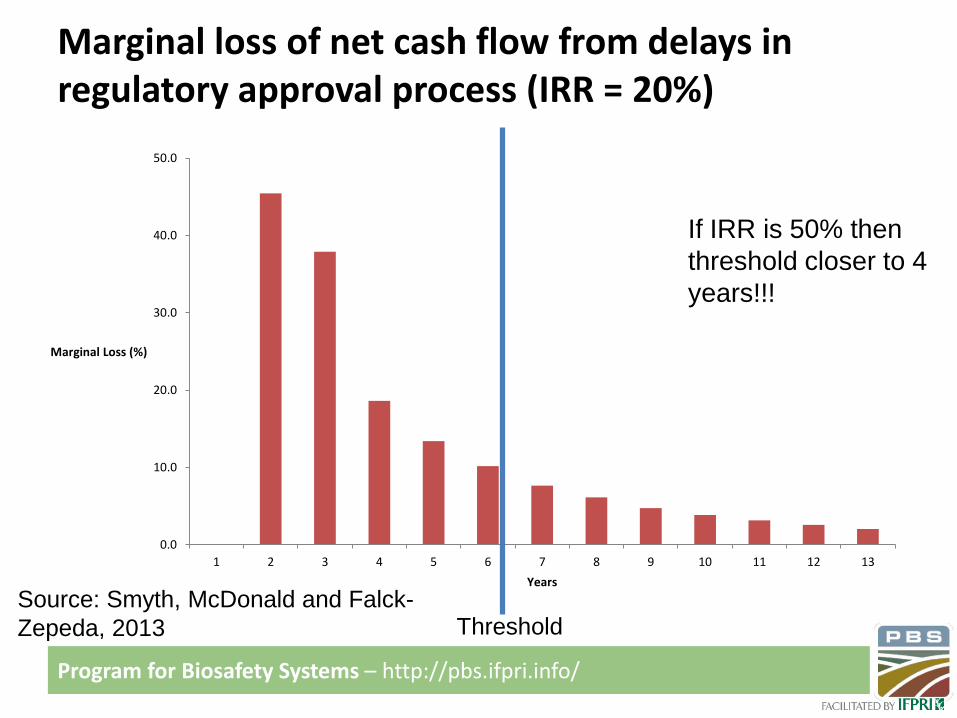
Marginal loss of net cash flow from delays in regulatory approval process (IRR = 20%)
0.0
10.0
20.0
30.0
40.0
50.0
1 2 3 4 5 6 7 8 9 10 11 12 13
Marginal Loss (%)
Years
Source: Smyth, McDonald and Falck-
Zepeda, 2013 Threshold
If IRR is 50% then
threshold closer to 4
years!!!
Program for Biosafety Systems – http://pbs.ifpri.info/
Issues and Implications
• Regulatory delays have a negative impact on returns to investments
• With a 20% rate of return, expect year 6 of regulatory delay to be the trigger point for suspending investment in new R&D projects
• Current regulatory approvals taking 48 months implies that the upper boundary has likely been reached
Source: Smyth, McDonald and Falck-Zepeda, 2013
Program for Biosafety Systems – http://pbs.ifpri.info/
Impact of risk and uncertainty in the stream of benefits
• Investment returns become riskier over time for a well characterized recovery path
• What happens if developers forced to “forsake” the element of predictability?
– Ambiguity: Cannot make a determination due to lack of knowledge about parameters (e.g. completion of regulatory process)
– Uncertainty: Unexpected events
• Likelihood that an investment will not be made increases with increased uncertainty and ambiguity
Program for Biosafety Systems – http://pbs.ifpri.info/
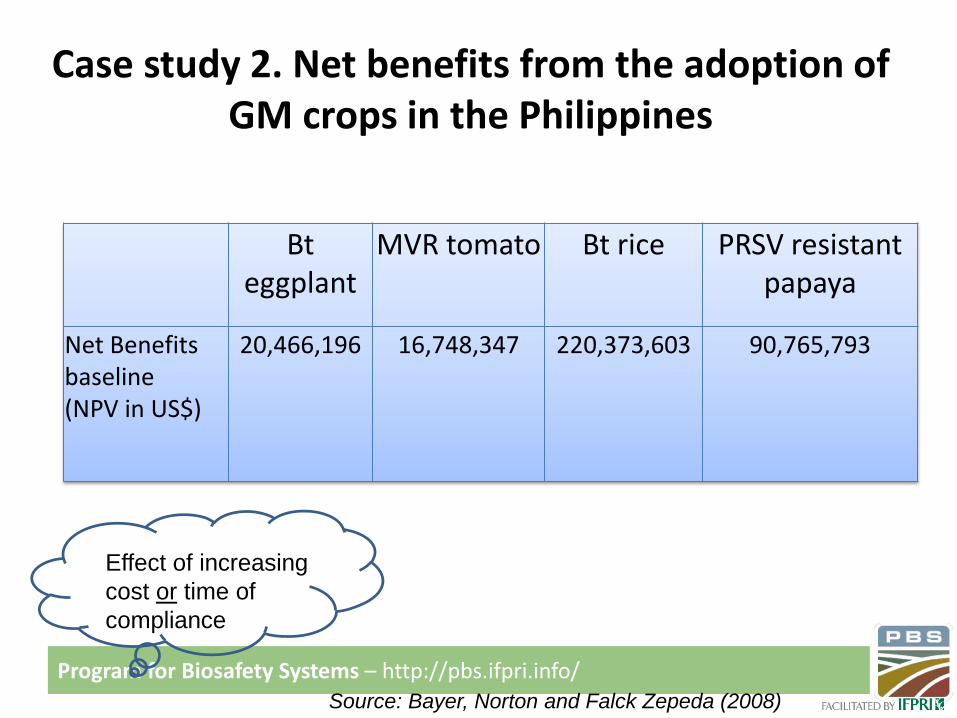
Case study 2. Net benefits from the adoption of GM crops in the Philippines
Bt eggplant
MVR tomato Bt rice PRSV resistant papaya
Net Benefits baseline (NPV in US$)
20,466,196 16,748,347 220,373,603 90,765,793
Effect of increasing
cost or time of
compliance
Source: Bayer, Norton and Falck Zepeda (2008)
Program for Biosafety Systems – http://pbs.ifpri.info/
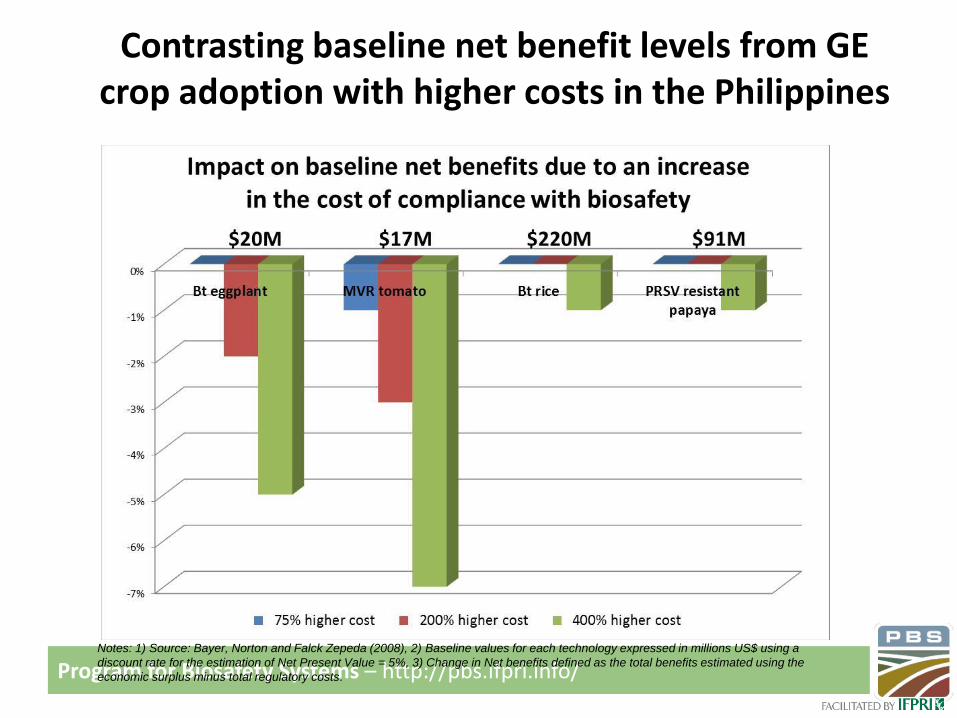
Contrasting baseline net benefit levels from GE crop adoption with higher costs in the Philippines
Notes: 1) Source: Bayer, Norton and Falck Zepeda (2008), 2) Baseline values for each technology expressed in millions US$ using a
discount rate for the estimation of Net Present Value = 5%, 3) Change in Net benefits defined as the total benefits estimated using the
economic surplus minus total regulatory costs.
Program for Biosafety Systems – http://pbs.ifpri.info/
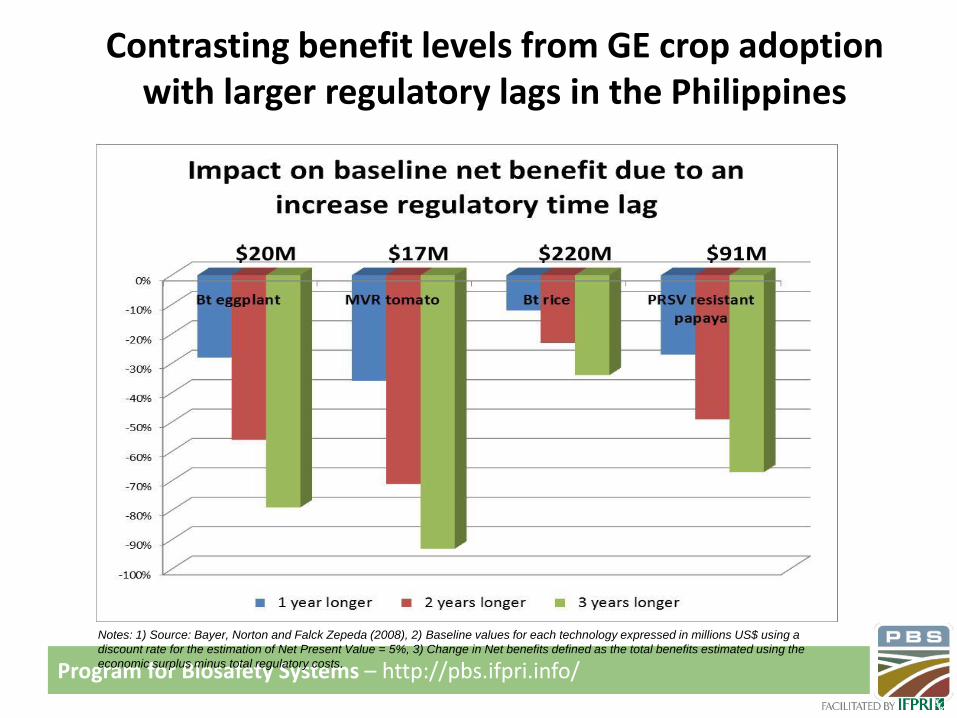
Contrasting benefit levels from GE crop adoption with larger regulatory lags in the Philippines
Notes: 1) Source: Bayer, Norton and Falck Zepeda (2008), 2) Baseline values for each technology expressed in millions US$ using a
discount rate for the estimation of Net Present Value = 5%, 3) Change in Net benefits defined as the total benefits estimated using the
economic surplus minus total regulatory costs.
Program for Biosafety Systems – http://pbs.ifpri.info/
4. What do we know about the socio-economic impact of GE technologies?
Program for Biosafety Systems – http://pbs.ifpri.info/
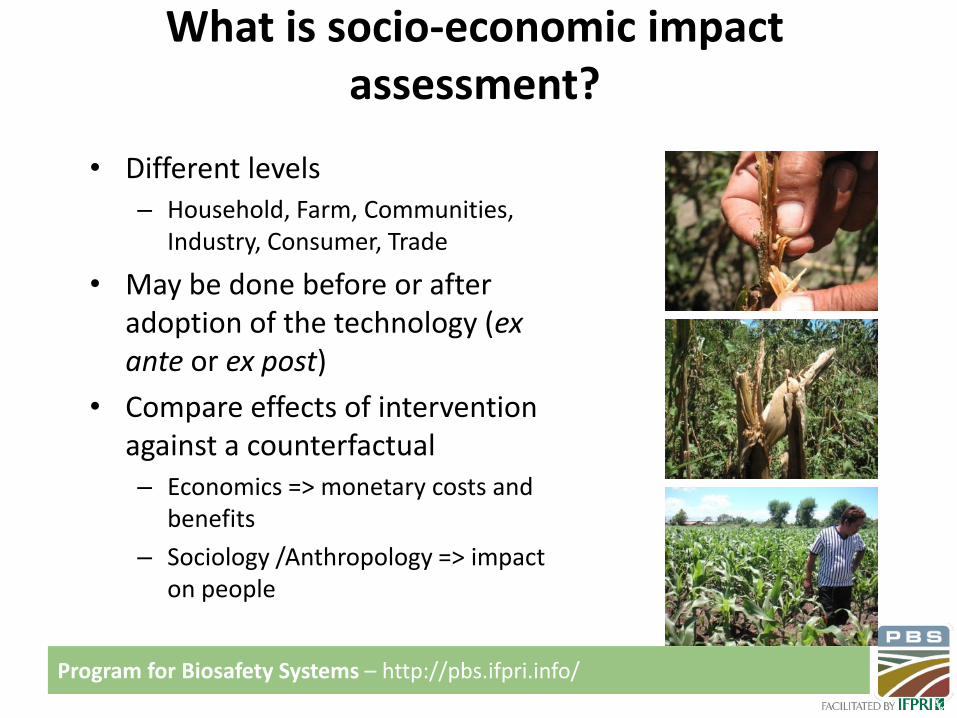
What is socio-economic impact assessment?
• Different levels – Household, Farm, Communities,
Industry, Consumer, Trade
• May be done before or after adoption of the technology (ex ante or ex post)
• Compare effects of intervention against a counterfactual– Economics => monetary costs and
benefits
– Sociology /Anthropology => impact on people
Program for Biosafety Systems – http://pbs.ifpri.info/
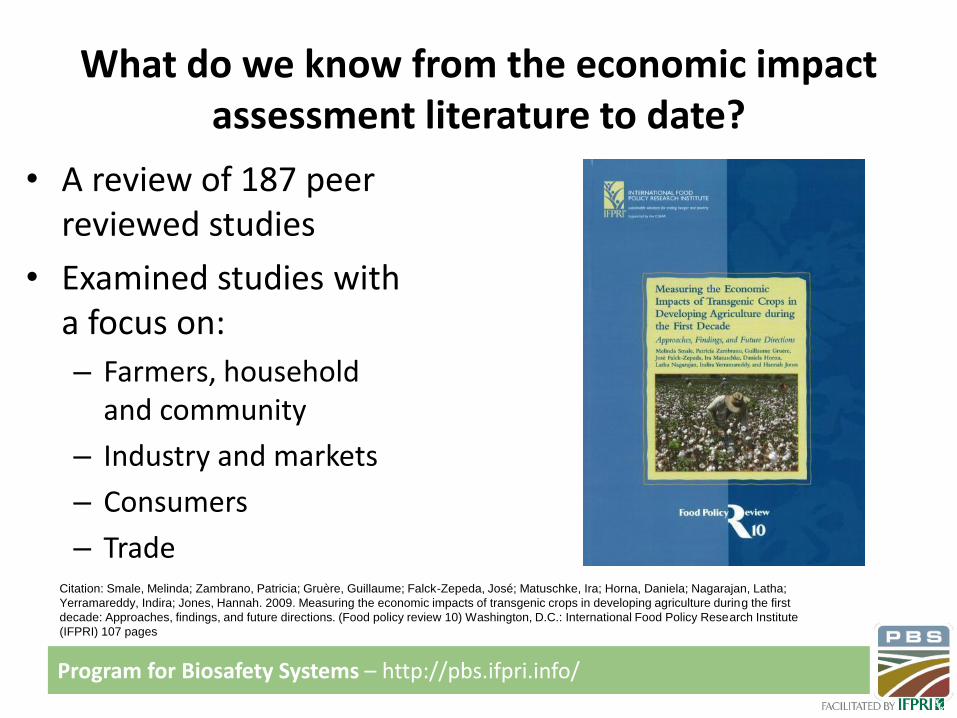
What do we know from the economic impact assessment literature to date?
• A review of 187 peer reviewed studies
• Examined studies with a focus on:
– Farmers, household and community
– Industry and markets
– Consumers
– TradeCitation: Smale, Melinda; Zambrano, Patricia; Gruère, Guillaume; Falck-Zepeda, José; Matuschke, Ira; Horna, Daniela; Nagarajan, Latha;
Yerramareddy, Indira; Jones, Hannah. 2009. Measuring the economic impacts of transgenic crops in developing agriculture during the first
decade: Approaches, findings, and future directions. (Food policy review 10) Washington, D.C.: International Food Policy Research Institute
(IFPRI) 107 pages
Program for Biosafety Systems – http://pbs.ifpri.info/
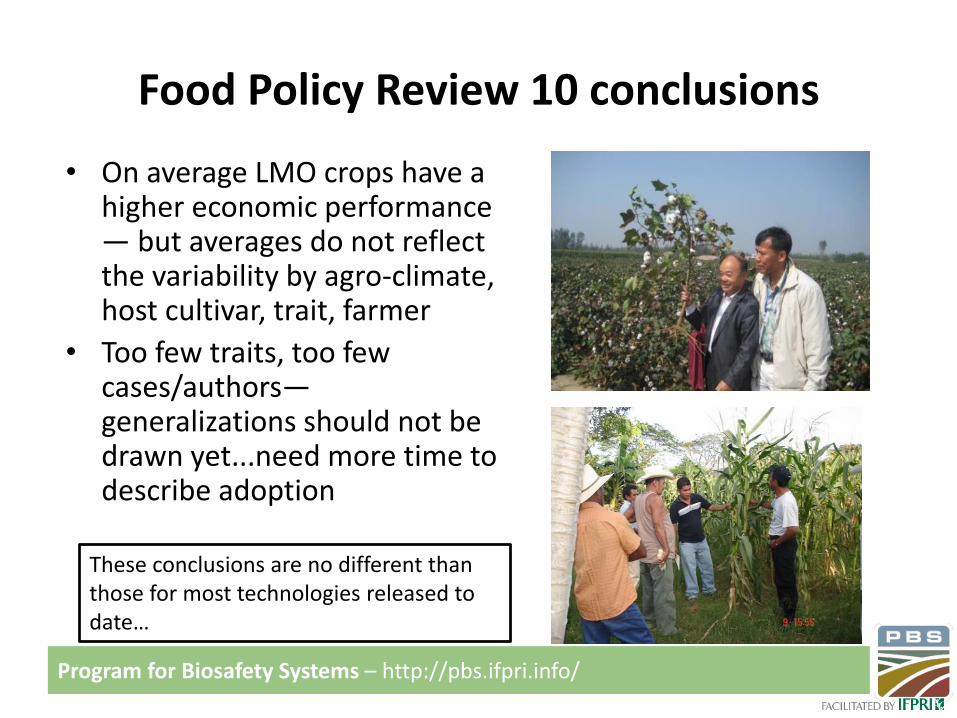
Food Policy Review 10 conclusions
• On average LMO crops have a higher economic performance — but averages do not reflect the variability by agro-climate, host cultivar, trait, farmer
• Too few traits, too few cases/authors—generalizations should not be drawn yet...need more time to describe adoption
These conclusions are no different than those for most technologies released to date…
Program for Biosafety Systems – http://pbs.ifpri.info/
A meta-analysis paper by Areal, Riesgo and Rodriguez-Cerezo (2012)
“GM crops perform better than their conventional counterparts in agronomic and economic (gross margin) terms”
“GM crops tend to perform better in developing countries than in developed countries, with Bt cotton being the most profitable crop grown”
Program for Biosafety Systems – http://pbs.ifpri.info/
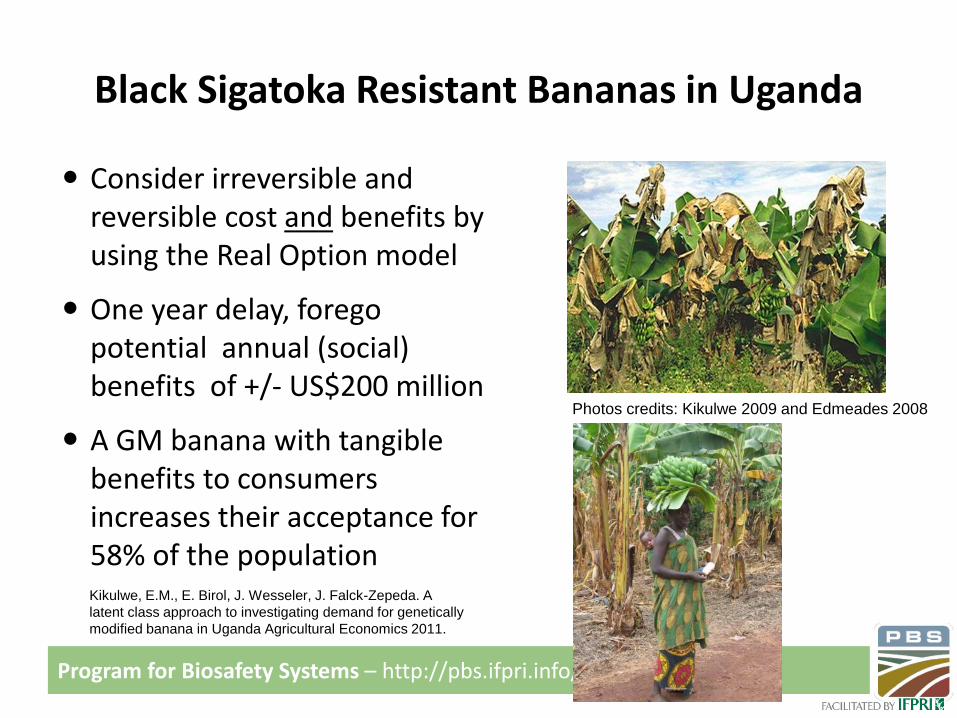
Black Sigatoka Resistant Bananas in Uganda
Consider irreversible and reversible cost and benefits by using the Real Option model
One year delay, forego potential annual (social) benefits of +/- US$200 million
A GM banana with tangible benefits to consumers increases their acceptance for 58% of the population
Photos credits: Kikulwe 2009 and Edmeades 2008
Kikulwe, E.M., E. Birol, J. Wesseler, J. Falck-Zepeda. A
latent class approach to investigating demand for genetically
modified banana in Uganda Agricultural Economics 2011.

Program for Biosafety Systems – http://pbs.ifpri.info/
Bt cotton in Uganda
Positive yield impacts and net benefits
Smaller rate of return probably explained due to low base yields Need to improve overall cotton
productivity
Probability of a negative return can be as high as 38% with a technology fee as charged elsewhere
Photos credit: © Horna 2009
Horna, et al. (2013) . “Economic Considerations in the Approval
Process of GM Cotton in Uganda: Designing an Ex-ante
Assessment to Support Decision-making. “IFPRI Monograph.
Program for Biosafety Systems – http://pbs.ifpri.info/
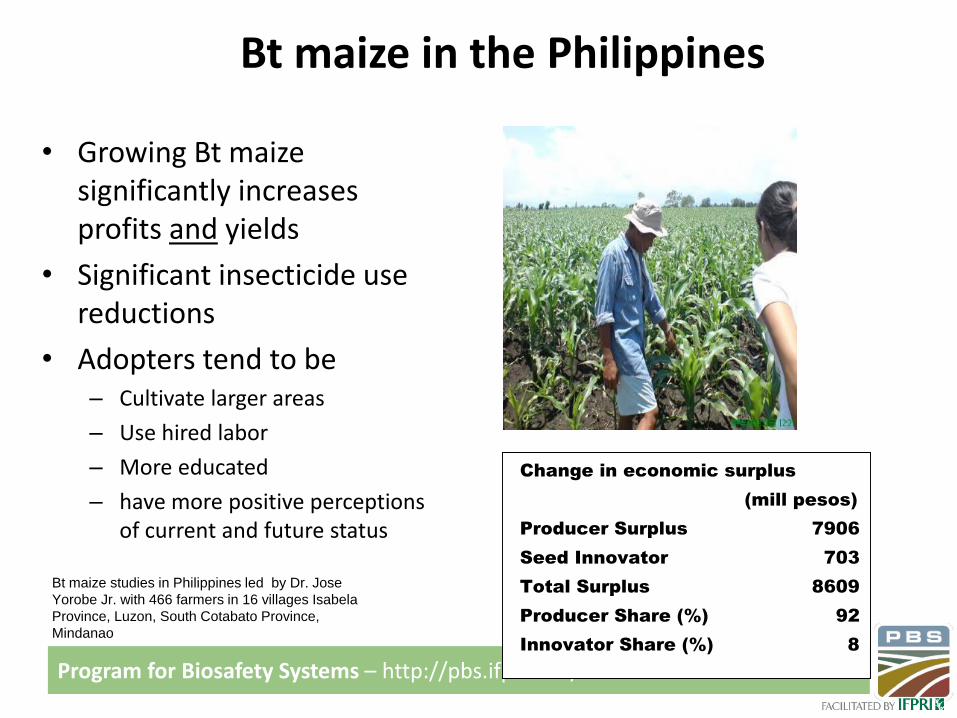
Bt maize in the Philippines
• Growing Bt maize significantly increases profits and yields
• Significant insecticide use reductions
• Adopters tend to be– Cultivate larger areas
– Use hired labor
– More educated
– have more positive perceptions of current and future status
Change in economic surplus
(mill pesos)
Producer Surplus 7906
Seed Innovator 703
Total Surplus 8609
Producer Share (%) 92
Innovator Share (%) 8
Bt maize studies in Philippines led by Dr. Jose
Yorobe Jr. with 466 farmers in 16 villages Isabela
Province, Luzon, South Cotabato Province,
Mindanao
Program for Biosafety Systems – http://pbs.ifpri.info/
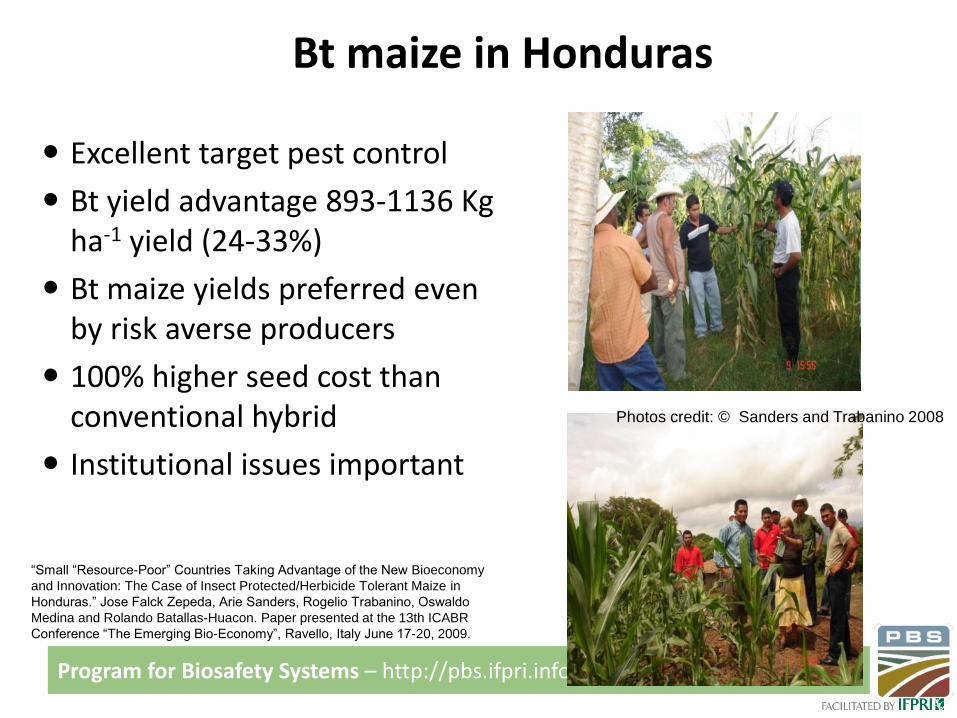
Bt maize in Honduras
Excellent target pest control
Bt yield advantage 893-1136 Kg ha-1 yield (24-33%)
Bt maize yields preferred even by risk averse producers
100% higher seed cost than conventional hybrid
Institutional issues important
Photos credit: © Sanders and Trabanino 2008
“Small “Resource-Poor” Countries Taking Advantage of the New Bioeconomy
and Innovation: The Case of Insect Protected/Herbicide Tolerant Maize in
Honduras.” Jose Falck Zepeda, Arie Sanders, Rogelio Trabanino, Oswaldo
Medina and Rolando Batallas-Huacon. Paper presented at the 13th ICABR
Conference “The Emerging Bio-Economy”, Ravello, Italy June 17-20, 2009.
Program for Biosafety Systems – http://pbs.ifpri.info/
Example from seed adoption sector“Farmer preferences for Milpa diversity and genetically modified
maize in Mexico” (Birol, Villalobos and Smale 2007)
• “Milpa” is crop production system in Mexico and C. America– Private economic value: food security, diet quality and livelihoods
– Public economic value: conserving agrobiodiversity, especially that of maize landraces (potential to contribute unique traits for future plant breeding efforts
• Subject to multiple externalities which have a negative impact
• Farmer heterogeneity is an issue identified by the study– (i) Landrace Conservationists
– (ii) Milpa Diversity Managers
– iii) Marginalized Maize Producers
• Contrast results with the 2004 Commission for Environmental Cooperation report
Program for Biosafety Systems – http://pbs.ifpri.info/
Policy Guidance
• Biotechnology and GM Crops are only technologies– Similarities and differences with other technologies
– Actual and potential benefits from GM technology adoption…important tool to consider. Cannot disregard
• Developments in the public sector in developing countries
• Additional crops/traits of interest whose limitations can probably be only addressed through biotechnology means, will be available if we manage to resolve institutional and regulatory issues.
• Convergence between technology/innovation and institutional /contextual/structural and food security issues
Program for Biosafety Systems – http://pbs.ifpri.info/
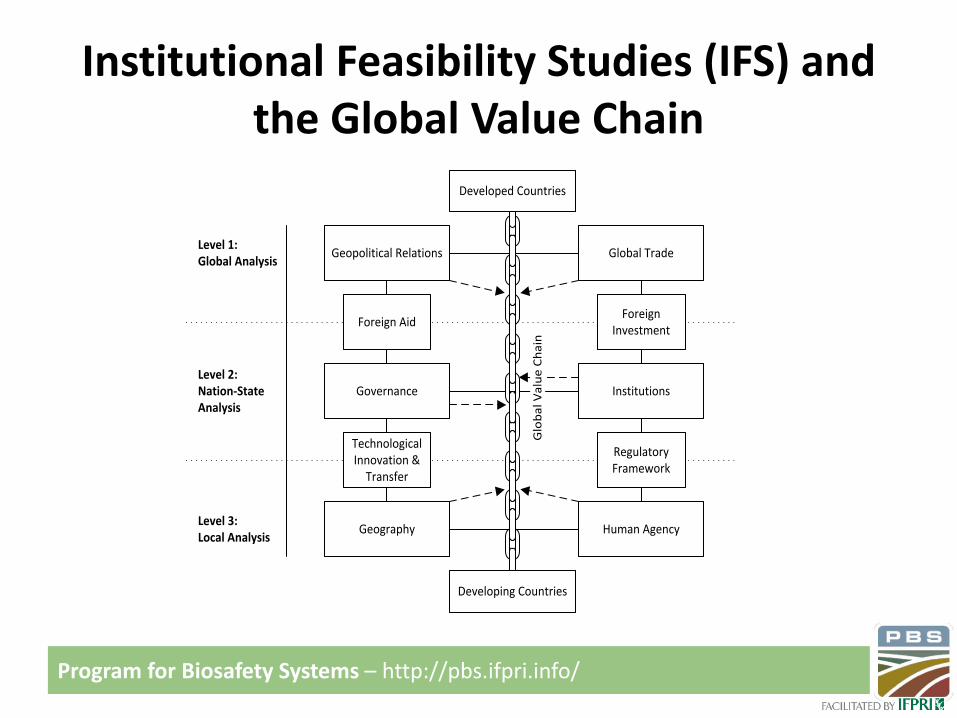
Institutional Feasibility Studies (IFS) and the Global Value Chain
Level 1:Global Analysis
Level 2:Nation-State Analysis
Level 3:Local Analysis
Geopolitical Relations
Governance
Geography
Global Trade
Institutions
Human Agency
Technological Innovation &
Transfer
Foreign Investment
Foreign Aid
Regulatory Framework
Glo
ba
l V
alu
e C
ha
in
Developed Countries
Developing Countries
Program for Biosafety Systems – http://pbs.ifpri.info/
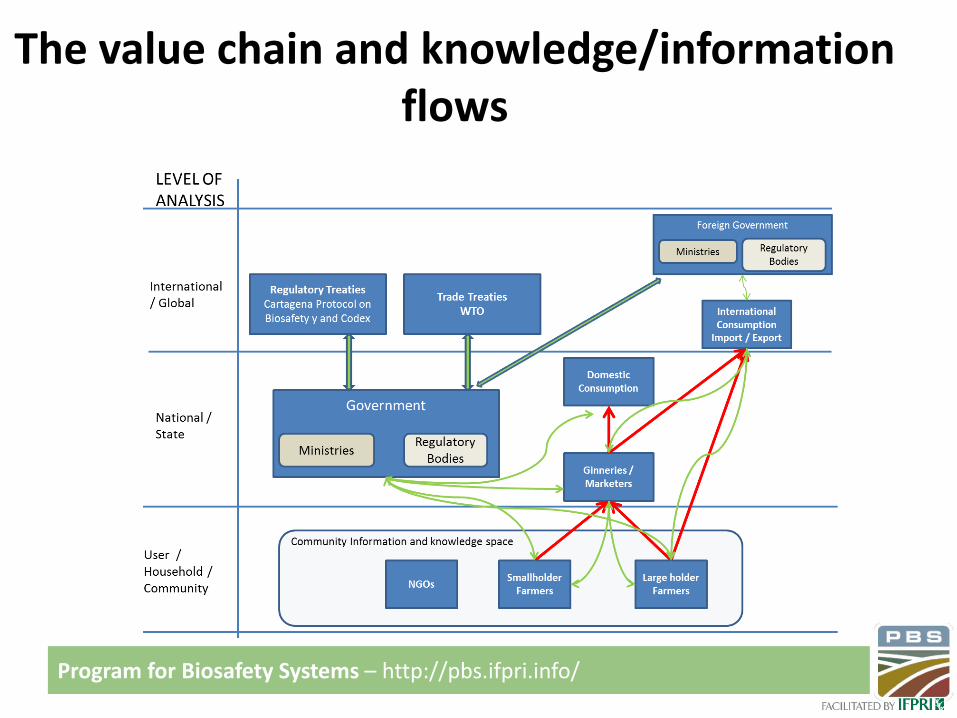
The value chain and knowledge/information flows
José Benjamin Falck-Zepeda, Ph.D.Senior Research Fellow / Leader Policy Team Program for
Biosafety SystemsIFPRI
2033 K Street NWWashington, DC 20006-1002
Brief bio/pubs: http://www.ifpri.org/staffprofile/jose-falck-zepedaBlog: http://socioeconomicbiosafety.wordpress.com/
Follow me on Twitter: @josefalck

The Green Revolution
• Transformation of agriculture during 1940s-1970s that lead to significant increases in yields
• Firmly based on:– Agricultural production needs to keep
pace with population growth
– Agricultural sciences philosophy of maximizing production per unit of land
– Plant breeding developments of the late 19th early 20th centuries
• Initially focused on a few crops (Wheat, rice, maize) but has been expanded
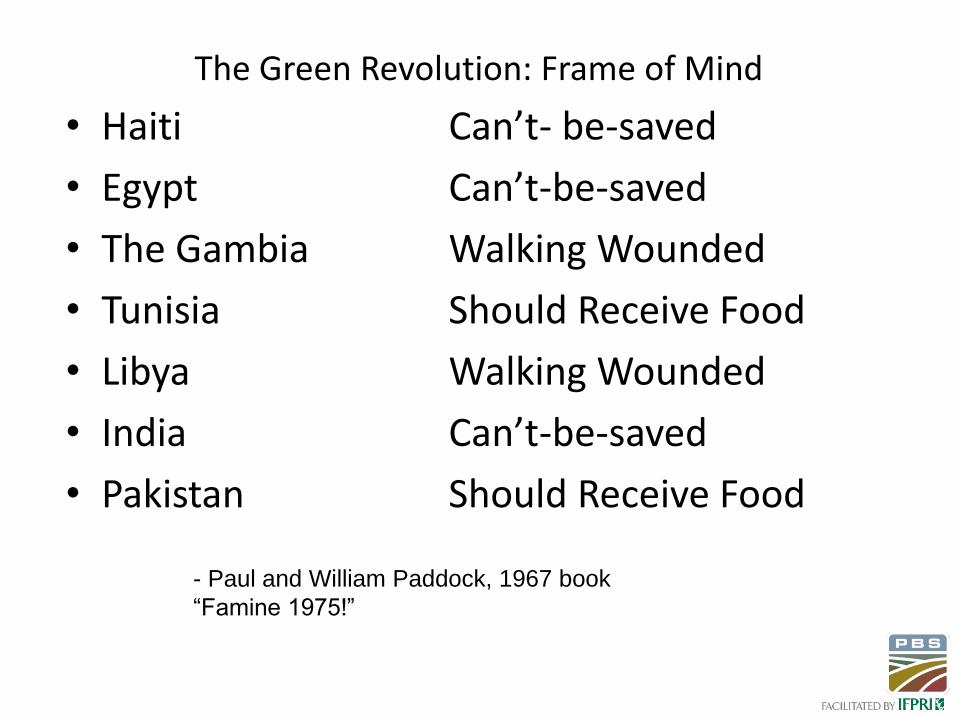
The Green Revolution: Frame of Mind
• Haiti Can’t- be-saved
• Egypt Can’t-be-saved
• The Gambia Walking Wounded
• Tunisia Should Receive Food
• Libya Walking Wounded
• India Can’t-be-saved
• Pakistan Should Receive Food
- Paul and William Paddock, 1967 book
“Famine 1975!”
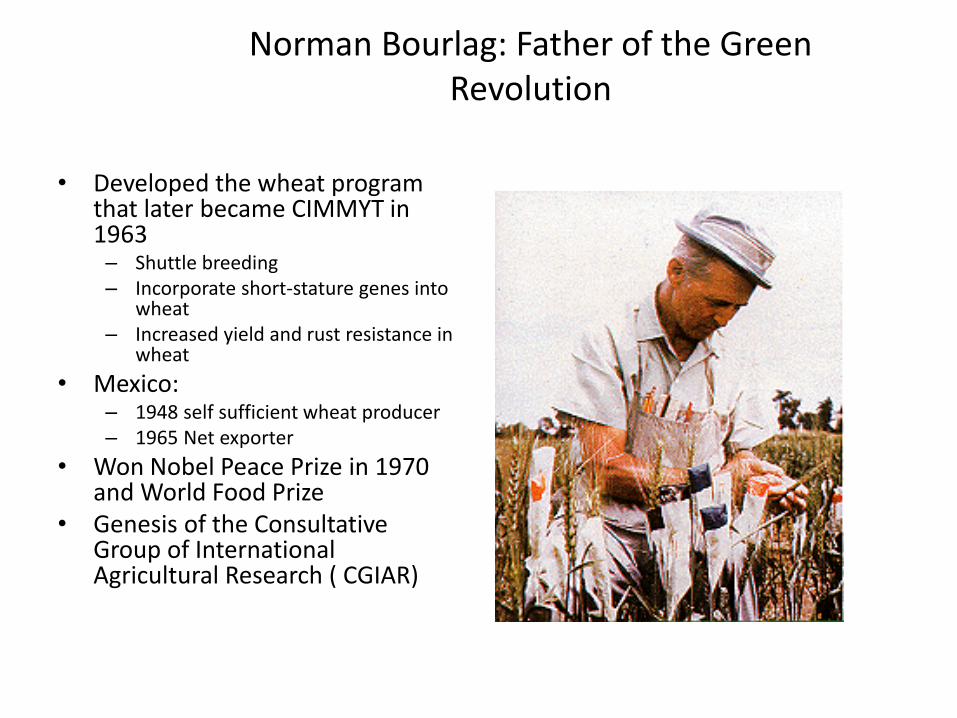
Norman Bourlag: Father of the Green Revolution
• Developed the wheat program that later became CIMMYT in 1963
– Shuttle breeding– Incorporate short-stature genes into
wheat– Increased yield and rust resistance in
wheat
• Mexico:– 1948 self sufficient wheat producer– 1965 Net exporter
• Won Nobel Peace Prize in 1970 and World Food Prize
• Genesis of the Consultative Group of International Agricultural Research ( CGIAR)
How was the Green Revolution possible? An agronomist perspective on a technological triumph as an engineering feat…
• Incorporation of a dwarfing genes from natural populations into wheat and rice
• In maize: more vertical orientation of leaves, reduces self-shading while allowing planting of narrower rows and thus increases in densities
• Plants bred to dedicate a larger share of photosynthesis efforts to grain rather than to stems and leaves– Harvest index of older varieties was 20% whereas HYV around 50-55%
• Relatively insensitive to day length – can be planted in a wider range of latitudes
• Increased responsiveness to fertilizer and water

Green Revolution: Successes
• Significant increases in yields and production– From 1950 to 1992, the world’s grain output rose from 692 million tons
produced on 1.70 billion acres of cropland to 1.9 billion tons on 1.73 billion acres
– India: food production increased from 50 to 205 million tons during the last 5 decades
– But, barely happened in Sub-Saharan Africa
• Economic output per hectare increases significantly
• 30% increase in cereal and calorie availability per person
• Poverty reductions—some studies show this is attributed to GR raising farmers incomes
Green Revolution: Social and Economic Criticisms
• Does not address underlying social, cultural, ethnical and institutional constraints that create vulnerability and thus affect livelihoods– Is hunger and food insecurity a question of production or unequal
distribution of resources?
• Increased mechanization affected rural labor employment• Debt effects and credit institutions necessary• Technology not scale neutral
– Uneven adoption as larger/wealthier farmers adopted first capturing larger share of benefits
• Landowner/Landholder displacement• Dependence on pesticides and fertilizers
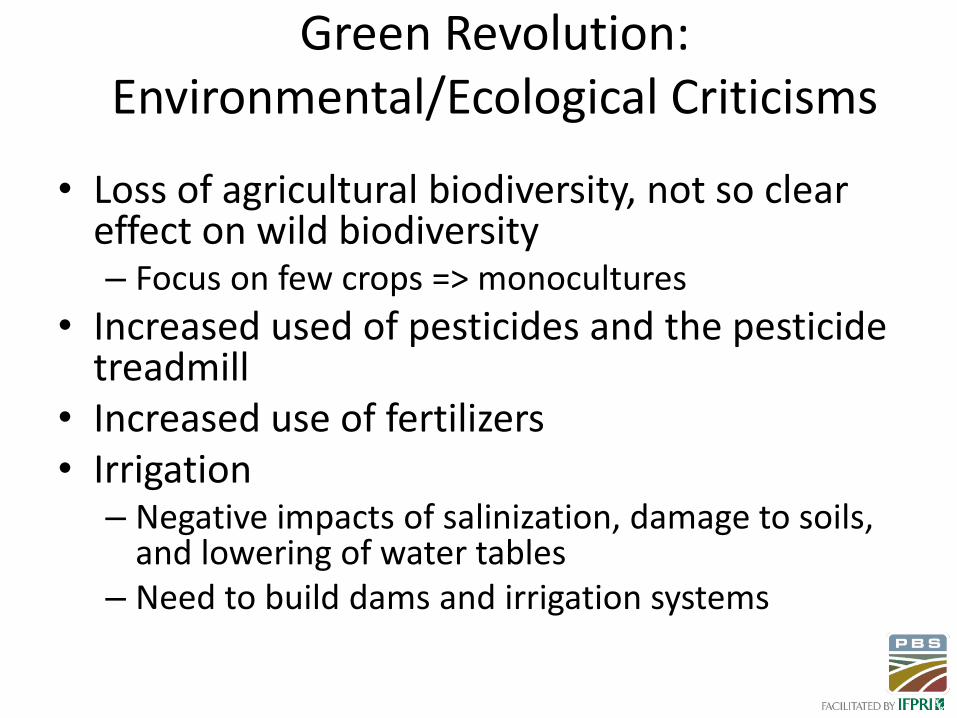
Green Revolution: Environmental/Ecological Criticisms
• Loss of agricultural biodiversity, not so clear effect on wild biodiversity– Focus on few crops => monocultures
• Increased used of pesticides and the pesticide treadmill
• Increased use of fertilizers• Irrigation
– Negative impacts of salinization, damage to soils, and lowering of water tables
– Need to build dams and irrigation systems
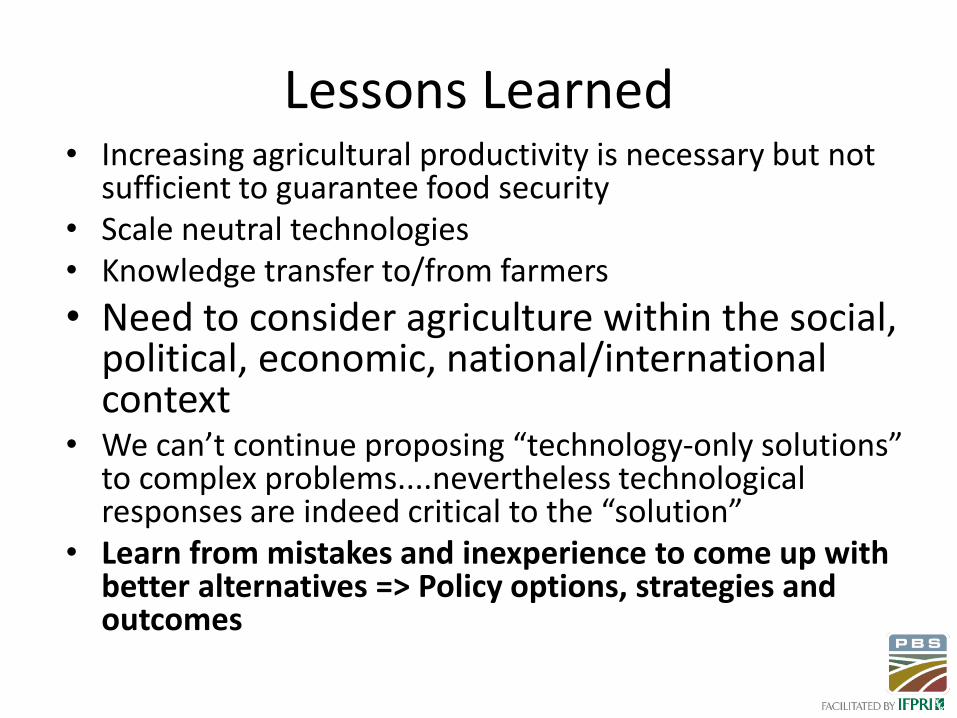
Lessons Learned• Increasing agricultural productivity is necessary but not
sufficient to guarantee food security• Scale neutral technologies• Knowledge transfer to/from farmers
• Need to consider agriculture within the social, political, economic, national/international context
• We can’t continue proposing “technology-only solutions” to complex problems....nevertheless technological responses are indeed critical to the “solution”
• Learn from mistakes and inexperience to come up with better alternatives => Policy options, strategies and outcomes
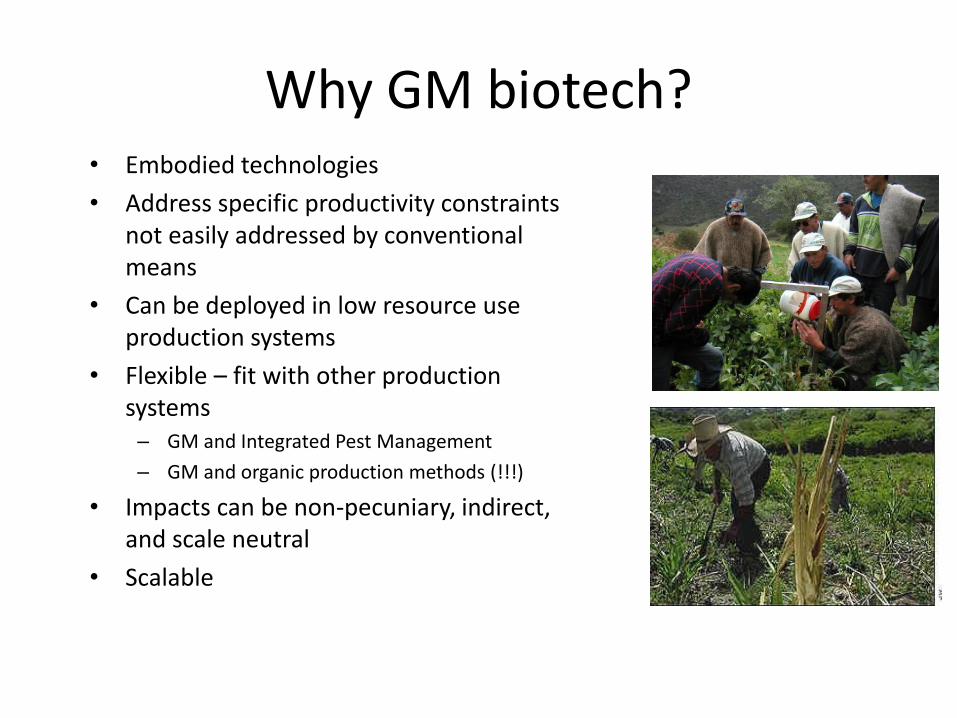
Why GM biotech?• Embodied technologies
• Address specific productivity constraints not easily addressed by conventional means
• Can be deployed in low resource use production systems
• Flexible – fit with other production systems
– GM and Integrated Pest Management
– GM and organic production methods (!!!)
• Impacts can be non-pecuniary, indirect, and scale neutral
• Scalable

Impacts on biodiversity• Which biodiversity?
Agricultural vs. Wild
• Agricultural biodiversity –intraspecific vs interspecific
• Tradeoffs between land use and the maintenance of the agricultural frontier and encroachment in protected and/or “wild” areas
• Biodiversity valuation issues and measuring taxonomic diversity and richness
• Ecosystem services
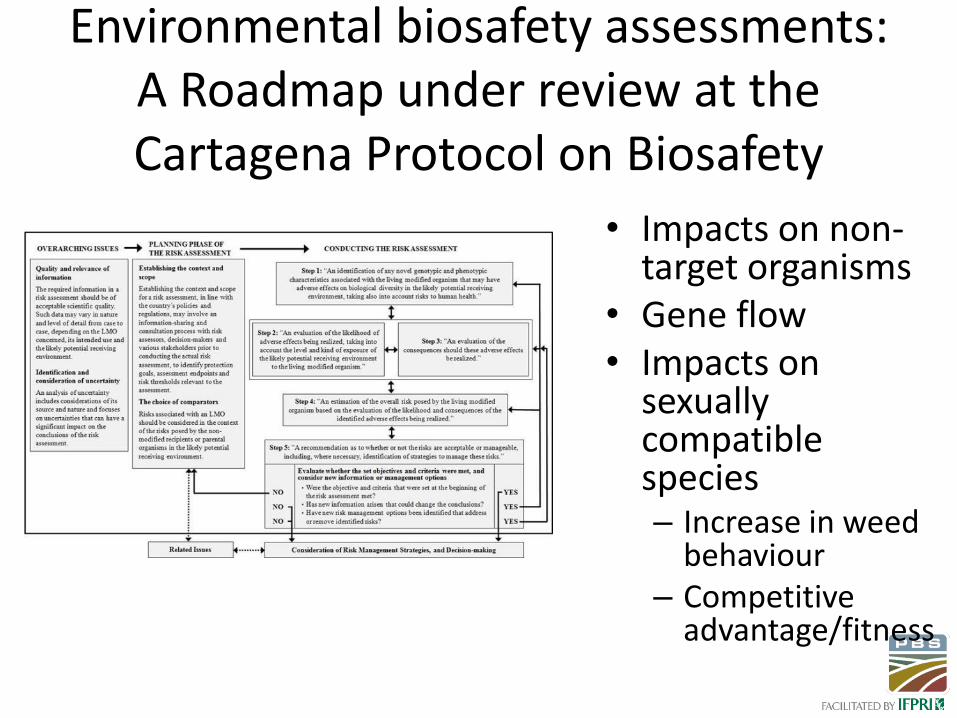
Environmental biosafety assessments: A Roadmap under review at the Cartagena Protocol on Biosafety
• Impacts on non-target organisms
• Gene flow• Impacts on
sexually compatible species– Increase in weed
behaviour– Competitive
advantage/fitness

How does a producer benefit? Insect resistance traitsThe case of Bt cotton
Producer Profit
Producer Surplus
Cost to Benefit
Additional
Cost of
Using the
Technology
Tech fee:
US$80/ha
0
+
-
Decrease
pesticide
application
cost
-Insecticide
-Machinery &
Equipment
Yield /
Reduction
in damage
-Timing
applications
-Reduced
damage bolls
Price change
due to increase
in supply
Additional
cost of
controlling
secondary
pests
Amenable to
IPM and/or
controlled
easily
Labor
Labor