Falck Zepeda Overview of Policy Issues SSA for the AfDB April 2011
Upload
jose-falck-zepedaCategory
view
32download
0
Program for Biosafety Systems – http://pbs.ifpri.info/
Introduction to socioeconomic considerations and biosafety
José Falck Zepeda
Senior Research Fellow
International Food Policy Research Institute –Program for Biosafety Systems (IFPRI - PBS)
Presented at Cornell Alliance for Science, Ithaca, NY October 26 2016.

Program for Biosafety Systems – http://pbs.ifpri.info/
Content
1. Methods and approaches
2. Practical case study on the potential adoption of Insect resistant cotton in Uganda
3. Practical considerations for SEC and decision making

Program for Biosafety Systems – http://pbs.ifpri.info/

Program for Biosafety Systems – http://pbs.ifpri.info/
Socioeconomic Assessments: A Definition
• Slight paraphrase of International Association of Impact Assessment (IAIA)“All the issues of interest to humans that may be affected by an intervention or natural phenomena following a line of causality, that is, from cause to effect. The characterization of socioeconomics considerations may include all the potential ways by which people and communities interact with their socio-cultural, economic and biophysical surroundings and the impact that such intervention or causal agent may have on them.”
• Simplified version (author to be revealed someday…)"Socioeconomic assessment can include examination of a variety of social
and economic factors with the objective to better understand the potential impacts of relevant interventions on people and communities."

SEC assessments can be done at different levels and for different cross-
cutting issues
• Gender and age
• Trade
• Labelling
• Cost of regulatory compliance
• Impact on innovation
• Policy impacts
National / Sub regional/
Global
Industry / sector
Community
Household
Farmer

Program for Biosafety Systems – http://pbs.ifpri.info/
Impact on Farmers / Household / Community: Potential issues for a socio-economic assessment
Value of biodiversity to indigenous communities
Value of biodiversity to individual farmers, households, and communities
Profits and benefit/cost ratios
Net income
Use of productive inputs (pesticides,…)
Production practices
Gender differentiated access and control, knowledge and/or attitudes
Health impacts
Safety first, downside risk, minimum production for survival
Irreversible costs and benefits
Freedom of choice and freedom to operate

Program for Biosafety Systems – http://pbs.ifpri.info/
Socio-economics and biosafety & biotechnology decision making
BEFORE RELEASE
An impact assessment during the regulatory evaluation stage to decide on the approval of a technology needs to be ex ante
AFTER RELEASE
For monitoring purposes or for standard technology evaluation purposes this is a conventional ex-postassessment

Program for Biosafety Systems – http://pbs.ifpri.info/
Ex ante – before release assessments
• Use secondary data from all available sources and/or limited primary data from existing producers to project potential gains from an intervention
• Multiple methods/approaches
– Cost/benefit
– Economic surplus
– Social impact assessment
– Value chain analysis
– Models and modelling

Program for Biosafety Systems – http://pbs.ifpri.info/
Ex post – after release assessment
• Use primary data collected from adopting and non-adopting producers– May use secondary data from existing surveys collected by other
researchers
• Multiple methods/approaches
• Adoption/impact studies issues– Statistical sampling and biases “the early adopting issues”
– Proper counterfactual and comparison to baseline approaches
– Multiple issues which may affect adoption unrelated to specific economic intervention
Program for Biosafety Systems – http://pbs.ifpri.info/
How does a producer benefit? Insect resistance traits
The case of Bt cotton
Producer Profit
Producer Surplus
Cost to Benefit
Additional
Cost of
Using the
Technology
Tech fee:
US$80/ha
0
+
-
Decrease
pesticide
application
cost
-Insecticide
-Machinery &
Equipment
Yield /
Reduction
in damage
-Timing
applications
-Reduced
damage bolls
Price change
due to increase
in supply
Additional
cost of
controlling
secondary
pests
Amenable to
IPM and/or
controlled
easily
Labor
Labor

Program for Biosafety Systems – http://pbs.ifpri.info/
How does a producer benefit?: Herbicide resistance traits
Herbicide resistant cotton
Additional
Cost of
Using the
Technology
Tech fee:
US$40/ha
0
+
-
(Small)
Increase
pesticide
application
cost
- Herbicide
-Machinery &
Equipment
Decrease
Yield
Small decrease,
no change or
a very
small increase
Price change
due to increase
in supply
The management
convenience factor
Allow use of
alternative production
technologies
- No-till low-till
Producer Profit
Producer Surplus
Cost to Benefit
Labor
Labor
Program for Biosafety Systems – http://pbs.ifpri.info/
2. Case study example:Genetically Modified Cotton
in Uganda: An Ex-ante Evaluation
Daniela Horna, Patricia Zambrano, Jose Falck-Zepeda, Theresa Sengooba,
Guillaume Gruere, Miriam Kyotalimye
Program for Biosafety Systems – http://pbs.ifpri.info/
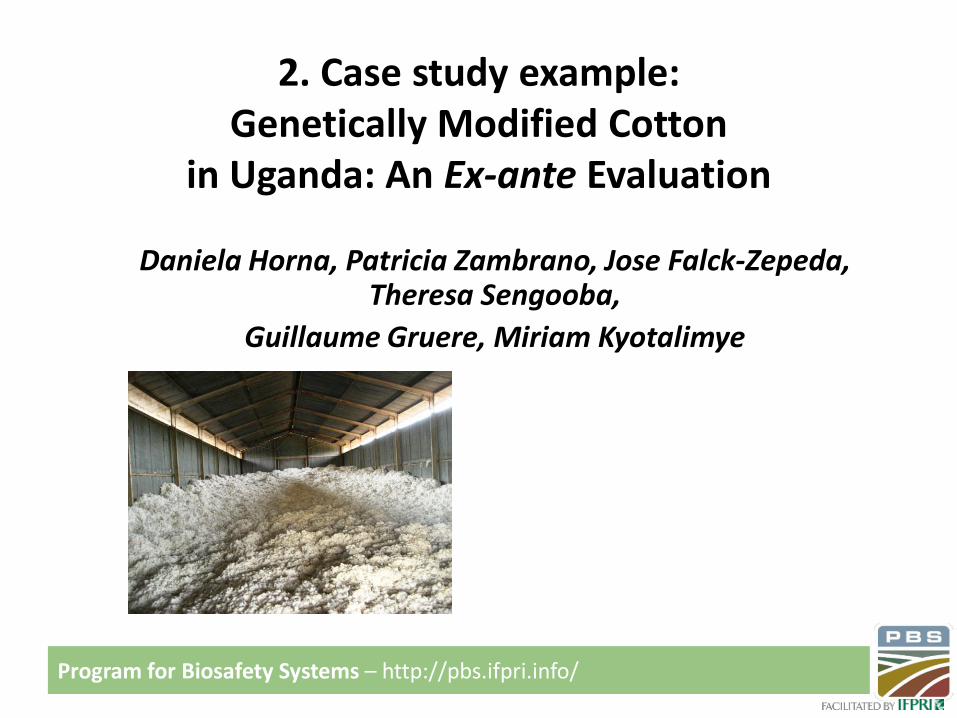
Cotton in Uganda
• Importance of cotton:
– Cotton produced by smallholders (250,000 hhs)
– 3rd agricultural commodity exported but 2 -5% of total exports
– Traditional crop
• Problems:
– Very low yields (~400 Kg/Ha), link
– Quality deteriorated despite 1 variety policy

Program for Biosafety Systems – http://pbs.ifpri.info/
Cotton Performance
0
1,000
2,000
3,000
4,000
5,000
6,000
0
50
100
150
200
250
300
19
61
19
64
19
67
19
70
19
73
19
76
19
79
19
82
19
85
19
88
19
91
19
94
19
97
20
00
20
03
20
06
Yie
lds
(Hg
/Ha)
Pro
du
ctio
n
(1,0
00
to
nn
es)
1 2 3 4 5
1Post-independence
2Idi Amin period
3Macro-economic reforms
4CDO
Liberali.
5Yield
increase
Source:
FAO
Stats

Program for Biosafety Systems – http://pbs.ifpri.info/
Organic Cotton
2000 / 01 1,642,458 54,996,904 3,066 102,200 3.0%
2001 / 02 1,734,187 63,898,025 3,406 126,148 2.7%
2002 / 03 1,203,753 57,563,429 2,407 114,619 2.1%
2003 / 04 2,030,465 84,344,870 3,626 160,000 2.3%
2004 / 05 2,979,969 130,854,714 5,321 254,000 2.1%
2005 / 06 1,499,030 51,847,138 2,677 102,000 2.6%
2006 / 07 7,377,333 68,681,469 13,174 134,000 9.8%
2007 / 08 13,766 66,500 20.7%
Source: CDO 2007 / 08

Program for Biosafety Systems – http://pbs.ifpri.info/
Cotton Production
3 4 12 274
694 768
1,536
2,190
53 149 489
813 1,285
2,082
7,403
41 80 204 563
1,528
3,058
4,235
1 6 21 624
840 1,216
77 96 114 345
6,786
3 3
702
1,358
10,087
-
2,000
4,000
6,000
8,000
10,000
12,000
Kay
un
ga
Jin
ja
May
uge
Bu
giri
Bu
sia
Kam
uli
Igan
ga
Toro
ro
Kab
eram
aido
Kat
akw
i
Soro
ti
Mb
ale
Siro
nko
Ku
mi
Pal
lisa
Gu
lu
Ko
tid
o
Pad
er
Kit
gum
Am
ora
tar
Lira
Ap
ac
Luw
ero
Kib
ale
Kib
oga
Nak
aso
ngo
la
Ho
ima
Mas
ind
i
Ad
jum
ani
Mo
yo
Yum
be
Aru
a
Neb
bi
Kan
ungu
Kye
njo
jo
Kam
wen
ge
Bu
shen
yi
Kas
ese
South Eastern North Eastern Northen Mid Western andCentral
West Nile Western
Seed
Co
tto
n P
rod
uct
ion
(1,0
00
Kg)

Program for Biosafety Systems – http://pbs.ifpri.info/
GM cotton
• Public interest to improve performance of cotton:
– Confined trials approved in 2008
• Goal: provide stakeholders and policy makers with tools to analyze and make decisions about the approval and adoption of GM cotton in Uganda

Program for Biosafety Systems – http://pbs.ifpri.info/
Farm
• Will cotton producers be better off with the adoption of GM seed?

Program for Biosafety Systems – http://pbs.ifpri.info/
Farm
• Source of Data:
– Household survey
– 151 producers, 35 in Lira and 116 in Kasese
– Expert opinions
• Method: Partial budget
– Real scenarios: traditional low input, higher use of inputs, organic production
– Simulated scenarios: conventional with GM
Program for Biosafety Systems – http://pbs.ifpri.info/
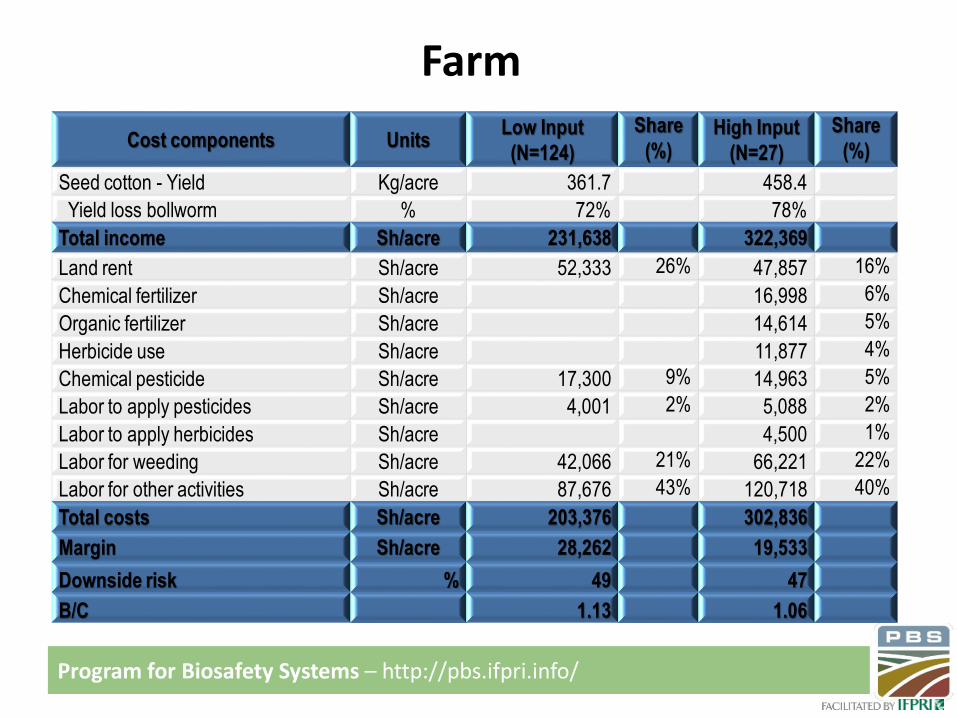
Farm
Cost components UnitsLow Input
(N=124)
Share
(%)High Input
(N=27)
Share
(%)
Seed cotton - Yield Kg/acre 361.7 458.4
Yield loss bollworm % 72% 78%
Total income Sh/acre 231,638 322,369
Land rent Sh/acre 52,333 26% 47,857 16%
Chemical fertilizer Sh/acre 16,998 6%
Organic fertilizer Sh/acre 14,614 5%
Herbicide use Sh/acre 11,877 4%
Chemical pesticide Sh/acre 17,300 9% 14,963 5%
Labor to apply pesticides Sh/acre 4,001 2% 5,088 2%
Labor to apply herbicides Sh/acre 4,500 1%
Labor for weeding Sh/acre 42,066 21% 66,221 22%
Labor for other activities Sh/acre 87,676 43% 120,718 40%
Total costs Sh/acre 203,376 302,836
Margin Sh/acre 28,262 19,533
Downside risk % 49 47
B/C 1.13 1.06
Program for Biosafety Systems – http://pbs.ifpri.info/
Farm
• Findings:
– Simulated scenarios using IR and HT varieties yield the highest returns, but profitability does not increase dramatically
– Yield variability is the main determinant of marginal benefits
– Need to pay attention to investment in fertilizers and good quality seed
Program for Biosafety Systems – http://pbs.ifpri.info/
Industry
• Research question– What are the benefits and risks associated with the adoption of
IR and HT cotton in Uganda?
• Method– Economic surplus, estimate the changes in benefits due to the
adoption of GM
– Scenarios: public and private delivery, without and with reduced technology fee, for IR only or staked gene technology
• Data sources– Household survey
– Experts’ opinion
– Secondary information

Program for Biosafety Systems – http://pbs.ifpri.info/
Model and Assumptions
• Small open economy model augmented to include stochastic parameters
• Use approach described by Alston, Norton and Pardey augmented to introduce risk considerations using simulation software
• Elements of best practice to gauge quality of evidence on existing studies

Program for Biosafety Systems – http://pbs.ifpri.info/
Assumptions – Distributions to consider uncertainty
Parameter Unit Value Distribution Description Source/Citation
Yield Seed cotton Kg / Ha 627
Normal distribution with mean 627 kg/ha and standard deviation of 375 kg/ha.
Mean and standard deviations estimated from IFPRI survey
Producer Price US$ / Kg
0.188
Triangular distribution with values maximum=0.38, most likely= 0.26, minimum=0.06
The maximum value for the triangular distribution is the average of all observations. The most likely is the
Elasticity supply (Es)
0.91
Triangular distribution with minimum= 0.3, most likely=1 and maximum =1.5.
Minot and Daniels 2005; Dercon 1993, Delgado and Minot 2000, Alston, Norton and Pardey, 1995
Cost reduction/change due to GM (pesticides - spraying)
% 13%
Triangular distribution with minimum =-6, most likely=3, maximum=16
Mean and maximum values are estimated from IFPRI survey. Minimum value is an estimate average control cost for lepidoptera relative to total costs in the IFPRI survey.
Percent yield difference (%)
% 23%
Logistic distribution with α= 0.0939, β= 0.168, truncated at -10% and 74%
Estimated using @Risk application from IFPRI survey estimates for the costs control of lepidopterans. Truncation is the maximum yield estimate from IFPRI survey
Change(reduction) in glyphosate applications
#
Uniform distribution with values between 1 and 2 applications
Change in cost of herbicide relative to total cost
%
Multiply the change(reduction) in glyphosate applications times the average cost
Change in weeding costs from the use of herbicide
%
Assume that 1 application of herbicide glyphosate substitutes for 3 manual weeding
Technology fee GM (US$/ha)
Triangular distribution with minimum = 15, most likely=32, maximum=56
Falck-Zepeda et al., 2000; Huang et al., 2003; Bennett et al., 2004; Huang et al., 2004
Reduced technology fee (US$/ha)
Triangular distribution with minimum =5, most likely =11.44, maximum = 18.66
Falck-Zepeda et al., 2000; Huang et al., 2003; Bennett et al., 2004; Huang et al., 2004
Program for Biosafety Systems – http://pbs.ifpri.info/
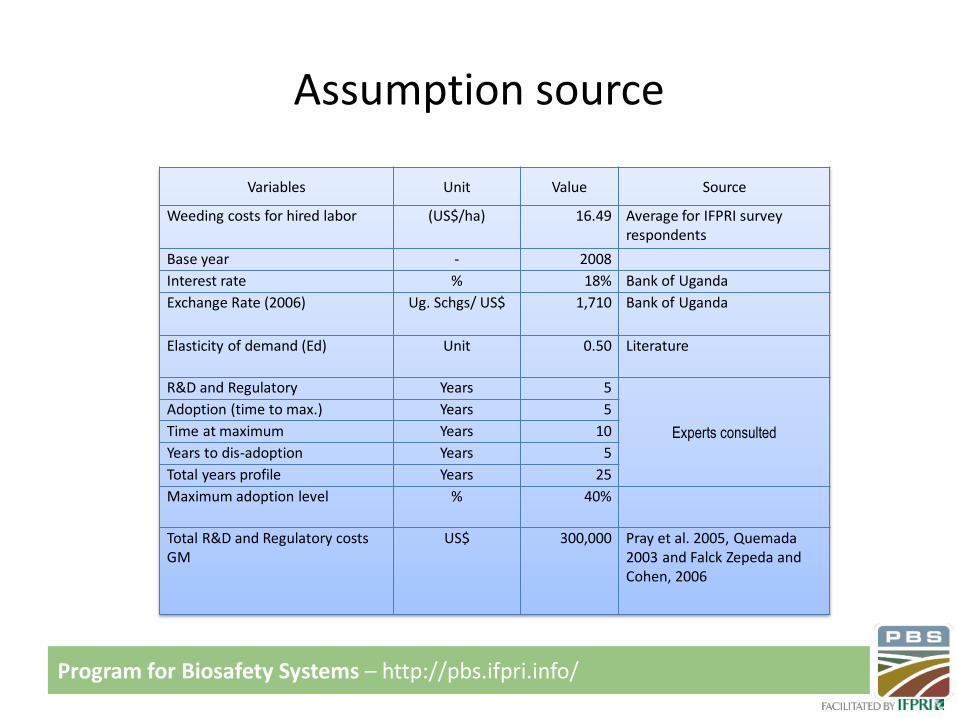
Assumption source
Variables Unit Value Source
Weeding costs for hired labor (US$/ha) 16.49 Average for IFPRI survey respondents
Base year - 2008
Interest rate % 18% Bank of Uganda
Exchange Rate (2006) Ug. Schgs/ US$ 1,710 Bank of Uganda
Elasticity of demand (Ed) Unit 0.50 Literature
R&D and Regulatory Years 5
Experts consulted
Adoption (time to max.) Years 5
Time at maximum Years 10
Years to dis-adoption Years 5
Total years profile Years 25
Maximum adoption level % 40%
Total R&D and Regulatory costs GM
US$ 300,000 Pray et al. 2005, Quemada 2003 and Falck Zepeda and Cohen, 2006

Program for Biosafety Systems – http://pbs.ifpri.info/
Economic Surplus Estimates
Scenarios Description NPV Total benefits IRR
Scenario I Public sector release 6,804,135 64,997,970 81%
Scenario II Include tech fee 1,533,175 15,989,645 54%
Scenario III Include tech fee (reduced to 1/3 global levels) 4,121,746 39,961,923 68%
Scenario IV Include herbicide management and tech fee 1,821,044 18,626,829 56%
Scenario V Include herbicide management and reduced tech fee 7,473,349 71,299,556 83%
Scenario VI Double area and maximum adoption rate 34,104,934 319,700,453 129%
Higher seed prices Higher areas cultivated
Herbicide management Higher adoption rates
Program for Biosafety Systems – http://pbs.ifpri.info/
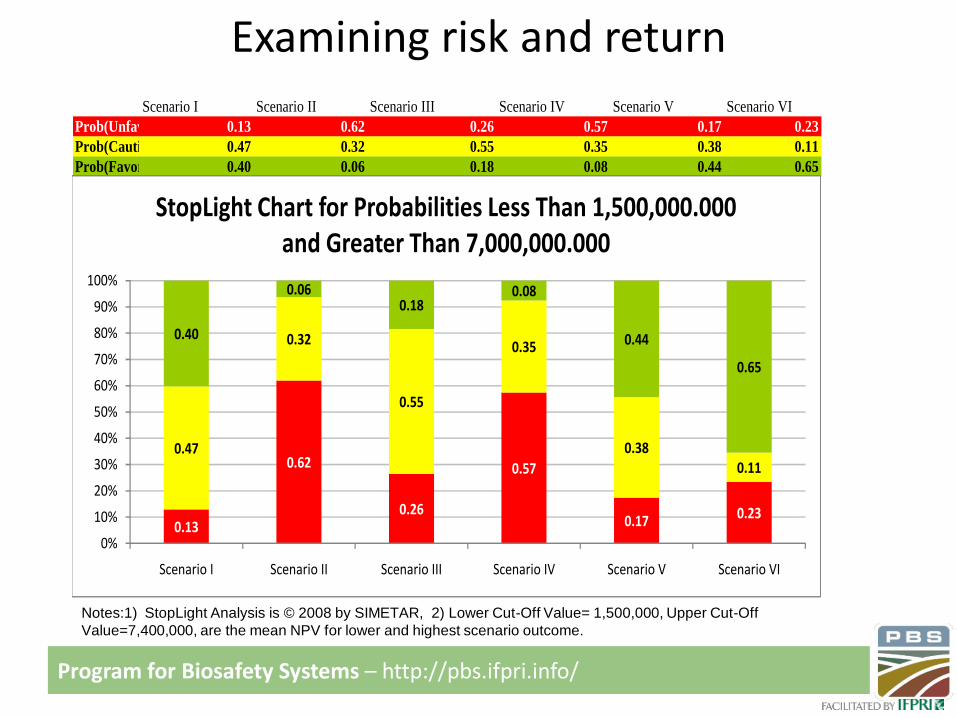
Examining risk and return
Scenario I Scenario II Scenario III Scenario IV Scenario V Scenario VI
Prob(Unfavorable) 0.13 0.62 0.26 0.57 0.17 0.23
Prob(Cautionary) 0.47 0.32 0.55 0.35 0.38 0.11
Prob(Favorable) 0.40 0.06 0.18 0.08 0.44 0.65
StopLight Chart for Probabilities Less Than 1,500,000.000 and Greater Than 7,000,000.000
0.13
0.62
0.26
0.57
0.17 0.23
0.47
0.32
0.55
0.35
0.380.11
0.40
0.060.18
0.08
0.44
0.65
0%
10%
20%
30%
40%
50%
60%
70%
80%
90%
100%
Scenario I Scenario II Scenario III Scenario IV Scenario V Scenario VI
StopLight Chart for Probabilities Less Than 1,500,000.000 and Greater Than 7,000,000.000
Notes:1) StopLight Analysis is © 2008 by SIMETAR, 2) Lower Cut-Off Value= 1,500,000, Upper Cut-Off
Value=7,400,000, are the mean NPV for lower and highest scenario outcome.

Program for Biosafety Systems – http://pbs.ifpri.info/
Industry
• Findings
– Uganda can gain from the introduction of GM cotton but rates of return estimated are not as high as other results for agricultural research
– Low yields due to low input use have a critical role in explaining benefits generated by GM adoption
– The probability of a negative rate of return could be as high as 38% in the case of paying full technology fee (same as the rest of the world.• Uganda has to negotiate the technology fee!!!
Program for Biosafety Systems – http://pbs.ifpri.info/
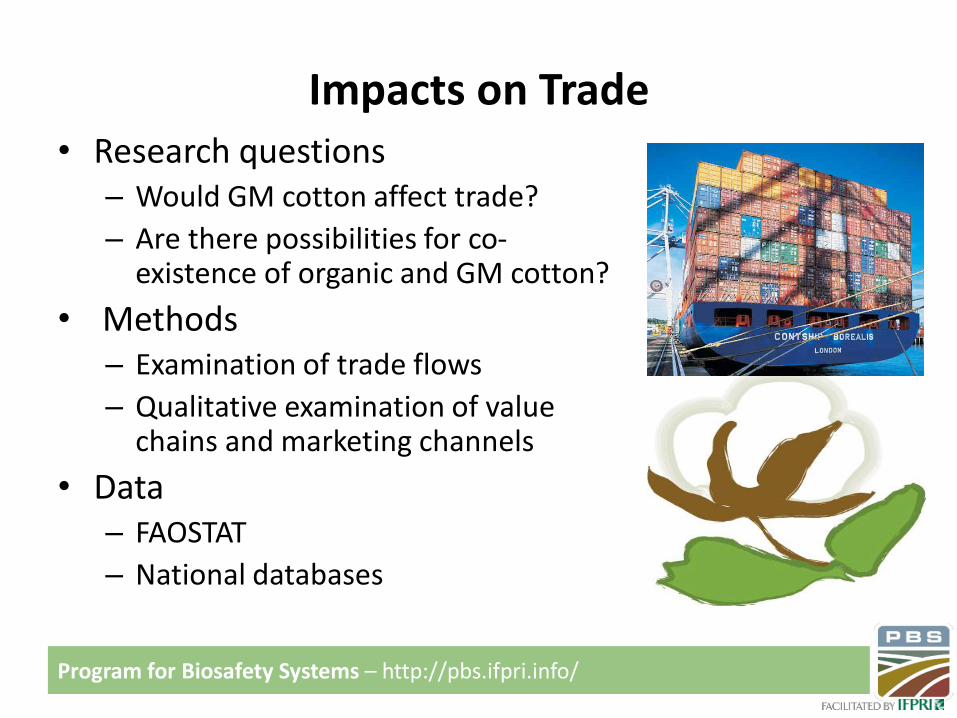
Impacts on Trade• Research questions
– Would GM cotton affect trade?
– Are there possibilities for co-existence of organic and GM cotton?
• Methods– Examination of trade flows
– Qualitative examination of value chains and marketing channels
• Data– FAOSTAT
– National databases
Program for Biosafety Systems – http://pbs.ifpri.info/
Impacts on Trade - Findings
• GM cotton is not a risk to exports of conventional cotton but potentially to organic exports
• Coexistence of both systems is possible if seed mixing is avoided
• Discuss seed marketing strategies beforeintroduction of GM cotton

Program for Biosafety Systems – http://pbs.ifpri.info/
Institutions
• Research question– How has and will the current
institutional setting affect the approval and adoption of GM cotton?
• Method:– Based on consultation with
experts– Used of social networks tool
(NetMap)
• Examined three stages of the process: – approval of confined trials– approval of the Biosafety Bill– adoption of GM seed by farmers

Program for Biosafety Systems – http://pbs.ifpri.info/
Institutions - Findings
• Despite some bottlenecks, the regulatory process is leading to the commercial approval of GM cotton
• Need to look beyond the regulatory process and focus on how to facilitate adoption
– technology delivery, multiplication
– extension
– credit

Program for Biosafety Systems – http://pbs.ifpri.info/
Conclusions
• GM cotton: – Can be a risk management tool to reduce downside risk for
farmers
– has the potential to improve cotton productivity
• But, there is a need to facilitate farmers’ access to complementary inputs (such as fertilizer, herbicides) and to seed
• Policy makers need to discuss:– Technology delivery
– Technology fee
– Seed marketing strategies

Program for Biosafety Systems – http://pbs.ifpri.info/
What determines whether farmers gain or lose from Bt/HT cotton?
• Price of the technology and of output (fiber and seed)
• Pest infestation and pest dynamics (including secondary pests)
• Use of appropriate germplasm and the ability to have the most appropriate germplasm over time and location – gene technology without the appropriate germplasm is
useless
• Information about use of the technology

Program for Biosafety Systems – http://pbs.ifpri.info/
What determines whether farmers gain or lose from Bt/HT cotton?
• Type of input and output economic markets (monopoly Vs. competitive)
• Institutional issues– contractual agreements and obligations
– vertical integration and the value chain
• Input use and management
• Existing production and financial risk profile and situation
• Credit and other financial characteristics of the producer unit
Program for Biosafety Systems – http://pbs.ifpri.info/
Elements of best practice – a checklist
• Assumptions and their sources listed
• Sensitivity analysis on assumptions conducted
• Sampling and analysis methods described
– Number of samples used
– Proper counterfactual /baseline described
– Sampling method used
• Consideration of statistical and sampling biases and issue of outliers

Program for Biosafety Systems – http://pbs.ifpri.info/
3. Practical considerations and implications for implementation
Photos: KARI –Kenya glasshouse, KARI-Thika confined field trial of Bt cotton, IRRI conventional rice trials Los Baños, Philippines

Program for Biosafety Systems – http://pbs.ifpri.info/
• Drivers
– International agreements
– Regional considerations
– National laws and regulations
• National Biosafety Frameworks
• Implementing regulations, directives, administrative acts
– Stakeholder interests
• Desire of a number of countries to understand the impacts of regulated technologies
• An alternative to contribute to the protection of producers and consumers ... but, is this the best option?
What drives socioeconomics inclusion in decision making?

Program for Biosafety Systems – http://pbs.ifpri.info/
SEC and regulatory design issues
Issues Options
Type of inclusion? • No inclusion vs. Mandatory vs. Voluntary
What? • Issues for review
Who? • Developer vs. dedicated government unit vs. third party experts
Scope? • Narrow interpretation article 26.1 • Narrow set of socio-economic issues • Broader set of assessments (SIA or SL)
Approach? • Concurrent but separate vs. Sequential vs. Embedded• Implementation entity
Assessment trigger? • Each submission vs. Event-by-event vs. class of events
When? • Laboratory/greenhouse vs. CFTs vs. Commercialization• For post release monitoring
How? • Will the assessment require a de novo study? • Choice of methods limited• Decision making rules and standards• Method integration, standards, tolerance to errors
Program for Biosafety Systems – http://pbs.ifpri.info/
Implementation options
– Inclusion only for commercialization
– Statement of no significant impact can undergo expedited process
– For other purposes than commercialization focus on broad impacts of biotechnology and technology in society rather than on an event basis
– Also consider doing by class of events (i.e. insect resistance or herbicide tolerance) while focusing on specific differences a event may have with respect to other events of the same class
Program for Biosafety Systems – http://pbs.ifpri.info/
Potential implications from SEC inclusion into decision making
• Gain more and/or better information about technology impacts for decision making - may support valuable technologies
• Balance gains in information, additional costs & effort, and impacts on innovation
• Potential for introducing uncertainty that can lead to an unworkable system if rules and standards are not clear

Program for Biosafety Systems – http://pbs.ifpri.info/
Potential implications from SEC inclusion into decision making
• Cost of compliance costs will increase
• Potential regulatory delays
– Reduction in the number of technologies especially those released by the public sector and crops/traits of a public good nature
– Some public sector institutions may not be able to deploy technologies due to fixed costs necessary to enter market
Program for Biosafety Systems – http://pbs.ifpri.info/
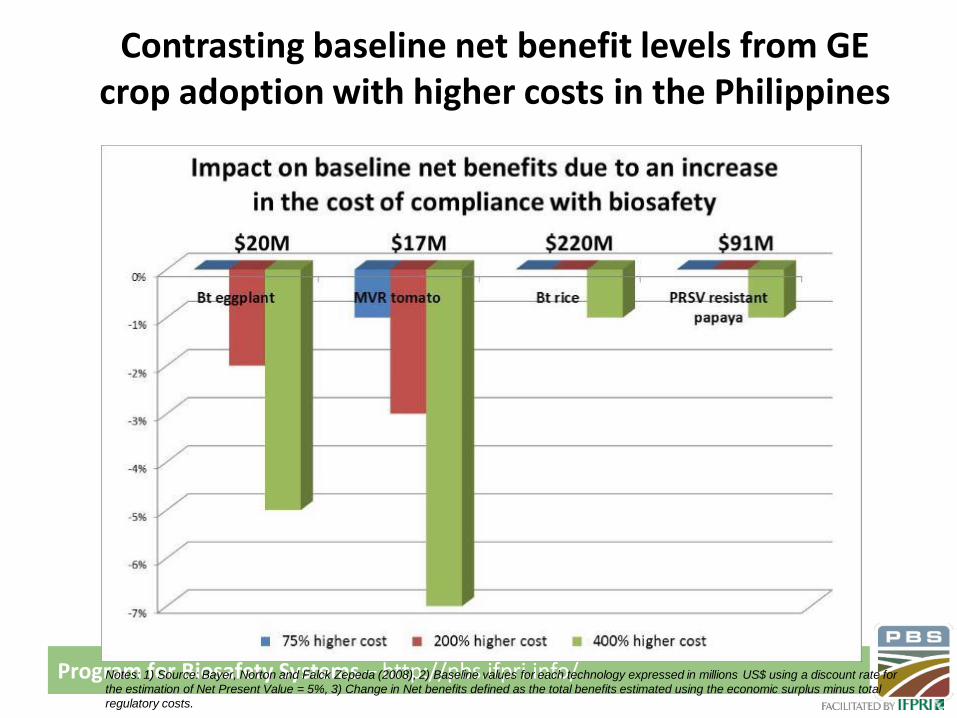
Contrasting baseline net benefit levels from GE crop adoption with higher costs in the Philippines
Notes: 1) Source: Bayer, Norton and Falck Zepeda (2008), 2) Baseline values for each technology expressed in millions US$ using a discount rate for
the estimation of Net Present Value = 5%, 3) Change in Net benefits defined as the total benefits estimated using the economic surplus minus total
regulatory costs.

Program for Biosafety Systems – http://pbs.ifpri.info/
Contrasting benefit levels from GE crop adoption with larger regulatory lags in the Philippines
Notes: 1) Source: Bayer, Norton and Falck Zepeda (2008), 2) Baseline values for each technology expressed in millions US$ using a discount rate for
the estimation of Net Present Value = 5%, 3) Change in Net benefits defined as the total benefits estimated using the economic surplus minus total
regulatory costs.
Program for Biosafety Systems – http://pbs.ifpri.info/
Biotechnology and Biosafety Rapid Assessment and Policy Platform (BioRAPP)
• A new project at IFPRI-PBS funded by the Gates Foundation
• Why BioRAPP?
– Policy and decision makers are likely to be confronted with economic and environmental questions that require a local evidence-based answer
– International evaluations may exist to draw some answers, but there is typically scant national evidence and capacity to efficiently and timely respond to these questions

Program for Biosafety Systems – http://pbs.ifpri.info/
The need for local “before release” economic assessments
• Addressing specific GM crops in the pipeline
• Developed and implemented by local experts
• Answering specific questions posed by policy and decision makers
• Timely manner
• Backed by IFPRI/PBS expertise
• In support of ongoing policy reform efforts
IFPRI Milo Mitchel

Program for Biosafety Systems – http://pbs.ifpri.info/
BioRAPPTwo distinct components working to achieve a goal
Program for Biosafety Systems – http://pbs.ifpri.info/
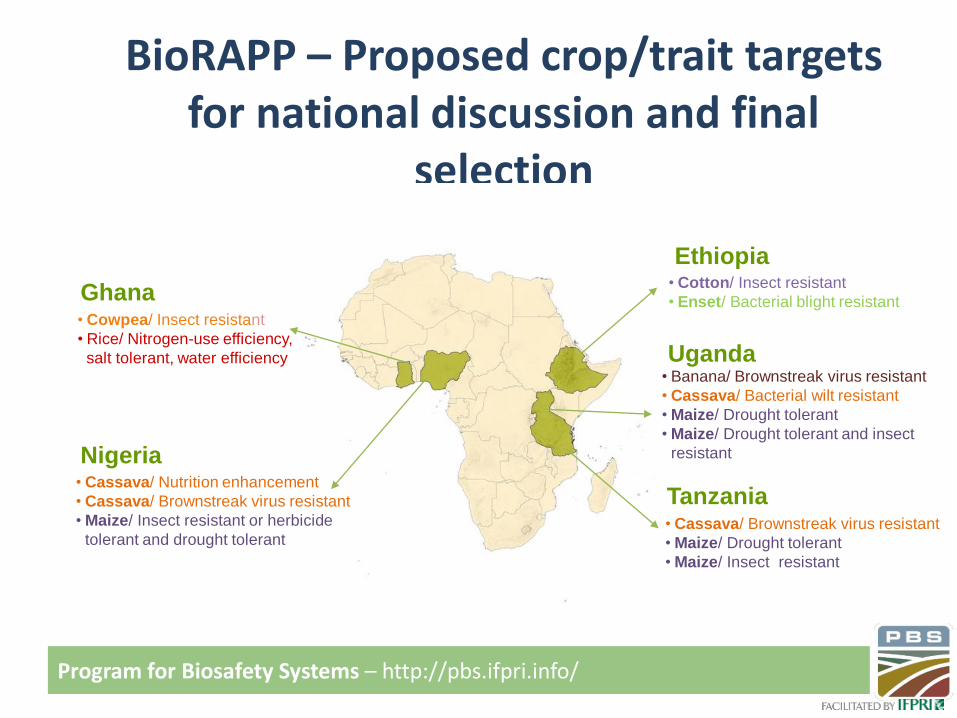
BioRAPP – Proposed crop/trait targets for national discussion and final
selection
• Cotton/ Insect resistant
• Enset/ Bacterial blight resistant• Cowpea/ Insect resistant
• Rice/ Nitrogen-use efficiency,
salt tolerant, water efficiency
• Cassava/ Nutrition enhancement
• Cassava/ Brownstreak virus resistant
• Maize/ Insect resistant or herbicide
tolerant and drought tolerant• Cassava/ Brownstreak virus resistant
• Maize/ Drought tolerant
• Maize/ Insect resistant
• Banana/ Brownstreak virus resistant
• Cassava/ Bacterial wilt resistant
• Maize/ Drought tolerant
• Maize/ Drought tolerant and insect
resistant
Ghana
Nigeria
Ethiopia
Uganda
Tanzania
José Benjamin Falck-Zepeda, Ph.D.Senior Research Fellow
IFPRI 2033 K Street NW
Washington, DC 20006-1002USA
[email protected] bio/pubs:
http://www.ifpri.org/staffprofile/jose-falck-zepeda
Blog: http://socioeconomicbiosafety.wordpress.com/
Follow me on Twitter: @josefalck