January 2021 - ESCO Technologies Inc.
48
January 2021
Transcript of January 2021 - ESCO Technologies Inc.

January 2021

2
Forward Looking Statement
Statements regarding the future impacts of and the Company’s response to COVID-19, the Company's results, revenue
growth, cash generation, the strength of the Company’s end markets, the success of acquisition efforts, the ability of the
Company to expand globally, performance improvements, increases in shareholder value, investments, the timing of
sales, cost reductions, increase in the demand for electricity, increase in new wind capacity, predicted growth drivers, the
expected size and timing of the SLS program, the Virginia and Columbia Class submarines, the success of product
development and related launch efforts, and other statements contained herein which are not strictly historical are
considered “forward-looking” statements within the meaning of the safe harbor provisions of the federal securities
laws. Investors are cautioned that such statements are only predictions, and speak only as of the date of this presentation
and the Company undertakes no duty to update. The Company’s actual results in the future may differ materially from
those projected in the forward-looking statements due to risks and uncertainties that exist in the Company’s operations
and business environment including, but not limited to: the risk factors described in Item 1A of the Company’s Annual
Report on Form 10-K for the fiscal year ended September 30, 2020; the duration and impacts of COVID-19 including
without limitation to the Company’s workforce, its customers, its suppliers, and its end markets; global economic
conditions impacting commercial aerospace; defense budgets; the availability of select acquisitions on acceptable terms;
the success of profit improvement actions; weakening of economic conditions in served markets; shortages of critical
components; changes in customer demands or customer insolvencies; competition; intellectual property rights;
containment of engineering and development costs; the performance of the Company’s international operations; increased
tensions between the US and China resulting in the imposition of sanctions or other actions; unforeseen charges
impacting corporate operating expenses; technical difficulties; delivery delays or defaults by customers or suppliers;
termination for convenience of customer contracts; timing and magnitude of future contract awards; performance issues
with key suppliers and subcontractors; labor disputes; material changes in the costs of or tariffs imposed upon certain raw
materials; the impacts of natural disasters; changes in laws and regulations including changes in accounting standards
and taxation requirements; costs relating to environmental matters arising from current facilities, former facilities, and their
related operations; uncertainty regarding the ultimate resolution of current disputes, claims, and litigation; and the
Company’s successful integration of newly acquired businesses.

3
> The COVID-19 global pandemic has created significant and unprecedented challenges
> Our primary focus is on the health and safety of our employees and we have implemented actions
to ensure our employees around the world have the necessary personal safety and protection
measures in place
> Our businesses are deemed essential - we remain operational and continue to supply our
customers with vital and necessary products
> The strength and resilience of our business model continues to support our long-term outlook
• Diverse portfolio of strong, durable businesses serving a wide-range of non-discretionary end-markets
• Market leadership positions in various niche markets with unique and highly technical products and solutions
specifically designed to meet our customers’ needs
> Our experienced leadership team has managed through multiple downturns in the past and has
implemented decisive actions to address the COVID crisis
> Despite the economic headwinds, we delivered stable revenue and profitability, increased backlog,
and record cash flow from operations in FY’20
> We have a strong Balance Sheet and significant Financial Liquidity to manage through this crisis
• $728 million of Liquidity / $50 million in Cash / Net Debt of ~$10 million / Leverage Ratio of 0.47x (9/30/20)
• No debt maturities or repayment obligations until September 2024
> Commitment to our local communities
• ESCO Technologies and the ESCO Technologies Foundation together gave $110,000 to support COVID relief
efforts in the communities where we have operations in FY’20
COVID-19 Response

4
30 years after spin-off, ESCO today…
> Our Aerospace & Defense (A&D) companies provide highly-engineered
products and solutions to the aerospace, space, and navy markets.
> Our Utility Solutions Group (USG) develops, manufactures and delivers
innovative solutions through diagnostic instruments, software and services
for the benefit of industrial power users and the electric utility and renewable
energy industries.
> Our RF Shielding and Test (Test) business is the industry leader in
providing innovative chambers, components, and test and measurement
systems which detect, measure and manage magnetic, electromagnetic and
acoustic energy for test facilities, MRI rooms, data centers and other
applications.
> On December 31, 2019, we completed the sale of our Technical Packaging
business segment to Sonoco Products Company. The transaction resulted in
the receipt of gross cash proceeds of $191 million.
5
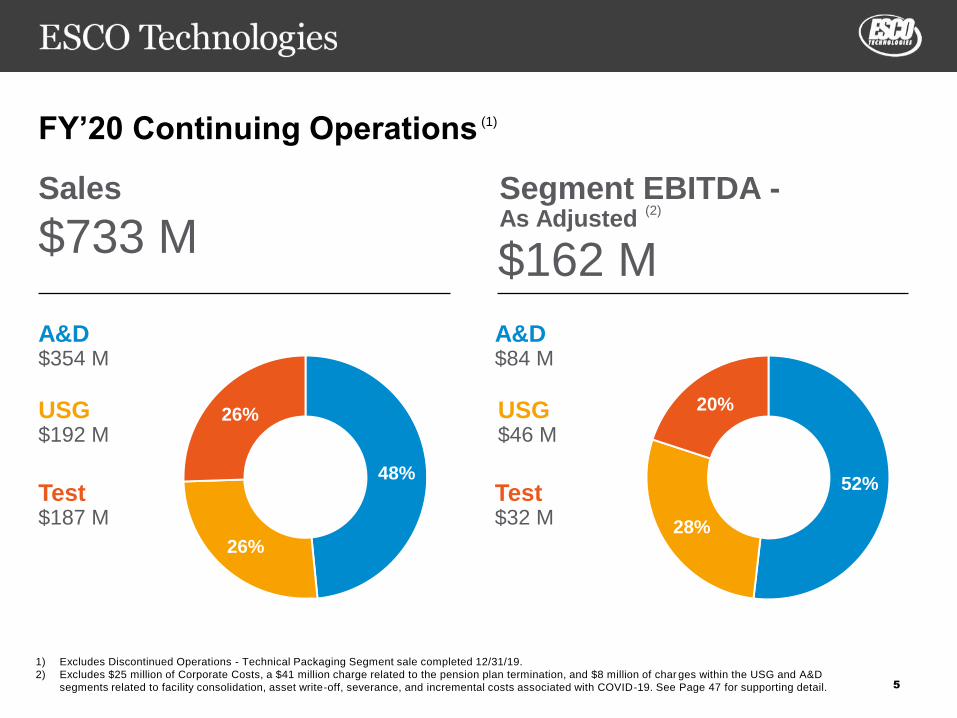
FY’20 Continuing Operations
Sales Segment EBITDA -As Adjusted
(1)
(2)
A&D$354 M
USG$192 M
Test$187 M
1) Excludes Discontinued Operations - Technical Packaging Segment sale completed 12/31/19.
2) Excludes $25 million of Corporate Costs, a $41 million charge related to the pension plan termination, and $8 million of char ges within the USG and A&D
segments related to facility consolidation, asset write-off, severance, and incremental costs associated with COVID-19. See Page 47 for supporting detail.
48%
26%
26%
$733 M$162 M
A&D$84 M
USG$46 M
Test$32 M
52%
28%
20%
6
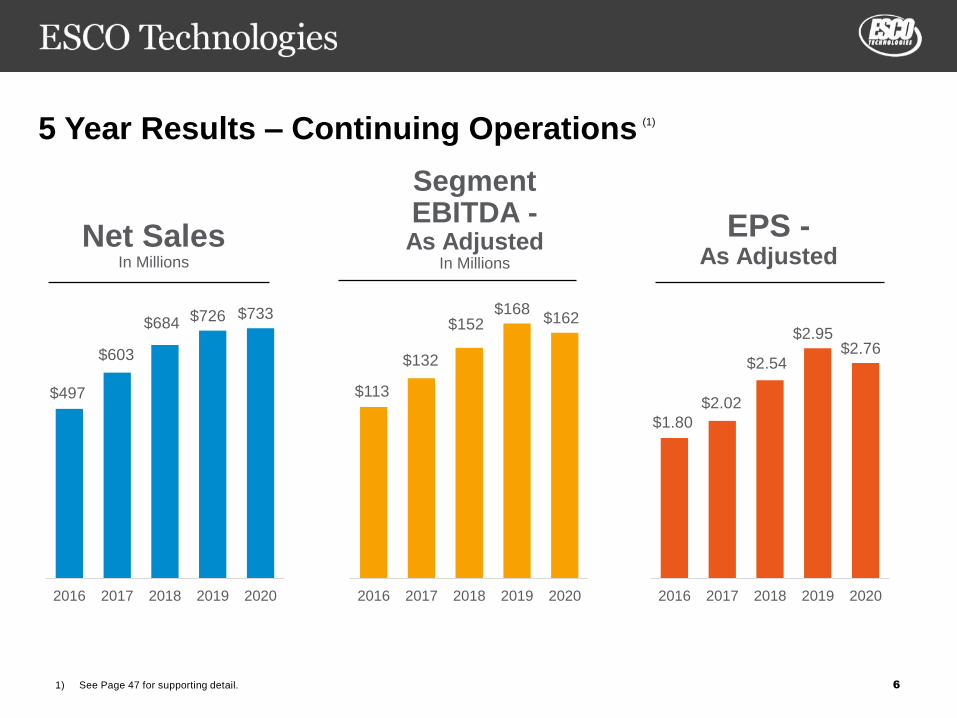
5 Year Results – Continuing Operations
Net Sales In Millions
Segment EBITDA -As Adjusted
In Millions
EPS -As Adjusted
$497
$603
$684 $726 $733
2016 2017 2018 2019 2020
(1)
1) See Page 47 for supporting detail.
$113
$132
$152$168
$162
2016 2017 2018 2019 2020
$1.80
$2.02
$2.54
$2.95$2.76
2016 2017 2018 2019 2020
7
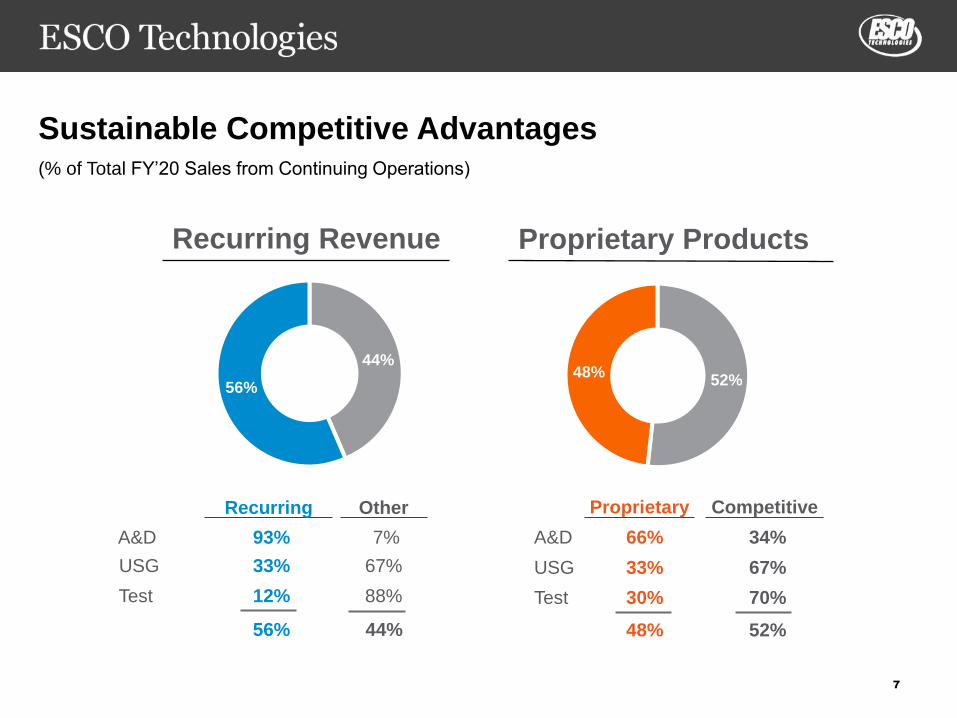
Sustainable Competitive Advantages
Recurring Other
A&D 93% 7%
USG 33% 67%
Test 12% 88%
56% 44%
Proprietary Competitive
A&D 66% 34%
USG 33% 67%
Test 30% 70%
48% 52%
Recurring Revenue
44%
56% 52%48%
(% of Total FY’20 Sales from Continuing Operations)
Proprietary Products

8
ESCO Defined
ESCO is a global provider of highly-engineered products and solutions
serving diverse and growing end-markets
> Shared characteristics
• Technology driven products and services
• Market leader across several niche markets
• Deep and broad engineering and operating expertise
• Highly automated manufacturing processes

9
ESCO At A Glance
> Multi-segment platform provides diversification and lower risk
> History of consistent and predictable revenue growth
• Organic – continued innovation and expansion of highly engineered products
and solutions
• M&A – Acquisitions have expanded product offerings and end markets
> Focus on cost reduction initiatives to drive margin expansion
> Capital Investment to expand product offerings, improve
operating efficiency, and enhance competitiveness
> Strong Balance Sheet which supports growth
> Strong Cash Generating Capabilities
> ROIC Focus – Management and Shareholder interests aligned
10
ESCO – Investor Fundamentals
> History of Stable and Profitable Growth – 4 Year CAGR
• Sales 10% / Earnings 11% / Backlog 14% (Continuing Operations)
> Identifiable and Tangible Sources of Earnings Growth
• A&D – Acquisitions and NPD Continue to Expand Product Offerings
• USG – Expanded Product Offerings and Aging Utility Infrastructure
• Test - Lower Operating Cost Structure & Strong End Market Growth
> Above Industry-Average Top Line Growth Prospects
> Healthy and Growing End-Markets
• Continued Strength in Defense Platforms (Navy, Submarines, Aero) / 5G / Proliferation of
Wireless Devices / Aging Utility Infrastructure / Renewable Energy
> Strong Distributor Networks

11
ESCO – Investor Fundamentals (Continued)
> Recurring / Repeatable Revenues
• Proprietary Products / Defense Shipset Content / Growing Software Applications
> Defined and Sustainable Competitive Advantages
• Market Leading Positions providing Highly-Engineered Products and Solutions
> Diversified Customer Base / Long-Standing Customers
> Diversity of End-Markets Enhances Ability to Withstand Cyclicality
> Recognized Technical Expertise Across Segment Management

12
Continuing Pursuit of M&A to Support Growth
> Characteristics we are looking for:
• In our core businesses or markets, or really near
• Strong market positions
• Leadership in niche markets
• Technology driven products or services
• Reasonably predictable revenue streams
• Solidly profitable
• Clearly defined growth opportunities
> These criteria are all present in our current businesses

13
Strategy
ESCO will increase shareholder value through
> Maintaining a multi-segment business platform to enhance the sustainability
of sales and earnings growth
> Increasing revenues greater than industry growth rates
> Targeted long-term growth: Sales +10%, EPS >15%
> Performance improvement actions driving margin expansion
> Focus on increasing ROIC > WACC
> Solid capital allocation strategy
> Continued investment in new products / services / solutions / automation
> Selective acquisitions supplementing organic growth
Primary Goal:
Increase Shareholder Returns


20%
80%19%
24%
5%
52%34%
66%
20%
17%
15%
31%
7%
10%
Globe
VACCO
15
Overview
> Provides innovative products and solutions to the
aerospace, space and navy markets
> Strong platform mix (OEM / after-market)
> Revenue growth over past 5 years >10% CAGR
> Solid operating margins >20%
> Long term programs (20 - 40 years)
> Guaranteed annuity of revenues
• Production, Aftermarket, Repairs & Spares
Sales by End Market OEM Vs. AftermarketProprietary Vs. Competitive
Aerospace
Industrial
Navy
Space
Proprietary
Competitive
OEM
Aftermarket
PTI
Crissair
Mayday
Westland
Revenue by Company

16
Aerospace
PTI Technologies
> Leading provider of filtration systems / components for commercial, military
and business aircraft
• Hydraulic, Fuel and Air filtration – Modules/Manifolds, Filter Elements & Indicators
Crissair
> Recognized as an industry leader in providing a wide range of products from
miniature fluid control valves and components to large manifold assemblies
for the aerospace, defense and space industries
> ATM acquisition adds precision metal parts and grinding capability
Mayday Manufacturing
> Leading build-to-print manufacturer of mission-critical bushings, pins,
sleeves and precise-tolerance machined components for landing gear, rotor
heads, engine mounts, flight controls and actuation systems
> Full-service metal processor - anodizing, cadmium and zinc-nickel plating,
organic coatings, non-destructive testing and heat treatment

17
Navy & Space
VACCO Industries
> Designs and manufactures critical components for navy, space and industrial
markets• Navy: Quiet and non-quiet air/water valves and manifolds for subs and surface ships
• Space: Thruster, check & latch valves, solenoids and regulators on launch systems, manned
systems and satellites
Westland Technologies
> Market leading designer and manufacturer of signature reduction solutions
which enhance Navy platform survivability • Complex tiles and shock/vibration dampening systems that reduce passive acoustic signatures
and/or modify signal emission and reflection to reduce or obscure a vessel’s signature
(submarines and surface ships)
Globe Composite Solutions
> Vertically integrated provider of mission critical composite-based products for
the Navy and industrial customers• Manufactures Special Hull Treatment (SHT) and baffle panels to increase stealth capabilities on
U.S. Navy submarines and radiation shielding for security and medical applications.
18
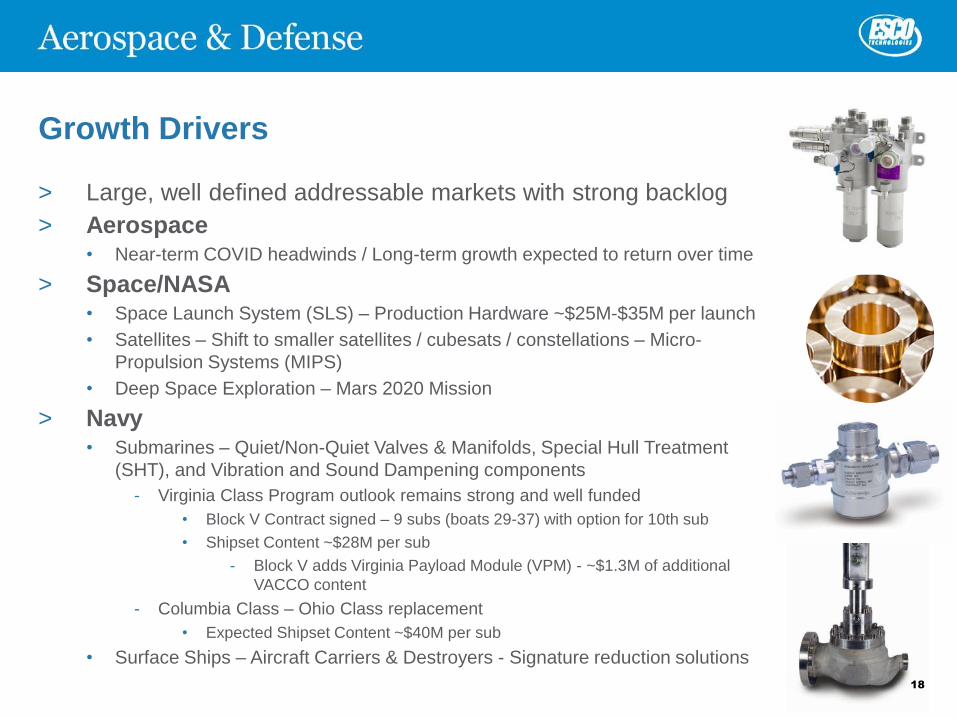
Growth Drivers
> Large, well defined addressable markets with strong backlog
> Aerospace• Near-term COVID headwinds / Long-term growth expected to return over time
> Space/NASA • Space Launch System (SLS) – Production Hardware ~$25M-$35M per launch
• Satellites – Shift to smaller satellites / cubesats / constellations – Micro-
Propulsion Systems (MIPS)
• Deep Space Exploration – Mars 2020 Mission
> Navy• Submarines – Quiet/Non-Quiet Valves & Manifolds, Special Hull Treatment
(SHT), and Vibration and Sound Dampening components
- Virginia Class Program outlook remains strong and well funded
• Block V Contract signed – 9 subs (boats 29-37) with option for 10th sub
• Shipset Content ~$28M per sub
- Block V adds Virginia Payload Module (VPM) - ~$1.3M of additional
VACCO content
- Columbia Class – Ohio Class replacement
• Expected Shipset Content ~$40M per sub
• Surface Ships – Aircraft Carriers & Destroyers - Signature reduction solutions


20
Overview
> Our USG companies provide industry-leading diagnostic equipment,
software and services to minimize risk and optimize electric power
infrastructure performance for the electric utility and renewable energy
industries.
> Technology Innovator - Serve on > 80 Domestic & Int’l Standards Boards
> Doble provides diagnostic instruments, software, services and the world’s
premier library of statistically significant test results for the benefit of the
electric utility industry.
> Acquisitions have expanded our product offerings to include circuit breaker
and relay protection testing, and on-line/off-line Dissolved Gas Analysis
(DGA) testing and data management solutions for power transformers.
> NRG serves multiple stages of wind and solar energy project development
and optimization and provided entrance into the domestic and international
renewable energy markets.

21
FY’20 Revenue Profile
Electric Utilities56%
Industrial4%
Power Generation
22%
Renewable Energy
18%
Sales by End Market
Asia11%
Canada8%
EMEA8% Central/South
America3%
Domestic70%
Sales by Geography

22
USG Product Revenue
Services28%
Cybersecurity / Other
3%
Offline13%
Protection24%
Online15%
Renewables17%
Hardware / Imbedded
Software

23
Overview - Doble
> Provides on-line and off-line diagnostic test equipment and software to
monitor the health of electric power industry assets
> “Knowledgebase” test results create a statistical database that can’t be
replicated - used for baseline, historical and trend analytics on asset health
> Doble “brand” carries a strong market perception of trusted excellence and
independence = 3rd party extension of utility’s organization
> Longest running Technical Conference Series (>85 years) related to energy
infrastructure asset management
> Annuity Business / Recurring Revenue
> Founded in 1920 – 100 Year Anniversary in 2020

24
DOBLE Product and Service Offerings
> Transformer/Substation Asset Diagnostic Testing
> On-Line Monitoring & Analysis
> Grid Intelligence
> Predictive Failure Assessment
> Protective Relay Test Instruments & Software
> Circuit Breaker Test Equipment
> Knowledgebase Resource Library
> Independent Consulting & Testing Services
> Forensic Analysis
> Laboratory Services
> Technical Conference Training & Education

25
Doble Solutions
Doble
Material
Laboratories
Cable &
Switchgear
Diagnostics
Transformer
Diagnostics
Circuit
Breaker
Diagnostics
Protection
Diagnostics
Rotating
Machinery
Diagnostics
Doble Power Services (Consulting & Testing Services)
Doble Client Services and Product Engineering Teams

26
Doble Online Monitoring Products
> doblePRIME™ Transformer Condition
Monitoring System
• Remotely assess overall transformer health
• Modular Design
- Dissolved Gas Analysis (DGA) – Calisto monitors
detect and quantify fault gases for diagnosis of
impending faults
- Bushings – doblePRIME IDD™ - detects deterioration
in bushings and abnormalities in insulation
- Partial Discharge - doblePRIME PD Guard™ -
monitors PD in transformers, rotating machines,
cables, and switchgear
- Moisture - doblePRIME Domino™ - monitors
moisture in oil
• doblePRIME Analytics™ – aggregates data from
monitored devices for a comprehensive view of
asset conditions
- Provides communication, analytics, and alerts/alarms
27
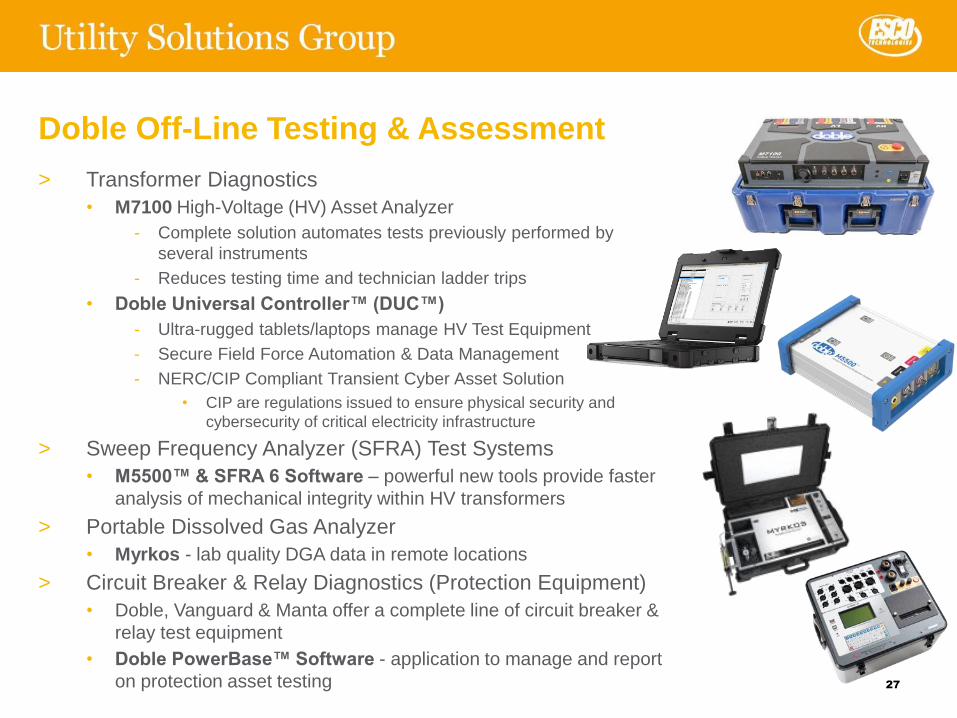
Doble Off-Line Testing & Assessment
> Transformer Diagnostics
• M7100 High-Voltage (HV) Asset Analyzer
- Complete solution automates tests previously performed by
several instruments
- Reduces testing time and technician ladder trips
• Doble Universal Controller™ (DUC™)
- Ultra-rugged tablets/laptops manage HV Test Equipment
- Secure Field Force Automation & Data Management
- NERC/CIP Compliant Transient Cyber Asset Solution
• CIP are regulations issued to ensure physical security and
cybersecurity of critical electricity infrastructure
> Sweep Frequency Analyzer (SFRA) Test Systems
• M5500™ & SFRA 6 Software – powerful new tools provide faster
analysis of mechanical integrity within HV transformers
> Portable Dissolved Gas Analyzer
• Myrkos - lab quality DGA data in remote locations
> Circuit Breaker & Relay Diagnostics (Protection Equipment)
• Doble, Vanguard & Manta offer a complete line of circuit breaker &
relay test equipment
• Doble PowerBase™ Software - application to manage and report
on protection asset testing

28
Doble Client Services
> Doble Knowledgebase
• Statistical database utilized in analysis of utility asset test results
• > 55 million test results on over 100,000 types of apparatus
• Independent broker / brand agnostic
> Conferences & Training
• International Conference of Doble Clients
- Brings together power industry peers for education, discussion, and collaboration on asset
management, operational concerns, and diagnostic approaches to asset optimization
• Training
- For over 90 years Doble has been the industry leader in training and education for the electric
power industry
- Topics include Asset Management, Power Transformers, Protection Theory, Substation
Equipment, Lab Diagnostics, Rotating Machinery & Power Cables
> Laboratory Services
• Fully equipped labs provide a wide variety of testing and diagnostic services and
solutions to address client apparatus issues
- Oil Analysis, Forensic Analysis, DGA, Insulations Testing & HV Testing

29
Market Trends - Maintenance
Run to Failure/
Reactive
Scheduled / Interval
Maintenance
Real-Time Condition
Based Maintenance
Counter Based
Maintenance
Condition Based
Maintenance
Highest level of
reliability issues
Less expensive
than other
methodologies
High O&M costs
Low
Implementation
Costs
Maintenance can
introduce failure
risk (human error)
High O&M costs Maximum reliability
Grid visibility across
aging assets
Efficient O&M
Just in time / risk
assessment includedRationale / Issues
Better reliability
More efficient O&M
PR
ED
ICT
IVE
MA
INT
EN
AN
CE
Most Utilities Utility Migration
Doble focus & advantages: Lower O&M Costs, Higher Reliability

Utility Market: Opportunities Abound
©2019 Doble Engineering Company. All Rights Reserved
30

Service20%
Protection20%
Offline20%
Condition Monitoring
40%
Complementary Products
31
Service28%
Protection24%
Offline13%
Condition Monitoring
15%
Renewables18%
Other2%
Complementary Geographic Reach
Americas16%
EMEA32%
Asia52%
Americas81%
EMEA8%
Asia11%
Altanova Acquisition> Altanova offers a wide range of diagnostic products, monitoring systems, and
services for electrical assets related to power generation, transmission and distribution networks, renewable energy and storage, and process industries worldwide.
> Products largely complementary – adds partial discharge, cable, switch gear, and battery monitoring product offerings
> Expands geographic reach to create a formidable global diagnostic instrumentation and services platform
USG AltanovaUSG Altanova
Chart Added July 2021 - Transaction Announced May 20, 2021 / Expect to close Q4 2021

32
Overview - NRG
> Designs and manufactures smart technologies for a more sustainable
planet. Serves multiple stages of wind and solar energy project development
and provides tools for a range of atmospheric remote sensing applications.
> Products are utilized by electric utilities, turbine OEMs, project developers,
research institutes, and government agencies around the globe.
• Wind Resource Assessment (WRA) / Wind Plant Optimization
• Solar Resource Assessment (SRA) / Solar Resource Monitoring (SRM)
• Atmospheric Solutions (Lidar)
• Bat Deterrent Systems
> LEED Gold certified facility

33
NRG Products
> Wind & Solar• Data Loggers – Collect and store data from meteorological sensors and
other devices
- SymphoniePRO® or SymphoniePLUS®3
• Met Sensors – Anemometers, Pyranometers & Wind Vanes
• Towers – Sensors are mounted on galvanized steel NRG Towers
> Wind• Light Detection & Ranging (LIDAR) - Remote sensing equipment utilized
in WRA, turbine optimization, and weather applications
- Reliable data at a range of heights – ideal as turbine height increases
• Bat Deterrent Systems
- Pioneering technology to support bat conservation in wind energy
development
- Emits ultrasonic acoustic field to discourage bats from entering
airspaces
> Solar • SRA System – Pre-construction resource assessment solution for utility-
scale photovoltaic (PV) solutions
• SRM System – Performance monitoring solution for solar installations
80m XHD
TallTower™
NRG 200P Wind Vane
SymphoniePRO® Data Logger
NRG 40C
Anemometer
LIDAR - Spidar
Vertical Profiler
SRM System

Growth Drivers> Aging Infrastructure – Increasing need for Asset Surveillance
• 70% of transformers are 25+ years old
> Increasing Demand for Power• 79% increase in electricity demand expected over next 30 years (per U.S Energy Information Administration)
• Increasing sub-transmission lines to residential homes
> Annual Failure Rate of Large Power Transformers Increasing• Growing concern to limit costly electricity outages / Utility fines & penalties
> Conversion to Smart Monitoring Solutions • Grid management trending towards automated/connected monitoring solutions
> Increasing Regulatory Compliance Requirements – NERC/CIP
> Expanding New Products and Software Solutions• DUC™, doblePrime™, M5500™, Calisto™ T1, M7100, Protection Suite Software v5, PowerBase™
• Acquisitions have expanded DGA, SFRA, circuit breaker/relay testing, and renewable energy product offerings
> Global expansion - Consolidated rep network
> Transition to Renewable Energy (per International Energy Agency Renewables 2020 Report)• COVID-19 is hurting – but not halting – global renewable industry growth
• Solar PV and onshore wind are cheapest ways to add new electricity generation in most countries today
• Renewables projected to overtake coal to become largest source of electricity generation by 2025
• Renewables are projected to account for 95% of the net increase in global power capacity through 2025
- (Solar 60% / Wind 30% / Hydro 5%)34


36
What We Do
> ETS-Lindgren is an innovative supplier of test and measurement systems
that identify, measure and contain magnetic, electromagnetic and acoustic
energy
> Our products create an environment that isolates and controls unintended
energy emissions to insure immunity and compatibility during the design
stage of new product development
> Provide medical, EMP, and general purpose industrial shielding

37
Diverse Product Offerings
Small Test Enclosures /
Systems <$100K Chambers/Systems
$100K to $20M+Antennas & Test
Accessories
$1K-$10K
Shielded
Enclosures
$5K to $100K

38
Diverse Product Offerings
Shielded Intraoperative
MRI SuitesReverberation
Chambers Shielded Doors

39
Who We Serve
> ETS-Lindgren serves a global customer base made up of the top companies
in their respective markets

40
FY’20 Revenue Profile
17%
27%
21%
14%
4%
17%
Health Care
Aerospace /
Defense
Wireless
Consumer
Electronics
Sales by End Market
Automotive
Acoustics
39%
9%
52%
Asia
Sales by Geography
Europe
Americas

41
Growth Drivers
> Consistent Order strength supports solid Backlog
• 5G Development, Satellite, Automotive, Electric Vehicle & EMP
> Increasing electronic content
• Increased content with higher frequencies and functionality (5G)
• Increased Electronic / RF “Pollution” = Interference
> Increasing wireless communication
• Transmit Power / Receive Sensitivity / Data Throughput
• The Internet of Things
- “Everything” connected wirelessly (Person-to-person and machine-to-machine)
• Autonomous Vehicles
> International Growth
• Increasing development / manufacturing of electronics overseas
• Increasing international requirements for EMC testing
• New Manufacturing Facility in Tianjin, China (>55% Sales growth in Asia over
past 3 years)


43
Wrap-up
> We have a simple well defined Corporate strategy
> We remain committed to our targeted long-term growth rates
> Solid organic growth prospects across the company
> Continue to supplement growth with small to mid-size M&A
• Balance sheet and Management bandwidth to make this happen
> Despite the economic headwinds created by COVID-19, 2020 was a
solid year highlighted by stable revenue and profitability, record cash
flow from operations, and enhanced financial liquidity


Net
Sales
EBIT
GAAP Adjustments D&AEBITDA
As Adjusted
EBITDA
Margin
A&D $ 354.3 $ 73.2 $ 1.4 $ 9.4 $ 84.0 23.7%
USG 191.7 24.4 6.6 14.4 45.4 23.7%
Test 186.9 27.2 0.1 5.0 32.3 17.3%
Segment Totals 732.9 124.8 8.1 28.8 161.7 22.1%
Corporate - (78.3) 40.8 12.5 (25.0)
Continuing Ops 732.9 46.5 48.9 41.3 136.7 18.7%
EBITDA Reconciliation
Less D&A (41.3)
Less Interest (6.7)
Less Income Tax (16.3)
Net Earnings $ 72.4 9.9%
45
FY’20 Segment Performance ($ in Millions)(1)
(1) Excludes Discontinued Operations – Technical Packaging Segment sale completed 12/31/19
(2) See page F-28 in the 2020 Form 10-K
(3) Excludes $41 million pre-tax charge related to the pension plan termination and $8 million of pretax charges within the USG and A&D segments
related to facility consolidation, asset write-off, severance, and the incremental costs associated with COVID-19.
(2) (3)
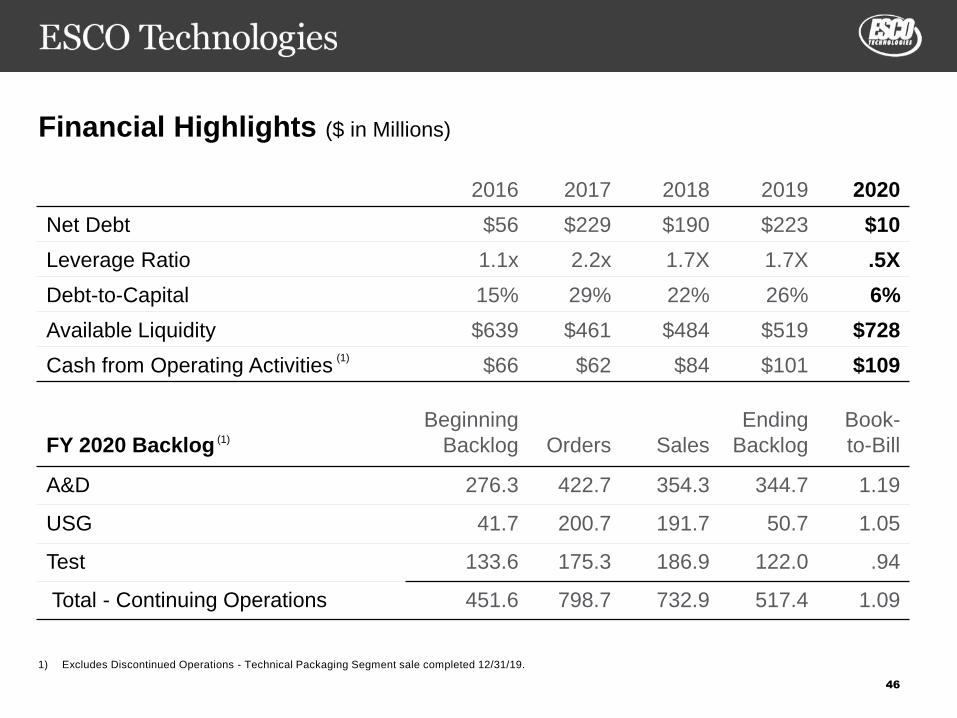
46
Financial Highlights ($ in Millions)
2016 2017 2018 2019 2020
Net Debt $56 $229 $190 $223 $10
Leverage Ratio 1.1x 2.2x 1.7X 1.7X .5X
Debt-to-Capital 15% 29% 22% 26% 6%
Available Liquidity $639 $461 $484 $519 $728
Cash from Operating Activities $66 $62 $84 $101 $109
FY 2020 Backlog
Beginning
Backlog Orders Sales
Ending
Backlog
Book-
to-Bill
A&D 276.3 422.7 354.3 344.7 1.19
USG 41.7 200.7 191.7 50.7 1.05
Test 133.6 175.3 186.9 122.0 .94
Total - Continuing Operations 451.6 798.7 732.9 517.4 1.09
(1)
1) Excludes Discontinued Operations - Technical Packaging Segment sale completed 12/31/19.
(1)

47
Discontinued Operations and Adjustments to Earnings Detail
Technical Packaging (Divested 12/31/19) 2016 2017 2018 2019 2020
Sales ($ in Millions) $74.4 82.9 87.9 86.9 -
EBITDA – As Adjusted ($ in Millions) 11.7 10.9 10.9 10.1 -
EPS – As Adjusted $0.23 $0.20 $0.23 $0.13 $2.93
Segment EBITDA – As Adjusted Cont Ops 2016 2017 2018 2019 2020
EBITDA $93.3 117.0 134.5 150.6 87.8
Corporate Costs 23.8 20.0 24.0 26.8 25.0
Discrete Adjustments 7.8 6.1 4.8 .6 48.9
Disc Ops – Technical Packaging (11.7) (10.9) (10.9) (10.1) -
Segment EBITDA – As Adjusted Continuing Operations $113.2 132.2 152.4 167.9 161.7
EPS – As Adjusted Continuing Ops 2016 2017 2018 2019 2020
GAAP EPS $1.77 $2.07 $3.54 $3.10 $3.90
Discrete Adjustments $0.26 $0.15 $0.17 ($0.02) $1.79
U.S. Tax Reform - - ($0.94) - -
Disc Ops – Technical Packaging ($0.23) ($0.20) ($0.23) ($0.13) ($2.93)
EPS – As Adjusted Continuing Operations $1.80 $2.02 $2.54 $2.95 $2.76
1) Includes gain on sale in FY’20.
(1)
(1)

9900A Clayton Road • St. Louis, MO 63124
(314) 213-7200
www.escotechnologies.com
NYSE: ESE