January 2018 - semenindonesia.com · 8 Strategic Projects (2017) Strategic Projects Capacity...
20
January 2018
Transcript of January 2018 - semenindonesia.com · 8 Strategic Projects (2017) Strategic Projects Capacity...
January 2018
2
think about theENVIRONMENT

3
• Design Capacity : 106.3 mt• Production Capacity : 74.0 mit• Domestic Growth : 7.5%• Domestic Utilization: 63%•Supply Domestic : 66.5 mt Export :
Clinker : 1,8 mtCement : 1,1 mt
Domestic Capacity (2017)
2017
Cement companies in Indonesia
1. Semen Indonesia 35.5 mt2. Indocement TP 24.9 mt3. Lafarge Holcim Indonesia 14.5 mt4. Semen Merah Putih 7.5 mt5. Semen Bosowa 7.0 mt6. Semen Anhui Conch 4.5 mt7. Semen Baturaja 3.8 mt8. Semen Pan Asia 1.9 mt9. Siam Cement Group 1.8 mt 10. Semen Jui Shin 1.5 mt11. Semen Serang (Haohan) 1.2 mt12. Semen Jakarta 1.0 mt13. Semen Hippo (Sun Fook) 0.6 mt14. Semen Kupang 0.3 mt15. Semen Puger 0.3 mt
TOTAL 106,3 mio ton
*) Source: SMGR intemal calculation*) Source: SMGR intemal calculation

4source: Company data
SMGR’s Sales Volume
Nov-17 Dec-17 Dec-16 Chg (%) 2017FY 2016FY Chg(%)
Domestic 2,566,901 2,359,967 2,182,947 8.1 27,091,728 25,682,143 5.5
Export 169,638 170,607 48,676 250 1,870,862 599,510 212
TOTAL 2,736,539 2,530,574 2,231,623 13.4 28,962,590 26,281,653 10.2
TLCCDomesticExport
166,75746,400
174,30045,000
173,29972,800
0.5(38.1)
1,832,563342,080
1,760,000776,000
4.1(55.9)
TOTALSemen Indonesia Group
2,949,696 2,749,874 2,477,722 (10.9) 31,137,233 28,817,653 8
731
600
650
700
750
800
NET ASP - DOMESTIC CEMENT (Rp Ribu/Ton)
ACTUAL
2,670
1600.0 1800.0 2000.0 2200.0 2400.0 2600.0 2800.0 3000.0 3200.0 3400.0
Dec-
16
Jan-
17
Feb-
17
Mar
-17
Apr-
17
May
-17
Jun-
17
Jul-1
7
Aug-
17
Sep-
17
Oct
-17
Nov-
17
Dec-
17
SALES VOLUME
ACTUAL

5Source: Company data, Indonesia Cement Association
Indonesia Cement Sales VolumeNov-17 Dec-17 Dec-16 Chg (%) 2017FY 2016FY Chg(%)
Domestic 2,566,901 2,359,967 2,182,947 8.1 27,091,728 25,682,143 5.5
Export 169,638 170,607 48,676 250 1,870,862 599,510 212
TOTAL 2,736,539 2,530,574 2,231,623 13.4 28,962,590 26,281,653 10.2
TLCCDomesticExport
166,75746,400
174,30045,000
173,29972,800
0.5(38.1)
1,832,563342,080
1,760,000776,000
4.1(55.9)
TOTALSemen Indonesia Group
2,949,696 2,749,874 2,477,722 (10.9) 31,137,233 28,817,653 8

6
Retail (residential) sector is still the largest consumer of cement in Indonesia
BAG74.5%
BULK25.5%
Bag Bulk
• Ready-mix (infrastructure): ± 60%
• Fabricator (pre-cast, fiber cement, cement based industry): ± 35%
• Projects (mortar, render): ± 5%
• Ready-mix (infrastructure): ± 60%
• Fabricator (pre-cast, fiber cement, cement based industry): ± 35%
• Projects (mortar, render): ± 5%
• Housing: ± 90%
• Cement based industry: ± 10%
• Housing: ± 90%
• Cement based industry: ± 10%
source: Indonesia Cement Association
domestic market consumption (2017) – type of cement

7
Infrastructure Spending Planned for 2015 – 2019 (USD Bn)
INFRASTRUCTURE DEVELOPMENT
COMMERCIAL & INDUSTRIAL High growth in retail, commercial and
institutional sector in urban and semi-urban area High growth industry segment (precast, light brick,
cement fiber, pave, ready mixed concrete)
HOUSING Population Growth Rising per Capita Income Mass urbanization
CEMENT CONSUMPTION 2016 (KG/CAPITA)
Rapidly Growing Productive Population
Key Factors Supporting Domestic Cement Consumption
172 42106
113 433
CentralGovt
RegionalGovt
SOEs Private Total
POTENTIAL MARKETThe fourth largest population in the world: 258millions people (2015)
DEMOGRAPHIC BONUS
1648
1000763 617
458 399 262 248 244 163
0
500
1000
1500
2000
Cement Consumption per Capita (kg)
average (ex china) = 459kg

8
Strategic Projects (2017)
Strategic Projects Capacity InvestmentConstruction Start up commercial
Start Completion
Packing Plant Maluku Utara 500,000 ton/year
300,000 (bags)200,000 (bulk)
IDR 66 Bio January 2017 Q1-2018 Q2-2018
Packing Plant Bengkulu IDR 75 Bio February 2017 Q1–2018 Q2-2018
Waste Heat Recovery Power Generation 30.6 MW IDR 574 Bio Q2-2016 Q1-2018 Q2-2018
Proyek Packing Plant BengkuluProyek Packing Plant Maluku Utara
Proyek Waste Heat Recovery Power Generation (WHRPG) - Pabrik Tuban

9
Integrated Cement Plant 4 location
Kiln 15 Unit
Cement Mill 26 Unit
Grinding Plant 3 location
Cement Mill 4 Unit
Warehouse 30 location
Packing Plant 22 location
Sea Port 12 location
Kiln 1 unit
Cement Mill 1 unit
Kiln 5 unit
Cement Mill 8 unit
Kiln 5 unit
Cement Mill 11 unit
Grinding Plant
1 unit Cement Mill
Kiln 4 unit
Cement Mill 6 unitGrinding Plant
3 unit Cement Mill
Our facilities

10
Opportunity Regional Cement Market

11
Supply-Demand Cement in Asia Pacific
2017E (mtpa) Design Cap. Production Cap. Consumption Export
(Import) China 3794,4 2390,6 2380,5 10,1India 396 313,7 311,7 2
Indonesia 106,3 74 69 5Vietnam 91,5 74,6 57,5 17,1
South Korea 71,6 53,1 50,2 2,9Thailand 60,5 36,4 31,3 5,1Pakistan 48 39,7 30,8 8,9Malaysia 41,3 23,6 22,9 0,7
Philippines 34,2 26 26,5 -0,5Australia 13,2 8,7 9,5 -0,8Myanmar 10,5 8 9,8 -1,8
Laos 10 6 3,3 2,7
Source : Global Cement, Bloomberg, Digital Cement

12
think about theENVIRONMENT
13
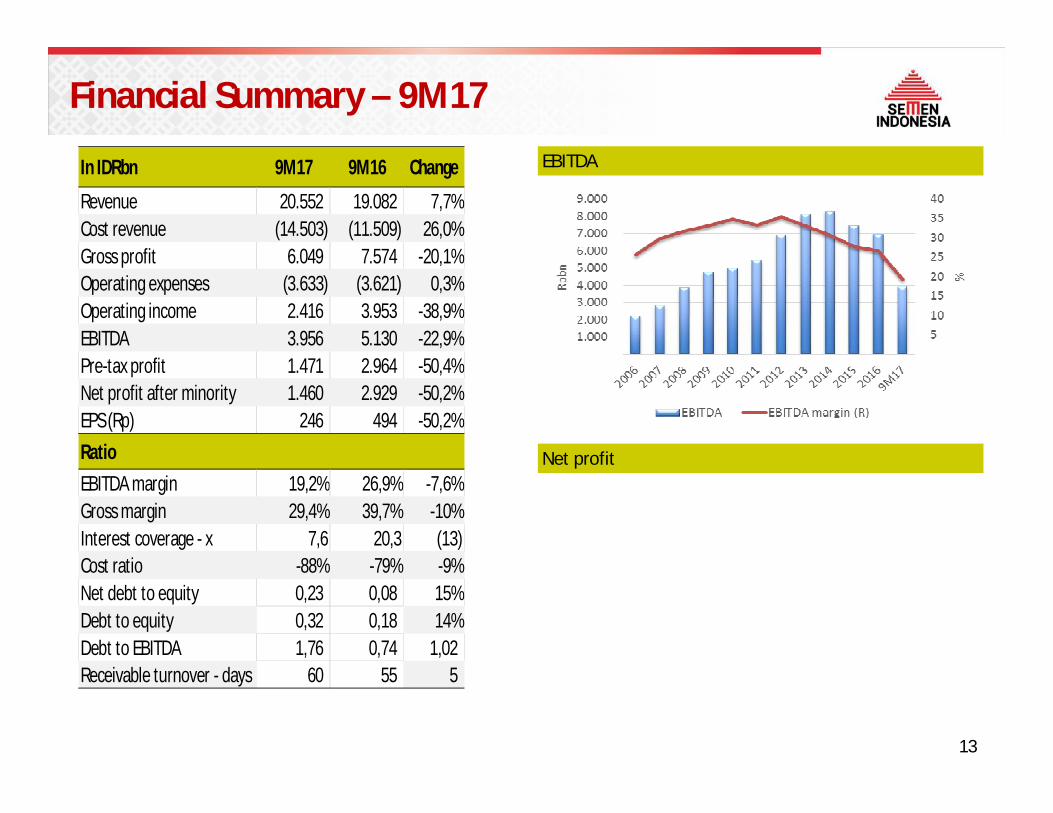
Financial Summary – 9M17
EBITDA
Net profit
In IDRbn 9M17 9M16 Change
Revenue 20.552 19.082 7,7%Cost revenue (14.503) (11.509) 26,0%Gross profit 6.049 7.574 -20,1%Operating expenses (3.633) (3.621) 0,3%Operating income 2.416 3.953 -38,9%EBITDA 3.956 5.130 -22,9%Pre-tax profit 1.471 2.964 -50,4%Net profit after minority 1.460 2.929 -50,2%EPS (Rp) 246 494 -50,2%RatioEBITDA margin 19,2% 26,9% -7,6%Gross margin 29,4% 39,7% -10%Interest coverage - x 7,6 20,3 (13) Cost ratio -88% -79% -9%Net debt to equity 0,23 0,08 15%Debt to equity 0,32 0,18 14%Debt to EBITDA 1,76 0,74 1,02 Receivable turnover - days 60 55 5
14
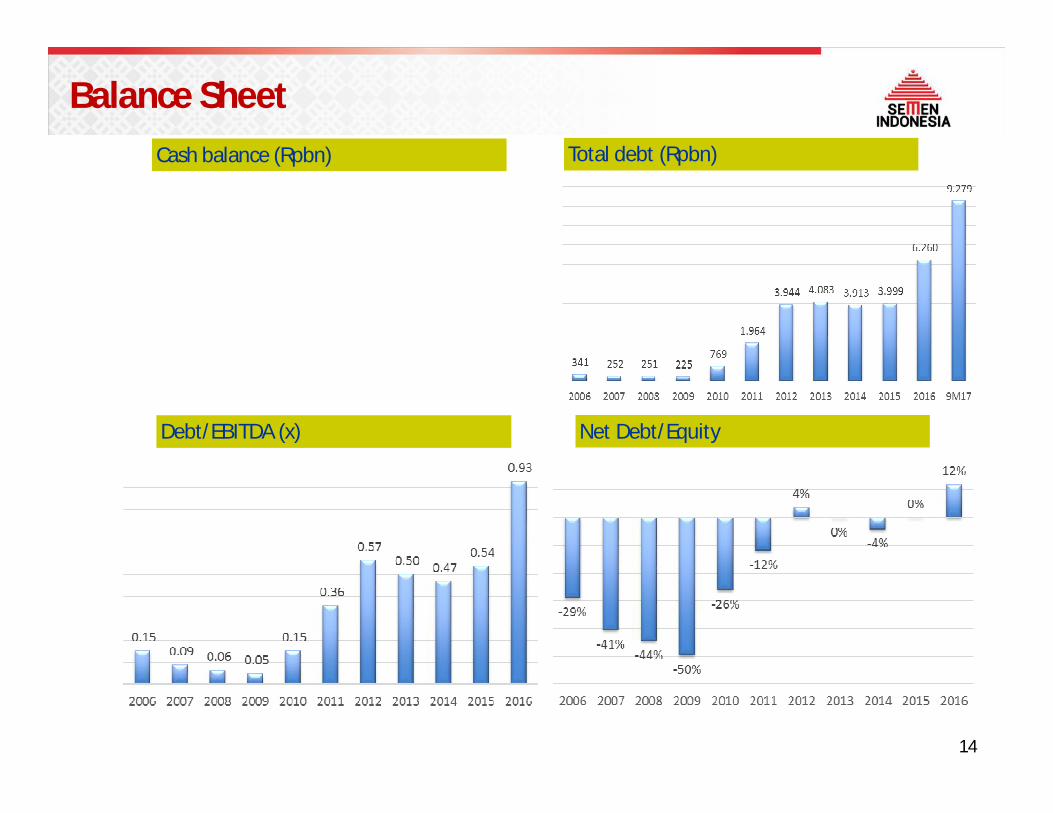
Balance SheetCash balance (Rpbn) Total debt (Rpbn)
Debt/EBITDA (x) Net Debt/Equity

15
Likuiditas dan Solvabilitas
15
(Dal
amRp
Mili
ar) 4,070
4,926
3,964
2,834 2,674
2013Audited
2014Audited
2015Audited
2016Audited
9M 2017
CASH
1.88 2.21
1.60 1.27
2013Audited
2014Audited
2015Audited
2016Audited
CURRENT RATIO
4,083 3,913 4,001
6,260
9,279
2013Audited
2014Audited
2015Audited
2016Audited
9M 2017
INTEREST BEARING DEBT
(Dal
amRp
Mili
ar)
0.50 0.47 0.54
0.90
2013Audited
2014Audited
2015Audited
2016Audited
DEBT TO EBITDA

16
Dividend Pay Out
Dividen Pay Out (DPO)
Earning Per Share (EPS)

17
think about theENVIRONMENT
18
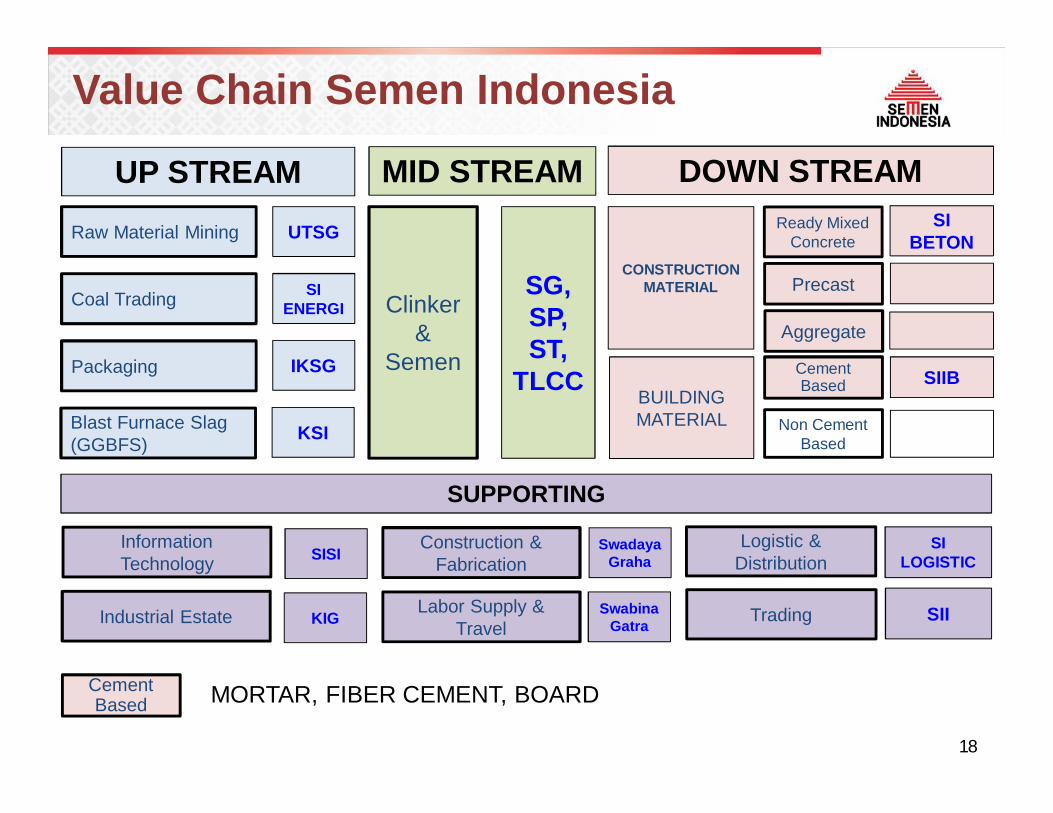
Value Chain Semen Indonesia
UP STREAM MID STREAM DOWN STREAMRaw Material Mining UTSG
Coal Trading SI ENERGI
Packaging IKSG
Clinker&
Semen
SG, SP, ST,
TLCC
CONSTRUCTION MATERIAL
SI BETON
Blast Furnace Slag (GGBFS) KSI
BUILDING MATERIAL
SIIB
SUPPORTING
Logistic & Distribution
SI LOGISTIC
Construction & Fabrication
SwadayaGraha
Information Technology SISI
Labor Supply & Travel
SwabinaGatraIndustrial Estate KIG
Ready Mixed Concrete
Precast
Cement Based
Non Cement Based
Aggregate
Trading SII
Cement Based MORTAR, FIBER CEMENT, BOARD

19
2018 - KEY STRATEGY
Supply Chain Optimization
Cost Transformation & Enable Corporate Growth
(Growth) Strategy Refresh
Centralize Marketing
Centralize Procurement

20
IMPORTANT NOTICETHIS PRESENTATION IS NOT AND DOES NOT CONSTITUTE OR FORM PART OF, AND IS NOT MADE IN CONNECTION WITH, ANY OFFER FOR SALE OR SUBSCRIPTION OF ORSOLICITATION, RECOMMENDATION OR INVITATION OF ANY OFFER TO BUY OR SUBSCRIBE FOR ANY SECURITIES NOR SHALL IT OR ANY PART OF IT FORM THE BASIS OFOR BE RELIED ON IN CONNECTION WITH ANY CONTRACT, COMMITMENT OR INVESTMENT DECISION WHATSOEVER.THE SLIDES USED IN THIS PRESENTATION ARE STRICTLY CONFIDENTIAL AND HAVE BEEN PREPARED AS A SUPPORT FOR ORAL DISCUSSIONS ONLY. THE INFORMATIONCONTAINED IN THIS PRESENTATION IS BEING PRESENTED TO YOU SOLELY FOR YOUR INFORMATION AND MAY NOT BE REPRODUCED OR REDISTRIBUTED TO ANY OTHERPERSON, IN WHOLE OR IN PART.This presentation includes forward-looking statements, which are based on current expectations and forecast about future events. Such statements involve known / unknown risksuncertainties and other factors, which could cause actual results to differ materially from historical results or those anticipated. Such factors include, among others:● economic, social and political conditions in Indonesia, and the impact such conditions have on construction and infrastructure spending in Indonesia;● the effects of competition;● the effects of changes in laws, regulations, taxation or accounting standards or practices;● acquisitions, divestitures and various business opportunities that we may pursue;● changes or volatility in inflation, interest rates and foreign exchange rates;● accidents, natural disasters or outbreaks of infectious diseases, such as avian influenza, in our markets;● labor unrest or other similar situations; and● the outcome of pending or threatened litigation.We can give no assurance that our expectations will be attained.
DISCLAIMERThe information contained in this report has been taken from sources which we deem reliable. However, none of PT Semen Indonesia (Persero) Tbk and/or its affiliated companies and/or their respective employees and/or agents make any representation or warranty (express or implied) or accepts any responsibility or liability as to, or in relation to, the accuracy or completeness of the information and opinions contained in this report or as to any information contained in this report or any other such information or opinions remaining unchanged after the issue thereof.We expressly disclaim any responsibility or liability (express or implied) of PT Semen Indonesia (Persero) Tbk, its affiliated companies and their respective employees and agents whatsoever and howsoever arising (including, without limitation for any claim, proceedings, action, suits, losses, expenses, damages or costs) which may be brought against or suffered by any person as a result of acting in reliance upon the whole or any part of the contents of this report and neither PT Semen Indonesia (Persero) Tbk, its affiliated companies or their respective employees or agents accepts liability for any errors, omission or mis-statements, negligent or otherwise, in the report and any liability in respect of the report or any inaccuracy therein or omission therefrom which might otherwise arise is hereby expresses disclaimed.
Thank You
Head Office:Gedung Utama Semen Indonesia
Jalan Veteran, Gresik 61122, East Java – IndonesiaPhone: (62-31) 3981731 -2, 3981745
Fax: (62-31) 3983209, 3972264
Representative Office:The East Tower, 18th floorJalan Dr. Ide Anak Agung Kav. E3.2 No. 1,Jakarta 12950, IndonesiaTelp.: (62-21) – 5261174, 5261175; Fax : (62-21) – 5261176
www.semenindonesia.com