Real Estate Market Reports For The Woodlands TX - June / July 2009, by Ken Brand
Upload
referred-realty-groupCategory
view
48download
0
January 2015
Our take on “How’s the market?”
photo courtesy of Brent Pullan Photography
@ReferredRealty www.ReferredRealtyGroup.com(281)210-0029
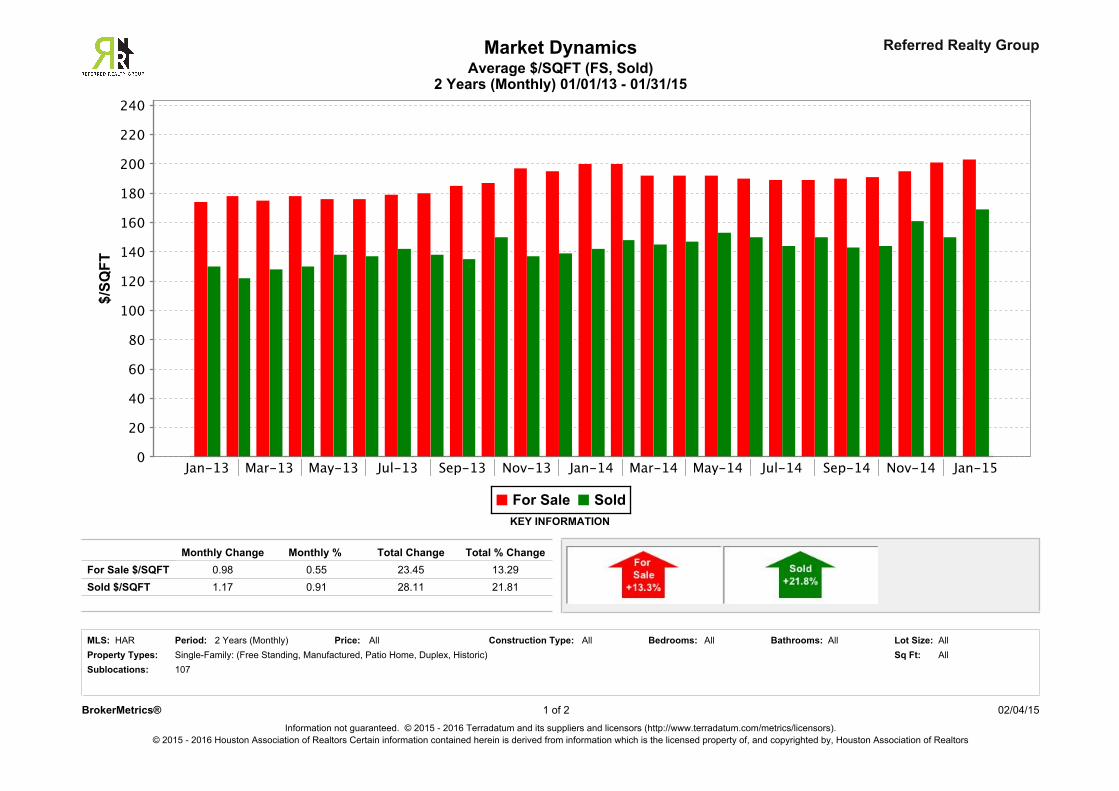
Market DynamicsAverage $/SQFT (FS, Sold)
2 Years (Monthly) 01/01/13 - 01/31/15
Referred Realty Group
Price:
0.55
AllAll All
0.9123.45
Property Types:HAR
Sold $/SQFTFor Sale $/SQFT
MLS: All
1.17
Bathrooms:
0.98
All
21.8128.11
Construction Type:
Total Change
Sq Ft:
Monthly Change
2 Years (Monthly)
Sublocations:
All
13.29
Lot Size:Period:
Monthly %
Bedrooms:
KEY INFORMATION
Total % Change
Single-Family: (Free Standing, Manufactured, Patio Home, Duplex, Historic)107
02/04/15BrokerMetrics®Information not guaranteed. © 2015 - 2016 Terradatum and its suppliers and licensors (http://www.terradatum.com/metrics/licensors).
© 2015 - 2016 Houston Association of Realtors Certain information contained herein is derived from information which is the licensed property of, and copyrighted by, Houston Association of Realtors
1 of 2
For Sale Sold
Jan-13 Mar-13 May-13 Jul-13 Sep-13 Nov-13 Jan-14 Mar-14 May-14 Jul-14 Sep-14 Nov-14 Jan-150
20
40
60
80
100
120
140
160
180
200
220
240$/
SQFT
Average $/SQFT (FS, Sold)2 Years (Monthly) 01/01/13 - 01/31/15
Market Dynamics Referred Realty Group
#
FOR SALE
SQFTPeriod$/Avg
SQFTTime
Avg $
UNDER CONTRACT
# Avg $Avg
SQFT$/
SQFT
SOLD EXPIRED NEW LISTINGS
# # #Avg $ Avg $ Avg $Avg
SQFT$/
SQFTAvg
SQFT$/
SQFTAvg
SQFT$/
SQFT
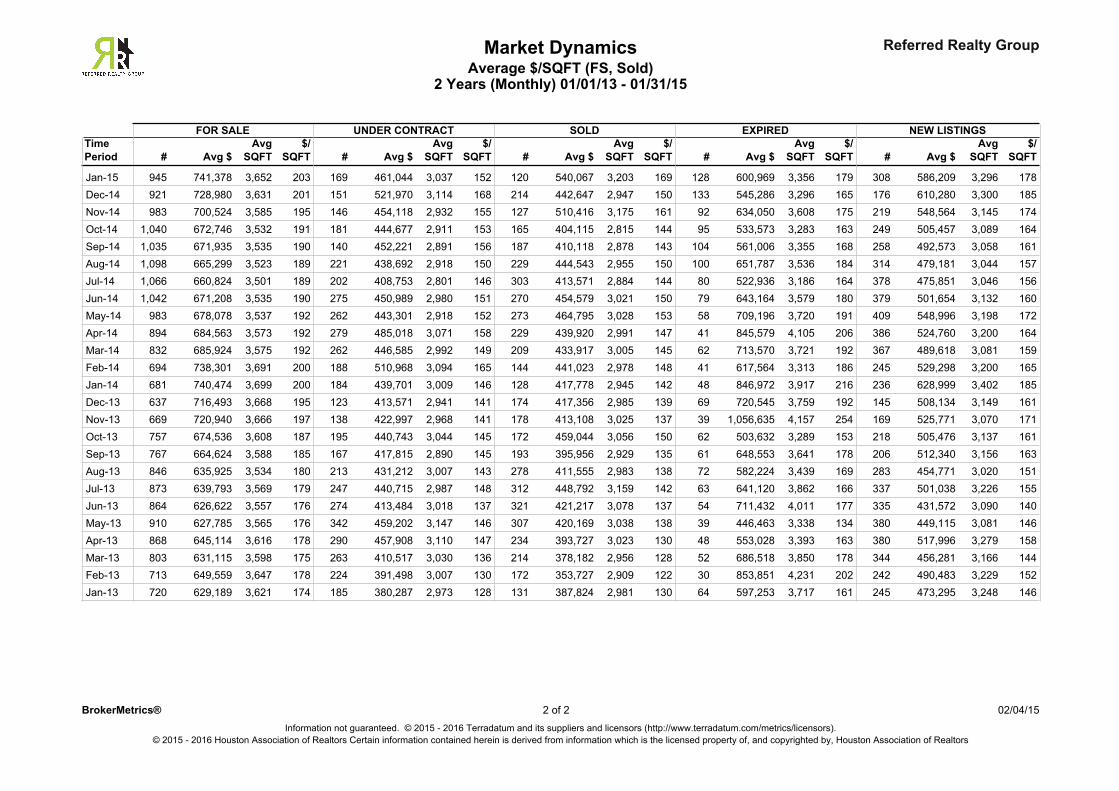
203Jan-15 945 3,652741,378 169 461,044 3,037 152 120 128 308540,067 600,969 586,2093,203 169 3,356 179 3,296 178201Dec-14 921 3,631728,980 151 521,970 3,114 168 214 133 176442,647 545,286 610,2802,947 150 3,296 165 3,300 185195Nov-14 983 3,585700,524 146 454,118 2,932 155 127 92 219510,416 634,050 548,5643,175 161 3,608 175 3,145 174191Oct-14 1,040 3,532672,746 181 444,677 2,911 153 165 95 249404,115 533,573 505,4572,815 144 3,283 163 3,089 164190Sep-14 1,035 3,535671,935 140 452,221 2,891 156 187 104 258410,118 561,006 492,5732,878 143 3,355 168 3,058 161189Aug-14 1,098 3,523665,299 221 438,692 2,918 150 229 100 314444,543 651,787 479,1812,955 150 3,536 184 3,044 157189Jul-14 1,066 3,501660,824 202 408,753 2,801 146 303 80 378413,571 522,936 475,8512,884 144 3,186 164 3,046 156190Jun-14 1,042 3,535671,208 275 450,989 2,980 151 270 79 379454,579 643,164 501,6543,021 150 3,579 180 3,132 160192May-14 983 3,537678,078 262 443,301 2,918 152 273 58 409464,795 709,196 548,9963,028 153 3,720 191 3,198 172192Apr-14 894 3,573684,563 279 485,018 3,071 158 229 41 386439,920 845,579 524,7602,991 147 4,105 206 3,200 164192Mar-14 832 3,575685,924 262 446,585 2,992 149 209 62 367433,917 713,570 489,6183,005 145 3,721 192 3,081 159200Feb-14 694 3,691738,301 188 510,968 3,094 165 144 41 245441,023 617,564 529,2982,978 148 3,313 186 3,200 165200Jan-14 681 3,699740,474 184 439,701 3,009 146 128 48 236417,778 846,972 628,9992,945 142 3,917 216 3,402 185195Dec-13 637 3,668716,493 123 413,571 2,941 141 174 69 145417,356 720,545 508,1342,985 139 3,759 192 3,149 161197Nov-13 669 3,666720,940 138 422,997 2,968 141 178 39 169413,108 1,056,635 525,7713,025 137 4,157 254 3,070 171187Oct-13 757 3,608674,536 195 440,743 3,044 145 172 62 218459,044 503,632 505,4763,056 150 3,289 153 3,137 161185Sep-13 767 3,588664,624 167 417,815 2,890 145 193 61 206395,956 648,553 512,3402,929 135 3,641 178 3,156 163180Aug-13 846 3,534635,925 213 431,212 3,007 143 278 72 283411,555 582,224 454,7712,983 138 3,439 169 3,020 151179Jul-13 873 3,569639,793 247 440,715 2,987 148 312 63 337448,792 641,120 501,0383,159 142 3,862 166 3,226 155176Jun-13 864 3,557626,622 274 413,484 3,018 137 321 54 335421,217 711,432 431,5723,078 137 4,011 177 3,090 140176May-13 910 3,565627,785 342 459,202 3,147 146 307 39 380420,169 446,463 449,1153,038 138 3,338 134 3,081 146178Apr-13 868 3,616645,114 290 457,908 3,110 147 234 48 380393,727 553,028 517,9963,023 130 3,393 163 3,279 158175Mar-13 803 3,598631,115 263 410,517 3,030 136 214 52 344378,182 686,518 456,2812,956 128 3,850 178 3,166 144178Feb-13 713 3,647649,559 224 391,498 3,007 130 172 30 242353,727 853,851 490,4832,909 122 4,231 202 3,229 152174Jan-13 720 3,621629,189 185 380,287 2,973 128 131 64 245387,824 597,253 473,2952,981 130 3,717 161 3,248 146
© 2015 - 2016 Houston Association of Realtors Certain information contained herein is derived from information which is the licensed property of, and copyrighted by, Houston Association of Realtors
2 02/04/152 ofBrokerMetrics®Information not guaranteed. © 2015 - 2016 Terradatum and its suppliers and licensors (http://www.terradatum.com/metrics/licensors).
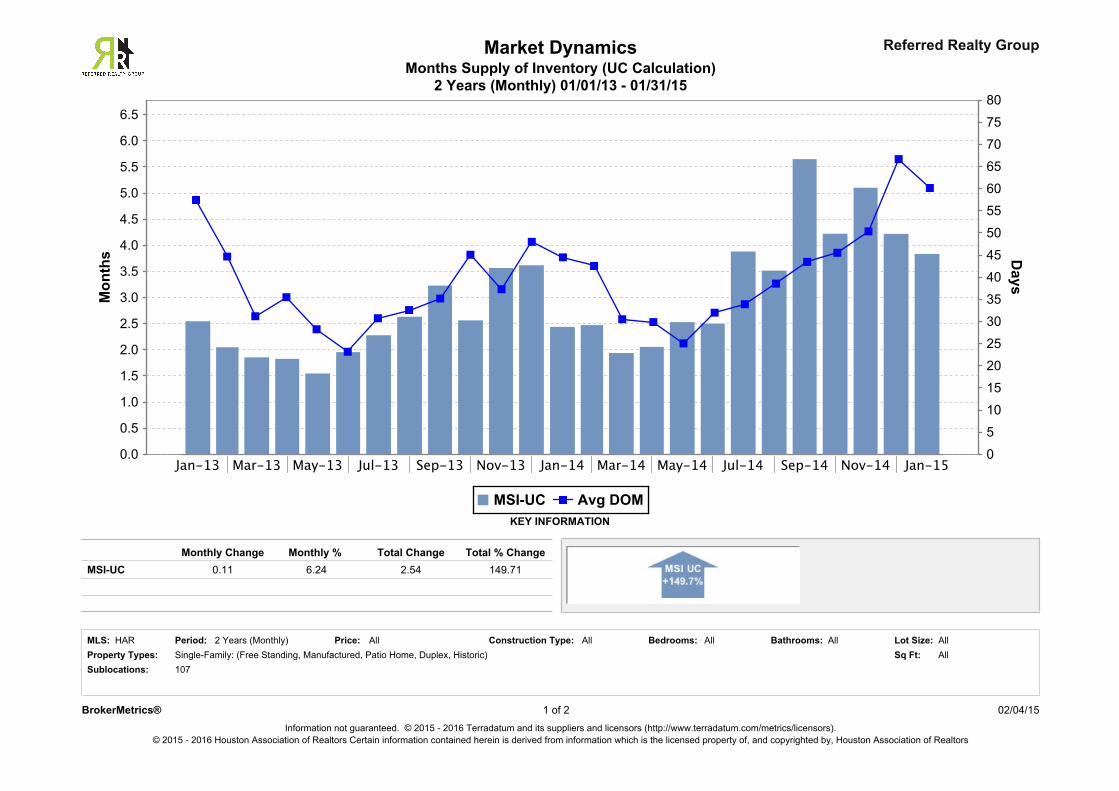
Months Supply of Inventory (UC Calculation)Market Dynamics
2 Years (Monthly) 01/01/13 - 01/31/15
Referred Realty Group
Sublocations:
149.71
Price:HAR Bedrooms:Period:
Monthly % MSI-UC
2 Years (Monthly)
107
6.24
Single-Family: (Free Standing, Manufactured, Patio Home, Duplex, Historic)
Total % Change
Property Types:
KEY INFORMATION
AllAll Lot Size:All
2.54Monthly Change
0.11Total Change
Sq Ft:AllAll Bathrooms:MLS: AllConstruction Type:
Information not guaranteed. © 2015 - 2016 Terradatum and its suppliers and licensors (http://www.terradatum.com/metrics/licensors).
BrokerMetrics® 1 of 2
© 2015 - 2016 Houston Association of Realtors Certain information contained herein is derived from information which is the licensed property of, and copyrighted by, Houston Association of Realtors
02/04/15
MSI-UC Avg DOM
Jan-13 Mar-13 May-13 Jul-13 Sep-13 Nov-13 Jan-14 Mar-14 May-14 Jul-14 Sep-14 Nov-14 Jan-150.0
0.5
1.0
1.5
2.0
2.5
3.0
3.5
4.0
4.5
5.0
5.5
6.0
6.5M
onth
s
0
5
10
15
20
25
30
35
40
45
50
55
60
65
70
75
80D
ays
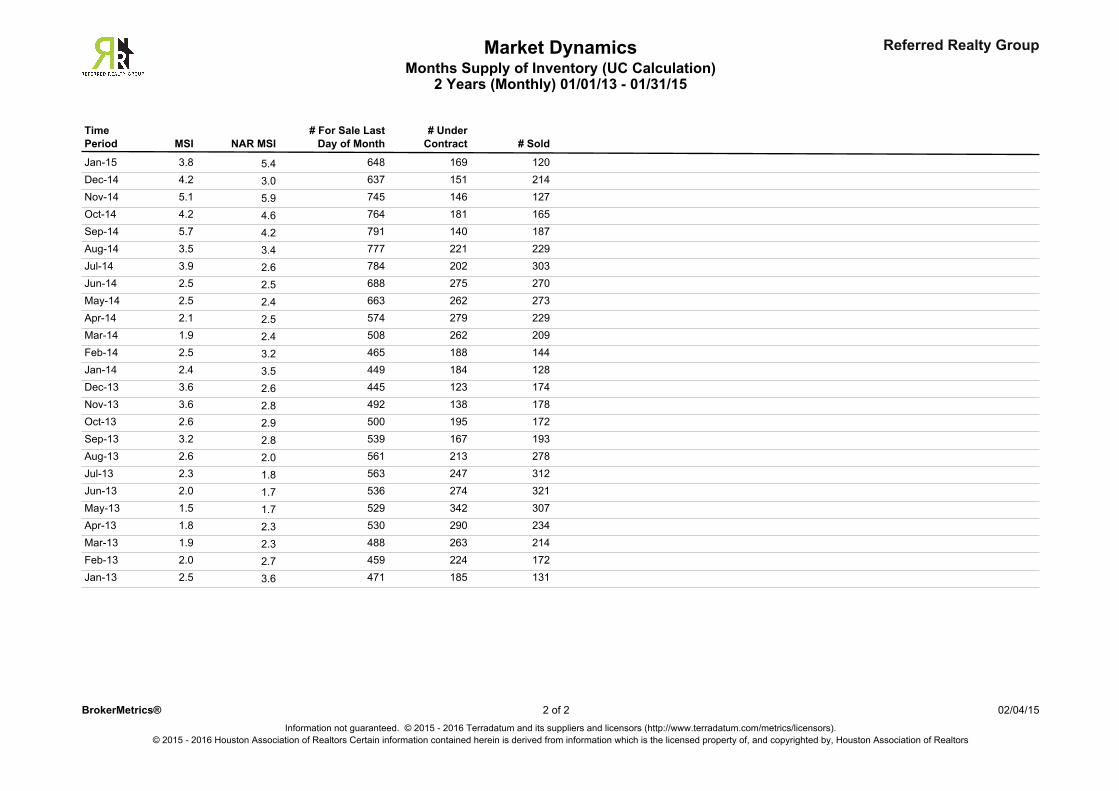
Referred Realty GroupMarket DynamicsMonths Supply of Inventory (UC Calculation)
2 Years (Monthly) 01/01/13 - 01/31/15
Period NAR MSI # SoldMSI# For Sale Last
Day of Month# Under
ContractTime
5.4Jan-15 169 1206483.8
3.0Dec-14 151 2146374.2
5.9Nov-14 146 1277455.1
4.6Oct-14 181 1657644.2
4.2Sep-14 140 1877915.7
3.4Aug-14 221 2297773.5
2.6Jul-14 202 3037843.9
2.5Jun-14 275 2706882.5
2.4May-14 262 2736632.5
2.5Apr-14 279 2295742.1
2.4Mar-14 262 2095081.9
3.2Feb-14 188 1444652.5
3.5Jan-14 184 1284492.4
2.6Dec-13 123 1744453.6
2.8Nov-13 138 1784923.6
2.9Oct-13 195 1725002.6
2.8Sep-13 167 1935393.2
2.0Aug-13 213 2785612.6
1.8Jul-13 247 3125632.3
1.7Jun-13 274 3215362.0
1.7May-13 342 3075291.5
2.3Apr-13 290 2345301.8
2.3Mar-13 263 2144881.9
2.7Feb-13 224 1724592.0
3.6Jan-13 185 1314712.5
2
© 2015 - 2016 Houston Association of Realtors Certain information contained herein is derived from information which is the licensed property of, and copyrighted by, Houston Association of Realtors
02/04/15Information not guaranteed. © 2015 - 2016 Terradatum and its suppliers and licensors (http://www.terradatum.com/metrics/licensors).
BrokerMetrics® 2 of
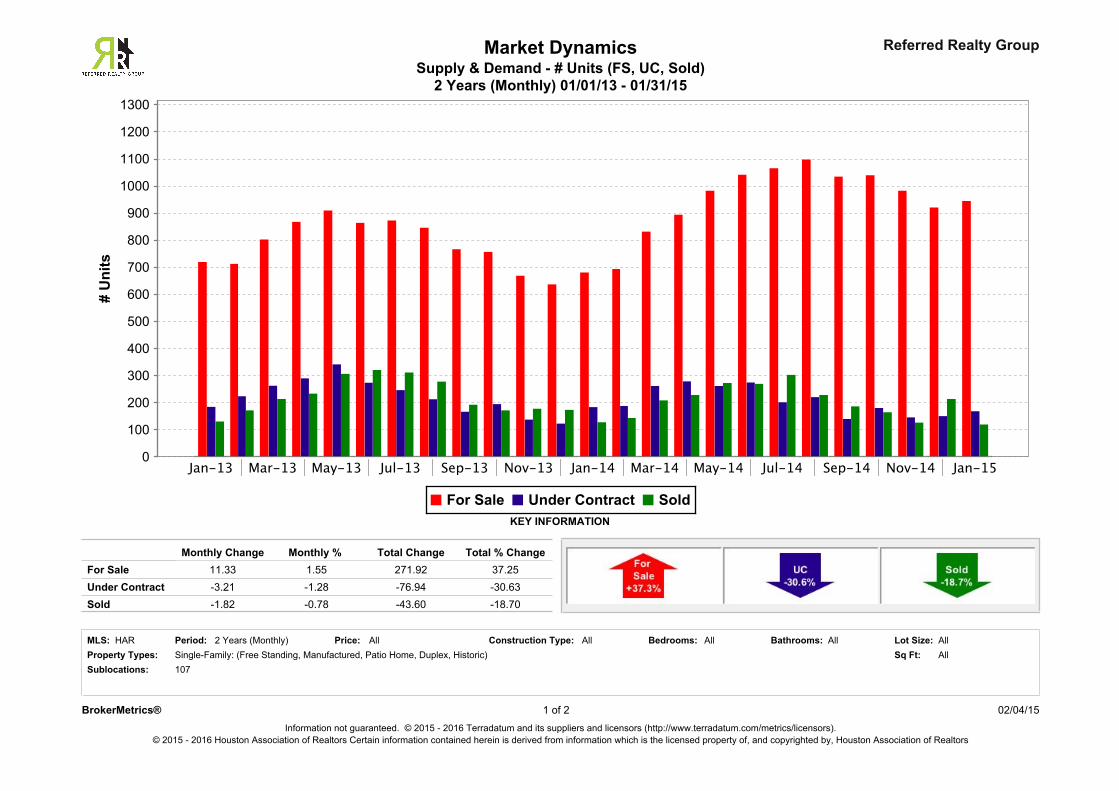
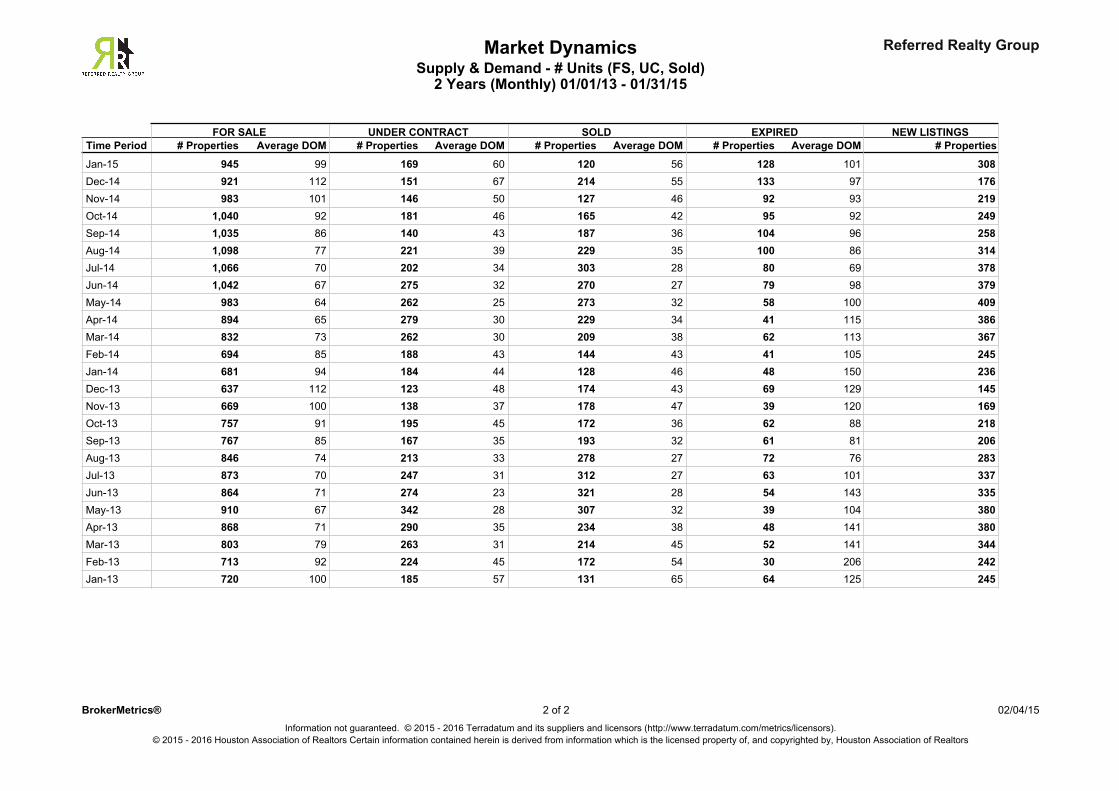
Market DynamicsSupply & Demand - # Units (FS, UC, Sold)
2 Years (Monthly) 01/01/13 - 01/31/15
Referred Realty Group
Price:
1.55
AllAll All
-1.28271.92
Property Types:HAR
Under Contract-1.82
For Sale
MLS: All
-3.21
Bathrooms:
-0.78
11.33
Sold
All
-30.63-76.94
Construction Type:
Total Change
Sq Ft:
Monthly Change
2 Years (Monthly)
Sublocations:
All
37.25
Lot Size:Period:
-18.70
Monthly %
Bedrooms:
KEY INFORMATION
Total % Change
-43.60
Single-Family: (Free Standing, Manufactured, Patio Home, Duplex, Historic)107
Information not guaranteed. © 2015 - 2016 Terradatum and its suppliers and licensors (http://www.terradatum.com/metrics/licensors).© 2015 - 2016 Houston Association of Realtors Certain information contained herein is derived from information which is the licensed property of, and copyrighted by, Houston Association of Realtors
1 ofBrokerMetrics® 2 02/04/15
For Sale Under Contract Sold
Jan-13 Mar-13 May-13 Jul-13 Sep-13 Nov-13 Jan-14 Mar-14 May-14 Jul-14 Sep-14 Nov-14 Jan-150
100
200
300
400
500
600
700
800
900
1000
1100
1200
1300#
Uni
ts
Supply & Demand - # Units (FS, UC, Sold)2 Years (Monthly) 01/01/13 - 01/31/15
Market Dynamics Referred Realty Group
# Properties # PropertiesAverage DOM# PropertiesSOLD
# PropertiesFOR SALE
Average DOM Average DOMUNDER CONTRACT
Average DOMNEW LISTINGS
# PropertiesEXPIRED
Time Period
99 308Jan-15 10156 12860 120169945112 176Dec-14 9755 13367 214151921101 219Nov-14 9346 9250 127146983
92 249Oct-14 9242 9546 1651811,04086 258Sep-14 9636 10443 1871401,03577 314Aug-14 8635 10039 2292211,09870 378Jul-14 6928 8034 3032021,06667 379Jun-14 9827 7932 2702751,04264 409May-14 10032 5825 27326298365 386Apr-14 11534 4130 22927989473 367Mar-14 11338 6230 20926283285 245Feb-14 10543 4143 14418869494 236Jan-14 15046 4844 128184681
112 145Dec-13 12943 6948 174123637100 169Nov-13 12047 3937 178138669
91 218Oct-13 8836 6245 17219575785 206Sep-13 8132 6135 19316776774 283Aug-13 7627 7233 27821384670 337Jul-13 10127 6331 31224787371 335Jun-13 14328 5423 32127486467 380May-13 10432 3928 30734291071 380Apr-13 14138 4835 23429086879 344Mar-13 14145 5231 21426380392 242Feb-13 20654 3045 172224713
100 245Jan-13 12565 6457 131185720
02/04/15 2Information not guaranteed. © 2015 - 2016 Terradatum and its suppliers and licensors (http://www.terradatum.com/metrics/licensors).
2 ofBrokerMetrics®
© 2015 - 2016 Houston Association of Realtors Certain information contained herein is derived from information which is the licensed property of, and copyrighted by, Houston Association of Realtors