
The Woodlands TX Home Sales Market Report
14
The Home Sales Real Estate Report The Woodlands | August, 2015 Lis?ng Inventory Month By Month Home Sales Month By Month Average Sold Price / Median Sold Price – Month By Month Average Price Per Square Foot – Month By Month Average Days On Market – Month By Month Months Supply of For Sale Inventory – Month By Month Sold Price To List Price % 9000 Forest Crossing Drive | The Woodlands TX 77381 | 281-367-3531 281-367-3531
-
Upload
cheri-young -
Category
Real Estate
-
view
259 -
download
4
Transcript of The Woodlands TX Home Sales Market Report

The$Home$Sales$Real$Estate$Report$$The$Woodlands$|$August,$2015$Lis?ng$Inventory$Month$By$Month$
Home$Sales$Month$By$Month$$
Average$Sold$Price$/$Median$Sold$Price$–$Month$By$Month$
Average$Price$Per$Square$Foot$–$Month$By$Month$
Average$Days$On$Market$–$Month$By$Month$
Months$Supply$of$For$Sale$Inventory$–$Month$By$Month$$
Sold$Price$To$List$Price$%$
$
$
9000 Forest Crossing Drive | The Woodlands TX 77381 | 281-367-3531
281-367-3531
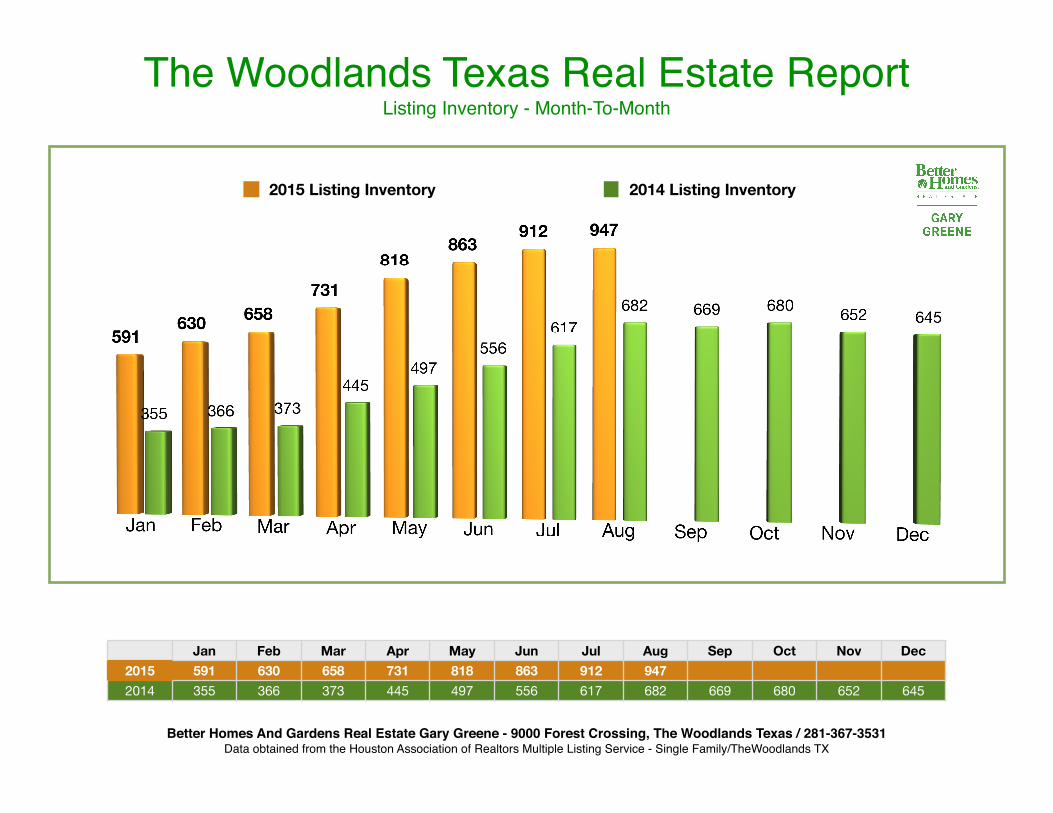
The Woodlands Texas Real Estate ReportListing Inventory - Month-To-Month
Jan Feb Mar Apr May Jun Jul Aug Sep Oct Nov Dec2015 591 630 658 731 818 863 912 9472014 355 366 373 445 497 556 617 682 669 680 652 645
Better Homes And Gardens Real Estate Gary Greene - 9000 Forest Crossing, The Woodlands Texas / 281-367-3531Data obtained from the Houston Association of Realtors Multiple Listing Service - Single Family/TheWoodlands TX
2015 Listing Inventory 2014 Listing Inventory
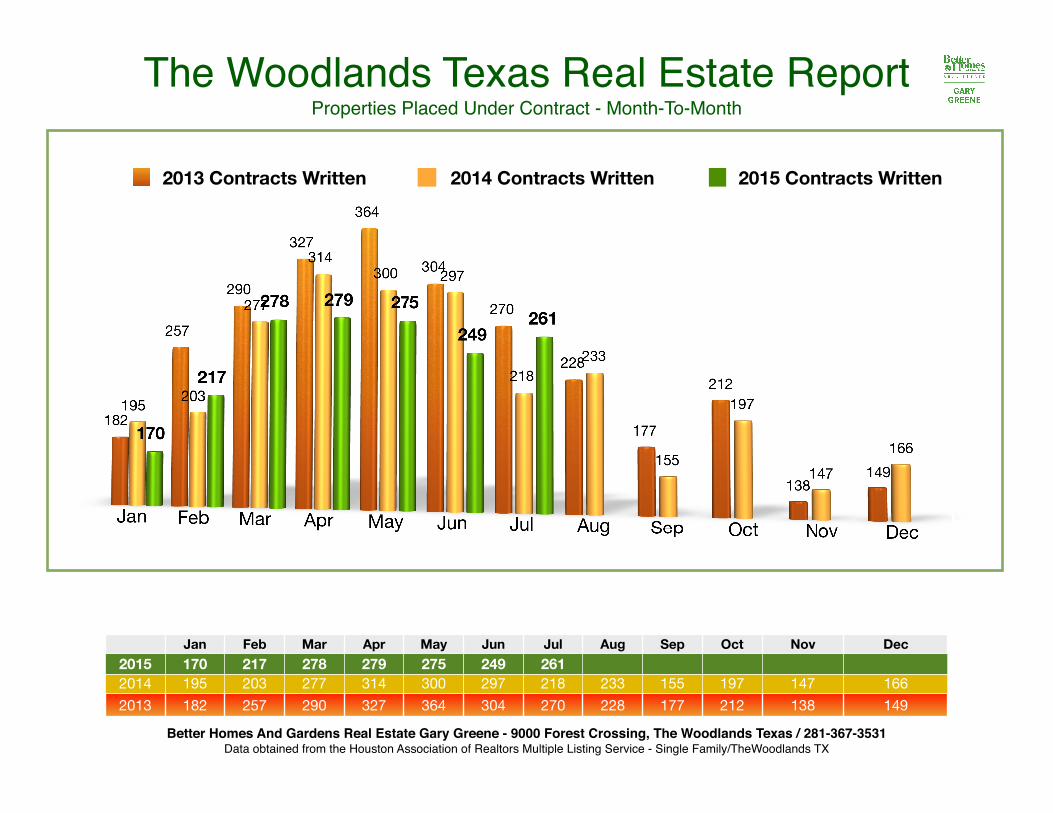
The Woodlands Texas Real Estate ReportProperties Placed Under Contract - Month-To-Month
Jan Feb Mar Apr May Jun Jul Aug Sep Oct Nov Dec2015 170 217 278 279 275 249 2612014 195 203 277 314 300 297 218 233 155 197 147 1662013 182 257 290 327 364 304 270 228 177 212 138 149
Better Homes And Gardens Real Estate Gary Greene - 9000 Forest Crossing, The Woodlands Texas / 281-367-3531Data obtained from the Houston Association of Realtors Multiple Listing Service - Single Family/TheWoodlands TX
2013 Contracts Written 2014 Contracts Written 2015 Contracts Written
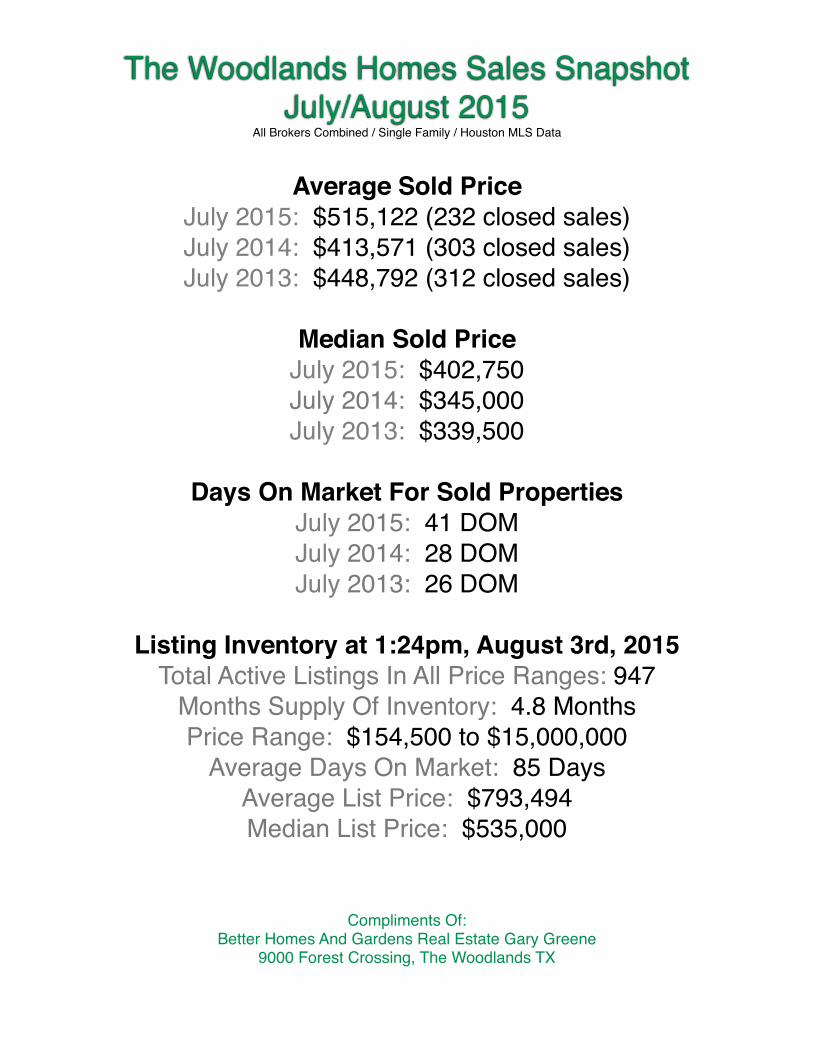
The Woodlands Homes Sales SnapshotJuly/August 2015
All Brokers Combined / Single Family / Houston MLS Data
Average Sold PriceJuly 2015: $515,122 (232 closed sales)July 2014: $413,571 (303 closed sales)July 2013: $448,792 (312 closed sales)
Median Sold PriceJuly 2015: $402,750July 2014: $345,000July 2013: $339,500
Days On Market For Sold PropertiesJuly 2015: 41 DOMJuly 2014: 28 DOMJuly 2013: 26 DOM
Listing Inventory at 1:24pm, August 3rd, 2015Total Active Listings In All Price Ranges: 947
Months Supply Of Inventory: 4.8 MonthsPrice Range: $154,500 to $15,000,000
Average Days On Market: 85 DaysAverage List Price: $793,494Median List Price: $535,000
Compliments Of:Better Homes And Gardens Real Estate Gary Greene
9000 Forest Crossing, The Woodlands TX
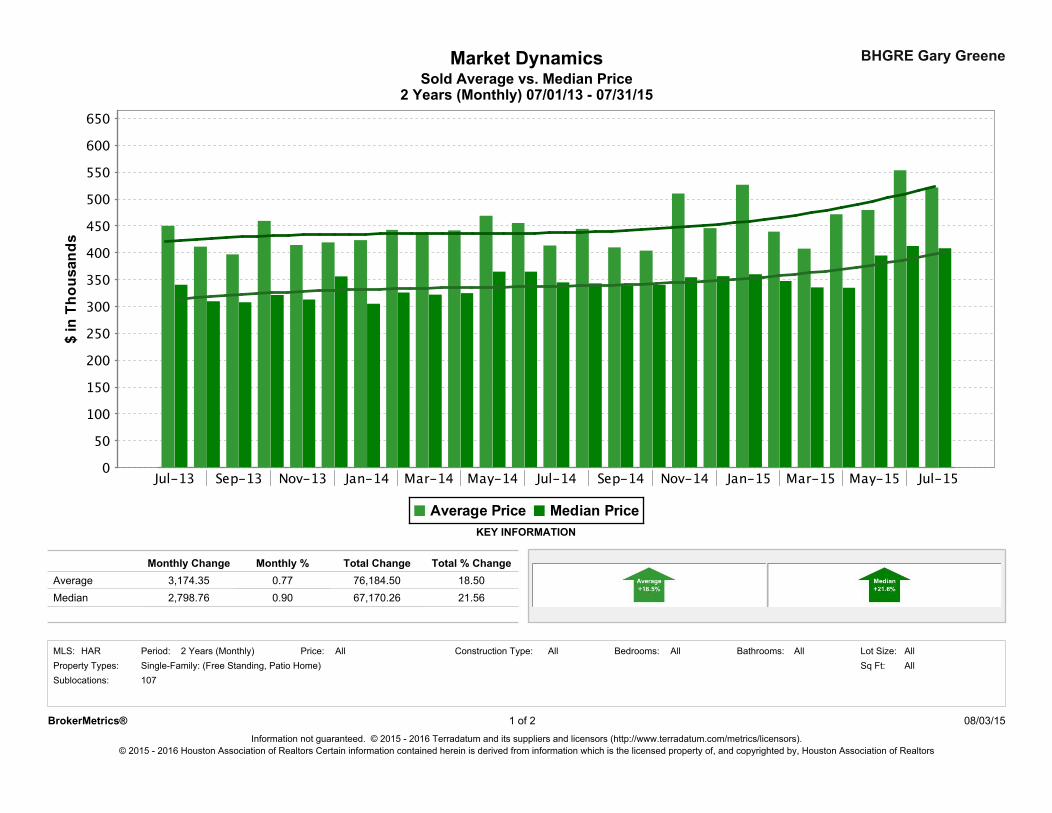
KEY INFORMATION
2 Years (Monthly) 07/01/13 - 07/31/15
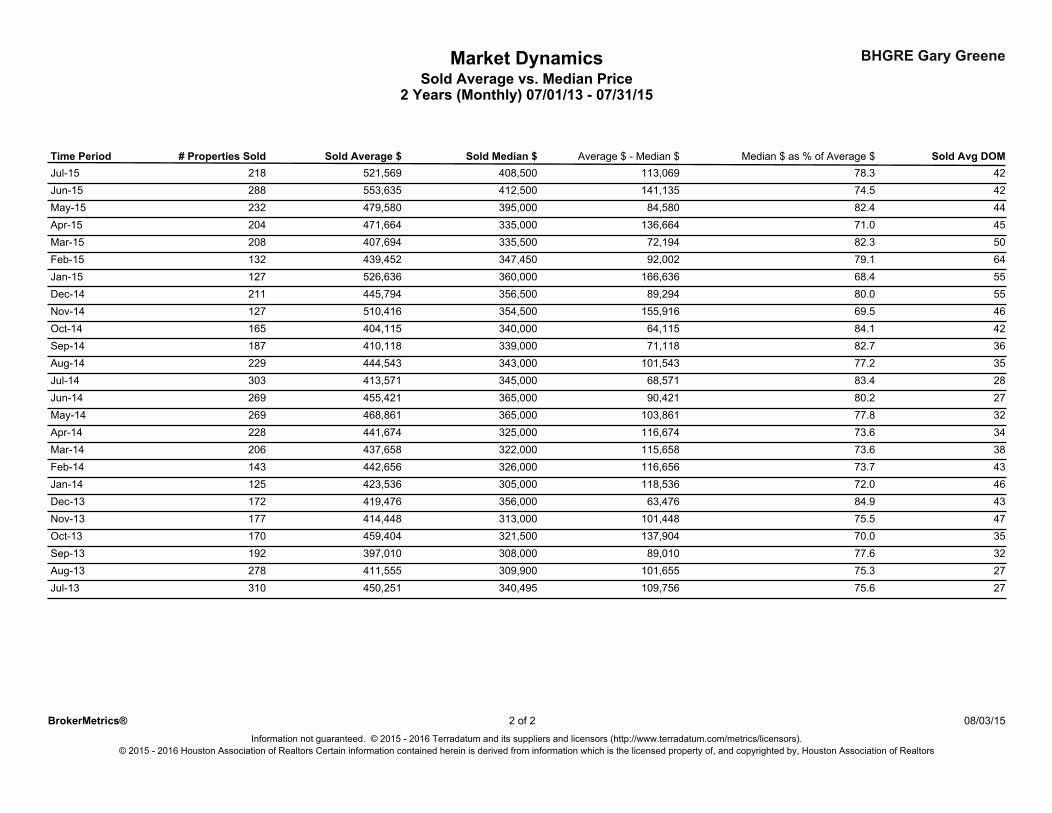
Market Dynamics BHGRE Gary GreeneSold Average vs. Median Price
Monthly % Total % Change
21.560.77
Monthly Change
2,798.76Median
Total ChangeAverage 3,174.35 76,184.50 18.50
67,170.260.90
Sublocations:All
Bathrooms:Single-Family: (Free Standing, Patio Home) Sq Ft:
HAR AllAll AllAllAll Lot Size:Bedrooms:Property Types:
107
2 Years (Monthly) Construction Type:Price:Period:MLS:
08/03/15BrokerMetrics®Information not guaranteed. © 2015 - 2016 Terradatum and its suppliers and licensors (http://www.terradatum.com/metrics/licensors).
© 2015 - 2016 Houston Association of Realtors Certain information contained herein is derived from information which is the licensed property of, and copyrighted by, Houston Association of Realtors
1 of 2
BHGRE Gary Greene
2 Years (Monthly) 07/01/13 - 07/31/15
Market DynamicsSold Average vs. Median Price
Time Period # Properties Sold Sold Average $ Sold Median $ Sold Avg DOMAverage $ - Median $ Median $ as % of Average $218Jul-15 521,569 78.3408,500 113,069 42288Jun-15 553,635 74.5412,500 141,135 42232May-15 479,580 82.4395,000 84,580 44204Apr-15 471,664 71.0335,000 136,664 45208Mar-15 407,694 82.3335,500 72,194 50132Feb-15 439,452 79.1347,450 92,002 64127Jan-15 526,636 68.4360,000 166,636 55211Dec-14 445,794 80.0356,500 89,294 55127Nov-14 510,416 69.5354,500 155,916 46165Oct-14 404,115 84.1340,000 64,115 42187Sep-14 410,118 82.7339,000 71,118 36229Aug-14 444,543 77.2343,000 101,543 35303Jul-14 413,571 83.4345,000 68,571 28269Jun-14 455,421 80.2365,000 90,421 27269May-14 468,861 77.8365,000 103,861 32228Apr-14 441,674 73.6325,000 116,674 34206Mar-14 437,658 73.6322,000 115,658 38143Feb-14 442,656 73.7326,000 116,656 43125Jan-14 423,536 72.0305,000 118,536 46172Dec-13 419,476 84.9356,000 63,476 43177Nov-13 414,448 75.5313,000 101,448 47170Oct-13 459,404 70.0321,500 137,904 35192Sep-13 397,010 77.6308,000 89,010 32278Aug-13 411,555 75.3309,900 101,655 27310Jul-13 450,251 75.6340,495 109,756 27
© 2015 - 2016 Houston Association of Realtors Certain information contained herein is derived from information which is the licensed property of, and copyrighted by, Houston Association of Realtors
2 08/03/152 ofBrokerMetrics®Information not guaranteed. © 2015 - 2016 Terradatum and its suppliers and licensors (http://www.terradatum.com/metrics/licensors).
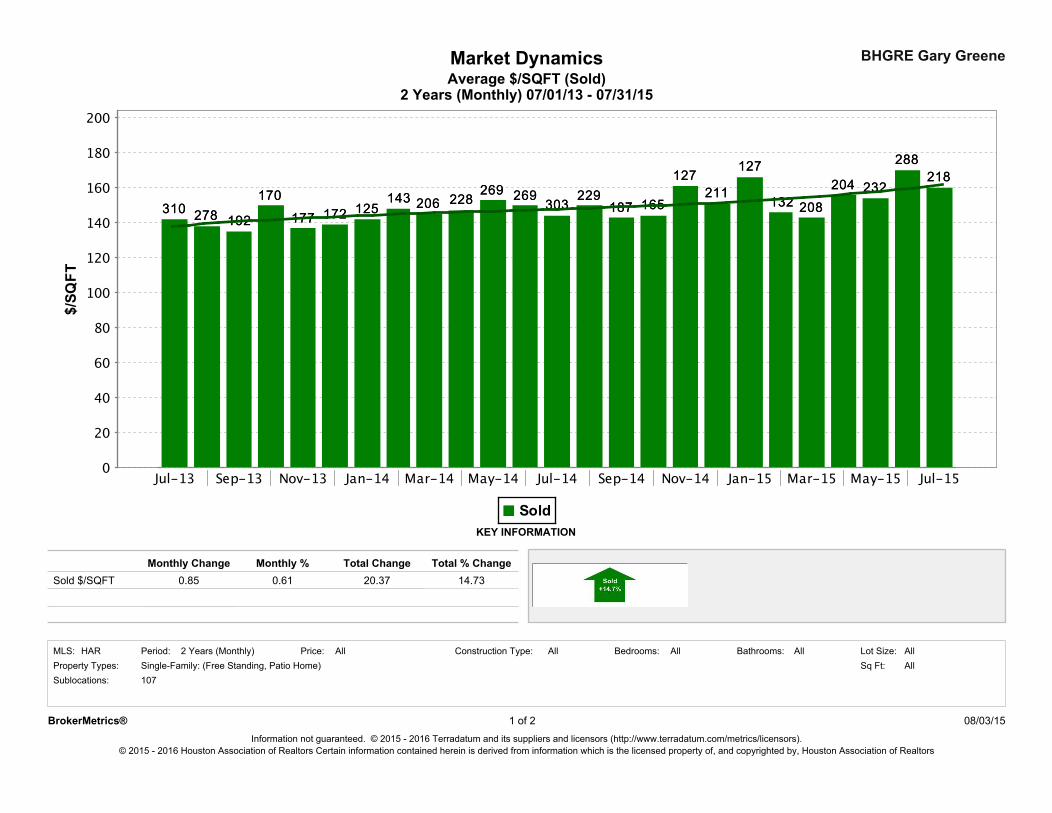
Market DynamicsAverage $/SQFT (Sold)
2 Years (Monthly) 07/01/13 - 07/31/15
BHGRE Gary Greene
Price:
0.61
AllAll All
20.37
Property Types:HAR
Sold $/SQFT
MLS: AllBathrooms:
0.85
All Construction Type:
Total Change
Sq Ft:
Monthly Change
2 Years (Monthly)
Sublocations:
All
14.73
Lot Size:Period:
Monthly %
Bedrooms:
KEY INFORMATION
Total % Change
Single-Family: (Free Standing, Patio Home)107
08/03/15BrokerMetrics®Information not guaranteed. © 2015 - 2016 Terradatum and its suppliers and licensors (http://www.terradatum.com/metrics/licensors).
© 2015 - 2016 Houston Association of Realtors Certain information contained herein is derived from information which is the licensed property of, and copyrighted by, Houston Association of Realtors
1 of 2
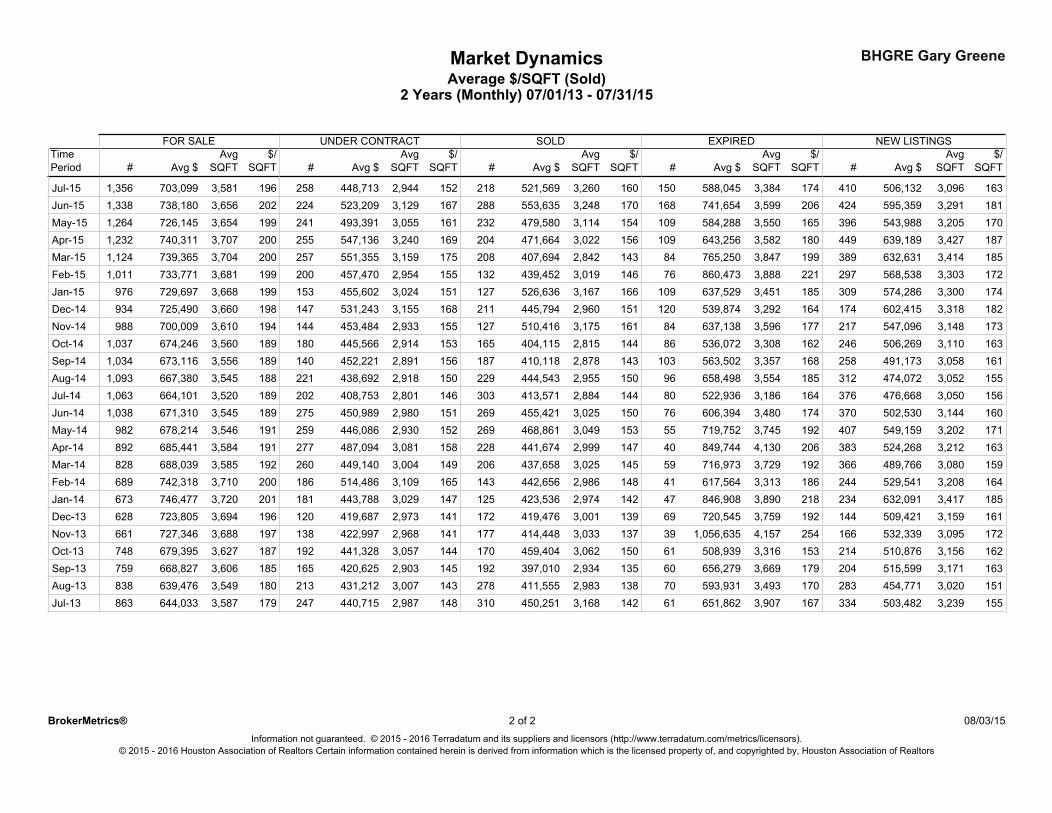
Average $/SQFT (Sold)2 Years (Monthly) 07/01/13 - 07/31/15
Market Dynamics BHGRE Gary Greene
#
FOR SALE
SQFTPeriod$/Avg
SQFTTime
Avg $
UNDER CONTRACT
# Avg $Avg
SQFT$/
SQFT
SOLD EXPIRED NEW LISTINGS
# # #Avg $ Avg $ Avg $Avg
SQFT$/
SQFTAvg
SQFT$/
SQFTAvg
SQFT$/
SQFT
196Jul-15 1,356 3,581703,099 258 448,713 2,944 152 218 150 410521,569 588,045 506,1323,260 160 3,384 174 3,096 163202Jun-15 1,338 3,656738,180 224 523,209 3,129 167 288 168 424553,635 741,654 595,3593,248 170 3,599 206 3,291 181199May-15 1,264 3,654726,145 241 493,391 3,055 161 232 109 396479,580 584,288 543,9883,114 154 3,550 165 3,205 170200Apr-15 1,232 3,707740,311 255 547,136 3,240 169 204 109 449471,664 643,256 639,1893,022 156 3,582 180 3,427 187200Mar-15 1,124 3,704739,365 257 551,355 3,159 175 208 84 389407,694 765,250 632,6312,842 143 3,847 199 3,414 185199Feb-15 1,011 3,681733,771 200 457,470 2,954 155 132 76 297439,452 860,473 568,5383,019 146 3,888 221 3,303 172199Jan-15 976 3,668729,697 153 455,602 3,024 151 127 109 309526,636 637,529 574,2863,167 166 3,451 185 3,300 174198Dec-14 934 3,660725,490 147 531,243 3,155 168 211 120 174445,794 539,874 602,4152,960 151 3,292 164 3,318 182194Nov-14 988 3,610700,009 144 453,484 2,933 155 127 84 217510,416 637,138 547,0963,175 161 3,596 177 3,148 173189Oct-14 1,037 3,560674,246 180 445,566 2,914 153 165 86 246404,115 536,072 506,2692,815 144 3,308 162 3,110 163189Sep-14 1,034 3,556673,116 140 452,221 2,891 156 187 103 258410,118 563,502 491,1732,878 143 3,357 168 3,058 161188Aug-14 1,093 3,545667,380 221 438,692 2,918 150 229 96 312444,543 658,498 474,0722,955 150 3,554 185 3,052 155189Jul-14 1,063 3,520664,101 202 408,753 2,801 146 303 80 376413,571 522,936 476,6682,884 144 3,186 164 3,050 156189Jun-14 1,038 3,545671,310 275 450,989 2,980 151 269 76 370455,421 606,394 502,5303,025 150 3,480 174 3,144 160191May-14 982 3,546678,214 259 446,086 2,930 152 269 55 407468,861 719,752 549,1593,049 153 3,745 192 3,202 171191Apr-14 892 3,584685,441 277 487,094 3,081 158 228 40 383441,674 849,744 524,2682,999 147 4,130 206 3,212 163192Mar-14 828 3,585688,039 260 449,140 3,004 149 206 59 366437,658 716,973 489,7663,025 145 3,729 192 3,080 159200Feb-14 689 3,710742,318 186 514,486 3,109 165 143 41 244442,656 617,564 529,5412,986 148 3,313 186 3,208 164201Jan-14 673 3,720746,477 181 443,788 3,029 147 125 47 234423,536 846,908 632,0912,974 142 3,890 218 3,417 185196Dec-13 628 3,694723,805 120 419,687 2,973 141 172 69 144419,476 720,545 509,4213,001 139 3,759 192 3,159 161197Nov-13 661 3,688727,346 138 422,997 2,968 141 177 39 166414,448 1,056,635 532,3393,033 137 4,157 254 3,095 172187Oct-13 748 3,627679,395 192 441,328 3,057 144 170 61 214459,404 508,939 510,8763,062 150 3,316 153 3,156 162185Sep-13 759 3,606668,827 165 420,625 2,903 145 192 60 204397,010 656,279 515,5992,934 135 3,669 179 3,171 163180Aug-13 838 3,549639,476 213 431,212 3,007 143 278 70 283411,555 593,931 454,7712,983 138 3,493 170 3,020 151179Jul-13 863 3,587644,033 247 440,715 2,987 148 310 61 334450,251 651,862 503,4823,168 142 3,907 167 3,239 155
© 2015 - 2016 Houston Association of Realtors Certain information contained herein is derived from information which is the licensed property of, and copyrighted by, Houston Association of Realtors
2 08/03/152 ofBrokerMetrics®Information not guaranteed. © 2015 - 2016 Terradatum and its suppliers and licensors (http://www.terradatum.com/metrics/licensors).
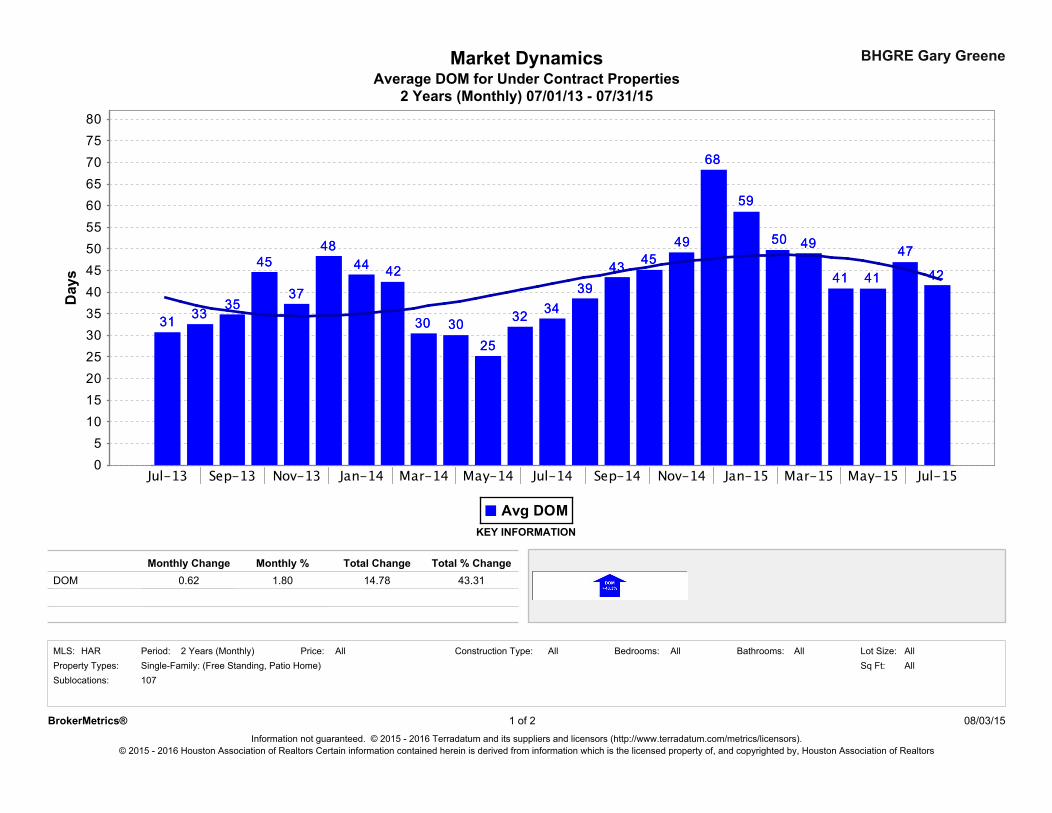
BHGRE Gary GreeneMarket Dynamics
2 Years (Monthly) 07/01/13 - 07/31/15Average DOM for Under Contract Properties
Monthly %0.62
107
Total % Change
Sq Ft:Bathrooms:All All
DOM
Construction Type:
Sublocations:
Period:Property Types:
14.78 43.31Monthly Change
1.80
Lot Size:All
KEY INFORMATION
Single-Family: (Free Standing, Patio Home) AllHAR AllBedrooms:
Total Change
AllMLS: Price:2 Years (Monthly)
Information not guaranteed. © 2015 - 2016 Terradatum and its suppliers and licensors (http://www.terradatum.com/metrics/licensors).
BrokerMetrics® 1 of 2
© 2015 - 2016 Houston Association of Realtors Certain information contained herein is derived from information which is the licensed property of, and copyrighted by, Houston Association of Realtors
08/03/15
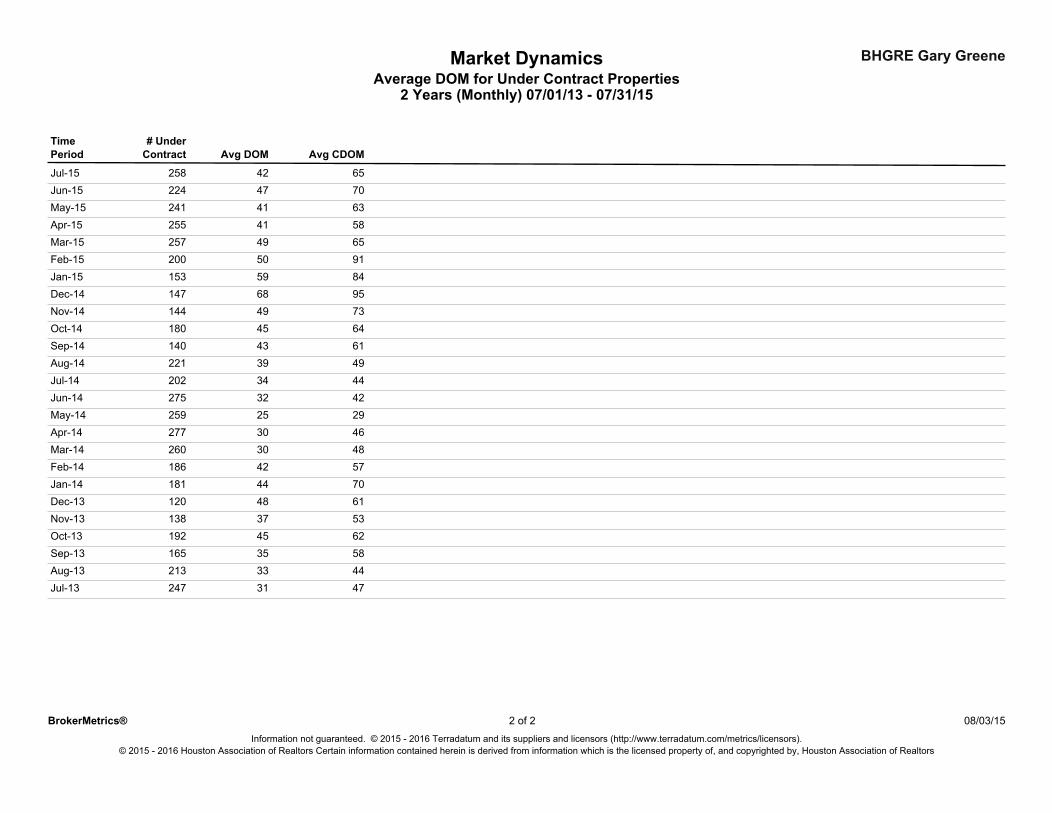
Average DOM for Under Contract PropertiesMarket Dynamics BHGRE Gary Greene
2 Years (Monthly) 07/01/13 - 07/31/15
Period Avg DOM Avg CDOMContract# UnderTime
42Jul-15 6525847Jun-15 7022441May-15 6324141Apr-15 5825549Mar-15 6525750Feb-15 9120059Jan-15 8415368Dec-14 9514749Nov-14 7314445Oct-14 6418043Sep-14 6114039Aug-14 4922134Jul-14 4420232Jun-14 4227525May-14 2925930Apr-14 4627730Mar-14 4826042Feb-14 5718644Jan-14 7018148Dec-13 6112037Nov-13 5313845Oct-13 6219235Sep-13 5816533Aug-13 4421331Jul-13 47247
2
© 2015 - 2016 Houston Association of Realtors Certain information contained herein is derived from information which is the licensed property of, and copyrighted by, Houston Association of Realtors
08/03/15Information not guaranteed. © 2015 - 2016 Terradatum and its suppliers and licensors (http://www.terradatum.com/metrics/licensors).
BrokerMetrics® 2 of
! Page 1 9000 Forest Crossing The Woodlands, Texas 77381 Office: 281.367.3531 or 800.932.7253
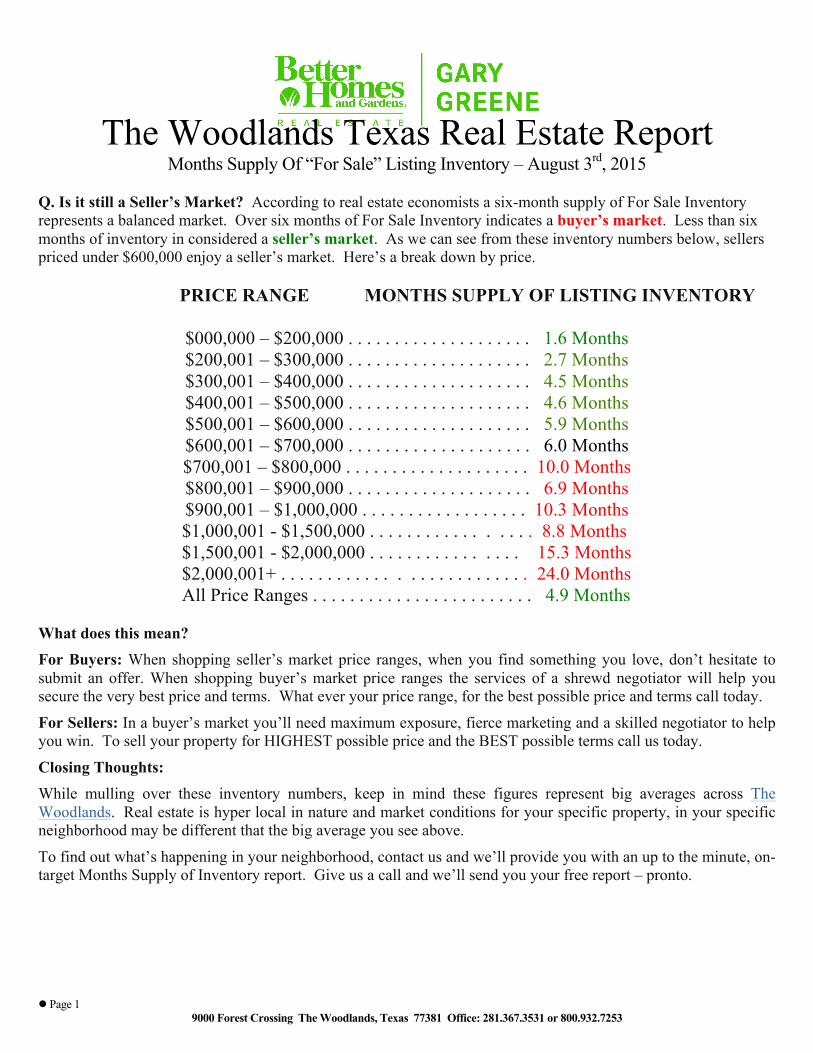
The Woodlands Texas Real Estate Report Months Supply Of “For Sale” Listing Inventory – August 3rd, 2015
Q. Is it still a Seller’s Market? According to real estate economists a six-month supply of For Sale Inventory represents a balanced market. Over six months of For Sale Inventory indicates a buyer’s market. Less than six months of inventory in considered a seller’s market. As we can see from these inventory numbers below, sellers priced under $600,000 enjoy a seller’s market. Here’s a break down by price.
PRICE RANGE MONTHS SUPPLY OF LISTING INVENTORY
$000,000 – $200,000 . . . . . . . . . . . . . . . . . . . . 1.6 Months $200,001 – $300,000 . . . . . . . . . . . . . . . . . . . . 2.7 Months
$300,001 – $400,000 . . . . . . . . . . . . . . . . . . . . 4.5 Months $400,001 – $500,000 . . . . . . . . . . . . . . . . . . . . 4.6 Months $500,001 – $600,000 . . . . . . . . . . . . . . . . . . . . 5.9 Months $600,001 – $700,000 . . . . . . . . . . . . . . . . . . . . 6.0 Months $700,001 – $800,000 . . . . . . . . . . . . . . . . . . . . 10.0 Months $800,001 – $900,000 . . . . . . . . . . . . . . . . . . . . 6.9 Months $900,001 – $1,000,000 . . . . . . . . . . . . . . . . . . 10.3 Months
$1,000,001 - $1,500,000 . . . . . . . . . . . . . . . . . 8.8 Months $1,500,001 - $2,000,000 . . . . . . . . . . . . . . . . 15.3 Months
$2,000,001+ . . . . . . . . . . . . . . . . . . . . . . . . . . 24.0 Months All Price Ranges . . . . . . . . . . . . . . . . . . . . . . . . 4.9 Months
What does this mean? For Buyers: When shopping seller’s market price ranges, when you find something you love, don’t hesitate to submit an offer. When shopping buyer’s market price ranges the services of a shrewd negotiator will help you secure the very best price and terms. What ever your price range, for the best possible price and terms call today.
For Sellers: In a buyer’s market you’ll need maximum exposure, fierce marketing and a skilled negotiator to help you win. To sell your property for HIGHEST possible price and the BEST possible terms call us today.
Closing Thoughts: While mulling over these inventory numbers, keep in mind these figures represent big averages across The Woodlands. Real estate is hyper local in nature and market conditions for your specific property, in your specific neighborhood may be different that the big average you see above.
To find out what’s happening in your neighborhood, contact us and we’ll provide you with an up to the minute, on-target Months Supply of Inventory report. Give us a call and we’ll send you your free report – pronto.
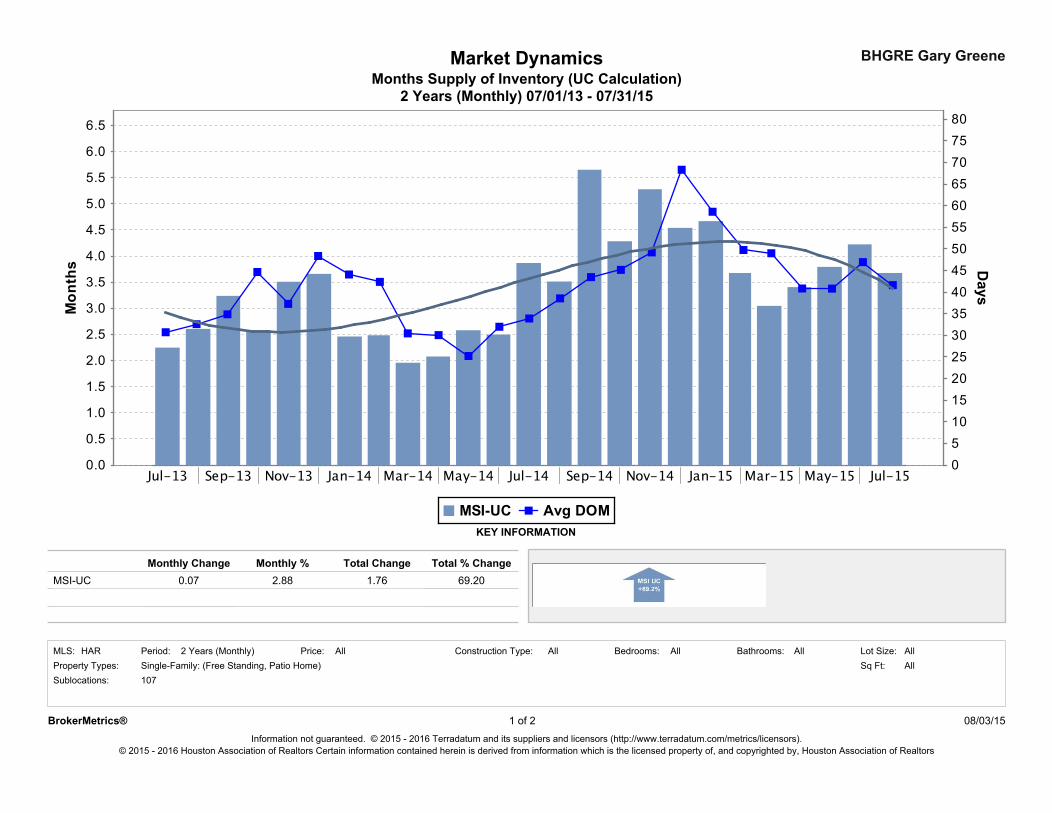
Months Supply of Inventory (UC Calculation)Market Dynamics
2 Years (Monthly) 07/01/13 - 07/31/15
BHGRE Gary Greene
Sublocations:
69.20
Price:HAR Bedrooms:Period:
Monthly %MSI-UC
2 Years (Monthly)
107
2.88
Single-Family: (Free Standing, Patio Home)
Total % Change
Property Types:
KEY INFORMATION
AllAll Lot Size:All
1.76Monthly Change
0.07Total Change
Sq Ft:AllAll Bathrooms:MLS: AllConstruction Type:
Information not guaranteed. © 2015 - 2016 Terradatum and its suppliers and licensors (http://www.terradatum.com/metrics/licensors).
BrokerMetrics® 1 of 2
© 2015 - 2016 Houston Association of Realtors Certain information contained herein is derived from information which is the licensed property of, and copyrighted by, Houston Association of Realtors
08/03/15
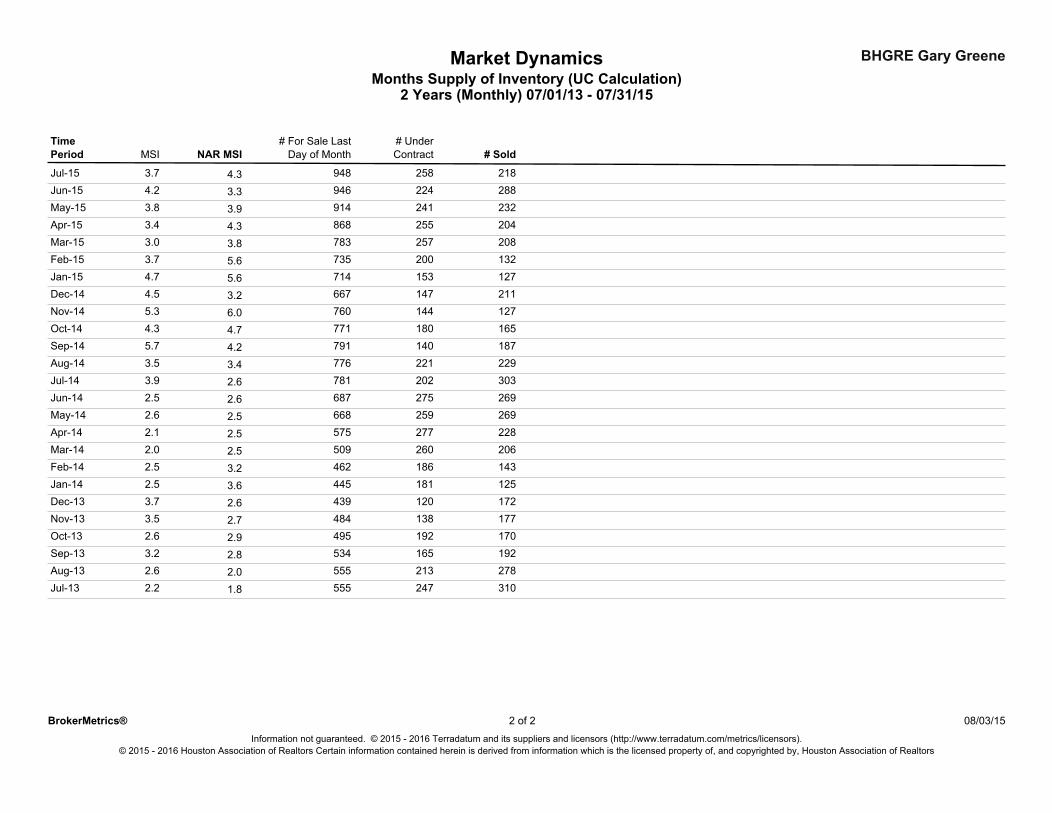
BHGRE Gary GreeneMarket DynamicsMonths Supply of Inventory (UC Calculation)
2 Years (Monthly) 07/01/13 - 07/31/15
Period NAR MSI # SoldMSI# For Sale Last
Day of Month# UnderContract
Time
4.3Jul-15 258 2189483.7
3.3Jun-15 224 2889464.2
3.9May-15 241 2329143.8
4.3Apr-15 255 2048683.4
3.8Mar-15 257 2087833.0
5.6Feb-15 200 1327353.7
5.6Jan-15 153 1277144.7
3.2Dec-14 147 2116674.5
6.0Nov-14 144 1277605.3
4.7Oct-14 180 1657714.3
4.2Sep-14 140 1877915.7
3.4Aug-14 221 2297763.5
2.6Jul-14 202 3037813.9
2.6Jun-14 275 2696872.5
2.5May-14 259 2696682.6
2.5Apr-14 277 2285752.1
2.5Mar-14 260 2065092.0
3.2Feb-14 186 1434622.5
3.6Jan-14 181 1254452.5
2.6Dec-13 120 1724393.7
2.7Nov-13 138 1774843.5
2.9Oct-13 192 1704952.6
2.8Sep-13 165 1925343.2
2.0Aug-13 213 2785552.6
1.8Jul-13 247 3105552.2
2
© 2015 - 2016 Houston Association of Realtors Certain information contained herein is derived from information which is the licensed property of, and copyrighted by, Houston Association of Realtors
08/03/15Information not guaranteed. © 2015 - 2016 Terradatum and its suppliers and licensors (http://www.terradatum.com/metrics/licensors).
BrokerMetrics® 2 of
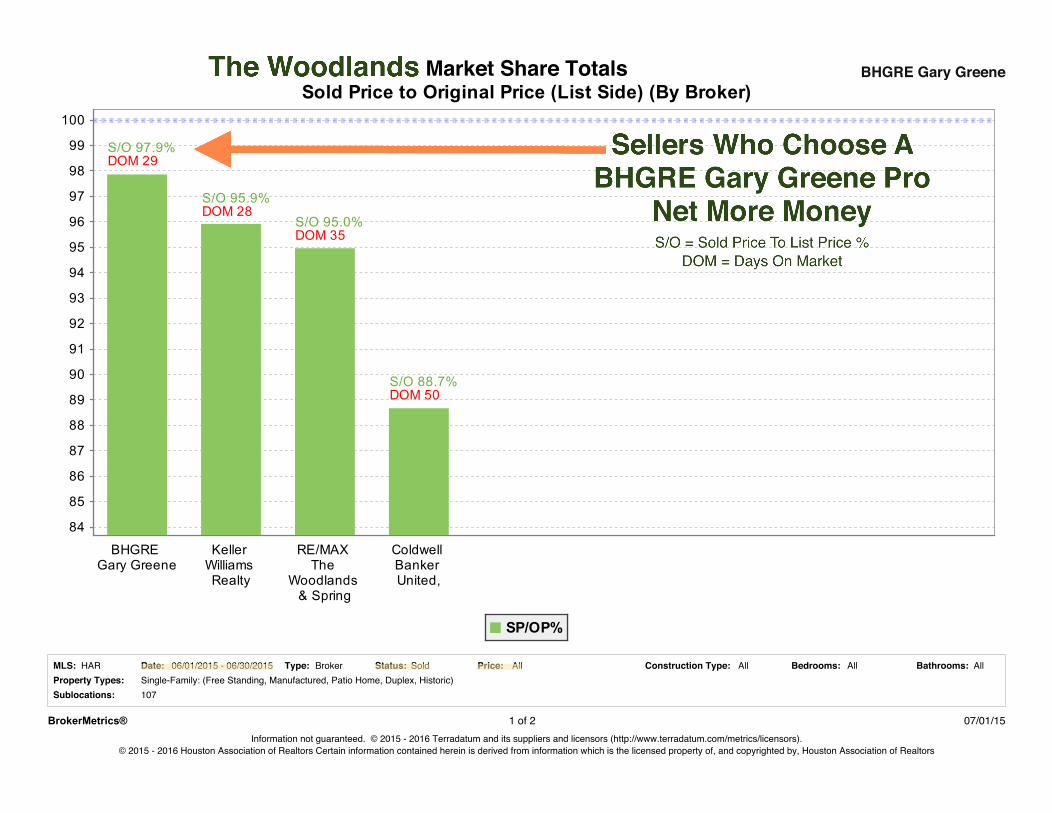
Market Share Totals BHGRE Gary Greene
Sublocations:
Price:Single-Family: (Free Standing, Manufactured, Patio Home, Duplex, Historic)
Bathrooms:Property Types:
AllDate: AllBroker All
107
HAR All06/01/2015 - 06/30/2015 SoldStatus: Construction Type:Type: Bedrooms:MLS:
Information not guaranteed. © 2015 - 2016 Terradatum and its suppliers and licensors (http://www.terradatum.com/metrics/licensors).© 2015 - 2016 Houston Association of Realtors Certain information contained herein is derived from information which is the licensed property of, and copyrighted by, Houston Association of Realtors
2BrokerMetrics® 1 of 07/01/15
Kenneth Brand
Kenneth Brand
Kenneth Brand
Kenneth Brand
Kenneth Brand
Kenneth Brand
The Woodlands
Sellers Who Choose A BHGRE Gary Greene ProNet More Money
S/O = Sold Price To List Price %DOM = Days On Market