Janne Vimpari HEDGE FUND RETURN …jultika.oulu.fi/files/nbnfioulu-201306061554.pdfOULU BUSINESS...
65
OULU BUSINESS SCHOOL Janne Vimpari HEDGE FUND RETURN PREDICTABILITY WITH A RANDOM COEFFICIENT MODEL Master’s Thesis Department of Finance May 2013
Transcript of Janne Vimpari HEDGE FUND RETURN …jultika.oulu.fi/files/nbnfioulu-201306061554.pdfOULU BUSINESS...

OULU BUSINESS SCHOOL
Janne Vimpari
HEDGE FUND RETURN PREDICTABILITY WITH A RANDOM COEFFICIENT
MODEL
Master’s Thesis
Department of Finance
May 2013

UNIVERSITY OF OULU ABSTRACT OF THE MASTER'S THESIS
Oulu Business School
Unit
Department of Finance Author
Vimpari Janne Supervisor
Joenväärä J. Title
Hedge fund return predictability with a random coefficient model Subject
Finance Type of the degree
Master's Thesis Time of publication
May 2013 Number of pages
65 Abstract
The recent academic literature has shown that some hedge funds are persistently able to provide
superior risk-adjusted returns. Naturally such performance arises a question whether the performance
could be predicted. This study proposes a predictive model to forecast future hedge fund returns using
both macroeconomic and fund-specific characteristic predictive variables. With the proposed model I
study in-sample, out-of-sample, and the economic value of predictability.
The model I propose is based on a random coefficient model. It has appealing features to study return
predictability. Contrary to time-series and cross-sectional models the random coefficient model is able
to provide information at the individual hedge fund level and at the same time it takes into account all
the information provided by the cross-section. To my best knowledge the random coefficient model
has never been applied in hedge fund return predictability study before. In the proposed model I use a
set of four economically motivated macroeconomic predictors: the default spread, the market return,
the VIX, and the term spread. As fund-specific characteristic predictors I use the incentive fee, size,
and age of an individual hedge fund. In this study I use a data sample provided by BarclayHedge
database. My final data sample contains altogether over 6000 individual hedge funds from January
1994 to December 2010.
I find that in the cross-section there are funds which are predictable in-sample with the used
macroeconomic variables. The in-sample predictability varies clearly between distinctive strategy
categories. It also has a very asymmetric nature; if there are positively predictable funds in a certain
strategy category, it is unlikely that there are many negatively predictable funds. I study out-of-sample
predictability of my model with portfolio sorting. I find that the decile my model predicts to perform
the best also performs the best out-of-sample. This is actually true for the six highest decile portfolios;
they all perform in the order predicted by my model. I study the economic value of predictability by
constructing a hedge fund portfolio of 40 hedge funds selected by my model. I find that the mean
annual excess return on the hedge fund portfolio selected by my model is 10%, clearly more than
provided by any other strategy I consider except the VIX only strategy. In risk-adjusted basis my
model performs much more poorly than the unconditional strategy which selects the best past
performers.
The results show that the random coefficient model can be used to predict future returns of hedge
funds and possibly future returns of any asset class. The model I develop in this study could be used in
a fund of hedge funds to select hedge funds to invest. However, it seems that the model has still room
for improvements. In any case, the random coefficient model methodology looks promising for
predicting future returns.
Keywords
Hedge fund performance, Predictive regression, Macroeconomic factors Additional information

CONTENTS
1 INTRODUCTION............................................................................................... 5
1.1 Hedge Funds ............................................................................................... 5 1.2 Performance of hedge funds ...................................................................... 6 1.3 Related literature ....................................................................................... 7
1.4 Aim of the study ......................................................................................... 9
2 METHODOLOGY ........................................................................................... 11
2.1 Predictive regressions .............................................................................. 11 2.2 The random coefficient model ................................................................. 12 2.3 Performance and risk measurement ...................................................... 17
2.3.1 The Sharpe ratio .............................................................................. 18 2.3.2 The seven-factor model of Fung and Hsieh .................................... 18 2.3.3 Value-at-Risk .................................................................................. 19
3 DATA ................................................................................................................. 21
3.1 BarclayHedge database ........................................................................... 21 3.2 Hedge fund strategies ............................................................................... 23
3.3 Data biases ................................................................................................ 27
3.3.1 Survivorship bias ............................................................................ 27 3.3.2 Backfill bias .................................................................................... 28
3.3.3 Multi-period sampling bias ............................................................. 28
3.4 Variables ................................................................................................... 29
3.4.1 Macroeconomic variables ............................................................... 29 3.4.2 Fund-specific characteristic variables ............................................. 33
3.5 Summary statistics ................................................................................... 34
4 EMPIRICAL RESULTS .................................................................................. 40
4.1 In-sample predictability........................................................................... 40
4.1.1 In-sample predictability of macroeconomic variables .................... 40
4.1.2 In-sample predictability of fund-specific characteristic variables .. 45
4.2 Out-of-sample predictability ................................................................... 47 4.3 The economic value of predictability...................................................... 54
5 CONCLUSIONS ............................................................................................... 61 REFERENCES ......................................................................................................... 64

FIGURES
Figure 1. Random coefficient model illustration. ..................................................................... 15 Figure 2. Monthly values of VIX volatility index from January 1994 to December 2010. ... 30 Figure 3. Monthly values of the annualized default spread from January 1994 to December
2010. ............................................................................................................................................. 31 Figure 4. Monthly values of the annualized term spread from January 1994 to December
2010. ............................................................................................................................................. 32 Figure 5. Monthly values of excess return on Standard & Poor's 500 index from January
1994 to December 2010. .............................................................................................................. 33 Figure 6. Cumulative excess return on decile portfolios and equally-weighted hedge fund
portfolio from January 1997 to December 2010. ...................................................................... 54 Figure 7. Time variation in cumulative wealth by using different investment strategies and
equally-weighted hedge fund portfolio from January 1997 to December 2010. .................... 59
TABLES
Table 1. Hedge fund industry evolvement from 1994 to 2010 according to BarclayHedge
database. ...................................................................................................................................... 23 Table 2. Descriptive statistics of different hedge fund strategy categories............................. 26 Table 3. Descriptive excess return statistics of hedge funds and hedge fund strategy
categpories. .................................................................................................................................. 35 Table 4. Hedge fund strategy category correlations. ................................................................ 36 Table 5. Descriptive statistics of used macroeconomic predictors. ......................................... 36 Table 6. Descriptive statistics of fund-specific characteristic predictors. .............................. 38 Table 7. Fung and Hsieh (2004) risk factor summary statistics. ............................................. 39 Table 8. In-sample return predictability statistics of macroeconomic predictors. ................ 42 Table 9. In-sample return predictability statistics of fund-specific characteristic predictors.
...................................................................................................................................................... 46 Table 10. Out-of-sample decile portfolio annual excess returns, Sharpe ratios, annual Fung-
Hsieh alphas and information ratios. ........................................................................................ 50 Table 11. Mean annual attrition rates (%) of decile portfolios with multi-predictor strategy
including fund-specific characteristic predictors. .................................................................... 52 Table 12. Out-of-sample performance of all investment strategies. ....................................... 57

5
1 INTRODUCTION
1.1 Hedge Funds
History of hedge funds dates back to year 1949 when sociologist, author, and
financial journalist Alfred W. Jones established his fund which aimed at neutralizing
the effect of overall market movements by buying assets whose price he expected to
rise, selling short assets whose price he expected to decrease and balancing his
portfolio so that general market movements would balance out by the short and long
positions. Jones called his fund as "hedged" to describe how the fund managed the
risk exposure from overall market movements and funds applying the similar
strategy became known as hedge funds.
Within couple of years the number of hedge funds grew from one to 140 but the bear
market of the early 1970s almost extinguished the whole branch regaining interest
again not earlier than until the end of the 1980s. Since 1990s the interest in hedge
funds has increased tremendously. In 1998 the number of hedge funds was estimated
to be around 3500 with altogether up to $1 trillion in assets. The latest numbers show
that now there are around 8500 active hedge funds with over $2.5 trillion in assets.
In finance hedge funds are seen as alternative assets even if their economic function
is exactly the same as mutual funds'. They both gather money from investors who
hope they will receive back their initial investment plus a healthy return. What makes
hedge funds alternative assets whereas mutual funds are considered to be traditional
assets? According to Anson (2002) hedge funds are defined as:
A privately organized investment vehicle that manages a concentrated
portfolio of public securities and derivative instruments on public
securities, that can invest both long and short, and can apply leverage.
The above definition crystallizes several differences between hedge funds and
mutual funds. First, hedge funds are privately organized meaning they are not
allowed to market their products publicly like mutual funds. By this way hedge funds
6
are able to avoid strict financial regulation, but in practice this also means hedge
funds are available only for institutional and other high net worth investors who are
able to bear significant losses. Second, portfolios of hedge funds are much more
concentrated than portfolios of mutual funds. Mutual funds need to follow certain
broad securities benchmarks forcing them to maintain holdings relative to
benchmarks. As hedge funds do not follow any benchmarks they are able to
concentrate their portfolios to securities which they believe will add value. Also
specializing in a certain strategy or sector tend to concentrate the holdings of hedge
funds. Third, hedge funds normally use derivative instruments much broader than
mutual funds and in some strategies derivatives form an essential part. Fourth, hedge
funds are allowed to maintain both long and short positions when as mutual funds are
tied to long-only positions. By maintaining short positions hedge funds do not only
try to maximize their returns but also control their risk. Finally, hedge funds are
known for extensive and practically unlimited usage of leverage when as mutual
funds are limited in the amount of leverage they can employ. Some of the hedge
funds strategies employ leverage up to 10 times their net asset base. (Anson 2002)
Additional distinctive features for hedge funds are their fee structure, share
restrictions, the different strategies they employ, and the hedge fund data availability.
These are handled in more detail later.
1.2 Performance of hedge funds
When selecting a hedge fund for investment the fund manager's prior performance
cannot be ignored and often the prior performance is almost the only available public
information on the fund. But is the past performance indicative of future performance
in case of hedge funds?
The performance of hedge funds and its persistence have been among the most
examined areas in academic hedge fund research and as in so many times in
academic world the results have been mixed.
In early studies of hedge fund performance persistence only short-term persistence is
found. Agarwal and Naik (2000) for example find persistence when the length of

7
return interval is three months, but the persistence decreases when yearly returns are
used. Few years later Baquero, ter Horst, and Verbeek (2005) find exactly similar
results with larger data sample.
However, recent studies show that there are hedge funds which are able to provide
superior risk-adjusted returns persistently. Fung, Hsieh, Naik, and Ramadorai (2008)
use a data sample of over 1600 funds of hedge funds and find a subset of funds of
funds which are able to consistently provide above average risk-adjust returns. They
also find that future performance tend to decrease when funds experience large
capital inflows. This is consistent with Berk and Green (2004) who explains that
investors select hedge funds through past performance and start to supply capital to
best past performers. This makes the funds grow larger and harder to manage,
causing performance to decrease. Kosowski, Naik, and Teo (2007) find that top
hedge fund performance cannot be explained by luck, and hedge fund performance
persists at annual horizons. In addition Jagannathan, Malakhov, and Novikov (2010)
find significant performance persistence among funds which superior risk-adjust
performance even after controlling for various hedge fund data biases.
There is a consensus in financial economics research about mutual fund performance
and its persistence. Indeed, Fama and French (2010) find that only few mutual funds
are able to provide benchmark-adjusted expected returns sufficient to cover their
costs and when taking expense ratios into account almost none of the mutual funds
show superior performance. Barras, Scaillet, and Wermers (2009) find similar
results. They still find a significant proportion of consistently above average
performing funds prior to 1996 but almost none by 2006.
1.3 Related literature
This study relates on the vast literature on return predictability of different asset
classes. One of the first studies finding evidence on that several variables are
consistently able to predict returns of different assets was done by Keim and
Stambaugh (1986). The variables they use are the default spread, the logarithm of the
ratio of the SP500 index to its previous historical average and the logarithm of
average share price of NYSE firms in the quintile of smallest market value. These

8
variables are able to predict consistently the returns of common stock of NYSE-listed
firms, long-term bonds, and US Government bonds over the 52-year sample period.
Furthermore, Fama and French (1989) find evidence about predictability on stock
and bond returns by using the dividend yield, the default spread, and the term spread
as predictive variables. After these seminal papers a significant number of return
predictability studies has exploded as well as the number of predictive variables
introduced in these studies. In 1990s the focus on return predictability turned from
US markets to global markets and from traditional asset classes to less traditional.
There are no many academic papers about hedge fund return predictability. Amenc,
El Bied, and Martellini (2003) study predictability of hedge fund strategy indices
finding strong evidence of very significant predictability in hedge fund returns. They
use altogether 10 different predictive variables to find the most suitable predictors for
each strategy and end up using the return on SP500 index, the oil price, the yield on
3-month Treasury Bill, VIX volatility index, the change in NYSE monthly market
volume, and the return on the MSCI World Index excluding US. Avramov,
Kosowski, Naik, and Teo (henceforth, AKNT) (2010) borrow the predictive
macroeconomic variables from earlier literature (the dividend yield, the default
spread, the term spread, the Treasury yield, and the VIX) and form hedge fund
portfolios exploiting the predictability in a Bayesian framework. They find that
exploiting the predictability substantially improves out-of-sample performance for
the hedge funds. Avramov, Barras, and Kosowski (2012) continue from AKNT
explaining how and why certain predictors forecast hedge fund returns at the fund
level as well as within and across investment strategy categories. Avramov, Barras,
and Kosowski (2012) use also slightly different predictive variables than AKNT and
the applied model is non-Bayesian.
This study relates also to the studies handling how different fund-specific
characteristic variables are able to predict future returns. Liang (1999), Edwards and
Caglayan (2001), and Agarwal, Daniel, and Naik (2009) for example find that higher
managerial hedge fund incentives tend to predict higher future returns. Goetzmann,
Ingersoll, and Ross (2003) on the other hand find that the size of a hedge fund is
negatively related to its future performance. Liang (1999) and Bali, Gokcan, and

9
Liang (2006) find that the age of a hedge fund is negatively related to its future
performance.
Return predictability literature has also received objections. Goyal and Welch (2008)
for example re-examine earlier studies finding that most models are unstable or even
spurious. According to them models are no longer significant even in-sample and
they would not have offered any profit to investors trying to use them in market
timing. However, Rapach and Zhou (2012) point out that recent studies provide
improved predicting strategies the deliver statistically and economically significant
out-of-sample gains. They still admit that predicting is extremely challenging and
will likely never explain more than a small part of returns, but investors who account
for predictability outperform those who consider returns as entirely unpredictable.
1.4 Aim of the study
The aim of my study if twofold. First, I aim at developing a predictive model to
analyze the return predictability of individual hedge funds both in- and out-of-sample
by using both macroeconomic variables and fund-specific characteristic variables. In
addition, I asses the economic value of this model by applying the developed model
to an allocation strategy which takes into account real-world investment constrains.
The second aim of my study is on methodological side. Traditionally studies in
finance handling return predictability are carried out by either using the time-series
or the cross-sectional regression models. However, they both suffer from distinctive
features. On one hand, using the cross-sectional model, it is not possible to exploit
information about an individual subject in the cross-section. On the other hand, using
the time-series model, it is not possible to take advantage of the information provided
by the other subjects in the cross-section. In this study I develop the model by
applying a random coefficient regression model which allows me simultaneously
exploit cross-sectional and time-series return predictability. To my best knowledge,
such a random coefficient model has never been applied to investigate hedge fund
performance predictability.

10
The remainder of this study is organized as follows. Section 2 provides the overview
of the methodology used in this study presenting the used concepts in way that
everyone not familiar with the financial research is able to follow the story. Section 3
presents used data, different hedge fund strategies, correction of different data biases
as well as used predictive variables. Section 4 presents the empirical results handling
the in-sample predictability first, out-of-sample predictability second and assessing
the economic value of predictability third. Finally Section 5 concludes.

11
2 METHODOLOGY
2.1 Predictive regressions
Many empirical studies in different branches of science consider the following
predictive regressions model:
httht xy (1)
where is the intercept, tx is a vector of predictive variables observed at time t ,
is a vector of slope coefficients assigned to each predictive variable, hty is a variable
that is not observed at time t and ht is an error term. The objective is to use the
value of the predictor tx at time t to forecast the unobserved value of hty based on
assumption that realized values of tx anticipate changes in ty after h observations.
In finance the predictors may be for example dividend yield or different kind of
interest rate spreads and they are used to predict excess return (return over risk-free
rate) of bonds and stocks.
Once adequate amount of observations of hty and tx is available it is possible to
calculate the estimates of and by using standard statistical methods such as
ordinary least squares (OLS). The adequate amount of observations in finance
literature is normally around 30 meaning history requirement of 2-3 years if monthly
observations are used as in this study. When the estimations of and , or and
as the notation goes when talking about estimates, are available it is possible to
forecast the value of hty once the next tx is available assuming .0ht
While for the practitioners of the predictive model the main interest is in the
calculated prediction itself for the researchers at least as interesting part is to assess
the properties of and . Basically this means studying how well the data matches
to the predictive model and in this context we are usually talking about statistical
significance. Once and are calculated also the standard error of and can

12
be calculated which leads to so called t-value which again tells how sure we can be
that and are some meaningful values or in other words different from zero. Of
course, if it looks like some component in is most likely zero we can interpret the
variable assigned to that component does not have any predicting power in the
model. Normally in finance statistical significance is considered at 1%, 5% or 10%
level. In the context of regression models this practically means that there is 1%, 5%
or 10% change that the estimated coefficient is actually zero even if it looks like to
be different from zero. In this study term "predictable" means that the slope
coefficient assigned to a certain predictive variable differs statistically from zero.
The significance level is pointed out in each occasion the term is used.
2.2 The random coefficient model
Random coefficient regression models are multilevel statistical models which are
particularly well suited research designs where data is organized at more than one
level. In educational research for example the highest level could be a certain school
district which consists of several schools within the district (second level). Each
school can be further divided into separate classes and even further to students in the
each class. Due to hierarchical nature of these multilevel models they are often called
as hierarchical models. Multilevel models are vastly used in educational and social
sciences but the economic literature has mostly hung on conventional regression
models despite the appealing features multilevel models are able to offer.
Applying a random coefficient model in this study is based on assumption that hedge
fund industry uses relatively small amount of different strategies to pursuit capital
gains. These strategies are exposed differently to prevailing macroeconomic
conditions but each hedge fund applying the same strategy is assumed to react in
similar manner to the changes in macroeconomic environment or in practice changes
in certain macroeconomic variables. This assumption is used to form a multilevel
model from the hedge fund industry where the industry itself is at the highest level,
each hedge fund strategy at the second level and finally each individual hedge fund
within the strategy at the third level.

13
This setup provides two significant advantages to build up a practical predictive
model compared to conventional predictive models based only either on time-series
or cross-sectional regressions. First, if aiming at building up a model which is able to
provide predictive information at an individual hedge fund level, normally the
selection is a predictive time-series regression model. This model can be used to
estimate the intercept and the slope coefficient which can be used in predicting the
future return on a particular hedge fund. However, these estimates are based on only
one hedge fund and are often very noisy depending on the amount of used
observations. Second, if aiming at building up a model to predict the performance of
a certain hedge fund strategy the predictive cross-sectional regression is most likely
the choice. However, the cross-sectional regression is not able to offer any
information on an individual fund included in the cross-section. In addition, being
able to predict the performance of a certain strategy is not practical to benefit from it
as board strategies are not investable in practice and institutional investor such as
funds of hedge funds try to avoid investing in such indices. The random coefficient
model does not suffer from these limitations. By applying it, it is possible to get
information on an individual hedge fund in a manner which at the same combines all
the information the other hedge funds within the same strategy category provide. I
formalize next how this happens.
In the standard random coefficient model both the intercept and the slope assigned to
the each independent (predictor) variable are assumed deviate randomly from some
population regression model. The following expresses the predictive random
coefficient model in case of random intercept and one random coefficient, but it is
easy to extend to cover multiple random coefficients and even fixed coefficients.

14
Let 1, tiY denote the measurement of the thi subject at time 1t . The predictive
random coefficient model can be written as (Littell 2006)
1,,1, titiiiti exbaY (2)
where
G,~
Niid
b
a
i
i
2
2
bab
aba
G
)N(0,~ 21, iide ti
The model can be written as
1,,,1, titiriti
riti exbxaY
(3)
where
iri aa
iri bb
now
G,
0
0~ Niid
b
a
ri
ri
Expressed in terms of mixed model as

15
1,,,1, titiri
rititi exbaxY
(4)
where tix , is the fixed part of the model, tiri
ri xba , is the random part of the
model and 1, tie is the residual part of the model. Finally (4) can be expressed as
rtititi exY 1,,1,
(5)
where
titi xYE ,1,
1,,1, titiri
ri
rti exbae
2
,,1,
1,1 e
tititi x
GxYVar
Figure 1 presents a graphical illustration of a random coefficient model. As can be
seen each item i deviates about the regression line of the whole population x .
In this study I am interested in solving the values ia and i , to use them in
prediction.
Figure 1. Random coefficient model illustration.

16
As the main interest in my study are the coefficients and the intercept of individual
subjects they need to be estimated. How this happens is explained easiest by using
the matrix form of the general linear mixed model (Littell 2006):
eZuXY (6)
where Y denotes the vector of observed iy 's, X is the known matrix of ijx 's, is the
unknown fixed effects parameter vector, Z is known random effects design matrix,
)N(0, ~ Gu is the vector of unknown random effect parameters and )N(0, ~ Re is
the unobserved random errors. Now the variance is Y is RZZGV .
Estimation of the linear mixed model is more difficult than general linear model in
which only and are unknown. Now also parameters u, G, and R are unknown
making OLS inappropriate. In this case generalized least squares can be used leading
to minimizing
)()( 1 XYVXY (7)
However, this requires knowledge of V and therefore knowledge of G and R. In
practice this leads to estimating G and R by using likelihood-based methods such as
maximum likelihood or restricted maximum likelihood. Once the estimates of G and
R are available (denoted G and R , respectively) the estimates of and u can be
calculated by using Henderson's (1984) mixed model equations:
YRZ
YRX
uGZRZXRZ
ZRXXRX1
1
111
11
ˆ
ˆ
ˆ
ˆ
ˆˆˆ
ˆˆ
(8)
17
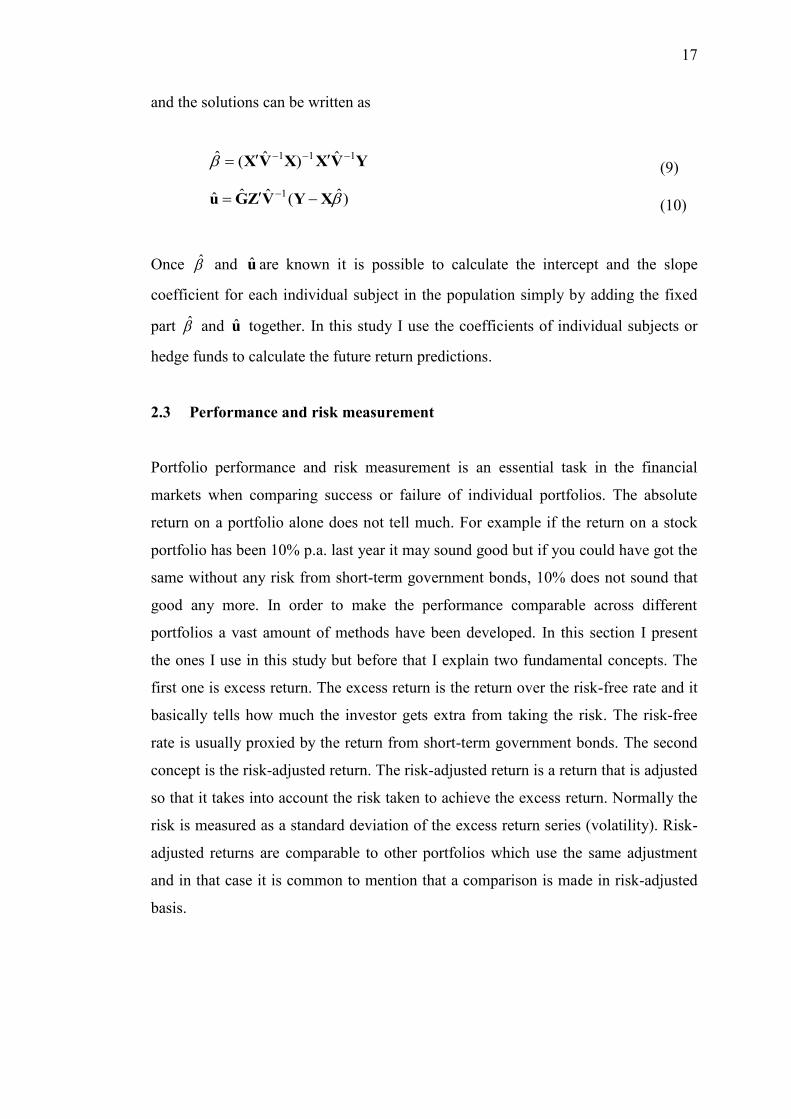
and the solutions can be written as
YVXXVX111 ˆ)ˆ(ˆ (9)
)ˆ(ˆˆˆ 1 XYVZGu
(10)
Once and u are known it is possible to calculate the intercept and the slope
coefficient for each individual subject in the population simply by adding the fixed
part and u together. In this study I use the coefficients of individual subjects or
hedge funds to calculate the future return predictions.
2.3 Performance and risk measurement
Portfolio performance and risk measurement is an essential task in the financial
markets when comparing success or failure of individual portfolios. The absolute
return on a portfolio alone does not tell much. For example if the return on a stock
portfolio has been 10% p.a. last year it may sound good but if you could have got the
same without any risk from short-term government bonds, 10% does not sound that
good any more. In order to make the performance comparable across different
portfolios a vast amount of methods have been developed. In this section I present
the ones I use in this study but before that I explain two fundamental concepts. The
first one is excess return. The excess return is the return over the risk-free rate and it
basically tells how much the investor gets extra from taking the risk. The risk-free
rate is usually proxied by the return from short-term government bonds. The second
concept is the risk-adjusted return. The risk-adjusted return is a return that is adjusted
so that it takes into account the risk taken to achieve the excess return. Normally the
risk is measured as a standard deviation of the excess return series (volatility). Risk-
adjusted returns are comparable to other portfolios which use the same adjustment
and in that case it is common to mention that a comparison is made in risk-adjusted
basis.

18
2.3.1 The Sharpe ratio
The Sharpe ratio was developed by William F. Sharpe in 1966 and it is still one of
the most commonly applied statistics in financial analysis. The Sharpe ratio formula
is:
p
fp RRSR
(11)
where pR is the mean historical return on portfolio p, fR is the risk-free rate and
p is the standard deviation (or volatility) of return on portfolio p. Basically the
Sharpe ratio tells us how well the investor is compensated for bearing the risk. For
example if two portfolios have the same return but the volatility of the second
portfolio is smaller, the second portfolio has higher Shape ratio. In that case the
second portfolio has better risk-adjusted return and compensates the investor better
for taking the risk.
2.3.2 The seven-factor model of Fung and Hsieh
Fung and Hsieh (2004) developed a model for hedge funds to examine if their returns
could be explained by pre-specified market risk factors that are common to all hedge
funds. They found that seven factors could explain up to 90% monthly hedge fund
return variations. This model became known as Fung-Hsieh seven-factor model and
today it is not possible to find a hedge fund article without reference to this model.
The seven-factor model can be expressed as:
itkt
k
ik
iit Fr
7
1 (12)
where itr is excess return on an individual hedge fund i for month t,
i is the alpha
performance measure of hedge fund i over the regression period, ik is the slope
coefficient of hedge fund i assigned to factor k, ktF is the return for factor k for

19
month t, and it is the error term. In the above regression factors ktF are directly
observable using market prices.1 The seven-factor model distinguishes between the
hedge fund alphas or skill (i ) from returns that are derived from bearing
systematic risk ( ktk
ik F
7
1
). The information ratio of a hedge fund is obtained, when
the estimate of i is divided by the standard deviation of the error term i
t .
According to Fung and Hsieh (2004) the seven factors are as follows. The equity
market factor is the excess return on Standard & Poor's 500 index, equity size factor
is Wilshire Small Cap 1750 monthly return minus Wilshire Large Cap 750 monthly
return, bond term factor is the monthly change in the 10-year Treasury constant
maturity yield, bond default factor is the monthly change in the Moody's Baa yield
minus 10-year Treasury constant maturity yield, and the returns on straddle-type
bond, currency, and commodity trend following strategies based on Fund and Hsieh
(2001). The model was later augmented with the IFC emerging market index factor
but the eight-factor model has not gained similar popularity in hedge fund research as
the seven-factor model.
2.3.3 Value-at-Risk
Value-at-Risk, or shortly VaR is a risk measure originally developed at J.P. Morgan
in the late 1990s to give the management understandably and fast information on
company's financial risk exposure. The methodology was published 1994 and
nowadays it is widely used in financial regulation and risk management.
VaR answer to the question, how much an investor at maximum can lose during a
certain period of time at a certain confidence level. To calculate VaR probability
distribution of returns of portfolio is needed. This can be obtained from the historical
market data, assuming a certain distribution or simulate based on assumed model.
Once the probability distribution is known VaR estimates can be read from the
1 Data available in David Hsieh's website: http://faculty.fuqua.duke.edu/~dah7/DataLibrary/TF-
FAC.xls

20
distribution. For example at 5% confidence level the VaR is at 5% quantile in the
distribution. If the loss at 5% quantile is let's say 7% and the size of portfolio $1000
the investor can be 95% sure her loss will not exceed $70 during the period that was
used to form the probability distribution. The most used confidence levels are 1%
and 5%. Distributions are normally formed using daily or monthly observations.
Despite of the popularity VaR has also received critic. VaR does not for example tell
anything about the size of the loss that exceeds the confidence level. Due to that
alternative methods, such as conditional VaR, have been developed tackle these
issues.

21
3 DATA
The main problem with available hedge fund data is that there are 5-10 commercial
databases available each including hedge funds reporting only to one database. The
most comprehensive study on hedge fund databases has been carried out by
Joenväärä, Kosowski and Tolonen (2012) (henceforth, JKT). They combine five
major databases (BarclayHedge, EurekaHedge, Hedge Fund Research, Morningstar
and TASS) by carefully merging funds into an aggregate database of 24,749
individual hedge funds based on data available in Q3 of 2011. The number is align
with earlier studies and therefore it can be assumed the aggregate database is close to
the true unobserved population of hedge funds.
However, due to commercial nature of databases all of them are not available for this
study. In addition merging several databases is not a trivial task. Therefore only one
namely BarclayHedge was chosen to be used. JKT (2012) finds that BarclayHedge
does not only have the largest coverage in their aggregate database but offers also
many other high-quality features such as comprehensive set of assets under
management observations and information of defunct hedge funds from the early
days of data.
3.1 BarclayHedge database
BarclayHedge database includes information on altogether 15316 hedge funds,
commodity trading advisors (CTA) and funds of hedge funds from January 1994 to
December 2010. The database is divided into two separate files. The performance
file contains information on fund's monthly return observations and amount of assets
under management. The fund-specific information file contains several fund-specific
characteristics such as fund name, type, code, inception date, fees and other
supplementary data.
The database includes both live and defunct funds. As of December 2010 the
database has 9498 defunct and 5818 funds alive which have reported at least one
return observation to the database. It is important to notice that funds belonging to
defunct funds does not automatically mean the fund has been liquidated. JKT (2012)

22
list reasons for a fund being dropped to defunct section. They are fund liquidation,
fund stops reporting to the database, fund is closed to new investments, fund cannot
be reached by the data vendor, fund is dormant or fund is merged into another fund
or entity.
In order to provide a consistent analysis of the data, only funds which report their
returns as a net of all management fees are included in the data sample. In the
original data I use in this study 98% of the funds reported their returns as net of fees.
Other reporting standards I discard from the used data sample. In addition, I only
include funds which report their returns and assets under management in US dollars
in the data sample. The original data includes reports in 18 different currencies US
dollar being by far the most common with 77% share. Shaping the data to assess
potential data biases, provide summary statistics and a short overview to history of
hedge fund industry leads to a sample of 11495 funds, of which 4047 are alive and
7448 defunct as of December 2010.
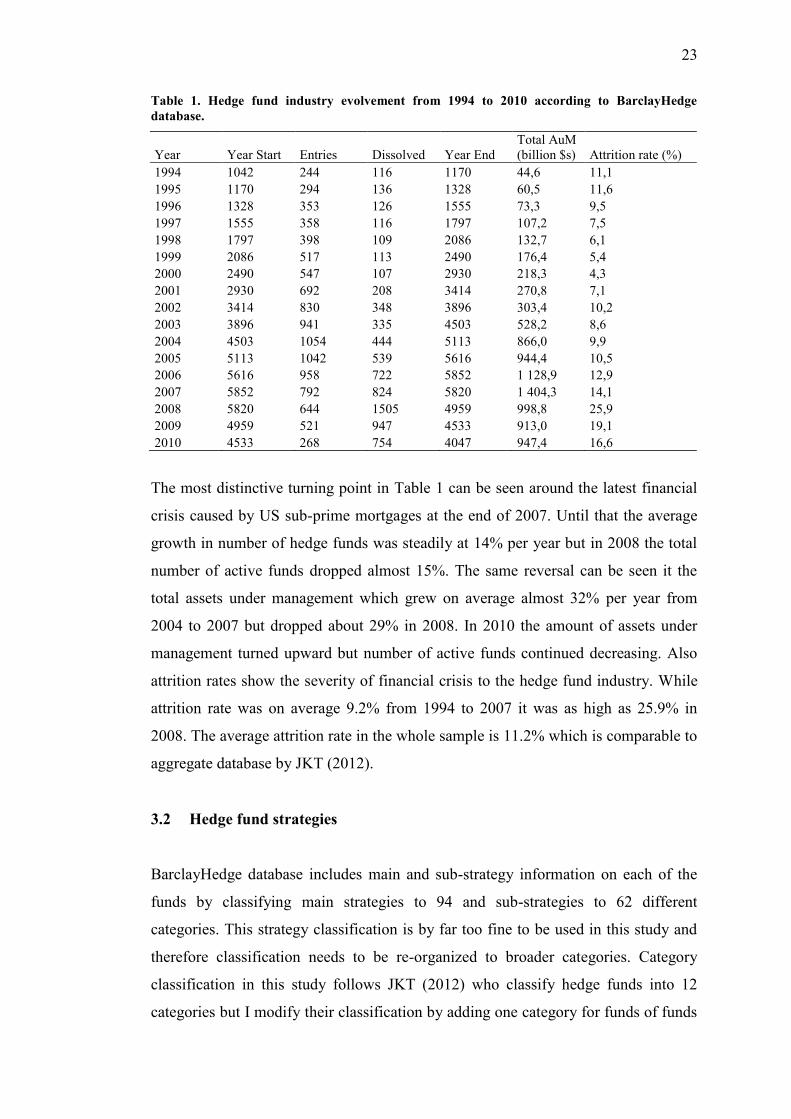
Table 1 presents the number of hedge funds in the beginning of year, the number of
new hedge funds entering the database, the number of hedge funds dissolved, the
number of hedge funds at the end of the year and the total assets under management
at the end of the year in billion US dollars. The last column in Table 1 reports the
attrition rate which is the ratio of the number of dissolved funds to the number of
funds at the beginning of the year.
23
Table 1. Hedge fund industry evolvement from 1994 to 2010 according to BarclayHedge
database.
Year Year Start Entries Dissolved Year End
Total AuM
(billion $s) Attrition rate (%)
1994 1042 244 116 1170 44,6 11,1
1995 1170 294 136 1328 60,5 11,6
1996 1328 353 126 1555 73,3 9,5
1997 1555 358 116 1797 107,2 7,5
1998 1797 398 109 2086 132,7 6,1
1999 2086 517 113 2490 176,4 5,4
2000 2490 547 107 2930 218,3 4,3
2001 2930 692 208 3414 270,8 7,1
2002 3414 830 348 3896 303,4 10,2
2003 3896 941 335 4503 528,2 8,6
2004 4503 1054 444 5113 866,0 9,9
2005 5113 1042 539 5616 944,4 10,5
2006 5616 958 722 5852 1 128,9 12,9
2007 5852 792 824 5820 1 404,3 14,1
2008 5820 644 1505 4959 998,8 25,9
2009 4959 521 947 4533 913,0 19,1
2010 4533 268 754 4047 947,4 16,6
The most distinctive turning point in Table 1 can be seen around the latest financial
crisis caused by US sub-prime mortgages at the end of 2007. Until that the average
growth in number of hedge funds was steadily at 14% per year but in 2008 the total
number of active funds dropped almost 15%. The same reversal can be seen it the
total assets under management which grew on average almost 32% per year from
2004 to 2007 but dropped about 29% in 2008. In 2010 the amount of assets under
management turned upward but number of active funds continued decreasing. Also
attrition rates show the severity of financial crisis to the hedge fund industry. While
attrition rate was on average 9.2% from 1994 to 2007 it was as high as 25.9% in
2008. The average attrition rate in the whole sample is 11.2% which is comparable to
aggregate database by JKT (2012).
3.2 Hedge fund strategies
BarclayHedge database includes main and sub-strategy information on each of the
funds by classifying main strategies to 94 and sub-strategies to 62 different
categories. This strategy classification is by far too fine to be used in this study and
therefore classification needs to be re-organized to broader categories. Category
classification in this study follows JKT (2012) who classify hedge funds into 12
categories but I modify their classification by adding one category for funds of funds

24
and I remove "Others" category which practically includes funds whose strategy
information is missing. Categories I use in this study are CTA, Emerging Markets,
Event Driven, Fund of Funds, Global Macro, Long Only, Long/Short, Market
Neutral, Multi-Strategy, Relative Value, Sector and Short Bias.
Definitions for the used strategies are as follows:
1. CTA: CTA stands for commodity trading advisors who are professional
money managers offering an asset class many times called managed futures.
CTAs employ proprietary trading systems and their strategies are extremely
varied. However, one unifying characteristic is that they trade highly liquid,
regulated, exchange-traded instruments, usually futures contracts on equity
indices, commodities, currencies and bond futures. CTAs usually have low
correlation between stocks and bonds and this is why they are often used for
diversification purposes.
2. Emerging Markets: An emerging market hedge fund specializes its
investments in the securities of emerging market countries, which are
countries in the process of moving from a closed market to an open market.
Emerging markets strategy has some unique risks compared to investing in
developed countries. Lack of transparency can make it hard to valuate
investments, illiquidity is higher due to inefficient markets and volatility may
be extreme.
3. Event driven: Event driven strategy tries to exploit pricing inefficiencies
related to corporate events such as a bankruptcy, merger, acquisition or
spinoff. Event driven strategies are typically applied by large institutional
investors who have the required expertise to analyze corporate events.
4. Global macro: Global macro strategy focuses on investing in instruments
whose prices fluctuate based on changes in economic policies and political
views around the globe. The strategy uses instruments which are broad in
scope and move based on market risk. Global macro strategies normally
apply currency, interest rate, and stock index strategies.
5. Long only: Long only strategy tries to hedge broader exposure to market risk
by long positions to stocks which are expected to increase in value. The main
difference between traditional long only fund and long only hedge fund is

25
that hedge fund does not try to follow any specific market index as traditional
fund but seeks for alpha where ever it is available.
6. Long/short: Long/short strategy is the most common hedge fund strategy
which involves taking long positions in stocks that are expected to increase in
value and short positions in stocks that are expected to decrease in value.
Usually long/short strategies maintain long bias meaning higher exposure to
long positions. A very common mixture is 130% exposure to long positions
and 30% exposure to short positions.
7. Relative value: The relative value strategy tries to take advantage of price
differentials between two related financial instruments whose values are
expected to converge. This is done by a combination of long and short
position pairs based on pricing asymmetries. The pricing asymmetries are
determined statistically or through a fundamental analysis. In this study the
relative value strategy contains hedge funds concentrated on convertible
bonds, fixed income securities and options.
8. Market neutral: Market neutral strategy aims at neutralizing general equity
market exposure by methods explained in relative value strategy description.
In this study market neutral strategy contains only hedge funds concentrating
on equity markets.
9. Sector: Sector strategy concentrates on a certain market sector such as
energy, health care, real estate or technology.
10. Short-bias: The strategy aims at finding overvalued companies and profit
from decline of their asset prices. The level of short exposure varies over
market cycles but the distinguishing characteristic in this strategy is that
consistent net short position is maintained. The search for overvalued assets
can be based on fundamentals or technical analysis and the manager has
usually a focus on certain market sector.
11. Multi-strategy: Multi-strategy hedge fund uses a combination of different
strategies described above to mitigate the risk when engaging in a single
strategy.
12. Fund of funds: Fund of funds strategy constructs a portfolio of other hedge
funds instead of investing directly in securities. A fund of fund can consist of
funds applying a certain investment strategy or funds applying different
strategies. Funds of funds are considered beneficial because their minimum

26
investment requirements are considerably lower than in traditional hedge
funds. On the other hand, funds of hedge funds charge additional fees on the
top of underlying hedge fund fees.
Table 2 presents number of funds in each of 12 strategy categories, percentage share
of each strategy category, number of alive funds within each strategy category,
percentage proportion of alive funds and mean number of monthly observations per
fund within each strategy category.
Table 2. Descriptive statistics of different hedge fund strategy categories.
Strategy
Number of
Funds
Percent
of total Alive Alive(%)
Mean monthly
observations per fund
CTA 1216 10,6 324 26,6 53,7
Emerging Markets 765 6,7 420 54,9 62,4
Event Driven 625 5,4 203 32,5 73,0
Funds of Funds 2639 23,0 919 34,8 72,0
Global Macro 770 6,7 212 27,5 49,1
Long Only 145 1,3 67 46,2 71,9
Long/short 1809 15,7 695 38,4 71,7
Market Neutral 324 2,8 79 24,4 56,7
Multi-Strategy 1373 11,9 473 34,5 63,8
Relative Value 1150 10,0 393 34,2 55,2
Sector 639 5,6 249 39,0 61,4
Short Bias 40 0,3 13 32,5 83,4
All Funds 11495 100,0 4047 35,2 64,5
Table 2 shows that proportions of different strategies in the sample varies
significantly. Funds of funds category is by far the largest with 23 percent share. In
addition long/short (15,7%), multi-strategy (11,9%), CTA (10,6%) and relative value
(10,0%) reach over 10 percent share. Short bias strategy is the smallest category with
0,3 percent share. Proportions of different strategies are comparable to JKT (2012)
aggregate database which implies that used data sample is a good representative of
true unobserved population of hedge funds in strategy classification wise.
From Table 2 it can be also seen that different strategies tend to survive worse than
the others. Market neutral, CTA and global macro strategies have all less than 30
percent of funds still alive in December 2010. Funds within these strategies have also
reported fewest amount of monthly observations to the database. Emerging markets

27
strategy has survived the best and more than half of the funds once started to report
to the database are still alive in December 2010. However, emerging markets
strategy funds have reported relatively low amount of observations compared to
other strategies. One explanation could be that supply of emerging markets funds has
increased close to the end of the sample and therefore many of them are still intact
when the sample ends. Long only funds have also survived well above average
which can be explained by their less risky strategy even if long only funds have
relative low weight in the sample.
3.3 Data biases
It is well known that hedge fund studies are exposed to different kind of data biases
and assessment of these biases has become an industry standard in hedge fund
studies. The most common hedge fund data biases were first combined and
documented in detail by Fung and Hsieh (2000) finding three biases often interfering
with hedge fund databases. These biases are survivorship bias, multi-period sampling
bias and backfill bias. Backfill bias is often called also as instant history bias.
3.3.1 Survivorship bias
Survivorship bias is introduced if the data sample does not include the returns of
non-surviving funds. The reason for not providing the information is that potential
hedge fund investors are not interested in non-operating funds and therefore the
information is simply discarded. Fung and Hsieh (2000) and Liang (2000) find that
defunct funds typically have lower returns than the surviving funds. If the defunct
funds are discarded from the sample the estimates of hedge funds performance are
upward biased.
In this study I mitigate survivorship by including all the information of both dead and
alive hedge funds provided by the data vendor. BarclayHedge database is good in
that sense because it does not suffer from severe survivorship bias as reported by
JKT (2012). In addition data sample starts from 1994 because most databases started
to collect defunct funds only after this year.

28
3.3.2 Backfill bias
When a hedge fund is added to a database fund's return history is also added. Adding
the history when entering the database is called backfilling and it may create a
problem because only the funds which have been successful in the past have
incentive to report their past performance to attract new investors. Bad performers on
the other hand do not have this incentive and may prefer not to report their returns to
any database. Because of this, early years of new reporting hedge funds are likely to
have higher returns than hedge funds on average which is causing an upward bias.
This bias is called backfill bias. JKT (2012) finds that backfilled average
performance is significantly higher in all major commercial hedge fund databases
compared to non-backfilled performance.
Hedge fund studies apply different practices to deal with backfill bias. Some
commercial databases have information on when a hedge fund is added to the
database making assessing of backfill bias easier. BarclayHedge does not provide
this information and announces only the inception date. A common approach in
similar cases is to exclude 12 first monthly return observations from each fund's
return history. Also JKT (2012) uses this approach and finds a backfill bias of 1.11%
per annum for equal-weight hedge fund portfolio in BarclayHedge database.
In this study I control backfill bias by excluding 12 first return observations from
each hedge fund. This will also decrease the sample size because funds with less or
equal to 12 observations will be dropped out. After controlling for backfill bias the
sample size decreases from 11495 funds to 10640 funds of which 6845 are defunct
and 3795 alive.
3.3.3 Multi-period sampling bias
Typically investors require a minimum 24 or 36 months of return history before
investing in a hedge fund. Therefore, a hedge fund study including funds with
shorter return histories can be misleading to investors who seek past performance to
make investment decisions. In addition, imposing a minimum 24-month return
observation requirement makes sense in order to run regressions and get sensible

29
estimates of model coefficients and intercepts for each individual hedge fund in the
sample.
In this study I control multi-period sampling bias by requiring a minimum of 36
return observations to be included in the final sample. This reduces the final sample
to 6267 funds of which 3629 are defunct and 2638 alive as of December 2010. It is
important to notice that 36-month return history requirement may introduce a new
survivorship bias because funds with shorter histories may have been liquidated due
to bad performance.
3.4 Variables
In this study I use four macroeconomic and three fund-specific characteristic
variables to predict future hedge fund returns. The variables I choose are
economically motivated based on findings in earlier studies and they measure
different dimensions of financial risk. Model parsimony is also an important
consideration I keep in mind when selecting variables in order not to invoke data
mining concerns discussed for example in Ferson, Sarkissian and Simin (2008).
3.4.1 Macroeconomic variables
The first macroeconomic variable is implicit volatility of U.S. equity market proxied
by Chicago Board Options Exchange Volatility Index (VIX). It measures the near-
term market expectations conveyed by S&P 500 stock index option prices and it has
been considered to be the barometer of investor sentiment. Many earlier studies
shows evidence of implied volatilities' ability to predict future returns. For example
Taylor, Yadav, and Zhang (2010) show that implied volatilities are able to predict
stock returns. Avramov, Barras, and Kosowski (2012) find the same when predicting
hedge fund returns.
Figure 2 plots monthly VIX values from January 1994 to December 2010. VIX tends
to rise when investors expect that market will move sharply and stay lower when
investors are not expecting significant market movements. Because market
movements are usually more radical downward highest VIX values are seen during

30
deepest decline in stock indices. This is why VIX is often referred to as the fear
index. Figure 2 shows clearly how VIX has reached its highest values during market
collapses in history such as Russian financial crisis in 1998, burst of dot-com bubble
from 2000 to 2002 and the latest financial crisis ongoing since 2008.
Figure 2. Monthly values of VIX volatility index from January 1994 to December 2010.
The second macroeconomic variable is default spread proxied by the yield
differential between Moody's BAA- and AAA-rated bonds. It describes the premium
lenders are requiring from worse rated borrowers' higher probability to fail to service
their debt obligations. Term spread tracks long term business conditions and it is
higher during recessions and lower during expansions. Several previous studies find
evidence of default spread's return predicting power on different asset classes.
According to Keim and Stambaugh (1986) default spread can predict future stock
and bond returns. Bali, Brown, and Caglayan (2011) show that hedge funds with
higher exposure to default risk premium in the past month generate higher returns in
the following month.
Figure 3 presents annualized monthly default spread during the sample period. Also
default spread shows higher values during market downturns as VIX but is much
slower in its movements.
0
20
40
60
80
1994 1996 1998 2000 2002 2004 2006 2008 2010
VIX
Year

31
Figure 3. Monthly values of the annualized default spread from January 1994 to December
2010.
The third macroeconomic variable is the term spread proxied by annualized monthly
observations of the difference between the yields on 1-year Treasuries and 10-year
Treasuries. The term spread is relatively used predictor in history of finance studies
among other properties of the term structure. Campbell (1987) showed the term
spread can predict the expected returns of bonds and stocks based on US data. A
more recent study by Hjalmarsson (2010) finds that the term spread is able to predict
stock returns in developed markets but not in emerging markets. The usage of the
term spread as a predictive variable is also motivated by its ability to estimate future
short-term borrowing costs under the Expectations Hypothesis. Borrowing costs are
relevant for hedge funds known for their high leverage.
Figure 4 presents the annualized monthly term spread observations. It can be seen
that the term spread has fallen below zero two times during the sample period.
According to Harvey (1988) a negative term spread, or in other words, inverted yield
curve can accurately predict US recession. This seems to be true because during the
sample period US economy has been two times in recession. The first starting in
March 2001 and the second starting in December 2007. In Figure 4 the term spread
0
1
2
3
4
1994 1996 1998 2000 2002 2004 2006 2008 2010
Per
cen
t p
er y
ear
Year

32
has gone under zero level 1-2 years before those dates. This provides another
evidence of the term spread's predicting power and an interesting opportunity to
study if hedge funds are capable of exploiting it.
Figure 4. Monthly values of the annualized term spread from January 1994 to December 2010.
The fourth macroeconomic variable I use in prediction is US excess equity return
proxied by the Standard & Poor's 500 index monthly excess return. Keim and
Stambaugh (1986) show that lagged stock returns are able to predict the expected
returns on stocks and bonds. Even if Fama and French (1989) do not find strong
evidence of return predictability based on past equity return it is chosen as a
predictor in this study because it offers an interesting possibility to compare the
predictability among different hedge fund strategies. For example directional strategy
such as global macro can be expected to have a higher factor loading for this
predictor than non-directional strategy such as market neutral.
-1
0
1
2
3
4
1994 1996 1998 2000 2002 2004 2006 2008 2010
Per
cen
t p
er y
ear
Year

33
Figure 5 presents monthly excess return on Standard & Poor's 500 index. Statistical
properties of monthly excess return as well as properties of other predictive variables
are presented later.
Figure 5. Monthly values of excess return on Standard & Poor's 500 index from January 1994 to
December 2010.
3.4.2 Fund-specific characteristic variables
Including hedge fund-specific characteristic predictors into the predictive model
developed in this study is motivated by different studies. Edwards and Caglayan
(2001), Liang (1999) and Agarwal, Daniel, and Naik (2009) for example find that
hedge funds with higher managerial incentives also have higher excess returns as
predicted by agency theory. In this study I select percentual incentive fee of the
hedge fund as a proxy for managerial incentives.
Goetzmann, Ingersoll, and Ross (2003) find that hedge funds with more assets under
management tend to earn lower returns. They argue this to be due to limited arbitrage
opportunities which are not scalable. For example if a hedge fund manager finds an
undervalued asset she is able to exploit it only to some extend without causing a
market impact which would eventually drive the asset price to its fair value. These
-0.2
-0.15
-0.1
-0.05
0
0.05
0.1
0.15
1994 1996 1998 2000 2002 2004 2006 2008 2010
Mo
nth
ly e
xce
ss r
etu
rn
Year

34
opportunities are similar for small and big hedge funds but small funds would benefit
more in terms of return. Agarwal, Daniel, and Naik (2009) find similar results even if
they are using fund size as a control variable while concentrating on managerial
incentives and discretion. In this study I use the natural logarithm of assets under
management as a proxy for the size of a fund.
Liang (1999) finds that the age of the fund is negatively related to performance. He
proposes as an explanation that older funds may have grown so big that they are
suffering from the size effect. Bali, Gokcan and Liang (2006) find similar results.
They borrow the explanation from Chevalier and Ellison (1999) who find that in
mutual fund industry young managers are more willing to take risk than older ones in
order to create appropriate track record. In this study I use fund's age in years since
the inception as a proxy for the age. Descriptive statistics of fund-specific
characteristic variables are presented later.
3.5 Summary statistics
Table 3 reports number of hedge funds in each strategy category, their relative
importance in the population, annualized mean excess return, annualized standard
deviation, annualized median, annualized 25th percentile and annualized 75th
percentile included in the final sample from January 1994 to December 2010 after
accounting for different data biases and imposing a requirement for three year return
history. Excess return observations are measured as net-of-fee returns over risk-free
rate. Mean annualized return in the final sample is 6.1% and annualized volatility is
17.8%. Table 3 shows clear differences between strategy categories. Fund of funds
and market neutral categories are least volatile as expected and their mean returns are
among the lowest. Short bias strategy has performed worst during the sample period.
Its annualized mean return is the lowest and annualized volatility highest among
strategy categories. Even median return is negative within short bias category. This is
most likely due to challenging investment environment for the short bias strategy
during the sample period. Table 3 shows also that in final sample median annualized
return is lower than mean annualized return which is the case also in most strategy
categories. This implies that return distributions are skewed to the right.

35
Table 3. Descriptive excess return statistics of hedge funds and hedge fund strategy categpories.
Strategy Number(%) Mean(Ann.) Std(Ann.)
25th
Percentile
(Ann.)
Median
(Ann.)
75th
Percentile
(Ann.)
All funds 6267(100) 6.1 17.8 -12.5 5.3 23.6
CTA 551(8.8) 6.1 22.2 -19.2 1.0 27.3
Emerging Markets 388(6.2) 10.0 25.3 -18.2 9.1 41.4
Event Driven 373(6.0) 6.9 12.6 -5.2 6.5 20.4
Fund of Funds 1681(26.8) 2.9 9.4 -7.2 5.2 16.2
Global Macro 305(4.9) 6.1 20.2 -17.3 2.4 27.6
Long Only 81(1.3) 7.6 22.2 -27.5 9.1 44.4
Long/Short 1113(17.8) 7.6 18.7 -17.5 6.7 32.9
Market Neutral 141(2.2) 3.2 9.1 -9.8 3.2 16.2
Multi-Strategy 735(11.7) 8.7 23.2 -22.4 4.9 33.7
Relative Value 527(8.4) 5.3 14.9 -3.8 5.6 16.8
Sector 344(5.5) 7.8 22.2 -19.8 7.4 35.9
Short Bias 28(0.4) 2.4 27.8 -37.3 -1.4 34.7
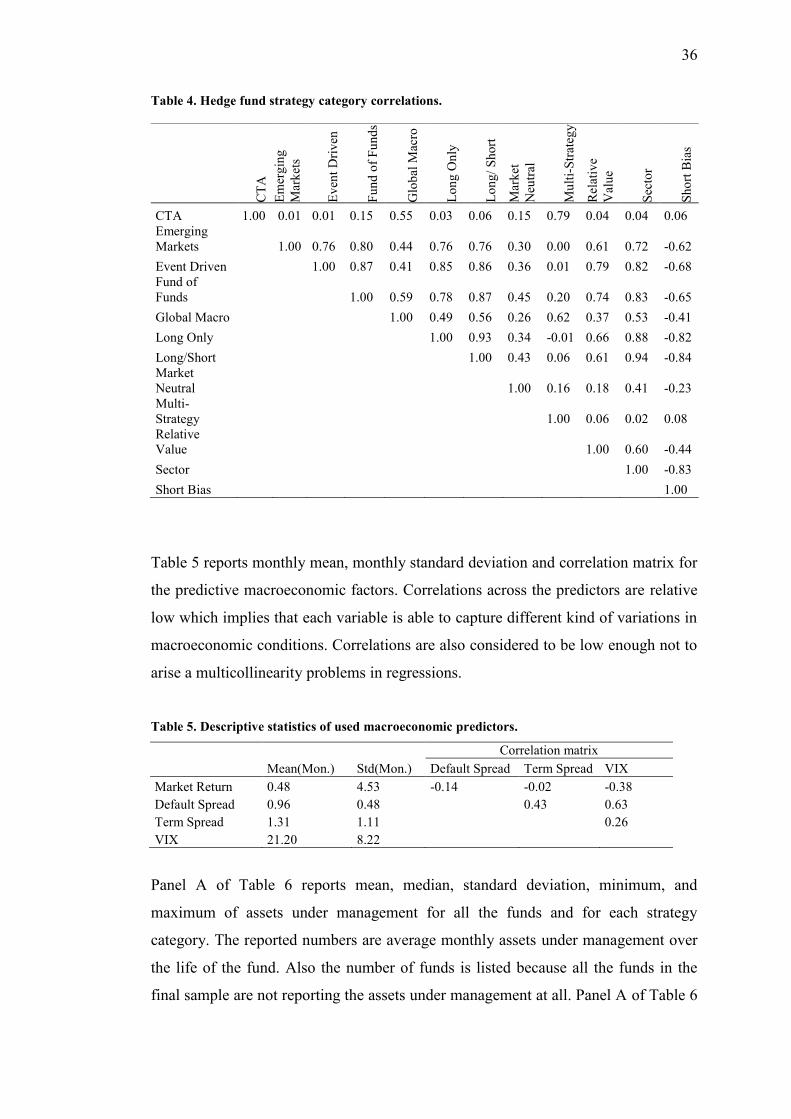
Table 4 reports the excess return correlations between different hedge fund
strategies. The data for defining the strategy correlations is obtained by equally
weighting each fund's monthly excess return observation in the strategy category
during the sample period. The highest correlation (0.94) is between long/short and
sector strategies whereas the lowest (-0.84) is between long/short and short bias
strategies. It is interesting to compare correlations of CTA and multi-strategy
strategies who do not engage to any predefined strategy. Table 4 shows that CTA
strategy has very low correlation between all the other strategies but global macro
and multi-strategy which implies that CTA and multi-strategy are really chancing
their strategies during the sample period but in a way that resembles global macro
strategy. Table 4 shows also that short bias strategy has almost zero or negative
correlation with all the other strategies which means it is good strategy to invest
when all the other strategies are performing badly or it can be used in diversification
purposes.
36
Table 4. Hedge fund strategy category correlations.
Table 5 reports monthly mean, monthly standard deviation and correlation matrix for
the predictive macroeconomic factors. Correlations across the predictors are relative
low which implies that each variable is able to capture different kind of variations in
macroeconomic conditions. Correlations are also considered to be low enough not to
arise a multicollinearity problems in regressions.
Table 5. Descriptive statistics of used macroeconomic predictors.
Correlation matrix
Mean(Mon.) Std(Mon.) Default Spread Term Spread VIX
Market Return 0.48 4.53 -0.14 -0.02 -0.38
Default Spread 0.96 0.48
0.43 0.63
Term Spread 1.31 1.11
0.26
VIX 21.20 8.22
Panel A of Table 6 reports mean, median, standard deviation, minimum, and
maximum of assets under management for all the funds and for each strategy
category. The reported numbers are average monthly assets under management over
the life of the fund. Also the number of funds is listed because all the funds in the
final sample are not reporting the assets under management at all. Panel A of Table 6
CT
A
Em
erg
ing
Mar
ket
s
Ev
ent
Dri
ven
Fu
nd
of
Fu
nd
s
Glo
bal
Mac
ro
Lo
ng
On
ly
Lo
ng
/ S
hort
Mar
ket
Neu
tral
Mu
lti-
Str
ateg
y
Rel
ativ
e
Val
ue
Sec
tor
Sh
ort
Bia
s
CTA 1.00 0.01 0.01 0.15 0.55 0.03 0.06 0.15 0.79 0.04 0.04 0.06
Emerging
Markets
1.00 0.76 0.80 0.44 0.76 0.76 0.30 0.00 0.61 0.72 -0.62
Event Driven
1.00 0.87 0.41 0.85 0.86 0.36 0.01 0.79 0.82 -0.68
Fund of
Funds
1.00 0.59 0.78 0.87 0.45 0.20 0.74 0.83 -0.65
Global Macro
1.00 0.49 0.56 0.26 0.62 0.37 0.53 -0.41
Long Only
1.00 0.93 0.34 -0.01 0.66 0.88 -0.82
Long/Short
1.00 0.43 0.06 0.61 0.94 -0.84
Market
Neutral
1.00 0.16 0.18 0.41 -0.23
Multi-
Strategy
1.00 0.06 0.02 0.08
Relative
Value
1.00 0.60 -0.44
Sector
1.00 -0.83
Short Bias
1.00

37
shows clearly the large disparity among hedge funds because the mean size in the
whole sample is as high as $179.5 million while the median fund size in only $48.1
million. This indicates that there are few funds with very large assets under
management driving the mean up. This seems to the case also with all the strategy
categories.
Panel B of Table 6 reports mean, median, standard deviation, minimum, and
maximum age in years in the final sample. The mean age of hedge funds is 8.5 years
while the median is slightly lower at 7.2 years once again indicating that there are
few older funds driving the mean up. There are no significant differences in fund age
between strategy categories. It is worth noticing that minimum age in the final
sample is four years. This is because of accounting for backfill bias by discarding the
first year after inception and imposing a requirement for minimum of 36 monthly
return observations. The final sample does not give the real picture of hedge fund
industry in age point of view because of strict data requirements. This is also seen in
the number of funds survived to the final sample (6267) from the original data
sample (11495). JKT (2012) reports the mean age in their aggregate database to be
5.2 years. Clearly, it is lower than in the final sample used in this study.
Panel C of Table 6 reports mean, media, standard deviation, minimum and maximum
incentive fees. The median incentive fee in the final sample is 20% which reflects the
true hedge fund industry standard. The median incentive fee is also 20% in all the
strategy categories except in fund of funds and long only whose median incentive
fees are 10% and 15%, respectively. In case of fund of funds lower median incentive
fee is explained by the fact the fee comes on the top of incentives fees charged by the
hedge funds in the fund portfolio. Maximum incentive fee in the sample is as high as
65% charged by a hedge fund in the sector strategy category. Minimum in the sample
is zero incentive fee offered by all the strategy categories except short bias. The
mean incentive fee in the sample is 15.9%, clearly lower than median. This is
explained by fund of funds category which has relatively high weigh in the sample
and who are charging low incentive fees on average.

38
Table 6. Descriptive statistics of fund-specific characteristic predictors.
Panel A Assets under management (million $s)
Stategy Number Mean Median Std.Dev. Minimum Maximum
All funds 6053 179.5 48.1 522.6 0.03 14003.7
CTA 548 183.9 20.7 988.6 0.05 14003.7
Emerging Markets 376 155.7 69.8 241.4 0.93 1814.6
Event Driven 363 236.0 84.9 481.7 0.03 5011.5
Fund of Funds 1578 223.1 69.9 496.1 0.10 7302.3
Global Macro 300 112.2 28.8 224.1 0.10 1942.3
Long Only 73 281.2 30.9 1149.8 0.59 9161.0
Long/Short 1085 136.7 45.6 302.1 0.41 4267.5
Market Neutral 140 159.4 45.2 359.0 0.59 2120.0
Multi-Strategy 722 187.4 27.7 626.0 0.09 10457.3
Relative Value 506 181.9 62.3 432.6 0.05 5141.7
Sector 334 110.1 53.2 166.4 0.49 1093.3
Short Bias 28 29.2 23.7 26.5 0.34 98.0
Panel B Age of the funds (years)
Stategy Number Mean Median Std.Dev. Minimum Maximum
All funds 6267 8.5 7.2 4.2 4.0 36.0
CTA 551 8.7 7.1 4.7 4.0 30.0
Emerging Markets 388 8.2 7.0 3.9 4.0 27.2
Event Driven 373 9.0 7.6 4.5 4.0 27.1
Fund of Funds 1681 8.3 7.0 4.0 4.0 30.0
Global Macro 305 8.1 6.8 4.0 4.0 28.3
Long Only 81 8.9 8.0 4.0 4.0 21.0
Long/Short 1113 8.6 7.3 4.2 4.0 27.7
Market Neutral 141 8.3 7.1 4.1 4.2 25.8
Multi-Strategy 735 9.3 7.7 5.0 4.0 36.0
Relative Value 527 7.7 6.9 3.4 4.0 26.7
Sector 344 7.7 6.5 3.7 4.0 24.2
Short Bias 28 9.4 8.3 4.8 4.3 22.5
Panel C Incentive fee (%)
Stategy Number Mean Median Std.Dev. Minimum Maximum
All funds 6267 15.9 20.0 7.4 0.0 65.0
CTA 551 20.2 20.0 4.2 0.0 50.0
Emerging Markets 388 17.6 20.0 5.6 0.0 25.0
Event Driven 373 19.5 20.0 3.8 0.0 50.0
Fund of Funds 1681 7.5 10.0 6.1 0.0 25.0
Global Macro 305 19.2 20.0 5.3 0.0 35.0
Long Only 81 11.5 15.0 9.8 0.0 30.0
Long/Short 1113 19.1 20.0 3.7 0.0 30.0
Market Neutral 141 19.7 20.0 5.8 0.0 50.0
Multi-Strategy 735 19.5 20.0 5.3 0.0 50.0
Relative Value 527 18.5 20.0 6.0 0.0 50.0
Sector 344 19.4 20.0 4.2 0.0 65.0
Short Bias 28 19.5 20.0 3.9 5.0 25.0

39
Table 7 presents summary statistics for the risk factors according to Fung and Hsieh
(2004) seven-factor model presented in Section 2.3.2.
Table 7. Fung and Hsieh (2004) risk factor summary statistics.
Correlation matrix
Factor
Mean
(Ann.)
Std
(Ann.)
Equity
Size
Bond
Term
Bond
Default
Trend
Bond
Trend
Currency
Trend
Commodity
Equity Market 5.70 15.7 0.10 0.04 -0.25 -0.20 -0.19 -0.13
Equity Size 2.32 10.8
0.05 -0.23 -0.08 -0.03 -0.06
Bond Term -0.01 0.2
-0.51 -0.15 -0.18 -0.09
Bond Default 0.004 0.2
0.16 0.27 0.16
Trend Bond -20.72 51.8
0.23 0.18
Trend Currency -3.29 67.2
0.38
Trend Commodity -7.82 47.7

40
4 EMPIRICAL RESULTS
4.1 In-sample predictability
I start empirical analysis by measuring in-sample return predictability of individual
hedge funds during the sample period 1994-2010. Selected four macroeconomic
predictors I analyze separately for all the individual funds as well as for each strategy
category by using the random coefficient regression model. Three fund-specific
characteristic predictors I analyze separately as well. First for all the funds and then
separately for each strategy category by using pooled regression model.
4.1.1 In-sample predictability of macroeconomic variables
I measure in-sample return predictability of macroeconomic variables according to
the following regression model:
1,,,0,1, titjr
jiriti uZaar
(13)
where ri,t+1 denotes the time t+1 net-of-fee hedge fund excess return for fund i, Zj,t is
the realized value of j:th macroeconomic predictive variable (default spread, market
return, term spread, VIX), rjia , is the random slope coefficient assigned to predictor j
for fund i, ria 0, is the random intercept for fund i and ui,t+1 is the unpredictable fund
specific innovation. I run this regression for each of the four predictors alone. First, I
include all the funds in the final sample and then I include one strategy category at
time.
Panels A, B, C and D of Table 8 report in-sample return predictability results and the
descriptive statistics of random coefficients when the predictor is default spread,
market return, term spread, and VIX, respectively. For each panel, the first column
contains the number of funds included in the regression. The second and third
column, Num(-) and Num(+), report the number of funds for which the estimated
slope coefficients are positively and negatively statistically significant at 10% level,
41
respectively. Columns Q1, Md, and Q3 report 25% quantile, median, and 75%
quantile of the estimated random slope coefficients, respectively.
Several observations stand out from Table 8. First, predictability is highly
asymmetric across different strategy categories and different predictors. This is the
most pronounced when market return is used as predictor. For example in Fund of
Funds category 1459 funds out of 1681 have positively significant slope coefficient
at the 10% level where as only 2 funds have statistically significant negative slope
coefficient. This finding is also consistent with Avramov, Barras, and Kosowski
(2012) even if their predictors and methods are different. Second, random slope
coefficient distributions vary notably across different strategy categories within the
same predictor. This confirms that different strategy categories really pursue
different strategies making their predictor exposures to vary accordingly. The same is
also seen when all the funds are included in the slope coefficient estimation. In that
case the model loses the distinctive properties of different strategy categories and the
number of predictable funds decreases compared to estimation where strategy
categories are kept separate. Third, the magnitude of the random slope coefficients is
very small especially when default spread, term spread or VIX is used as a predictor.
For example, one standard deviation (8.22%) increase in VIX value would result in
only -0.2% decrease in the median Emerging Markets fund's return prediction. The
small magnitude of the slope coefficients arises from shrinkage taking place in
random coefficient model. The model pushes less accurate slope coefficient
estimations towards the mean slope coefficient of the whole data used in estimation.
This mean is most likely close to zero for all the strategy categories. However,
ultimately the most interesting funds are such that have either positive or negative
exposure to the predictor and of which slope coefficients are estimated so accurately
that they are not shrunken to the group mean.

42
Table 8. In-sample return predictability statistics of macroeconomic predictors.
Panel A Default spread
Strategy Num. Funds Num(-) Num(+) Q1 (*103) Md (*10
3) Q3 (*10
3)
All funds 6267 58 20 -2.18 -1.59 -0.98
CTA 551 1 14 0.11 0.37 0.79
Emerging Markets 388 1 1 -0.33 1.11 2.49
Event Driven 373 37 15 -6.22 -2.57 0.84
Fund of Funds 1681 456 6 -5.39 -4.01 -2.95
Global Macro 305 1 5 0.03 0.39 0.85
Long Only 81 0 1 -1.14 -0.37 0.49
Long/Short 1113 10 2 -2.98 -2.14 -1.43
Market Neutral 141 8 1 -3.49 -2.42 -1.43
Multi-Strategy 735 0 0 0.40 0.41 0.41
Relative Value 527 19 36 -1.07 1.71 4.82
Sector 344 8 3 -3.78 -2.76 -1.46
Short Bias 28 0 0 0.21 0.33 0.43
Panel B Merket return
Strategy Num. Funds Num(-) Num(+) Q1 (*10) Md (*10) Q3 (*10)
All funds 6267 57 1574 0.55 1.05 1.61
CTA 551 6 4 -0.23 -0.15 -0.03
Emerging Markets 388 0 232 1.64 2.36 3.57
Event Driven 373 0 210 0.77 1.48 2.66
Fund of Funds 1681 2 1459 1.04 1.41 1.79
Global Macro 305 1 7 -0.16 -0.03 0.14
Long Only 81 0 77 2.15 2.50 3.04
Long/Short 1113 2 532 1.06 1.47 2.01
Market Neutral 141 0 3 0.12 0.16 0.21
Multi-Strategy 735 27 0 -0.29 -0.16 -0.06
Relative Value 527 5 142 0.24 0.67 1.61
Sector 344 0 109 0.96 1.54 2.34
Short Bias 28 5 1 -0.87 -0.65 -0.32
Panel C Term spread
Strategy Num. Funds Num(-) Num(+) Q1 (*103) Md (*10
3) Q3 (*10
3)
All funds 6267 14 168 -0.04 0.01 0.07
CTA 551 11 5 0.11 0.46 0.69
Emerging Markets 388 1 39 0.79 1.00 1.40
Event Driven 373 3 23 -0.12 0.58 1.64
Fund of Funds 1681 174 0 -0.88 -0.75 -0.63
Global Macro 305 1 1 0.05 0.11 0.17
Long Only 81 0 81 1.90 1.99 2.10
Long/Short 1113 2 0 -0.17 -0.06 0.01
Market Neutral 141 5 0 -1.06 -0.72 -0.46
Multi-Strategy 735 6 0 -0.13 -0.08 -0.04
Relative Value 527 2 90 0.79 1.37 2.17
Sector 344 14 0 -0.57 -0.53 -0.50
Short Bias 28 1 0 -4.01 -3.16 -1.10
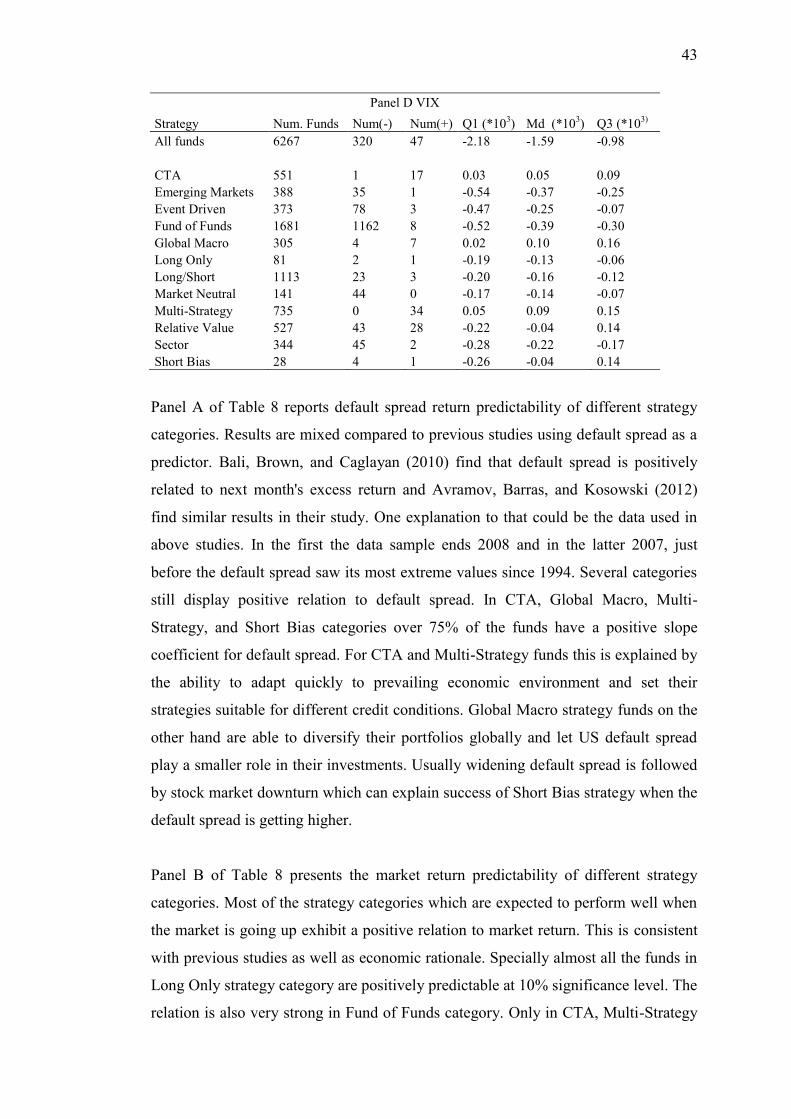
43
Panel D VIX
Strategy Num. Funds Num(-) Num(+) Q1 (*103) Md (*10
3) Q3 (*10
3)
All funds 6267 320 47 -2.18 -1.59 -0.98
CTA 551 1 17 0.03 0.05 0.09
Emerging Markets 388 35 1 -0.54 -0.37 -0.25
Event Driven 373 78 3 -0.47 -0.25 -0.07
Fund of Funds 1681 1162 8 -0.52 -0.39 -0.30
Global Macro 305 4 7 0.02 0.10 0.16
Long Only 81 2 1 -0.19 -0.13 -0.06
Long/Short 1113 23 3 -0.20 -0.16 -0.12
Market Neutral 141 44 0 -0.17 -0.14 -0.07
Multi-Strategy 735 0 34 0.05 0.09 0.15
Relative Value 527 43 28 -0.22 -0.04 0.14
Sector 344 45 2 -0.28 -0.22 -0.17
Short Bias 28 4 1 -0.26 -0.04 0.14
Panel A of Table 8 reports default spread return predictability of different strategy
categories. Results are mixed compared to previous studies using default spread as a
predictor. Bali, Brown, and Caglayan (2010) find that default spread is positively
related to next month's excess return and Avramov, Barras, and Kosowski (2012)
find similar results in their study. One explanation to that could be the data used in
above studies. In the first the data sample ends 2008 and in the latter 2007, just
before the default spread saw its most extreme values since 1994. Several categories
still display positive relation to default spread. In CTA, Global Macro, Multi-
Strategy, and Short Bias categories over 75% of the funds have a positive slope
coefficient for default spread. For CTA and Multi-Strategy funds this is explained by
the ability to adapt quickly to prevailing economic environment and set their
strategies suitable for different credit conditions. Global Macro strategy funds on the
other hand are able to diversify their portfolios globally and let US default spread
play a smaller role in their investments. Usually widening default spread is followed
by stock market downturn which can explain success of Short Bias strategy when the
default spread is getting higher.
Panel B of Table 8 presents the market return predictability of different strategy
categories. Most of the strategy categories which are expected to perform well when
the market is going up exhibit a positive relation to market return. This is consistent
with previous studies as well as economic rationale. Specially almost all the funds in
Long Only strategy category are positively predictable at 10% significance level. The
relation is also very strong in Fund of Funds category. Only in CTA, Multi-Strategy

44
and Short Bias strategy categories more than 75% of funds are negatively related to
market return. For Short Bias category the reason is easily explained by the
consistent net short position the funds in this category are maintaining. For CTA and
Multi-Strategy one reason could be that they both are very flexible in their strategies
and simply tend to fail the in strategy selection when the pure market beta strategy
would be the most efficient. Market Neutral strategy is also an interesting strategy to
check when market excess return is used as a predictor. In this case results are align
with strategy's claim on market neutrality. For Market Neutral strategy category the
estimated slope coefficients are narrowly distributed close to zero and only three
funds out of 141 are positively predictable by the market return.
Panel C of Table 8 reports the term spread predictability of different strategy
categories. According to Fama and French (1989) term spread is low around
measured business cycle peaks and high near troughs. In terms of expected future
returns this would mean that low term spread would predict low future returns and
vice versa. For example, when term spread is close to zero the business cycle and
expected market returns are about to go downward making funds with negative term
spread slope coefficient appealing in this situation. Similarly when the term spread is
high business cycle and future market returns are about to turn upward making funds
with positive term spread slope coefficient appealing. According to results this seems
to be the case with directional strategies such as Long Only and Short Bias. All the
funds in Long Only category have positive term spread coefficient and they all are
predictable by the term spread. Funds in Short Bias strategy category on the other
hand have really low term spread slope coefficient but the predictability is not as
obvious as with Long Only category. In addition to Long Only category also Relative
Value category exhibits predictability with 17% of its funds being positively
predictable by the term spread. One explanation could be that pricing disparities are
easier to exploit when the market is going up.
Panel D of Table 8 reports the VIX predictability of different strategy categories.
Most of the strategy categories display negative relation to VIX and only in three
strategy category the median slope coefficient is above zero. This is consistent with
previous studies like Avramov, Barras and Kosowski (2012). The most predictable
strategy category according to results is Fund of Funds category where 70% of the
45
funds are negatively predictable by the VIX. Naturally this is due to fact that fund of
funds consist of funds from other strategy categories where most of the funds have
negative relation to the VIX. Three of the strategy categories namely CTA, Global
Macro and Multi-Strategy have more positively than negatively predictable funds.
With CTA and Multi-Strategy this asymmetry is much stronger than with Global
Macro. Interestingly CTA and Multi-Strategy stood out also in market return
predictability where they both have negative relation to market return. It seems like
these two strategies tend to perform badly when VIX is low and market returns are
high but they do well in turbulent times when VIX is high and market returns are
low.
4.1.2 In-sample predictability of fund-specific characteristic variables
I measure in-sample return predictability of fund-specific characteristic variables
according to the following regression model:
1,,3,2101, tititiiti uAgebSizebIFeebbr (14)
where ri,t+1 denotes the month t+1 net-of-fee hedge fund excess return on fund i,
IFeei is the incentive fee charged by fund i, Sizei,t is the size of the fund measured as
the natural logarithm of assets under management for fund i in the month t, Agei,t is
the age of the fund i in month t+1, b0 is the intercept and ui,t+1 is the unpredictable
fund specific innovation. I run this regression by first including all the funds in the
final sample and then including one strategy category at time. Time period for the
each regression is from January 1994 to December 2010.
Table 9 reports in-sample return predictability results for fund-specific characteristic
predictors, reporting the slope coefficient for each of the predictors (incentive fee,
size and age) as well as the p-value of each coefficient. Standard errors of the slope
coefficients are adjusted so that autocorrelation and heteroscedasticity is taken into
account.
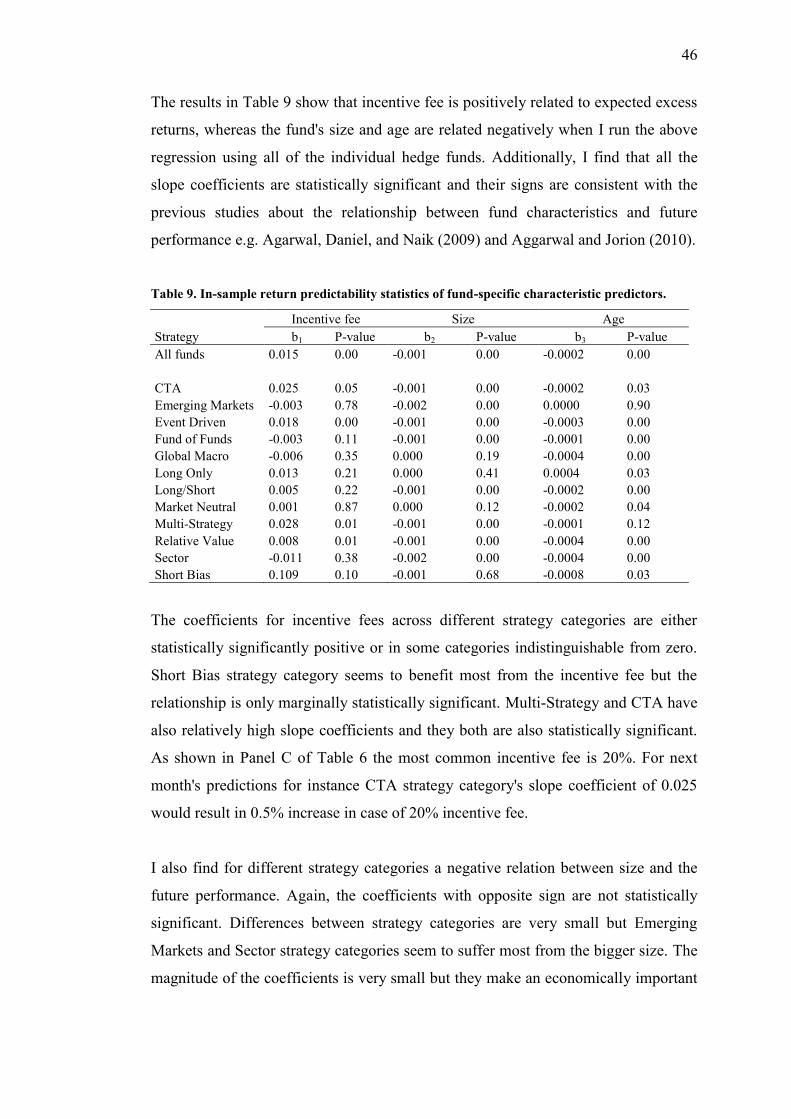
46
The results in Table 9 show that incentive fee is positively related to expected excess
returns, whereas the fund's size and age are related negatively when I run the above
regression using all of the individual hedge funds. Additionally, I find that all the
slope coefficients are statistically significant and their signs are consistent with the
previous studies about the relationship between fund characteristics and future
performance e.g. Agarwal, Daniel, and Naik (2009) and Aggarwal and Jorion (2010).
Table 9. In-sample return predictability statistics of fund-specific characteristic predictors.
Incentive fee Size Age
Strategy b1 P-value b2 P-value b3 P-value
All funds 0.015 0.00 -0.001 0.00 -0.0002 0.00
CTA 0.025 0.05 -0.001 0.00 -0.0002 0.03
Emerging Markets -0.003 0.78 -0.002 0.00 0.0000 0.90
Event Driven 0.018 0.00 -0.001 0.00 -0.0003 0.00
Fund of Funds -0.003 0.11 -0.001 0.00 -0.0001 0.00
Global Macro -0.006 0.35 0.000 0.19 -0.0004 0.00
Long Only 0.013 0.21 0.000 0.41 0.0004 0.03
Long/Short 0.005 0.22 -0.001 0.00 -0.0002 0.00
Market Neutral 0.001 0.87 0.000 0.12 -0.0002 0.04
Multi-Strategy 0.028 0.01 -0.001 0.00 -0.0001 0.12
Relative Value 0.008 0.01 -0.001 0.00 -0.0004 0.00
Sector -0.011 0.38 -0.002 0.00 -0.0004 0.00
Short Bias 0.109 0.10 -0.001 0.68 -0.0008 0.03
The coefficients for incentive fees across different strategy categories are either
statistically significantly positive or in some categories indistinguishable from zero.
Short Bias strategy category seems to benefit most from the incentive fee but the
relationship is only marginally statistically significant. Multi-Strategy and CTA have
also relatively high slope coefficients and they both are also statistically significant.
As shown in Panel C of Table 6 the most common incentive fee is 20%. For next
month's predictions for instance CTA strategy category's slope coefficient of 0.025
would result in 0.5% increase in case of 20% incentive fee.
I also find for different strategy categories a negative relation between size and the
future performance. Again, the coefficients with opposite sign are not statistically
significant. Differences between strategy categories are very small but Emerging
Markets and Sector strategy categories seem to suffer most from the bigger size. The
magnitude of the coefficients is very small but they make an economically important

47
differences in final predictions. For example a 100 million CTA fund would lose
around 0.5% for a 1 million CTA fund.
I also find for different strategy categories a negative relation between age and future
performance. Emerging Markets category shows opposite sign but the coefficient is
not statistically significant. Interestingly Long Only category shows also positive
sign and in addition its coefficient is statistically significant. The reason could be
simply that Long Only funds with longer histories have learnt how to pick stocks.
Once again if the coefficients are translated into real life numbers to illustrate their
effects on final predictions a fifteen-year-old fund from Global-Macro would suffer
0.4% compared to a five-year-old fund.
4.2 Out-of-sample predictability
In-sample predictability I studied in the previous section does not necessarily mean
that hedge funds returns are predictable out-of-sample and even if out-of-sample
predictability is present it does not mean that predictability is exploitable. In this
section, I study whether the proposed novel pooled predictive regression model
allows me to exploit the information on macroeconomic and fund characteristic
predictors so efficiently that I am able to document economically important out-of-
sample predictability. The actual assessment of out-of-sample predictability I carry
out by using portfolio sorts.
In real-world hedge fund investor environment the investors encounter liquidity
constrains which prevent them from rebalancing their fund portfolios at the
frequency the predictive model provides new data. For example a very common
lock-up period used by hedge funds is one year, meaning that the investors are able
to rebalance their portfolios only once a year. This restriction is taken in the account
also in this study.
I assess the out-of-sample predictability by using the following investment strategies.
In four single-predictor strategies I use each of the macroeconomic variables alone in
portfolio sorting to check if predictability inherits from one predictor only. I choose
two multi-predictor strategies to assess the effect of fund-specific characteristic

48
predictors on out-of-sample performance. The first multi-predictor strategy combines
all four macroeconomic predictors but leaves out the fund-specific characteristic
predictors. The second multi-predictor strategy combines all four macroeconomic
predictors and three fund-specific characteristic predictors. In addition I choose a
strategy suggested by Jagannathan, Malakhov, and Novikov (2010) as a reference
because it evidently performs well by using past returns to select funds. I call this
strategy unconditional strategy.
The portfolio construction for single-predictor and multi-predictor strategies
proceeds as follows. At the end of the each year I estimate all the model coefficients
by using the past three-year data. In December estimated coefficients are used
together with realized macroeconomic predictor values as well as fund-specific
characteristic predictor values, if they are included in the model, to calculate
prediction for January. I use the calculated predictions to form ten decile portfolios
(from P1 to P10) so that P10 contains the highest predictions and P1 contains the
lowest predictions. I hold these portfolios one year, after which I repeat the whole
procedure again in the next December. I perform estimation of the coefficients
including only one strategy category at time because as Table 8 shows each strategy
category has distinctive coefficient distribution which I lose if I perform the
coefficient estimation for all the funds at the same time. For unconditional strategy
the procedure is similar but I form the portfolios P1-P10 according to realized past
three-year Fung-Hsieh (2004) alpha t-statistic adjusted for autocorrelation and
heteroscedasticity by using the Newey-West (1987) procedure. As the data starts in
January 1994 and the first three years are used for coefficient estimation the first
holding year is 1997. By this way my data sample contains altogether 14 re-
allocations and results in 168 individual monthly return observations.
During the holding period I weight equally each fund in January and keep that
weight during the whole holding period. If some of the funds in the portfolio cease to
exist during the holding period I do not re-invest the released capital into existing
funds and the share of the ceased funds will receive risk-free rate during the rest of
the year. This arrangement reflects the real-world hedge fund investment
environment and mitigates the possibility that surviving funds would introduce a
survivorship bias into decile portfolio returns.

49
Panel A of Table 10 presents annualized excess returns and Sharpe ratios calculated
from monthly excess returns for each of the used allocation strategies and for each of
the decile portfolios as well as for the P10-P1 spread portfolio. The number in
parentheses below the annual excess return on spread portfolio is the t-statistics from
the test whether the mean of monthly returns in the spread portfolio is different from
zero.
Panel B of Table 10 presents annualized Fung-Hsieh (2004) alphas and information
ratios calculated from monthly alphas. The number in parentheses below the annual
Fung-Hsieh alpha of the spread portfolio is the t-statistics from the test whether the
alpha in the spread portfolio is different from zero.

50
Table 10. Out-of-sample decile portfolio annual excess returns, Sharpe ratios, annual Fung-
Hsieh alphas and information ratios.
Panel A Excess return (Ann.)
Strategy P1 P2 P3 P4 P5 P6 P7 P8 P9 P10 P10-P1
Unconditional 4.60 5.16 5.04 4.70 4.82 5.18 5.74 5.57 5.09 5.19 0.60
0.75 0.82 0.74 0.68 0.75 0.77 0.88 0.85 0.85 1.08 (0.46)
SP Only 6.43 4.74 3.75 3.17 3.32 5.73 5.42 5.20 5.41 7.58 1.15
1.00 0.85 0.71 0.66 0.61 0.87 0.84 0.73 0.59 0.64 (0.41)
VIX Only 8.27 5.51 4.24 3.97 3.40 4.26 3.70 4.52 6.70 6.73 -1.53
0.90 0.97 0.83 0.77 0.62 0.67 0.63 0.63 0.91 0.66 (-0.55)
DEFS Only 7.34 5.86 5.03 3.56 4.82 4.04 4.87 4.95 4.56 6.72 -0.63
0.93 1.04 0.92 0.65 0.89 0.72 0.89 0.79 0.56 0.53 (-0.20)
TERMS Only 7.96 5.34 4.99 3.15 4.77 4.31 6.46 3.53 4.90 6.15 -1.82
0.74 0.76 0.88 0.67 0.89 0.80 1.11 0.48 0.63 0.57 (-0.50)
Multi-predictor, 5.12 4.16 5.20 5.20 4.07 4.69 5.29 6.67 7.61 9.62 4.50
no fund charac. 0.55 0.67 0.94 0.91 0.77 0.75 0.96 0.94 0.88 0.78 (1.49)
Multi-predictor 4.98 4.72 5.22 5.02 4.87 4.97 6.05 6.54 7.58 9.44 4.46
0.53 0.76 0.88 0.80 0.85 0.83 0.98 0.91 0.87 0.78 (1.53)
Panel B Fung-Hsieh alpha (Ann.)
Strategy P1 P2 P3 P4 P5 P6 P7 P8 P9 P10 P10-P1
Unconditional 3.42 3.90 4.42 3.75 3.65 4.13 4.40 4.29 3.66 4.23 0.80
0.83 0.93 0.83 0.86 0.84 0.97 1.06 1.03 0.86 1.14 (0.62)
SP Only 5.33 4.03 3.16 2.28 2.52 5.60 4.73 3.79 3.04 5.11 -0.22
0.89 0.84 0.64 0.66 0.74 0.90 0.90 0.73 0.55 0.54 (-0.07)
VIX Only 6.50 5.10 3.46 2.91 2.09 2.57 2.35 3.06 5.96 6.12 -0.38
0.86 0.95 0.90 0.79 0.60 0.59 0.62 0.67 1.04 0.74 (-0.13)
DEFS Only 5.42 5.09 4.06 3.05 4.25 3.60 4.07 3.91 2.80 4.29 -1.13
0.75 1.13 1.12 0.65 0.93 0.79 0.95 0.89 0.47 0.37 (-0.29)
TERMS Only 6.78 5.43 5.26 2.38 3.96 3.41 5.45 1.66 2.51 3.57 -3.21
0.78 0.74 0.89 0.83 1.11 0.98 1.27 0.34 0.48 0.39 (-0.83)
Multi-predictor, 3.88 3.01 4.99 4.47 3.22 3.47 4.11 5.02 5.46 7.75 3.88
no fund charac. 0.53 0.79 1.02 1.17 0.91 0.86 1.30 1.06 0.97 0.76 (1.22)
Multi-predictor 3.81 3.89 4.75 4.61 4.02 3.90 4.47 4.73 5.55 7.83 4.01
0.49 0.97 0.97 0.85 0.98 1.09 1.15 1.01 0.93 0.75 (1.21)
None of the single-predictor strategies presented in Table 10 seem to be able to
predict consistently neither monthly excess returns nor FH alphas. The only single-
predictor strategy where P10 performs the best in monthly excess return prediction as
assumed in the model setting is S&P500 index but also with it the spread portfolio
(P10-P1) is not statistically distinguished from zero. With the VIX, the default spread
and the term spread single predictor strategies the monthly excess return is even the
highest in P1 portfolios in which it would have been expected to be the lowest. The
same applies to Fung-Hsieh alphas. With every single-predictor strategy the Fung-
Hsieh alphas is the highest in the portfolio P1 where it was expected to be the lowest.
51
Unconditional strategy does not show either higher monthly excess return when
moving from lower decile portfolios towards P10. The spread portfolio excess return
is positive but not statistically distinguished from zero. However, the unconditional
strategy is able to provide a decent annual excess return of 5.19% in P10 with lower
risk compared to other decile portfolios as its Sharpe ratio (1.08) is the highest. This
is consistent with Jagannathan, Malakhov, and Novikov (2010) who find that high
Fung-Hsieh alpha t-statistic is able to predict future performance when as low t-
statistic does not tell anything about future performance.
Multi-predictor strategies show clear increase both in annual excess returns and
Fung-Hsieh alphas especially in higher decile portfolios. Multi-predictor strategy
without fund-specific characteristics provides the highest annual excess return
(9.62%) among all the different strategies and decile portfolios. The highest annual
Fung-Hsieh alpha (7.83%) on the other hand is provided by P10 of multi-predictor
strategy which includes also fund-specific characteristic predictors. However, in
neither of the multi-predictor strategies the spread portfolios cannot be distinguished
statistically from zero neither with annual excess returns nor Fung-Hsieh alphas.
What can explain the poor statistical properties of the multi-predictor strategy spread
portfolios even if both excess returns and Fung-Hsieh alphas seem to increase
consistently among the higher decile portfolios when moving towards P10? One
explanation to that could be very volatile monthly excess return and monthly Fung-
Hsieh alpha series P1 portfolios are able to provide which is visible from low Sharpe
and information ratios. Because of that also other portfolios than P1 were compared
to P10 portfolio. Unreported results revealed that even if mean monthly excess return
in P10 is not statistically higher than in P1, P10 still provides statistically higher
mean monthly excess return than portfolios P2, P4, P5, and P6 at 10% level with
multi-predictor strategy which includes fund-specific characteristic predictors. The
same applies to Fung-Hsieh alphas. Even if the mean monthly alpha of P10 is not
statistically higher than the mean monthly alpha of P1 it is still statistically higher
than the mean monthly alphas of portfolios P5 and P6. These findings imply that
multi-predictor strategies seem to have out-of-sample predicting power specially
when predicting which hedge funds are likely to succeed but they perform badly in
predicting funds which are likely to have bad performance. This may be the reason

52
why P10-P1 spread portfolio does not show predictability in statistical sense with
multi-predictor strategies.
One reason for very high excess return and Fung-Hsieh alpha volatility with multi-
predictor strategies in P1 could be excessive risk taken by the hedge fund managers.
In hedge fund world this usually results in two different outcomes; either the risk
taking pays off and the fund performs well or the risk realizes and the fund runs out
of business. To study this further, I calculate mean annual attrition rates of multi-
predictor strategy with fund-specific characteristic predictors for each of the decile
portfolios in order to see if the funds in lower decile portfolios are more likely to
cease existing. Of course, a liquidation due to bad performance is not the only reason
for funds to cease existing but it is assumed that all the other reasons are as likely in
all deciles. The results are presented in Table 11.
Table 11. Mean annual attrition rates (%) of decile portfolios with multi-predictor strategy
including fund-specific characteristic predictors.
P1 P2 P3 P4 P5 P6 P7 P8 P9 P10
Attrition rate 15.6 14.4 11.0 8.9 8.4 8.1 6.7 6.1 4.7 5.9
As can be seen from Table 11 annual average attrition rate is much higher in low
decile portfolios. Portfolio P1 has the highest annual attrition rate of 15.6%, almost
three times higher than P10. In addition mean annual attrition rates decrease
consistently towards higher decile portfolio though P9 has somewhat lower annual
attrition rate than P10. This gives further evidence on out-of-sample predictability
performance of multi-predictor strategies. Attrition rates can also partly explain why
there is no clear differences in excess returns and Fung-Hsieh alphas between low
decile portfolios. This is because the survived funds whose proportion in low decile
portfolios is high have most likely performed well during the holding year which
biases the portfolio performance upward. As I kept the funds' weights untouched
during the holding year as I explained earlier the effect of survivorship bias was
mitigated. With equal weighting and monthly re-balancing the surviving funds would
have got higher weight in the portfolio pushing the mean annual excess return even
higher. In unreported results with equal weighting and monthly re-balancing the
mean annual excess return on P1 would have been 5.46% with multi-predictor
strategy including fund-specific characteristic predictors. This is 0.48 percentage

53
units higher than in used portfolio re-balancing setup. This clearly shows that high
attrition rates in low decile portfolios make better than expected funds to stand out
making out-of-sample predictability difficult. In this case it seems to lead to failure
of the model I propose when its performance is assessed through the statistical
properties of spread portfolio.
When two multi-predictor strategies are compared, one with fund-specific
characteristic predictors and one with macro economic variables only, it seems that
fund-specific characteristic predictors do not bring much difference to performance
of decile portfolios. Both annual excess returns and Fung-Hsieh alphas are close to
each other between the two strategies. They both have only small differences
between decile portfolios from P1 to P6 and both increase smoothly from P7 to P10.
Also the Sharpe and information ratios do not seem to justify preferring either of the
multi-predictor strategies. In that sense it is safe to state that the fund-specific
characteristic predictors do not add any value to the proposed model.
Figure 6 presents how the decile portfolios of multi-predictor strategy with fund-
specific characteristic predictors and equally-weighted hedge fund portfolio have
developed from January 1997 to December 2010. Portfolio P10 which I predicted to
perform the best has also performed the best ending up to profit of 132% during that
time. Also portfolios P9, P8, and P7 finish the whole holding period in the order
predicted by the model and this order remains virtually unchanged from year 2000
onwards. Portfolios P2-P6 have developed very closely to each other during the
whole holding period but interestingly P1 has been the worst most of the time until
catching up the other lower decile portfolios just before December 2010. In fact it
seems that P1 has been one of the best performing decile portfolios since January
2009.

54
Figure 6. Cumulative excess return on decile portfolios and equally-weighted hedge fund
portfolio from January 1997 to December 2010.
From Figure 6 it can be also seen that success of P10 is vastly explained by two very
successful years. The first one is year 1999 when the excess return on P10 increased
about 40% and the same happened after the latest financial crisis in year 2009.
During the other years P10 has performed similarly to the other decile portfolios
except P1. Figure 6 reveals also that the excess return on P10 is much more volatile
compared to other decile portfolios what of course is not a very good feature for a
predictive model. The high volatility can also be seen from the low Sharpe ratio of
P10 in Panel A of Table 10.
Compared to monthly rebalanced equally-weighted hedge fund portfolio only decile
portfolios P9 and P10 perform better.
4.3 The economic value of predictability
Even if many hedge funds show in-sample predictability and there are signs of out-
of-sample predictability when the proposed model is used for portfolio sorts it does
not mean that investor such as fund of funds would be able to exploit the
predictability. First of all the future performance of each hedge fund is estimated
-40 %
-20 %
0 %
20 %
40 %
60 %
80 %
100 %
120 %
140 %
Jan-97 Jan-99 Jan-01 Jan-03 Jan-05 Jan-07 Jan-09 Jan-11
P10
P9
P8
P7
P6
P5
P4
P3
P2
P1
EW

55
from data by using a predictive regression, which always inherits an estimation risk.
Second, the observed in-sample predictability may not carry forward making the
predictive model instable. Third, the decile portfolios used for assessing out-of-
sample predictability are not investable in practice because each of the decile
portfolios include hundreds of hedge funds towards the end of the data sample. Due
to these reasons I asses the economic value of predictability by taking into account
the model imperfections and real-world investment constrains. I carry out this
assessment by forming portfolios using different allocation strategies. The holdings
of these portfolios consist of the funds which are predicted to perform the best under
the prevailing macroeconomic conditions according the used strategy.
To address the real-world investment constrains I take the following limitations into
account. First, I exclude all the closed hedge funds from the data sample and the
lock-up period for each fund I assume to be one year. Second, I exclude the funds of
funds strategy category from the data sample because according to Avramov, Barras,
and Kosowski (2010) institutional investors tend to focus only on individual funds to
avoid extra fees. Third, I limit the number of funds in the formed portfolio to 40
because according to Lhabitant (2006) this is a typical number of funds in a fund of
funds portfolio.
I assess the economic value of predictability by using the same investment strategies
as I used in assessing out-of-sample predictability. In four single-predictor strategies
I use each of the macroeconomic variables alone to form a portfolio. I choose two
multi-predictor strategies to assess the effect of fund-specific characteristic predictors
on the performance of the allocated portfolio. The first multi-predictor strategy
includes all four macroeconomic predictors but leaves the fund-specific characteristic
predictors out. The second multi-predictor strategy combines all four macroeconomic
predictors and three fund-specific characteristic predictors. In addition once again I
choose an unconditional strategy suggested by Jagannathan, Malakhov, and Novikov
(2010) as a reference to other strategies.
The portfolio construction for single-predictor and multi-predictor strategies is
similar to decile portfolios and proceeds as follows. At the end of the each year I
estimate all the model coefficients by using the past three-year data. In December I

56
use the estimated coefficients together with realized macroeconomic predictor values
as well as fund-specific characteristic predictor values if they are included in the
model to calculate prediction for January. I use the calculated predictions to form a
portfolio of 40 hedge funds which includes the funds having the highest excess return
prediction. I hold this portfolio one year, after which I repeat the whole procedure
again in the next December. I perform the estimation of the coefficients including
only one strategy category at time, exactly the same way I did in portfolio sorting in
the previous section. For unconditional strategy the procedure is similar but I form
the portfolio by selecting 40 hedge funds with the highest realized past three-year
Fung-Hsieh (2004) alpha t-statistics. As the data starts in January 1994 and the first
three years are used for coefficient estimation the first holding year is 1997. This
procedure results in altogether 14 re-allocations and 168 individual monthly excess
returns for each portfolio.
The holding period weighting of each fund follows the procedure I applied to the
decile portfolios. I weight each fund equally in January and I keep that weight during
the whole holding period. If some of the funds in the portfolio cease to exist during
the holding period I do not re-invest the released capital into existing funds and the
share of the ceased funds will receive risk-free rate during the rest of the year.
Table 12 reports the annualized excess mean return, standard deviation, Sharpe
Ratio, annualized Fung-Hsieh alpha, standard deviation of Fung-Hsieh alpha
residual, Information Ratio as well as monthly 1%- and 5%-Value-at-Risk for all the
used investment strategies. For comparison purposes Table 12 reports also
performance of equally-weighted (EW) portfolio which includes all the hedge funds
in the data sample.

57
Table 12. Out-of-sample performance of all investment strategies.
Excess return (Ann.) Fung-Hsieh alpha (Ann.) VaR
Strategy Mean SD SR Alpha SD res IR 1 % 5 %
Unconditional 5.3 3.9 1.36 4.6 2.7 1.71 -4.1 -1.8
SP Only 9.1 16.0 0.57 6.1 12.5 0.49 -16.2 -7.2
VIX Only 11.0 13.9 0.79 10.2 12.0 0.85 -9.3 -6.2
DEFS Only 6.5 17.2 0.38 3.8 13.0 0.30 -17.1 -7.2
TERMS Only 4.9 15.0 0.33 1.9 12.8 0.15 -12.6 -7.4
Multi-predictor,
no fund charac. 10.3 14.2 0.72 8.7 11.1 0.78 -14.1 -5.5
Multi-predictor 10.0 14.4 0.70 8.4 10.9 0.77 -14.0 -6.1
EW 7.4 6.3 1.19 6.1 3.5 1.73 -5.7 -2.0
The first observation from Table 12 is that none of the other strategies is able to beat
the unconditional strategy in risk-adjusted basis. Even if the annual excess return and
annual Fung-Hsieh alpha of the unconditional are among the lowest compared to
other strategies its excess return volatility and alpha volatility are by far the lowest
resulting in high Sharpe Ratio (1.36) and information Ratio (1.71). This is consistent
with Jagannathan, Malakhov, and Novikov (2010). In addition 1% and 5% Value-at-
Risk of the unconditional strategy are the lowest compared to the other used
strategies and the equally-weighted portfolio meaning it introduces the lowest tail
risk.
Second, the single-predictor strategies all except VIX perform poorly providing
annual excess return from 4.9% (Term spread) to 9.1% (SP) and Fung-Hsieh alpha
from 1.9% (Term spread) to 6.1% (SP). Interestingly for some reason VIX single-
predictor strategy is able to provide substantial annual excess return and Fung-Hsieh
alpha of 11.0% and 10.2%, respectively. Also in risk-adjusted basis VIX single-
predictor strategy beats the other single-predictor strategies easily with Sharpe Ratio
and Information ratio of 0.79 and 0.85, respectively. When out-of-sample
performance of single-predictor strategies are compared to equally-weighted
portfolio in risk-adjusted basis it is clear that single-predictor strategies lose
especially in excess return and Fung-Hsieh alpha volatilities. This is of course due to
small amount of funds (40) in single-predictor strategy portfolios whereas in equally-
weighted portfolio the whole cross-section diversifies the risk away. However, this
also reveals that single-predictor strategies with chosen predictors are not able to
provide similar accuracy to portfolio allocation as unconditional strategy which is
able to provide excellent risk-adjusted performance despite the small portfolio size.

58
Third, as single-predictor strategies also multi-predictor strategies perform badly
compared to the unconditional strategy in risk-adjusted basis. Even if the both multi-
predictor strategies are able to provide annual excess returns and Fung-Hsieh alphas
that are almost twice the ones compared to unconditional strategy it comes at the
expense of significantly higher volatility making Sharpe ratios and information ratios
to be merely half of the unconditional strategy counterparts. When multi-predictor
strategies are compared to single-predictor strategies it seems that multi-predictor
strategies are able to beat all the single-predictor strategies except VIX only strategy
in risk-adjusted basis and with Value-at-Risk measures.
Two multi-predictor strategies, one with fund-specific characteristic and one without,
seem to provide virtually identical annual excess return and annual Fung-Hsieh
statistics as well as Value-at-Risk measures implying that including chosen fund-
specific characteristic predictors to the model does not add any value to the
predictive performance of the model.
Figure 7 plots the time evolution of one dollar invested by using different strategies
as well as equally-weighted portfolio from January 1997 to December 2010. As can
be seen the unconditional strategy behaves very smoothly during the whole period
whereas all the other strategies are much more volatile. In wealth wise all the other
strategies beat the unconditional strategy except the term spread only strategy. Both
multi-predictor , SP only, VIX only, and default spread only strategies seems to have
very similar trend from January 2000 until the end of 2007 when the financial crisis
hit after which all the of them suffered significant losses during 2008. Interestingly
the VIX only strategy survived this drop relatively well which mostly explains its
success as the most profitable strategy. Also Avramov, Barras, and Kosowski (2012)
find similar features from the VIX only strategy in their study.
The economic gains achieved with the different strategies are as follows. The most
successful strategy is the VIX only which reaches $2.54 for each dollar invested in
1997. The second is the multi-predictor strategy without fund characteristic
predictors reaching $2.43 but once again the multi-predictor strategy with the fund-
specific characteristics is very close with $2.41. The SP only, default spread only,

59
and term spread only strategies reach $2.28, $1.91 and $1.69, respectively. The
unconditional strategy reaches $1.74 losing even for the equally-weighted portfolio
which reaches 2.04.
Figure 7. Time variation in cumulative wealth by using different investment strategies and
equally-weighted hedge fund portfolio from January 1997 to December 2010.
To sum up, it looks like that even if multi-predictor strategies seem to be able to
predict good performers much better than single predictor strategies in portfolio
sorting scheme they are not able to do any better when real-world investment
constrains are taken into account. The main reason for that is most likely the small
number of funds which makes the return series very volatile as seen from Table 12
0.5
1
1.5
2
2.5
3
Jan-97 Jan-99 Jan-01 Jan-03 Jan-05 Jan-07 Jan-09 Jan-11
Unconditional
Multi-predictor
Multi-pred. NFC
SP Only
VIX Only
TERMS Only
DEFS Only
EW

60
and from Figure 7. The second reason is that the model does not take into account
anyhow the true predictability. For example in single-predictor strategies the
predictor coefficient for a fund may end up being very large but statistically
insignificant. In that case the fund is selected to the portfolio without any evidence of
predictability and as Table 8 shows the true predictability varies widely among
different predictors. With multi-predictor strategies this problem is even more
complicated as some of the predictors may predict the future reliably but some may
not. To overcome these problems the model should be developed to take into account
the true predictability of different predictors more accurately in a similar manner as
done for example in Avramov, Barras, and Kosowski (2012).

61
5 CONCLUSIONS
Since the dawn of the hedge fund industry over 60 years ago a lot has changed.
Hedge funds were once a niche almost no one was aware of but today they hit the
headlines more often than any other branch in the financial industry; sometimes for
the stellar returns they have earned for their investors and managers, sometimes for
total collapses or even pyramid schemes. Despite the complete change in their image
hedge funds have remained their initial economic function. As over 60 years ago
hedge funds still aim at providing healthy returns to their investor in all economic
conditions.
The performance of hedge funds and its persistence have been among the most
studied areas in academic finance research and the recent studies evidently show that
there are hedge funds which are persistently able to provide superior risk-adjusted
returns. Once such a feature is present for a financial asset, it inevitably attracts trials
to explain where the performance is coming from and especially if the future
performance could be predicted. This is also the subject of this study.
In this study I develop a predictive model which aims at predicting future hedge fund
returns. By applying the model I answer to the following questions: Can future hedge
fund returns be predicted with the model, predictor by predictor, at the individual
fund level by using macroeconomic and fund-specific characteristic predictors? Is
the model able to predict future hedge fund returns out-of-sample with
macroeconomic and fund characteristic variables? Moreover, can hedge fund
investors exploit the model to improve performance? The predictive model I
develop in this study is based on a random coefficient model which to my best
knowledge has never been applied in a hedge fund predictability study before. The
macroeconomic predictors I use are the default spread, the market return, the term
spread, and VIX volatility index which all are well economically motivated and
documented to predict returns of different asset classes. The fund-specific
characteristic predictors I use are the incentive fee, the size, and the age of a hedge
fund. The data I use in this study is based on BarclayHedge database and, after
controlling for different data biases, consists of over 6000 individual hedge funds
from January 1994 to December 2010.

62
The answer to the first question is yes. I show clear evidence on hedge fund
predictability when using four different macroeconomic predictors. To illustrate, in
Fund of Funds strategy category 1459 funds out of 1681 are positively predictable
with the market return. In fact, in all 12 strategy categories there are funds which are
predictable, either positively or negatively, with all four macroeconomic predictors.
In addition, the predictability has a very asymmetric nature; for example if in a
certain strategy category there are many funds which are positively predictable with
a certain predictor, it is very unlikely that there are many funds which are negatively
predictable. I show also that funds are predictable with fund-specific characteristic
predictors. In this case predictability is not asymmetric but all strategy categories are
positively predictable with incentive fee, negatively predictable with size, and
negatively predictable with age which is well consistent with previous literature.
The answer to the second question is also yes. I use portfolio sorts which take into
account real-world hedge fund investment constrains to show that hedge funds which
are predicted to perform the best during the one year holding period actually do so.
The highest decile portfolio provides Fung-Hsieh alpha as high as 7.83% per annum,
substantially higher than any other model I consider. In risk-adjusted basis my model
loses only to the unconditional strategy proposed by Jagannathan, Malakhov, and
Novikov (2010). I also show that the model has difficulties to predict the funds
which are expected to perform the worst, but this is due to high attrition rates in the
lowest deciles. My results also imply that the fund-specific characteristic predictors
do not add much value to the model, but the predictions are mainly driven by the
macroeconomic predictors.
The answer to the third question is not as clear as for the two previous ones. To study
the economic value of predictability my model is able to provide I take into account
further real-world constrains to imitate a fund of funds. I form a single portfolio of
40 funds where I allocate the funds which are expected to perform the best according
to my model. Even if my model still perform best among the strategies in absolute
measures, in risk-adjusted basis my model performs poorly (SR = 0.7, IR = 0.77)
compared to the unconditional strategy (SR = 1.36, IR = 1.71). Finally, to study the
real economic value of my model, I conduct a horse race where I plot the growth of

63
one dollar invested in each different strategy I consider. From January 1997 to 2010
the dollar invested according to my model has a terminal value of $2.41,
substantially higher than most of the strategies I consider. Interestingly VIX only
strategy still beats my strategy with a terminal value of $2.54.
Even if my model seems the be able to predict the future returns of hedge funds and a
random coefficient model seems to suit well to this task there is still room for
improvement. Maybe the biggest weakness in my model is that it does not take into
account the true predictability. This results in that in portfolio allocations my model
may select funds which have large coefficients for different predictors but the
coefficients are not statistically significant, i.e. selected funds are not predictable.
One improvement could be the scaling of coefficient with its standard error or weight
predictors according to their accuracy in multi-predictor model. However, this is left
for future development.

64
REFERENCES
Agarwal, V., Daniel, N.D. & Naik, N.Y. (2009). Role of Managerial Incentives and
Discretion in Hedge Fund Performance. The Journal of Finance. 64(5), 2221-
2256.
Agarwal, V. & Naik, N.Y. (2000). Multi-period performance persistence analysis of
hedge funds. The Journal of Financial and Quantitative Analysis. 35(3), 327-42.
Aggarwal, R.K. & Jorion, P. (2010). The performance of emerging hedge funds and
managers. Journal of Financial Economics. 96(2), 238-256.
Amenc, N., El Bied, S. & Martellini, L. (2003). Predictability in Hedge Fund
Returns. Review of Financial Studies. 17, 63-98.
Avramov, D., Barras, L. & Kosowski, R. (2012). Hedge Fund Return Predictability
Under the Magnifying Glass. Journal of Financial and Quantitative Analysis.
Forthcoming. Available at SSRN: http://ssrn.com/abstract=2028706
Avramov, D., Kosowski, R., Naik, N.Y. & Teo, M. (2011). Hedge Funds,
Managerial Skill, and Macroeconomic Variables. Journal of Financial Economics.
99(3), 672-692.
Anson, M.J.P. (2002). Handbook of alternative assets. New York: John Wiley &
Sons, Inc.
Bali, T.G., Brown, S.J. & Caglayan M.O. (2011). Do hedge funds' exposures to risk
factors predict their future returns? Journal of Financial Economics. 101(1), 36-
68.
Bali, T.G., Gokcan, S. & Liang, B. (2007). Value at risk and the cross-section of
hedge funds. Journal of Banking & Finance. 31, 1135-1166.
Baquero, G., Ter Horst J. & Verbeek, M. (2005). Survival, Look-Ahead Bias and the
Persistence in Hedge Fund Performance. The Journal of Financial and
Quantitative Analysis. 40, 493-517.
Barras, L., Scaillet, O. & Wermers, R.R. (2010). False discoveries in mutual fund
performance: Measuring luck in estimated alphas. The Journal of Finance. 65(1),
179-216.
Berk, J. & Green, R.C. (2004). Mutual fund flows and performance in rational
markets. Journal of Political Economy. 112(6), 1269-1295.
Campbell, J.Y. (1987). Stock returns and the term structure. Journal of Financial
Economics. 18(2), 373-399.
Chevalier, J. & Ellison, G. (1999). Are some mutual fund managers better than
others? Cross-sectional patterns in behavior and performance. The Journal of
Finance. 54(3), 875-899.
Edwards, F. & Caglayan, M.O. (2001). Hedge fund performance and managerial
skill. Journal of Futures Markets. 21(11), 1003-1028.
Fama, E.F. & French, K.R. (1989). Business Conditions and Expected Returns on
Stocks and Bonds. Journal of Financial Economics. 25, 23-49.
Fama, E.F. & French, K.R. (2010). Luck versus skill in the cross section of mutual
fund alpha estimates. The Journal of Finance. 65(5), 1915-1947.
Ferson, W.E., Sarkissian, S. & Simin, T. (2008). Asset pricing models with
conditional betas and alphas: The effects of data snooping and spurious
regression. Journal of Financial and Quantitative Analysis. 43(2), 331-353.
Fung, W. & Hsieh, D.A. (2000). Performance characteristics of hedge funds and
CTA funds: Natural versus spurious biases. Journal of Financial and Quantitative
Analysis. 35, 291-307.

65
Fung, W. & Hsieh, D.A. (2001). The risk in hedge fund strategies: theory and
evidence from trend followers. The Review of Financial Studies. 14(2), 313-341.
Fung, W. & Hsieh, D.A. (2004). Hedge fund benchmarks: a risk-based approach.
Financial Analysts Journal. 60(5), 65.
Fung, W., Hsieh, D.A., Naik, N.Y. & Ramadorai, T. (2008). Hedge funds:
Performance, risk and capital formation. The Journal of Finance. 63(4), 1777-
1803.
Goetzmann, W.N., Ingersoll, J.E. & Ross, S.A. (2003). High-water marks and hedge
fund management contracts. The Journal of Finance. 58(4), 1685-1718.
Goyal, A. & Welch, I. (2008). A comprehensive look at the empirical performance of
equity premium prediction. Review of Financial Studies. 21, 1455-1508.
Harvey, C.R. (1988). The real term structure and consumption growth. Journal of
Financial Economics. 22(2), 305-333.
Henderson, C.R. (1984). Applications of Linear Models in Animal Breeding.
University of Guelph.
Hjalmarsson, E. (2010). Predicting global stock returns. Journal of Financial and
Quantitative Analysis 45, 49–80.
Jagannathan, R., Malakhov, A. & Novikov, D. (2010). Do hot hands exist among
hedge fund managers? An empirical evaluation. The Journal of Finance. 65(1),
217-255.
Joenväärä, J., Kosowski, R. & Tolonen, P. (2012). New 'stylized facts' about hedge
funds and database selection bias. Working paper Series. Available at SSRN:
http://ssrn.com/abstract=1989410
Keim, D.B. & Stambaugh, R.F. (1986). Predicting returns in the stock and bond
markets. Journal of Financial Economics. 17, 357-390.
Kosowski, R., Naik, N.Y. & Teo, M. (2007). Do hedge funds deliver alpha? A
Bayesian and bootstrap analysis. Journal of Financial Economics. 84(1), 229-264.
Lhabitant, F.S. (2006). Handbook of hedge funds. Chichester, England: John Wiley
& Sons, Ltd.
Liang, B. (1999). On the performance of hedge funds. Financial Analysts Journal.
55(4), 72.
Liang, B. (2000). Hedge funds: The living and the dead. Journal of Financial and
Quantitative Analysis. 35(3), 309-326.
Littell, R.C., Milliken, G.A., Stroup, W.W., Wolfinger, R.D. & Schabenberger, O.
(2006). SAS® for Mixed Models, Second Edition. Cary: SAS Institute Inc.
Newey, W.K. & West, K.D. (1987). A simple, positive semi-definite,
heteroskedasticity and autocorrelation consistent covariance matrix. Econometrica
55, 703-708.
Rapach, D.E. & Zhou, G. (2012). Forecasting stock returns. Working paper - In
preparation for the Handbook of Economic Forecasting, volume 2.
Taylor, S.J., Yadav, P.K. & Zhang, Y. (2010). The information content of implied
volatilities and model-free volatility expectations: Evidence from options written
on individual stocks. Journal of Banking & Finance. 34(4), 871-881.