Jackson Hole Market Report | 2015 Quarter 3
4
MARKET REPORT OVERVIEW OF THE JACKSON HOLE REAL ESTATE MARKET | 2015 THIRD QUARTER Christie’s International Real Estate GLOBAL AFFILIATE OF THE YEAR 2011 | 2014
-
Upload
jackson-hole-real-estate-associates -
Category
Documents
-
view
215 -
download
0
description
The 2015 quarter 3 comprehensive market report for the Jackson Hole area prepared by Jackson Hole Real Estate Associates.
Transcript of Jackson Hole Market Report | 2015 Quarter 3
MARKETREPORTOVERVIEW OF THE JACKSON HOLE REAL ESTATE MARKET | 2015 THIRD QUARTER
Christie’s International Real Estate G L O B A L A F F I L I A T E O F T H E Y E A R
2011 | 2014
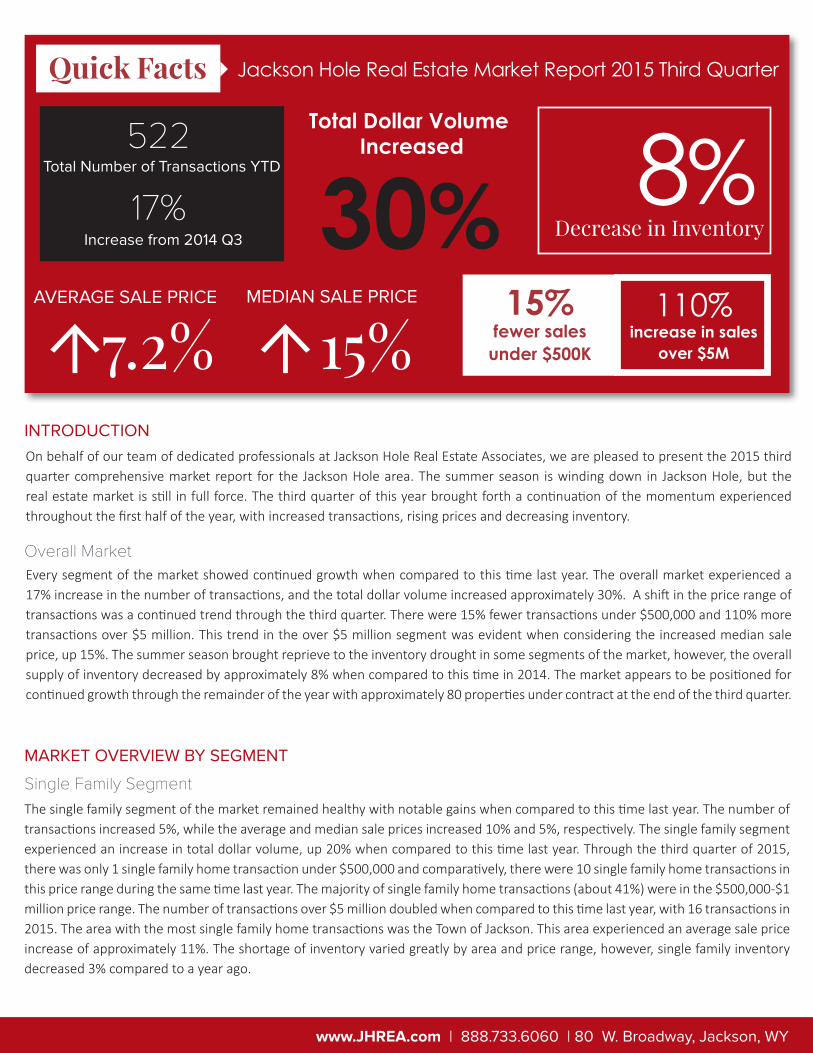
Overall MarketEvery segment of the market showed continued growth when compared to this time last year. The overall market experienced a 17% increase in the number of transactions, and the total dollar volume increased approximately 30%. A shift in the price range of transactions was a continued trend through the third quarter. There were 15% fewer transactions under $500,000 and 110% more transactions over $5 million. This trend in the over $5 million segment was evident when considering the increased median sale price, up 15%. The summer season brought reprieve to the inventory drought in some segments of the market, however, the overall supply of inventory decreased by approximately 8% when compared to this time in 2014. The market appears to be positioned for continued growth through the remainder of the year with approximately 80 properties under contract at the end of the third quarter.
INTRODUCTION
MARKET OVERVIEW BY SEGMENT
Single Family SegmentThe single family segment of the market remained healthy with notable gains when compared to this time last year. The number of transactions increased 5%, while the average and median sale prices increased 10% and 5%, respectively. The single family segment experienced an increase in total dollar volume, up 20% when compared to this time last year. Through the third quarter of 2015, there was only 1 single family home transaction under $500,000 and comparatively, there were 10 single family home transactions in this price range during the same time last year. The majority of single family home transactions (about 41%) were in the $500,000-$1 million price range. The number of transactions over $5 million doubled when compared to this time last year, with 16 transactions in 2015. The area with the most single family home transactions was the Town of Jackson. This area experienced an average sale price increase of approximately 11%. The shortage of inventory varied greatly by area and price range, however, single family inventory decreased 3% compared to a year ago.
www.JHREA.com | 888.733.6060 | 80 W. Broadway, Jackson, WY
On behalf of our team of dedicated professionals at Jackson Hole Real Estate Associates, we are pleased to present the 2015 third quarter comprehensive market report for the Jackson Hole area. The summer season is winding down in Jackson Hole, but the real estate market is still in full force. The third quarter of this year brought forth a continuation of the momentum experienced throughout the first half of the year, with increased transactions, rising prices and decreasing inventory.
Quick Facts
522Total Number of Transactions YTD
AVERAGE SALE PRICE
17%Increase from 2014 Q3
→7.2%MEDIAN SALE PRICE
15%
Jackson Hole Real Estate Market Report 2015 Third Quarter
15%fewer sales
under $500K
30% Total Dollar Volume
Increased 8%Decrease in Inventory
110%increase in sales
over $5M→
www.JHREA.com | 888.733.6060 | 80 W. Broadway, Jackson, WY
Condominium & Townhome Segment
The condominium/townhome segment remained strong through the third quarter of 2015 with 190 transactions, up nearly 25%. The average sale price increased an astounding 39%. This increase can be attributed to the sellout of a new luxury townhome development in Teton Village. The median sale price, a more accurate sale price indicator, was $505,000, a 12% increase. There were approximately 17% fewer condominium/townhome transactions under $1 million. Conversely, the number of condominium/townhome transactions over $3 million doubled when compared to last year. The Town of Jackson, where the majority of transactions took place, experienced an approximate 15% increase in average sale price. Condominium/townhome transactions in Teton Village increased nearly 80% largely due to the surge of transactions in the Shooting Star development. The condominium/townhome segment was the only segment of the market where the inventory increased by approximately 7%.
Vacant Land Segment
The vacant land segment of the market continued to show gains due to the inventory shortage in single family homes. The number of transactions increased dramatically (a 37% increase) when compared to the end of the third quarter of 2014. Even more dramatic was the approximate 60% increase in median sale price and 40% increase in total dollar volume. This was primarily the result of a shift in the price range where buyers purchased vacant land. The market share in the $1 million - $2 million range was slightly less than the under $500,000 range, 23% and 29% respectively. Vacant land transactions over $2 million represented nearly 30% of total vacant land transactions. Teton Village experienced the majority of land sales spurred by the popularity of the Shooting Star development. As the vacant land segment of the market continues to grow, inventory continues to diminish; down approximately 15% when compared to this time in 2014.
MARKET OVERVIEW BY SEGMENT (continued)
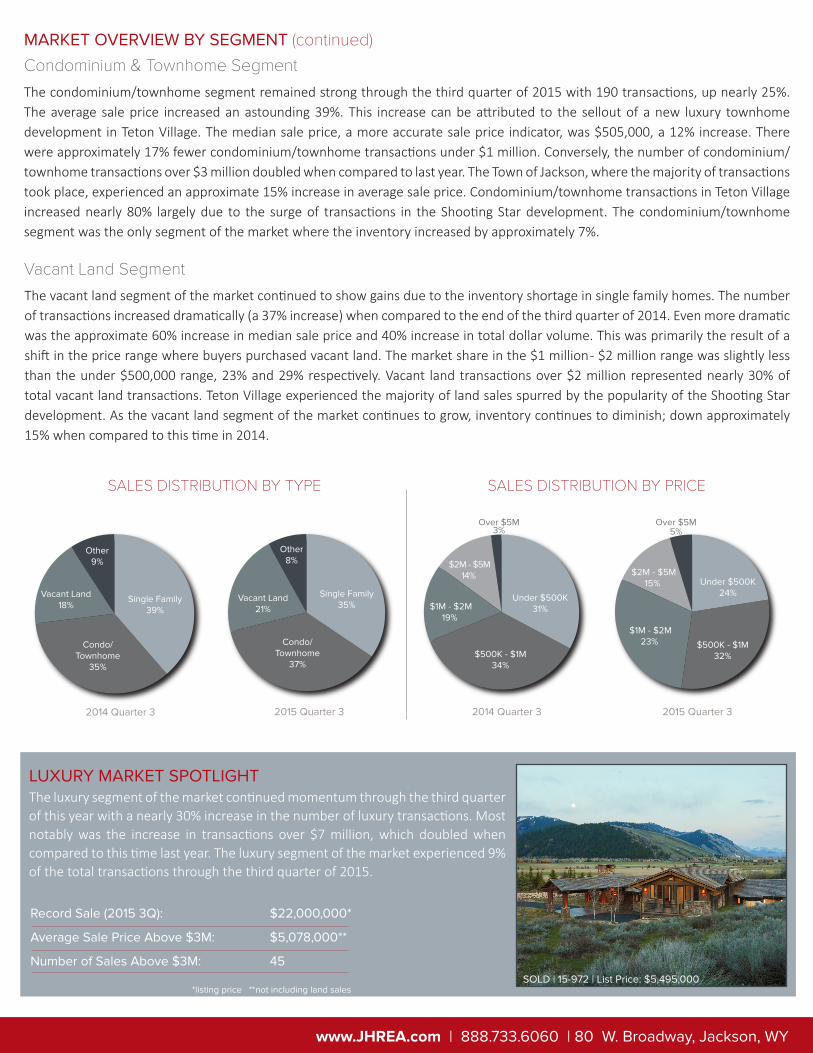
2015 Quarter 3 2014 Quarter 3 2015 Quarter 3
SALES DISTRIBUTION BY TYPE SALES DISTRIBUTION BY PRICE
Condo/ Townhome
35%
Single Family39%
Vacant Land18%
Other9%
$500K - $1M32%
Under $500K24%
$1M - $2M23%
$2M - $5M15%
Over $5M5%
Condo/ Townhome
37%
Single Family35%
Vacant Land21%
Other8%
$500K - $1M34%
Under $500K31% $1M - $2M
19%
$2M - $5M14%
Over $5M3%
LUXURY MARKET SPOTLIGHT
SOLD | 15-972 | List Price: $5,495,000
The luxury segment of the market continued momentum through the third quarter of this year with a nearly 30% increase in the number of luxury transactions. Most notably was the increase in transactions over $7 million, which doubled when compared to this time last year. The luxury segment of the market experienced 9% of the total transactions through the third quarter of 2015.
Record Sale (2015 3Q): $22,000,000*
Average Sale Price Above $3M: $5,078,000**
Number of Sales Above $3M: 45
*listing price **not including land sales
2014 Quarter 3
Jackson Hole Real Estate Associates exclusively owns and maintains the valley’s oldest and most comprehensive database. The Jackson Hole Real Estate Associates’ Market Report, unlike others in the valley, is derived from the JHREA proprietary, forty year old database (not just mls data) as well as decades of history and success, making this the most trusted and accurate real estate report in the region. No other real estate company or agent has the resources available to offer this depth of expertise or insight regarding current or previous market conditions. The unmatched resources and knowledge of Jackson Hole Real Estate Associates, the largest and most dynamic real estate company in the region, combined with the largest luxury real estate affiliation, Christie’s International Real Estate, offer the ideal balance of local expertise and global reach.
307 733 6060 TEL
307 733 3483 FAX
www.JHREA.comwww.starvalleyrealestate.comwww.JHREAtetonvalley.comwww.westernranches.com
80 West BroadwayPO Box 4897
Jackson, WY 83001
270 West Pearl
Jackson, WY 83001
Snow King Hotel Jackson, WY 83001
PO Box 322546 Iron Horse DriveAlpine, WY 83128
307 654 7575 TEL
PO Box 846235 South Main StreetThayne, WY 83127
307 883 7575 TEL
65 South Main StreetDriggs, ID 83422208 354 7325 TEL
Our Locations
www.JHREA.com | 888.733.6060 | 80 W. Broadway, Jackson, WY
* The statistics used in this report are from the Teton Multiple Listing Service (MLS) and JHREA’s internal database.* This report does not go into detail on every segment of the market, but is intended to offer an overview of general market conditions. Statistics are cumulative.* All statistics are supplied by sources that have been deemed reliable but are not guaranteed.
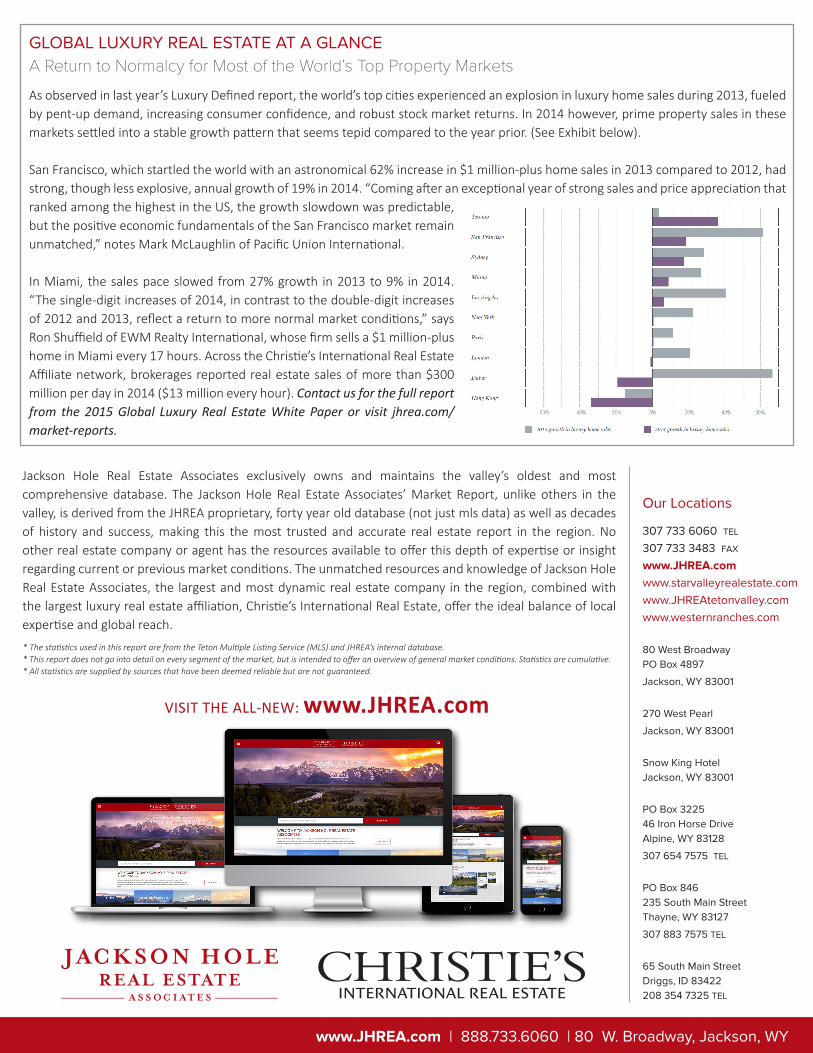
As observed in last year’s Luxury Defined report, the world’s top cities experienced an explosion in luxury home sales during 2013, fueled by pent-up demand, increasing consumer confidence, and robust stock market returns. In 2014 however, prime property sales in these markets settled into a stable growth pattern that seems tepid compared to the year prior. (See Exhibit below).
San Francisco, which startled the world with an astronomical 62% increase in $1 million-plus home sales in 2013 compared to 2012, had strong, though less explosive, annual growth of 19% in 2014. “Coming after an exceptional year of strong sales and price appreciation that ranked among the highest in the US, the growth slowdown was predictable, but the positive economic fundamentals of the San Francisco market remain unmatched,” notes Mark McLaughlin of Pacific Union International.
In Miami, the sales pace slowed from 27% growth in 2013 to 9% in 2014. “The single-digit increases of 2014, in contrast to the double-digit increases of 2012 and 2013, reflect a return to more normal market conditions,” says Ron Shuffield of EWM Realty International, whose firm sells a $1 million-plus home in Miami every 17 hours. Across the Christie’s International Real Estate Affiliate network, brokerages reported real estate sales of more than $300 million per day in 2014 ($13 million every hour). Contact us for the full report from the 2015 Global Luxury Real Estate White Paper or visit jhrea.com/market-reports.
GLOBAL LUXURY REAL ESTATE AT A GLANCEA Return to Normalcy for Most of the World’s Top Property Markets
VISIT THE ALL-NEW: www.JHREA.com