Invitations to Mathematics - CEMC · Related “Family Math ... connections to other subjects such...
54
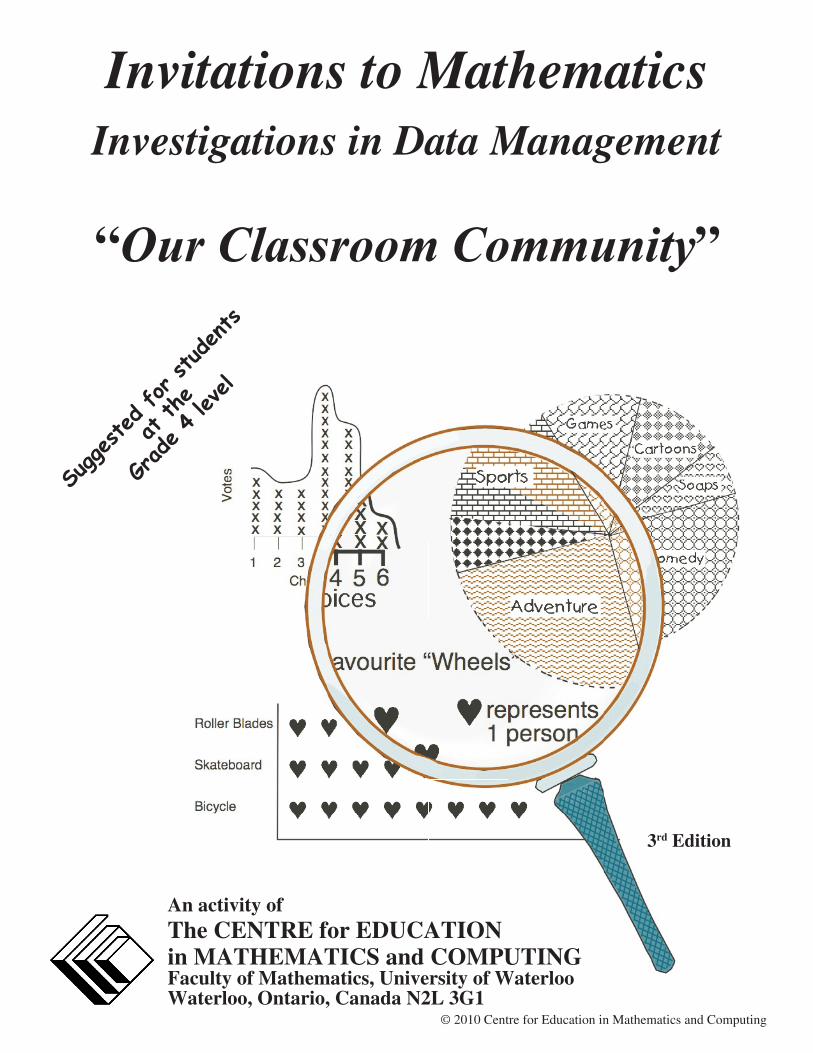
© 2010 Centre for Education in Mathematics and Computing Invitations to Mathematics Investigations in Data Management An activity of The CENTRE for EDUCATION in MATHEMATICS and COMPUTING Faculty of Mathematics, University of Waterloo Waterloo, Ontario, Canada N2L 3G1 Suggested for students at the Grade 4 level “Our Classroom Community” 3 rd Edition
Transcript of Invitations to Mathematics - CEMC · Related “Family Math ... connections to other subjects such...
© 2010 Centre for Education in Mathematics and Computing
Invitations to MathematicsInvestigations in Data Management
An activity ofThe CENTRE for EDUCATIONin MATHEMATICS and COMPUTINGFaculty of Mathematics, University of WaterlooWaterloo, Ontario, Canada N2L 3G1
Suggested for s
tudents
at th
e
Grade 4 lev
el
“Our Classroom Community”
3rd Edition

Copyright © 1997, 1998, 2004, 2007, 2010 byThe Centre for Education in Mathematics and ComputingFaculty of Mathematics, University of WaterlooWaterloo, Ontario Canada N2L 3G1
Limited reproduction permission:
1. The Centre for Education in Mathematics and Computing grants permission to individual teachers to reproduce the Black Line Masters as needed for use with their own students.
2. The Centre for Education in Mathematics and Computing grants permission to an educator providing a professional development workshop to make up to 35 copies of the Black Line Masters for any individual activity for use with one group.
Reproduction of text pages for an entire school or school district or for commercial use is prohibited.

i
Investigations in Data Management Grade 4: Our Classroom Community
Preface
Preface
The Centre for Education in Mathematics and Computing at the University of Waterloo is dedicated to the development of materials and workshops that promote effective learning and teaching of mathematics. This unit is part of a project designed to assist teachers of Grades 4, 5, and 6 in stimulating interest, competence, and pleasure in mathematics, among their students. While the activities are appropriate for either individual or group work, the latter is a particular focus of this effort. Students will be engaged in collaborative activities which will allow them to construct their own meanings and understanding. This emphasis, plus the extensions and related activities included with individual activities/projects, provide ample scope for all students’ interests and ability levels. Related “Family Math” activities to involve the students’ parents/care givers are also suggested.
Each unit consists of a sequence of activities intended to occupy about one week of daily classes; however, teachers may choose to take extra time to explore the activities and extensions in more depth. The units have been designed for specific grades, but need not be so restricted. Activities are related to the Ontario Curriculum but are easily adaptable to other locales.
Investigations in Data Management is comprised of activities to enhance the students’ abilities to collect, represent, and interpret data, frequently in a problem-solving mode. Since today’s media make constant use of data presented in various forms (often in order to sway opinion), it is especially important to help students learn to read and interpret these graphs, charts, or tables. Data management is equally important in the depth and variety of its connections to other subjects such as environmental studies.
Information on all the available units in the Invitations to Mathematics series can be found at the end of this booklet.
ii
Grade 4: Our Classroom Community Investigations in Data Management
Acknowledgements
Contributing Authors Anne Cirillo (Metropolitan Separate School Board) Nancy Dykstra (Waterloo County Board of Education) Craig Fleming (Waterloo County Board of Education) Jackie Harris (Metropolitan Separate School Board) Kathy Kubota-Zarivnij (Metropolitan Separate School Board) Liesel Knaach (Waterloo County Board of Education) Kelly Lantink (Waterloo County Board of Education) Pat Margerm (Metropolitan Separate School Board) Bev Marshman (University of Waterloo) Brian McCudden (Metropolitan Separate School Board) Lorna Morrow (Mathematics Consultant) Ron Sauer (Waterloo County Board of Education)
Editors Bev Marshman (University of Waterloo) Lorna Morrow (Mathematics Consultant)
We wish to acknowledge the support of the Centre for Education in Mathematics and Computing, and in particular the efforts of Ron Scoins, Gord Nichols, Patty Mah, and Carolyn Jackson.
Acknowledgements

iii
Investigations in Data Management Grade 4: Our Classroom Community
Contents
Preface ........................................................................................................................................ i
Contributing Authors .............................................................................................................. ii
Table of Contents .................................................................................................................. iii
Overview ......................................................................................................................................1 Common Beliefs ..................................................................................................................................1 essential Content ............................................................................................................................2 CurriCulum ConneCtions ....................................................................................................................3 assessment .........................................................................................................................................4 Prerequisites .....................................................................................................................................5 logos ...................................................................................................................................................5 materials ...........................................................................................................................................5 letter to Parents ..............................................................................................................................6
Activity 1: Interpreting Incomplete Bar Graphs..............................................................7
Activity 2: Predicting a Bar Graph ..................................................................................... 12
Activity 3: Collecting and Displaying Data ........................................................................ 15
Activity 4: Types of Graphs ................................................................................................ 18
Activity 5: Presenting Classroom Graphs ..........................................................................23
Black Line Masters:BLM 1: Incomplete Bar Graphs ...........................................................................................26BLM 2: Possible Graph Descriptions ...................................................................................27BLM 3: Alternative Graph Descriptions ............................................................................28BLM 4: Predicted Graphs ......................................................................................................29BLM 5: Data Collection Sheet/Questionnaire .................................................................30BLM 6: Double Bar Graphs .................................................................................................... 31BLM 7: Different Types of Graphs ....................................................................................32BLM 8: Circle, Bar and Picto Graphs ..................................................................................33BLM 9: Assessing Group Presentations .............................................................................34BLM 10: Sample Graphs - 1 ...................................................................................................35BLM 11: Sample Graphs - 2 ..................................................................................................36BLM 12: Templates for Circle Graphs ...............................................................................37Solutions & Notes .................................................................................................................38
Suggested Assessment Strategies ..................................................................................42
Other Resources ....................................................................................................................48
Table of Contents

Overview Page 1
Investigations in Data Management Grade 4: Our Classroom Community
�����
Overview
Common BeliefsThe activities in this booklet have been developed within the context of certain beliefs and values about mathematics generally, and data management specifically. Some of these beliefs are described below.
Importance of StatisticsIn an information-rich society such as ours, statistics are an increasingly important aspect of daily life. “Educators and mathematicians now stress the importance of incorporating data analysis in the elementary mathematics curriculum to prepare students for living and working in a world filled with information based on data.” Corwin and Russell
Connections to Other Curriculum Subjects and Mathematics StrandsActivities which involve data management can provide a meaningful link to other content areas such as environmental studies and science. These activities help students to develop critical-thinking and problem-solving skills, and can reinforce communication skills as students discuss and write about their conclusions. Within mathematics, these activities provide opportunities for students to represent, interpret, and discuss information, as well as estimate, measure and develop number sense.
Connections to the Real WorldThrough collecting and analyzing real data, students encounter the uncertainty and intrigue of real mathematics. “We are living in a world of information. Stop and think a moment about the number of facts, figures, and other data that confront us each day. What do we do with all this information? We ignore some of it, we organize some of it to fit what we already know, or we summarize it by using shorter descriptions or other numbers. How is this information presented to us? It may be presented in written descriptions, in graphs or tables or in summary numbers such as averages. How do we learn to make sense of all this information? This is where we, the K-6 teachers and teacher educators, enter the picture; we need to help our students - from the time they first enter school - to make sense of data.”
National Council of Teachers of Mathematics (NCTM)
Importance of LanguageA central activity in data analysis is dialogue and discussion. In a classroom setting, a significant amount of time should be devoted to reflection, discussion, and writing about the meaning of the data.
Importance of Real DataIn data analysis, students use numbers to describe, compare, predict, and make decisions. Because real data are used, there are no predetermined “answers”. “Not only do you not know the answer [to the investigation] in advance, but, without seeing the data, you may not even know what the most interesting questions are going to be!” Corwin and Russell
Good tasks are ones that do not separate mathematical thinkinG from mathematical concepts or skills, that capture students’ curiosity and invite them to speculate and to pursue their hunches.
NCTM

Grade 4: Our Classroom Community Investigations in Data Management
�����
Page 2 Overview
Overview
essential ContentThe activities in this unit deal primarily with data management, specifically, collecting, displaying, and analysing data. In addition, there are Extensions in Mathematics, Cross-Curricular Activities and Family Activities. These may be used prior to or during the activity as well as following the activity. They are intended to suggest topics for extending the activity, assisting integration with other subjects, and involving the family in the learning process.
During this unit, the student will:• collect information;• develop methods of data collection;• suggest possible meanings of an incomplete bar graph;• identify a variety of graphs;• identify components of a bar graph;• interpret a bar graph, a circle graph, and a picto-graph;• create a bar graph, a circle graph, and a picto-graph;• justify opinions with coherent arguments;• use correct mathematical language;• collaborate with other members of a group.
Overview Page 3
Investigations in Data Management Grade 4: Our Classroom Community
�����
Overview
ACTIVITY
Activity 1
Interpreting Incomplete Bar Graphs
Activity 2
Predicting a Bar Graph
Activity 3
Collecting and
Displaying Data
Activity 4
Types of Graphs
Activity 5
Presenting Classroom Graphs
DESCRIPTION OF THE ACTIVITY
• identifying parts of a bar graph• interpreting bar graphs• justifying predictions about
bar graphs, using mathematical language
• identifying parts of a bar graph• interpreting bar graphs• creating bar graphs
• devising a questionnaire• predicting the shape of a bar graph• collecting and displaying data• creating a bar graph
• interpreting bar, circle, and picto-graphs• comparing different types of
graphs• constructing circle and picto-graphs
• illustrating bar, circle, and picto-graphs• describing aspects of graphs using mathematical language• assessing others’ graphs and
presentations
CURRICULUM EXPECTATIONS
• use conventional symbols, titles, and labels when displaying data • recognize the purposes of different parts of a graph• read and interpret data
presented on ... graphs
• use conventional symbols, titles, and labels when displaying data
• recognize the purposes of different parts of a graph
• construct labelled graphs
• before gathering data, predict the possible results of a survey
• construct labelled graphs• explain how data were
collected and describe the results of a survey
• display data on picto-graph or bar graph
• use conventional symbols, titles, and labels when displaying data
• read and interpret data presented on ... graphs (e.g., circle graphs)
• interpret displays of data and present the information using mathematical terms
• explain how the data were collected and describe the results of a survey
CURRICULUM CONNECTIONS
Page 4 Overview
Grade 4: Our Classroom Community Investigations in Data Management
�����
Overview
assessmentAssessment is a process of gathering evidence about a student’s knowledge, skills, and values, and of making inferences based on that evidence for a variety of purposes. These purposes include: making instructional decisions; monitoring student progress; evaluating student achievement in terms of defined criteria; and evaluating programs.
Attention should be given to a broad range of assessment practices such as: • assessing what students know and how they think about mathematics;
• focusing on a broad range of mathematical tasks and taking a holistic view of mathematics;
• assessing student performance in a variety of ways, including written, oral, and demonstration forms;
• using calculators, computers, and manipulatives;
• recognizing such attitudinal outcomes as motivation and appreciation;
• assessing the process as well as the product.
Tests are one way of determining what students have learned, but mathematical competence involves such characteristics as the ability to communicate, problem-solving ability, higher-order thinking ability, creativity, persistence, and curiosity. Because of the nature of the activities it is suggested that a variety of types of assessment be used. Suggestions include:
(i) observing students as they work to see if they are applying various concepts; to see if they are working cooperatively; to observe their committment to the tasks;
(ii) assessing the completed project to see if instructions have been followed; to see if concepts have been applied correctly; to see if the language of mathematics has been used correctly;
(iii) assessing the students’ descriptions of their completed work to see if mathematical language is used correctly; to see if students understand the concepts used;
(iv) providing opportunities for student self-assessment: have students write explanations of their understanding, opinion, or feelings about an activity. One technique is to have them write under the headings What I Did, What I Learned, and How I Felt About It. Students could be asked to write a review of one day’s activities or of the whole unit’s work.
(v) selecting an exemplary piece of work to be included in a portfolio for assessment purposes or for sharing with parents.
See Suggested Assessment Strategies, page 41, for further discussion and sample rubrics.
Overview Page 5
Investigations in Data Management Grade 4: Our Classroom Community
�����
Overview
Prerequisites Students need not have had extensive experience with data collection, display,
or analysis, but the use of a tally when collecting or organizing data will be helpful.
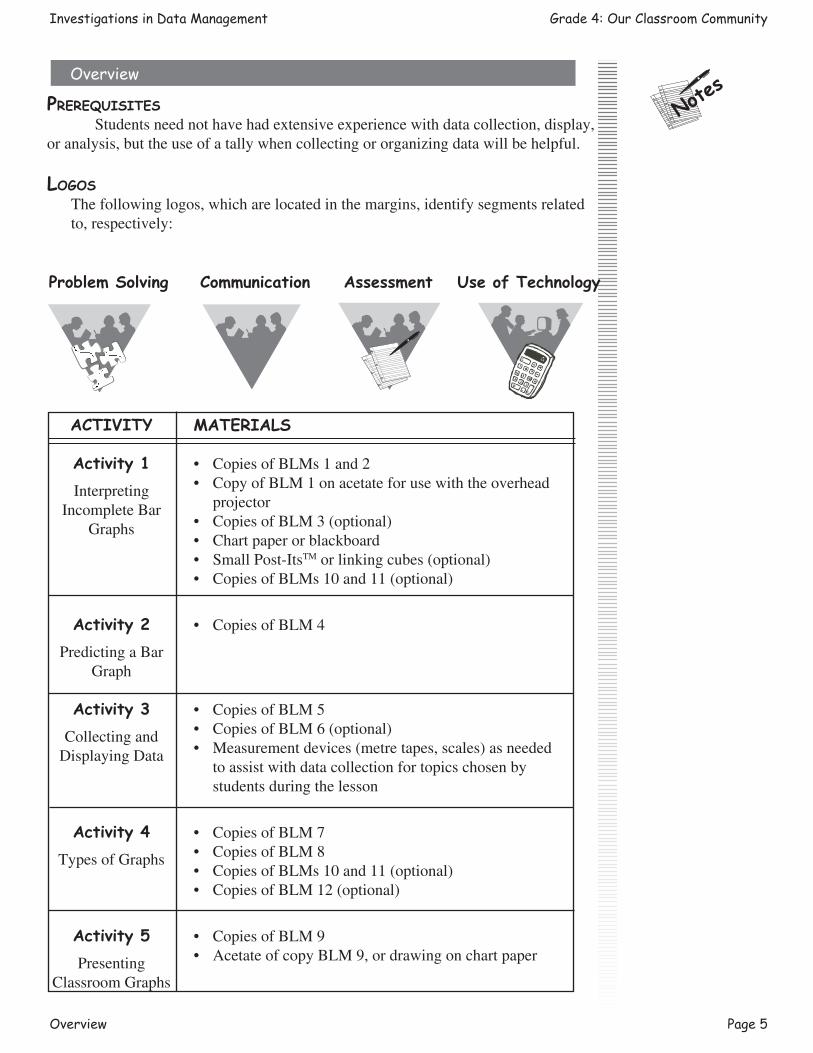
logosThe following logos, which are located in the margins, identify segments related to, respectively:
ACTIVITY
Activity 1Interpreting
Incomplete Bar Graphs
Activity 2Predicting a Bar
Graph
Activity 3Collecting and
Displaying Data
Activity 4Types of Graphs
Activity 5Presenting
Classroom Graphs
MATERIALS
• Copies of BLMs 1 and 2• Copy of BLM 1 on acetate for use with the overhead
projector• Copies of BLM 3 (optional)• Chart paper or blackboard• Small Post-ItsTM or linking cubes (optional)• Copies of BLMs 10 and 11 (optional)
• Copies of BLM 4
• Copies of BLM 5• Copies of BLM 6 (optional)• Measurement devices (metre tapes, scales) as needed
to assist with data collection for topics chosen by students during the lesson
• Copies of BLM 7• Copies of BLM 8 • Copies of BLMs 10 and 11 (optional)• Copies of BLM 12 (optional)
• Copies of BLM 9• Acetate of copy BLM 9, or drawing on chart paper
Problem Solving Communication Assessment Use of Technology

Page 6 Overview
Grade 4: Our Classroom Community Investigations in Data Management
�����
Overview
letter to Parents
SCHOOL LETTERHEAD
DATE
Dear Parent(s)/Guardian(s):
For the next week students in our classroom will be participating in a unit titled “Our Classroom Community”. The classroom activities will focus on data collection and organization, graph creation and interpretation, and predicting trends based on the data collected.
You can assist your child in understanding the relevant concepts by working together to look for situations where graphs might be used, and by helping in the collection of data for the purpose of creating graphs.
Various family activities have been planned for use throughout this unit. Helping your child with the completion of these will enhance his/her understanding of the concepts involved.
If you work with graphs in your daily work or hobbies, please encourage your child to learn about this so that he/she can describe these activities to his/her classmates. If you would be willing to visit our classroom and share your experience with the class, please contact me.
Sincerely,
Teacher’’s Signature
A Note to the Teacher:If you make use of the suggested Family Activities, it is important to schedule class time for sharing and discussion of results.
Activity 1 Page 7
Investigations in Data Management Grade 4: Our Classroom Community
Activity 1: Interpreting Incomplete Bar
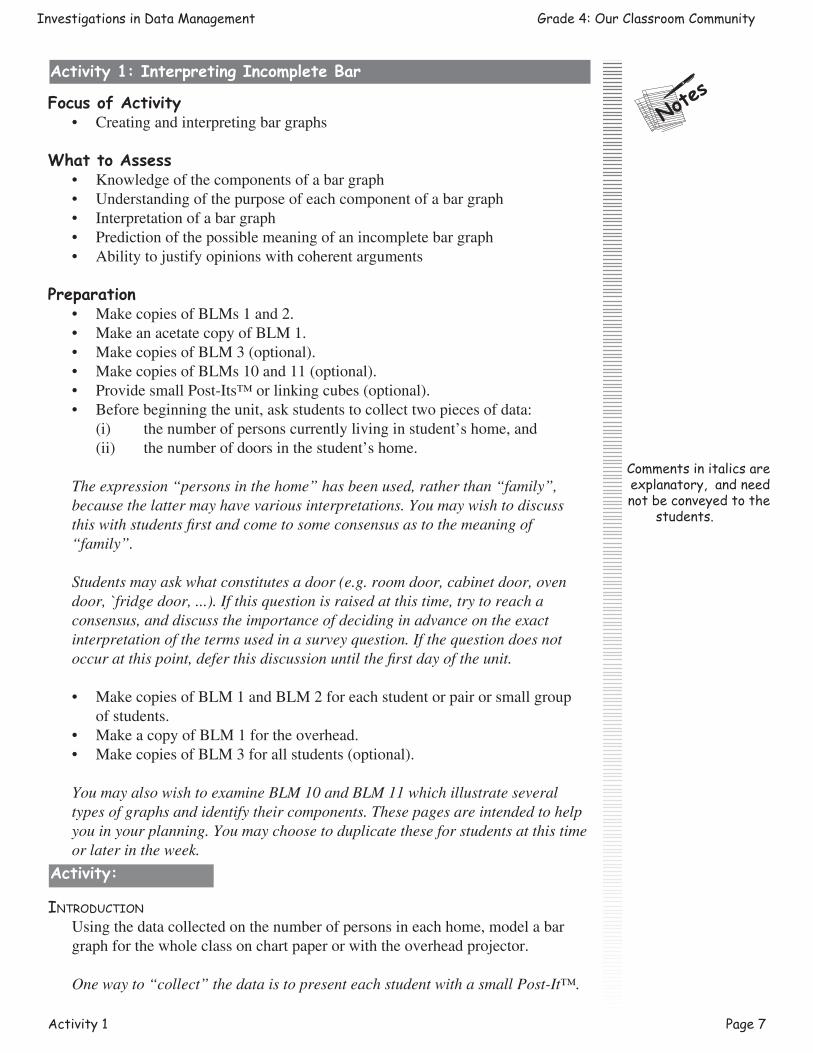
�����Focus of Activity
• Creatingandinterpretingbargraphs
What to Assess• Knowledgeofthecomponentsofabargraph• Understandingofthepurposeofeachcomponentofabargraph• Interpretationofabargraph• Predictionofthepossiblemeaningofanincompletebargraph• Abilitytojustifyopinionswithcoherentarguments
Preparation• MakecopiesofBLMs1and2.• MakeanacetatecopyofBLM1.• MakecopiesofBLM3(optional).• MakecopiesofBLMs10and11(optional).• ProvidesmallPost-Its™orlinkingcubes(optional).• Beforebeginningtheunit,askstudentstocollecttwopiecesofdata: (i) thenumberofpersonscurrentlylivinginstudent’shome,and (ii) thenumberofdoorsinthestudent’shome.
The expression “persons in the home” has been used, rather than “family”, because the latter may have various interpretations. You may wish to discuss this with students first and come to some consensus as to the meaning of “family”.
Students may ask what constitutes a door (e.g. room door, cabinet door, oven door, `fridge door, ...). If this question is raised at this time, try to reach a consensus, and discuss the importance of deciding in advance on the exact interpretation of the terms used in a survey question. If the question does not occur at this point, defer this discussion until the first day of the unit.
• MakecopiesofBLM1andBLM2foreachstudentorpairorsmallgroupofstudents.
• MakeacopyofBLM1fortheoverhead.• MakecopiesofBLM3forallstudents(optional).
You may also wish to examine BLM 10 and BLM 11 which illustrate several types of graphs and identify their components. These pages are intended to help you in your planning. You may choose to duplicate these for students at this time or later in the week.
IntroductIonUsingthedatacollectedonthenumberofpersonsineachhome,modelabargraphforthewholeclassonchartpaperorwiththeoverheadprojector.
One way to “collect” the data is to present each student with a small Post-It™.
Comments in italics are explanatory, and need not be conveyed to the
students.
Activity:

Page 8 Activity 1
Grade 4: Our Classroom Community Investigations in Data Management
�����
Activity 1: Interpreting Incomplete Bar
Then each child can place the Post-It™ in the correct column of the graph on chart paper. Alternatively, give each student a linking cube and have them build towers to illustrate the bars on the graph.Makealistofcomponentsofabargraph:• titleforthegraph• labelsfortheverticalandhorizontalaxes• scaleforeachaxis
Discussthepurposeofeachcomponent(i.e.,askchildrenwhattheythinkisthereasonforeachcomponent),anditspositiononthegraph.
8
7
6
5
4
3
2
1
Num
ber o
f Stu
dent
s
Number of persons0 1 2 3 4 5 6 7 8 9
Scale
Scale
Label
Label
Number of Persons in our Homes Title
����
����
���
��������
����� � �
Askquestionsthatinvolveinterpretationofthedataonthegraph:• Whatisthemostcommonnumberofpeopleinourhomes?(or“inour
families”?)• Whyaretherenostudentsinourclasswithjustonepersoninhis/her
household?• Howmanystudentsofourclassarerecordedinthegraph?(Studentsshould
realizethattheyneedonlycountthetotalnumberofXsorsquaresorwhateverunityoumayhaveusedtomodelthegraph.)
Presentthestudentswithsomequestionssuchasthoseaboveaswellasthosethatfollowandaskthemtodecidewhichofthequestionscanbeansweredfromthegraph,andwhy.
Forexample,questionsthatcannotbeansweredare:• Howmanyinourclassaregirls?• Howmanyinourclasshavegrandparentslivingwiththem?• Whatsizehomedomostofuslivein?
Next,requestdataonthenumberofdoorsineachhome.Evenifthemeaningof‘door’wasdiscussedpriortodatacollection,youmayfindthatnewmeaningsemergedduringthecounting.Ifthedefinitionof‘door’wasnotresolved,usethisopportunitytodiscusstheimportanceofclarityinposingasurveyquestion.Askstudentstore-countthedoorsfornextday’sclass.(See“FamilyActivities”below.)
Activity 1 Page 9
Investigations in Data Management Grade 4: Our Classroom Community
Activity 1: Interpreting Incomplete Bar
�����InterpretIng Incomplete graphs
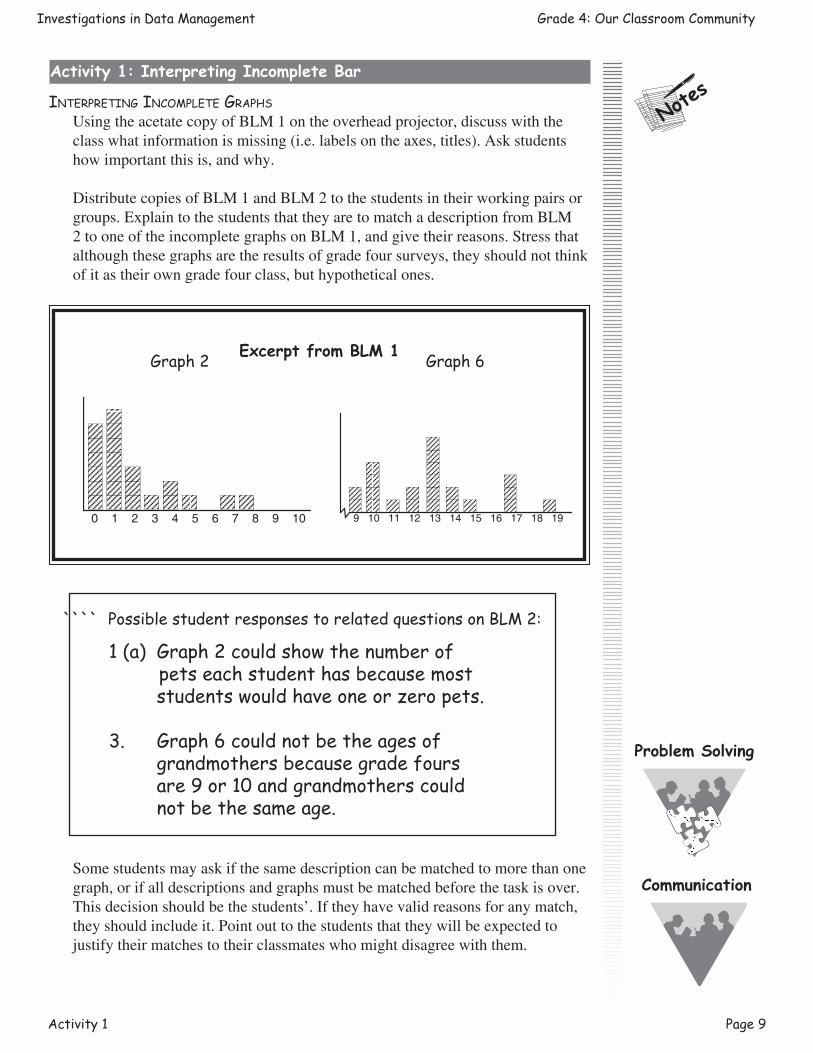
UsingtheacetatecopyofBLM1ontheoverheadprojector,discusswiththeclasswhatinformationismissing(i.e.labelsontheaxes,titles).Askstudentshowimportantthisis,andwhy.
DistributecopiesofBLM1andBLM2tothestudentsintheirworkingpairsorgroups.ExplaintothestudentsthattheyaretomatchadescriptionfromBLM2tooneoftheincompletegraphsonBLM1,andgivetheirreasons.Stressthatalthoughthesegraphsaretheresultsofgradefoursurveys,theyshouldnotthinkofitastheirowngradefourclass,buthypotheticalones.
Excerpt from BLM 1
```` Possible student responses to related questions on BLM 2:
Somestudentsmayaskifthesamedescriptioncanbematchedtomorethanonegraph,orifalldescriptionsandgraphsmustbematchedbeforethetaskisover.Thisdecisionshouldbethestudents’.Iftheyhavevalidreasonsforanymatch,theyshouldincludeit.Pointouttothestudentsthattheywillbeexpectedtojustifytheirmatchestotheirclassmateswhomightdisagreewiththem.
Graph 2
Problem Solving
Graph 6
9 10 11 12 13 14 15 16 17 18 19
Communication
0 1 2 3 4 5 6 7 8 9 10
1 (a) Graph 2 could show the number of pets each student has because most students would have one or zero pets.
3. Graph 6 could not be the ages of grandmothers because grade fours are 9 or 10 and grandmothers could not be the same age.

Page 10 Activity 1
Grade 4: Our Classroom Community Investigations in Data Management
�����
Activity 1: Interpreting Incomplete Bar
Allowsufficienttimeformoststudentstocompletethetask(about15minutes),leavingtimetodiscusstheresults.Answersmayvary,butstudentsshouldbeexpectedtosupporttheirownopinionswithvalidreasonseveninthefaceofdisagreement.Theclassmaynotbewillingtocometocompleteagreementaboutallthematchessuggested,butshouldbewillingtoacceptreasonabledivergentviews(e.g.“Yes,Graphs2and5couldbothrepresentthenumberofpetsbecausechildrenonafarmmighthave9pets”)
Wrap-upIftimepermits,referagaintoBLM1andaskstudentswhatothersetsofdatacouldberepresentedbyeachgraph.Givethemafewminutestorecordtheirideas(inajournaloronBLM3),andthendiscussbriefly.Ifthereisnotenoughclasstime,thiscouldbeassignedasaFamilyActivity.(Seebelow.)
If students need help getting started, ask such questions as “Why couldn’t Graph 1 represent the arm lengths of a grade four class? Why couldn’t graph 2?” or “Why do you not think that Graph 4 shows the number of pets for each family? What could this graph represent? Numbers of what? Could it be a measurement of some kind?” [Studentsmightconsideritcouldbethenumberofdoorsperhousehold,especiallyifthesedatahavebeendiscussedalready.]
Cross-Curricular Activities1. Constructagraphofahypotheticalgradefourclassduringpioneertimes(e.g.,
heightsofstudents/agesofgrandmothers/distancefromhometoschool/numberofpeoplelivinginthehome/numberofpets.Havestudentssuggestothertopics.).Whatwillbedifferentfromgraphsofgradefourstudentsto-day?Whatwillbethesame?
Since most pioneer schools were one-room schools, there would be very few grade four students in any school. However, the ages of the students should be reasonably close to today’s data. Will the ages of mothers or grandmothers be similar to today’s? Why or why not?
Youmaywishtoassignthistostudentsingroupsasaresearchproblem.Itisagoodideatocheckwiththeschoolorlocallibrariantoseewhatappropriateresourcesareavailable.Studentscouldalsodiscusstheproblemwithparentsand/orgrandparents.
2. Exploretheusesofgraphsinothersubjects,forexample,astemperatureorprecipitationgraphsinSocialStudies.
Family Activities1. HavestudentstakehomeacopyofBLM1todiscusswithotherfamily
members.Theyaretomakealistofpossiblecollectionsofdatathatmightberepresentedbyeachgraph.Stressthatitisnotimportanttohaveatopicforeverygraph,butthattheyshouldhaveverygoodreasonsforchoosingthetopicstheydid.
Communication

Activity 1 Page 11
Investigations in Data Management Grade 4: Our Classroom Community
Activity 1: Interpreting Incomplete Bar
�����2. Ifthedefinitionof‘door’inthe“Howmanydoors?”questionnecessitatesare-
count,askstudentstocollectthisdata.Ifthereisstillaquestionastowhatadooris,tellthemtodecideforthemselves,withthehelpoffamilymembers,andtobesuretheyhavevalidreasonsfortheirchoices.
Other Resources Forfurtherdetails,seeannotatedOtherResourceslistonpage48,numberedas
below.
1. “MakingSenseofData:AddendaSeries,GradesK-6”,byMaryLindquistetal.
11.“OurHeritage:LearningData-ManagementSkillsMeaningfully,”byYvonneM.PothierandChristineM.Nickerson

Page 12 Activity 2
Grade 4: Our Classroom Community Investigations in Data Management
Activity 2: Predicting a Bar
�����
Focus of Activity• Predictionoftheshapeandrangeofabargraphgivenadescriptionofdata,
butnotactualdata
What to Assess• Knowledgeofthecomponentsofabargraph• Indicationoftheawarenessofthevalueofeachcomponentofabargraph• Interpretationofabargraph• Creationofabargraph,giventhenecessarydata• Abilitytojustifytheirownopinionswithcoherentreasons• Abilitytodistinguishbetweenlikelyandunlikely
Preparation• MakeacopyofBLM4foreachgroup.
IntroductIonUsingthedataonnumberofdoors,constructabargraphaccordingtoinstructionsfromthestudents.(“WhatshouldIdofirstinmakingthisgraph?Whatcomesnext?...Isanythingmissing?”)Thereisnoparticularorderinwhichthecomponentsofabargraphshouldbeincluded.Studentsshould,however,beawarethatsomeitemsshouldprecedeotheritems.Forexample,thescalesshouldbewrittenontheaxesbeforethedatacanbeenteredonthegraph.
PredIctIng graPhsRefertoBLM1andask,”Ifweweregoingtomakegraphssimilartotheseforourclassroomcommunity,whatdatamightwewanttorecord?”Askstudentswhattheywouldbeinterestedinknowingabouttheirclassroomcommunity.EncouragestudentstosuggestsetsofdatadifferentfromthoseonBLM2.Differenttypesofdatashouldbelisted.Forexample,
Measurement:heightincentimetres;lengthofforearm;palmwidth;Preferences:favouritesuperhero;favouritesubject;favoriteicecreamflavourNumerical:numberofschoolsonehasattended;numberofbooksreadduringthepastyear
Recordallpossibilitiesonchartpaper.
Selectaspecifictypeofdata(e.g.palmwidthofstudentsintheclass).Askstudentswhatthegraphofthesedatamightlooklike,andhaveeachstudentsketchapossiblegraph.Discusstheneedforestimationindecidingtherangeofthedata.RemindthemtheycanusetheincompletegraphsonBLM1asmodelsofwhattheirgraphsshouldlooklike.Allowafewminutes.
Havestudentsformpairs.Eachstudentistoexplaintohis/herclassmatewhythegraphshouldtakeacertainform.Thepairsshouldthendecidewhichreasonsandideastheywishtopresenttotheclass,andbepreparedtojustifytheiropinions.
Communication
Activity:

Activity 2 Page 13
Investigations in Data Management Grade 4: Our Classroom Community
�����Activity 2: Predicting a Bar
Thenaskselectedstudentpairstopresenttheirideastotheclass.Listenforcorrectuseofmathematicallanguage,andforlogicalreasoning.Youmaychoosetodiscusstheseaspectsofaresponsewiththeclass.(“Thatwaswellput,Alyssa.Class,whatwasthereaboutAlyssa’sargumentthatmadeitagoodone?”)
dIscussIon of LIkeLIhoodQuestionsoflikelihoodofgiveneventsmayhelpstudentswiththeshapeandformofapredictedgraph.RefertoBLM1,Graph1,andasksuchquestionsas“Howlikelyisitthatagradefourstudentfromthesamplehasagrandmotherover70?Isitverylikelyorveryunlikely?”
Students should be pressed to say no more than , “Yes, it is likely/unlikely” or “It is very likely/unlikely” or “It is more/less likely,” with no numerical probability being discussed. Such analysis will be easier for some graphs than for others. If all the data are clustered in a small range, it could be very difficult to judge.
Refertothegraphshowingthenumberofpeopleinthehomeconstructedforyourclass.Askeachstudenttowriteastatementbeginningwith“Itisverylikely,...”or“Itisveryunlikely...”aboutthegraph.Havestudentspresenttheirstatementswithreasons.
WraP-uPStudents in groups select one of the topics listed as interesting data about theclassroomcommunity.Eachgroupshouldhaveadifferent topic.Different typesoftopicsshouldbeselectedaswell(i.e.measurement,numerical,preferences).Iftimepermits,havestudentssketchapossiblegraphforthedatabyestimatingandpredictingwhatthedatafromtheclasswilllooklike,usingBLM4.Ifthereisnotsufficienttime,assignthisasaFamilyActivitysinceitwillbeneededforActivity3.
Extensions in Mathematics1. Extendthediscussionoflikelihoodwithsuchquestionsas: a) Isastudentfromthisclassmorelikelytohaveagrandmotherover60thanto
haveagrandmotherunder40? b) Whichismorelikely:thatastudentfromthisclasshasmorethan2petsor
thatastudenthasfewerthan2pets? c) Whichismorelikely:thatastudentinthisclasshas1or2petsorthata
studenthasanarmlengthofover40cm?
Select numbers from the actual data collected for the class so that one of the groups being compared is greater than the other. That is, for (a) above, the graph would have more grandmothers over 60 than under 40.
Cross-Curricular Activities1. Havestudentspredictandsketchatemperaturegraphforoneweek.Duringthat
week,collecttheactualdataandillustrateonthesamegraph.Studentsshouldcomparetheactualdatawiththeirpredictedgraphs,andmakeconjecturesastowhysomepredictionsareworsethanothers.
For more on this idea, see “Investigations in Probability” for Grade 4 in the Invitations to Mathematics series.
Assessment
Communication
Problem Solving

Page 14 Activity 2
Grade 4: Our Classroom Community Investigations in Data Management
Activity 2: Predicting a Bar
�����
Family Activities1. Studentsshoulddiscusstheirpredictedgraph(See“Wrap-up”above)with
familymemberssothattheybecomeveryconfidentinboththeirpredictionsandtheirreasons.
2. Startacollectionofgraphsofdifferenttypesfromnewspapersandmagazines.Thiscouldbethebeginningofabulletinboarddisplay,orstudentscansortandclassifythegraphsbysubjectarea(e.g.,science,socialstudies)orbytypeofgraph(e.g.,circlegraph,bargraph).
Other Resources Forfurtherdetails,seeannotatedOtherResourceslistonpage48,numberedas
below.
1. “MakingSenseofData:AddendaSeries,GradesK-6”,byMaryLindquist
5. “Ideas”,byHeleneSilverman

Actvitiy 3 Page 15
Investigations in Data Management Grade 4: Our Classroom Community
�����
Activity 3: Collecting and Displaying Data
Focus of Activity• Collectingofdataanddisplayingitonabargraph
What to Assess• Predictionoftheshapeandrangeofabargraphgivenatopic• Abilitytodescribethenatureofthedataclearlyanddevelopadatacollection
sheet/questionnaire• Creationofabargraphandcorrectuseofthecomponentsofabargraph• Abilitytoexplainreasoning,orallyorinwriting• Collaborationwithothermembersofthegroup
Preparation• MakeacopyofBLM5foreachgroup.• MakeacopyofBLM6foreachpair/group(optional).• Providemeasurementdevices(metretapes,scales)asneeded.
IntroductIonStudentsshouldpresenttheirpredictedgraphsfromActivity2(BLM4)totheclassandjustifytheirpredictions.Ifstudentswishtoadjusttheirpredictedgraphsinlightofquestionsfromtheclass,theyshouldbeencouragedtodoso.
data collectIon SheetSDiscusswithstudentstheimportanceofagoodDataCollectionSheet/Questionnaire.Stressthatthenatureofthedatacollectedwilldependonthequestions/instructionsgiventothepeoplefromwhomthedataiscollected.
DistributecopiesofBLM5(DataCollectionSheet/Questionnaire).Givestudentsafewminutestodiscussthequestionsintheirgroups.Allowafewminutesforthemtowriteresponsesbeforeaclassdiscussion.
Excerpt from BLM 5
Communication
Title: Bicycle Colours
Check the colour of your bicycle:
_____ red _____ white
_____ blue _____ black
_____ green _____ yellow
Some grade four students were planningto collect data to make graphs. Their DataCollections Sheet is shown above.
1. Do you think the Data Collection Sheetfor bicycle colours will give them theinformation they want? Explain yourreasons.
Activity:

Page 16 Activity 3
Grade 4: Our Classroom Community Investigations in Data Management
�����
Activity 3: Collecting and Displaying
Possible student response to Question 1:
dIScuSSIonTrytoelicitthefactsthatthefirstdatacollectionsheetdoesnottakeintoaccountstudentswhomaynothavebicycles,orthosewhosebicyclesarecoloursnotlisted.An“Other”categorywouldcountboththosegroups,butthosewithoutbicycleswouldbemixedinwiththosewhosebicyclecolourswerenotlisted.Perhapsthesheetcouldbeginwithaquestion:“Doyouhaveabicycle?”Studentsmaysuggestotherwaysofimprovingthecollectionsheet.
TheQuestionnaireonsmileswillgivethedatawanted,butinanunorganizedfashion.Studentsmayalsosuggestthatmostpeopledon’tknowthewidthoftheirsmiles.Reasonablesuggestionsforimprovementshouldbeaccepted.
data collectIonEachgroupshouldprepareaDataCollectionSheet/Questionnairefortheclass,designedtocollectthedataforwhichthegrouphasalreadydrawnapredictedgraph(fromActivity2).
To keep the data collection process organized, you may choose to have the Data Collection Sheets passed from group to group, rather than have the students move about the classroom.
Aseachgroupreceivesbacktheircompletedcollectionsheet,theycanbeginconstructingtheirgraph,usingthecomponentsofabargraphasdiscussedinearlieractivities.
WrItIng about theIr WorkHavestudentswriteabouttheirpredictedgraphsandtheiractualgraphs,indicatingsimilaritiesanddifferences,andexplainingwhyanydifferencesoccurred.
An oral discussion before the students start writing will help them focus on the issues and review mathematical language which should be included in their written responses. Some terms to include are: bar graph, data, predict, collect, range, label, record, result.
PreSentIng theIr WorkIftimepermits,youmaywishtohaveeachgrouppresentitsgraphtotheclass,explaintheirchoiceofdatacollectiontechnique,andcomparetheirresultswiththeirpredictedgraphs.
Communication
Problem Solving
Assessment
Some bicycles have more than one colour. This Collection Sheet won’t show that. What if somebody has a purple bike? What if somebody has no bike? This Data Collection Sheet is not a good one
Actvitiy 3 Page 17
Investigations in Data Management Grade 4: Our Classroom Community
�����
Activity 3: Collecting and Displaying Data
Extensions in Mathematics
1. Haveeachgroupcollectsimilardatafromanothergradeafterpredictingthechangesthatmightoccurinthedata,andsketchinganotherpredictedgraph.
2. Introducedoublebargraphs(BLM6).Havestudentsconstructadoublebargraphtoillustrate
(a) theirpredictedandactualclassdatafortheirfirstdatacollectiontask. (b)theactualdatafromtheirownandanothergrade.
Cross-Curricular Activities1. Discussthepossibilityofobtainingsimilardatafromothersources-for
example,othercountrieswithwhichstudentsarefamiliar;othergenerations (e.g.,pioneers,parents).
2.Collectanddisplaydatafromthecommunityabout • people(age,occupation,countryoforigin) • occupations • transportationavailable • typeofbuildings
3. Createapersonalbiographytodescribeyour“individualdata”(e.g.,preferences,measurements).Useyourdata,words,and/orpicturestocreateabook,poster,collage,song,poemorvideoaboutyou.
4. Createaclass,school,orcommunitybiography.Usecollecteddata,words,and/orpicturesaboutyourclass,school,orcommunitytocreateabook,poster,collage,song,poemorvideothatportrayssomeimportantaspectofthesubjectgroup.
5. Basedoncollecteddataattheschoolorcommunitylevel,identifyanissueofconcern(e.g.,wastedpaper,aneededstopsign)andwritealettertotheappropriateperson(s)voicingconcernsanddetailingsuggestionsforsolvingtheproblem.
Family Activities1. Createafamilybiographyusingdatacollectedinthehome.Usewordsand/or
picturestocreateabook,poster,collage,song,poemorvideoaboutthefamily.
Other Resources ForfurtherdetailsseeannotatedOtherResourceslistonpage48,numberedas
below.
4. “Ideas”byCalvinandRosemaryIrons
5. “Ideas”byHeleneSilverman
Problem Solving
Communication
Page 18 Activity 4
Grade 4: Our Classroom Community Investigations in Data Management
Activity 4: Types of Graphs
�����
Focus of Activity • Reading,comparing,andconstructingbar,circle,andpicto-graphs
What to Assess• Abilitytointerpretbar,circle,andpicto-graphs• Knowledgeofcomponentsforeachtypeofgraph• Constructionofpicto-graphorcirclegraph• Collaborationwithothers
Preparation• MakeacopyofBLM7foreachpairofstudents.• MakeacopyofBLM8foreachpairofstudents.• MakecopiesofBLMs10and11foreachstudent(optional).• MakecopiesofBLM12asneeded(optional).
You may wish to illustrate the circle graph using students (see Extensions, next page) before, rather than after, presenting the circle graph on paper.
ActivityIntroductIon
Refertocompletedgraphsfrompreviousactivitiesandaskstudentswhatallgraphshaveincommon.Iftheterm“BarGraph”hasnotbeenusedpreviously,introduceitnow.Tellstudentsthatthereareothertypesofgraphsaswell,andtheywillbeexploringtwomoretypesintoday’sactivity.
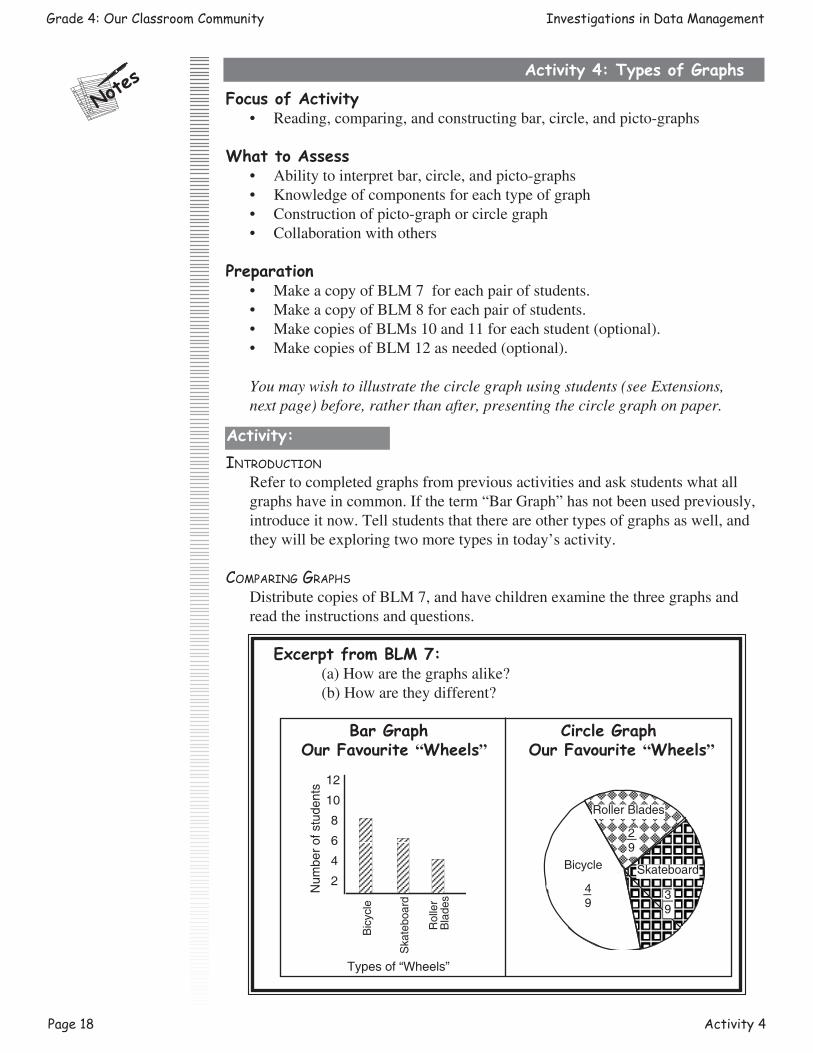
comparIng graphsDistributecopiesofBLM7,andhavechildrenexaminethethreegraphsandreadtheinstructionsandquestions.
Excerpt from BLM 7: (a)Howarethegraphsalike? (b)Howaretheydifferent? Bar Graph Circle Graph Our Favourite “Wheels” Our Favourite “Wheels”
Types of Wheels
12
10
8
6
4
2
Num
ber o
f stu
dent
s
Bic
ycle
Ska
tebo
ard
Rol
ler
Bla
des
Activity:
Roller Blades
29
Skateboard
39
Bicycle
49

Activity 4 Page 19
Investigations in Data Management Grade 4: Our Classroom Community
Activity 4: Types of Graphs
�����
dIscussIonSummarizewiththewholegroupthesimilaritiesanddifferencesamongthethreetypesofgraphs.Thesecouldberecordedonchartpaperandpostedforfuturereference.
DistributecopiesofBLM8.Examinethequestionsinthebox.Stresswithstudentsthattheyneednotanswerthesequestions,buttheywillneedtorefertothemintheirresponsesfortheproblemsbelowthebox.Givestudentsafewminutestorespond.Discusstheresults.Studentsshouldrealize,forexample,thatthepicto-graphmakesiteasytocountthetotalnumberinthesample;thecirclegraphmakesiteasytocomparepartsofthesampletoeachotherandtothewhole.
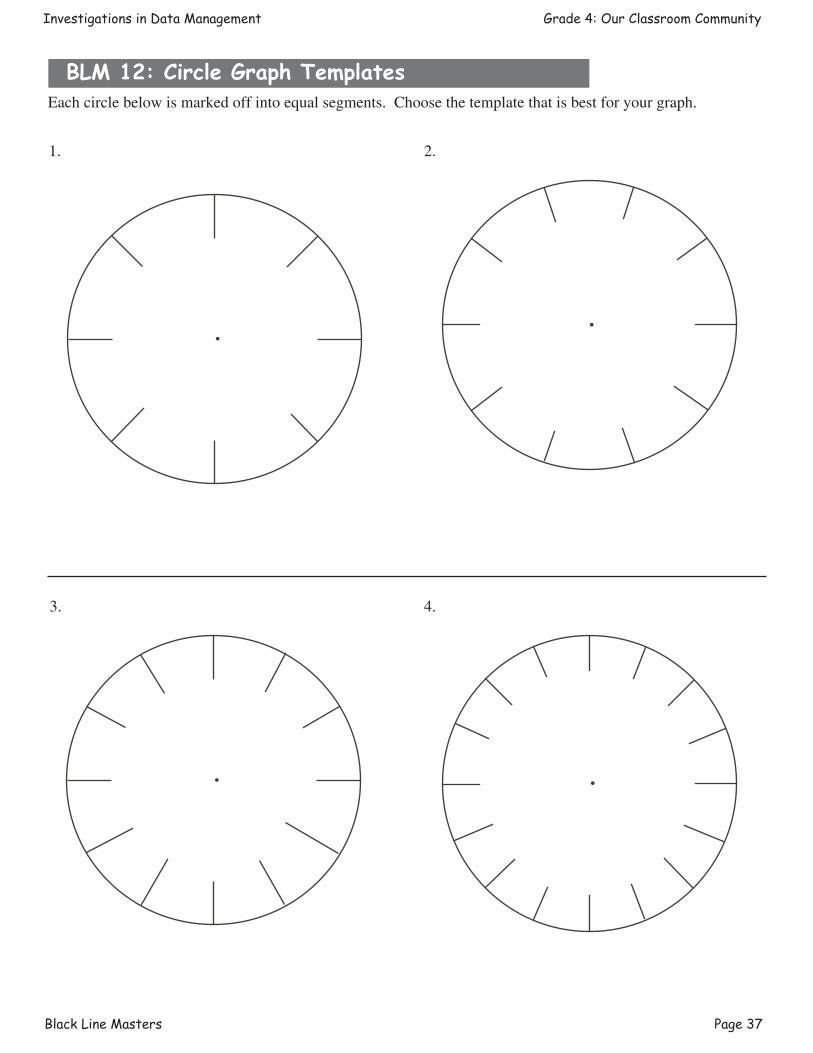
graphIngUsingthedatacollectedforActivity3,studentsshould,inthesamepairs,illustratethedatausingeitherapicto-graphoracirclegraph.ProvidecopiesofthecirclesonBLM12tohelpstudentsconstructcirclegraphs.Thecircletemplatesaredividedintosixths,eighths,twelfths,andsixteenthsrespectively.TheBLMmaybedistributedwholetoeachpairoryoumaywishtocutthetemplatesapartsothatpairscanselectonlythetemplatetheyneed.
Alternatively,iftimepermits,studentscould(inthesameorotherpairs)selectanothertopic,predictthepicto-orcirclegraph,collectthedataandsketchthegraph.
Youmaywishatthisstagetodiscuss,withthestudents,afewsimilaritiesanddifferencesamongthethreegraphs.Thiswillgivestudentsastartingpointwhentheybegintheirwrittendescriptions.
Iftheclasshasbeenmakingacollectionofdifferenttypesofgraphsfrommagazinesandnewspapers(SeeActivity2,FamilyActivities)thesecouldbeavailable,aswell,forstudentstocompare.
Studentsshouldthenspendseveralminuteswriting,inpairs,theirowndescriptionsofthethreegraphs.Haveeachpairsharetheirdescriptionswithanotherpair.Circulateduringthediscussiontoassesschildren’suseofmathematicallanguage,willingnesstosharereadingtimewithothers,howcarefullystudentslistentoothers,howwelltheysupporttheirconclusions,andhowaccuratetheirdescriptionsofthegraphsare.
Problem Solving
Communication
Assessment
Possible student responses to Questions on BLM 7:Both graphs show the favourite wheels of Ms. Marshman’sclass. You can tell that more people like bicycles thanskateboards or roller blades
The Graphs are different because the circle graph showsfractions that like each type of wheels but the bar graphtells how many kids like each one.
Page 20 Activity 4
Grade 4: Our Classroom Community Investigations in Data Management
Activity 4: Types of Graphs
�����
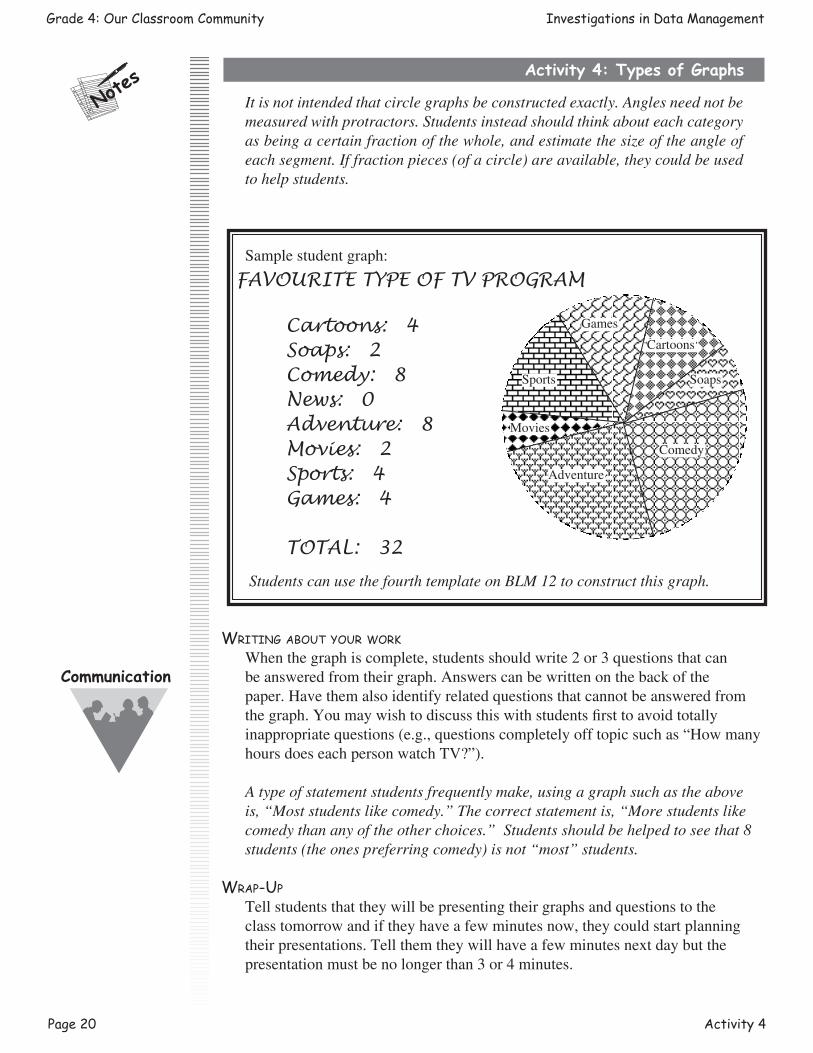
It is not intended that circle graphs be constructed exactly. Angles need not be measured with protractors. Students instead should think about each category as being a certain fraction of the whole, and estimate the size of the angle of each segment. If fraction pieces (of a circle) are available, they could be used to help students.
Samplestudentgraph:
Students can use the fourth template on BLM 12 to construct this graph.
WrItIng about your WorkWhenthegraphiscomplete,studentsshouldwrite2or3questionsthatcanbeansweredfromtheirgraph.Answerscanbewrittenonthebackofthepaper.Havethemalsoidentifyrelatedquestionsthatcannotbeansweredfromthegraph.Youmaywishtodiscussthiswithstudentsfirsttoavoidtotallyinappropriatequestions(e.g.,questionscompletelyofftopicsuchas“HowmanyhoursdoeseachpersonwatchTV?”).
A type of statement students frequently make, using a graph such as the above is, “Most students like comedy.” The correct statement is, “More students like comedy than any of the other choices.” Students should be helped to see that 8 students (the ones preferring comedy) is not “most” students.
Wrap-upTellstudentsthattheywillbepresentingtheirgraphsandquestionstotheclasstomorrowandiftheyhaveafewminutesnow,theycouldstartplanningtheirpresentations.Tellthemtheywillhaveafewminutesnextdaybutthepresentationmustbenolongerthan3or4minutes.
Communication
Games
Cartoons
SoapsSports
Movies
Adventure
Comedy
����������������������������
���� ������ �������� ������������������������������ ���������� ��������������
���� ����

Activity 4 Page 21
Investigations in Data Management Grade 4: Our Classroom Community
Activity 4: Types of Graphs
�����
Extensions in Mathematics1.Toillustrateacirclegraph,havestudentsstandinacircle.Thenhavethemsort
themselvesbysomecriterion(e.g.,shoecolour).Usestringstodividethecircleintosectors.Theteacher,inthecentre,holdsthemid-pointsofthestrings.
Discusstheresultinggraphwithstudentsusingfractionterms(e.g.,“Almosthalftheclassiswearingsneakers.”).Askwhyitisimportantthatstudentsspacethemselvesevenlyaroundthecircle.Havestudentsinonesectiongathercloselytogetherandseehowthegraphappearsdifferent.
2. DistributecopiesofBLMs10and11.Studentscouldkeeptheseintheirbooksforfuturereference.Discussthenewtypesofgraphsillustratedandthestrengthsandweaknessesofeach.Suggestwheneachtypeofgraphmightbeappropriate.
Cross-Curricular Activities1. Havestudentscollectanddisplaydatafromascientificinvestigation.For
example:
• Howfarwillatoycarrunfromthebaseofarampafterrollingdowntheramp?Howdoesthedistancechangeastheslopeoftherampchanges?
• Whatkindof,andhowmany,birdscanbeseenataschoolbirdfeederateachhouroftheday?
Page 22 Activity 4
Grade 4: Our Classroom Community Investigations in Data Management
Activity 4: Types of Graphs
�����
• Howfastdoesacandleburn?(A birthday candle can be marked in centimetres with a permanent marker, and then timed as each segment burns. The data can be displayed on a line graph.)
• Whichpapertowelgetsthewettest?
Family Activities1. Construct,withfamilymembers,apictographillustratingsomedatacollected
athome(e.g.,typesofshoes:withlaces,withstraps,withvelcrofasteners)
Other Resources Forfurtherdetails,seeannotatedOtherResourceslistonpage48,numberedas
below.
1. “MakingSenseofData:AddendaSeries,GradesK-6”,MaryLindquist
9. “Ideas”,bySharonL.Young
Activity 5 Page 23
Invitations to Mathematics Grade 4: Our Classroom Community
�����
Activity 5: Presenting Classroom Graphs
Focus of Activity• Presentationanddiscussionofgraphs
What to Assess• Clarityofexplanations• Correctuseofmathematicallanguage• Accuracyofgraphs• Appropriatenessofthealternativetypeofgraph(i.e.,circleorpicto-graph)
Preparation• MakesufficientcopiesofBLM9touseasdetermined.(Seesuggestions
below).• MakeacopyofBLM9onacetatefortheoverheadprojectororonchart
paperortheblackboard.
cActivity
introduction Remindthestudentsthattheywillbepresentingtheirgraphsandquestionstotheclass.Spendafewminutesindiscussionwiththeclassmakingalistofthingsthatshouldbeapartofthepresentation(e.g.,readablegraphs;questionsthatcanbeansweredfromthegraph;reasonswhytheychoseeitheracircleorpicto-graphforthesecondgraph).Discusswithstudentshowtoassessanoralpresentation,andtellthemtheywillbeaskedtodoso.
PresentBLM9(onoverheadprojectororchartpaper)asatypeofratingscale.Someofthetopicslistedwillhaveemergedfromthediscussionabove.Discusswithstudentsthevalueofeach,andaddothers(as7and8)thattheyfeelareimportant.
Examineeachtopiccarefullyandaskstudentswhattheythinkwouldbenecessaryforagraphtobegivenaratingof‘4’ontheBLM9scale.Howwouldthisdifferfroma‘3’graph?Whatwoulda‘2’belike?Repeatwithotherratingssostudentshaveagoodideaofhowtheywillbeassessed.Recordsomeofthesuggestionsontheacetateorchartpapersothattheyareinfrontofthestudentsduringthepresentations.(SeeSolutions&Notesforsuggestions.)
Thereareseveralwaystoutilizetheratingscale.Afewsuggestionsaregivenbelow.
Suggestion 1:Distributecopiestoeachstudenttoassesspresentationsofallgroupsexcepthis/herown.Studentsassessduringpresentations.
Suggestion 2:Distributecopiestoeachgroup.Assessmentisdoneasagroupfollowingthepresentations.
Communication
Activity:
Page 24 Activity 5
Grade 4: Our Classroom Community Investigations in Data Management
�����
Activity 5: Presenting Classroom Graphs
Suggestion 3:Distributetoindividualsorgroupsbutassignonlyoneortwoofthetopicsforeachperson/grouptoassess.Forexample,groupAmightassessonlythequalityofthegraphsusedinthepresentations.
Suggestion 4:Distributesufficientcopiessothateachgroupcanassessitsownpresentation,aswellastheothers.
Howevertheassessmentisdone,studentsshouldknowthattheywillbeexpectedtopresentandjustifytheiropinions.
Allowstudentsafewminutestopreparetheirpresentations,nowthattheyknowhowtheywillbeassessed.
PresentationsAseachgroupmakestheirpresentation,observetheiruseofmathematicallanguage,sharingofthetaskwithothersinthegroup,accuracyofgraphsandcollecteddata.
Aftereachpresentation,spendafewminutesonpeerassessment.Studentsshouldpresentandjustifytheiropinions.Thisgivesyouanopportunitytoassesstheassessors.
Answers to the questions above could be given orally, or students could work in groups to write their opinions before presenting them to the class.
Asstudentscompletetheirpresentations,posttheirworkonabulletinboard.
WraP-uPAsk“Whatdoesallthedatayoucollectedtellusaboutourclassroomcommunity?”“Whatdoyouknowaboutourclassthatyoudidn’tknowlastweek?”Writtenresponsestothesequestionscouldbeaddedtothebulletinboarddisplay.
Continuewith:“Whatotherthingsaboutourclassmightbeinterestingtodiscover?”“Whichofthesecouldbeshownonagraph?Whatkindofgraph?”Thesequestionscouldbeansweredeitherinwrittenforminjournalsororally.
The collection and displaying of data could be continued for a few weeks by making a “graph of the week”. After the class has decided on a topic for the graph, post a Data Collection Sheet/Questionnaire devised by a group of students on the bulletin board. Every student is to add his/her information to the sheet during the week. The graphs can then be constructed by small groups of students and discussed at the end of the week. Encourage students to write questions that can be answered from the graph. Encourage the use of different kinds of graphs, if applicable.
Assessment
Communication

Activity 5 Page 25
Invitations to Mathematics Grade 4: Our Classroom Community
�����
Activity 5: Presenting Classroom Graphs
Family Activities1. Studentscouldcreateaseriesofgraphstodescribetheirhomes/families.They
couldwriteabouttheirreasonsforchoosingparticularsetsofdataandwhattheythinkeachgraphtellsothersabouttheirhomes/families.
Other Resources Forfurtherdetails,seeannotatedOtherResourceslistonpage48,numberedas
below.
1. “MakingSenseofData:AddendaSeries,GradesK-6”byMaryLindquist.
6. “Gender,NinjaTurtles,andPizza:UsingaClassroomDatabaseforProblemSolving”
Use of Technology

Page 26 Black Line Masters
Grade 4: Our Classroom Community Investigations in Data Management
BLM 1: Incomplete Bar Graphs1.
51 52 53 54 55 56 57 58 59 60 61 62 63 64 65 66 67 68 69 70 71 72 73 74 75
2. 3.
0 1 2 3 4 5 6 7 8 9 10 38 39 40 41 42 43 44 45 46 47
4.
28 29 30 31 32 33 34 35 36 37 38 39 40 41 42 43 44 45 46 47 48 49 50
5. 6.
0 1 2 3 4 5 6 7 8 9 9 10 11 12 13 14 15 16 17 18 19

Black Line Masters Page 27
Investigations in Data Management Grade 4: Our Classroom Community
Each of the six given graphs illustrates information about a class of students in grade four.
1. Decide which graph best shows each of the following:
(a) The number of pets each grade four student has at home.
(b) The length, in centimetres, of the arm length (shoulder to wrist) of each of the grade four students.
(c) The number of seconds grade four students can hold their breath.
(d) The ages of the grade four students’ grandmothers.
(e) The number of times a grade four student can write his/her name neatly in one minute.
(f) The number of plants in each room in the school.
2. Explain why you think the graph you picked for (d) is the one that shows grandmother’s ages.
3. Explain why you think none of the other graphs could be showing grandmothers’ ages.
BLM 2: Possible Graph Descriptions
Page 28 Black Line Masters
Grade 4: Our Classroom Community Investigations in Data Management
Examine the graphs on BLM 1 again.
Choose two of the graphs, and tell what else you think each graph could represent.
Give a title for each of the graphs you chose, and explain your reasoning.
Graph #____
Graph #____
BLM 3: Alternative Graph Descriptions
Black Line Masters Page 29
Investigations in Data Management Grade 4: Our Classroom Community
1. Tell what topic you chose.
2. Sketch a graph that you think could show this information.
3. Explain why you think the graph might look like your sketch.
BLM 4: Predicted Graphs

Page 30 Black Line Masters
Grade 4: Our Classroom Community Investigations in Data Management
Some grade four students were planning to collect data to make graphs. Their Data Collection Sheet is shown on the left.
1. Do you think the Data Collection Sheet for bicycle colours will give them the information they want? Explain your reasons.
2. If your answer to Question 1 above was “No”, tell how you would improve the Data Collection Sheet.
3. Do you think the questionnaire will give the students the information they want? How could you improve the questionnaire?
BLM 5: Data Collection Sheet/Questionnaire
Title: Size of Your Smile
How wide is your smile incentimeters?
_______ _______ _______
_______ _______ _______
_______ _______ _______
_______ _______ _______
_______ _______ _______
_______ _______ ________
Other grade four students wanted to collect data about smile width. Their questionnaire is shown on the left.
Title: Bicycle Colours
Check the colour of your bicycle:
______________ Red
______________ Blue
______________ Green
______________ White
______________ Black
______________ Yellow
Black Line Masters Page 31
Investigations in Data Management Grade 4: Our Classroom Community
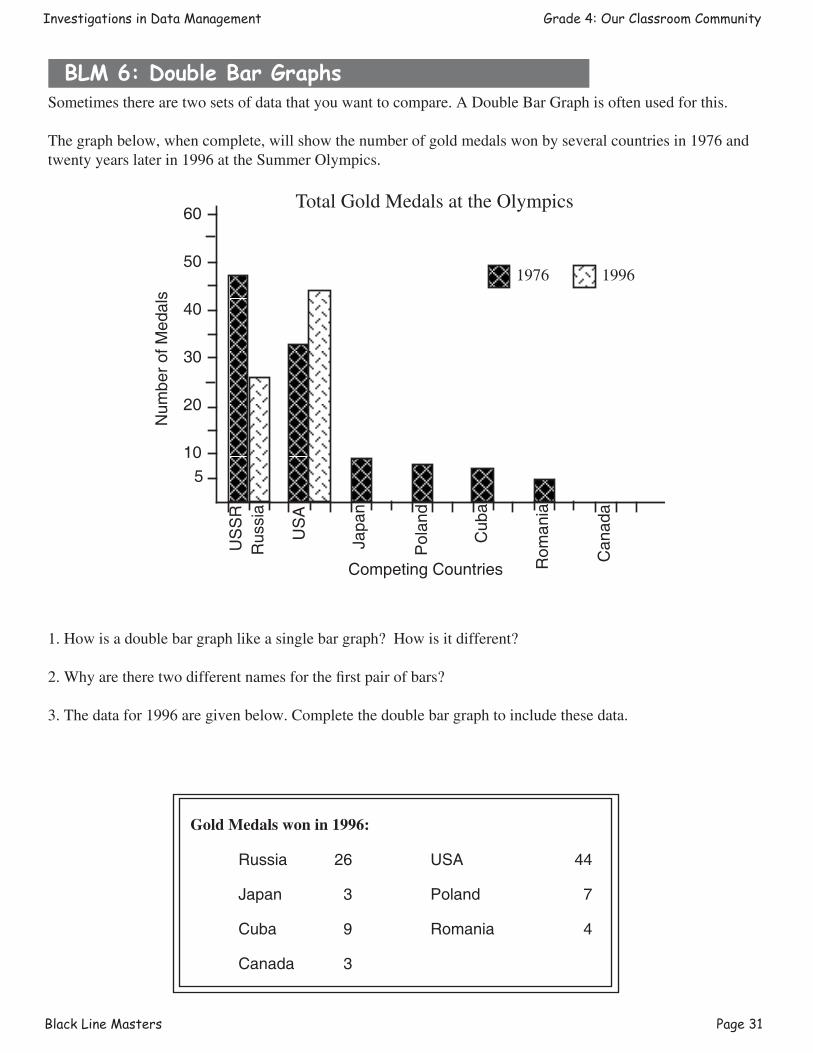
Sometimes there are two sets of data that you want to compare. A Double Bar Graph is often used for this.
The graph below, when complete, will show the number of gold medals won by several countries in 1976 and twenty years later in 1996 at the Summer Olympics.
1. How is a double bar graph like a single bar graph? How is it different?
2. Why are there two different names for the first pair of bars?
3. The data for 1996 are given below. Complete the double bar graph to include these data.
Gold Medals won in 1996:
Russia 26 USA 44
Japan 3 Poland 7
Cuba 9 Romania 4
Canada 3
BLM 6: Double Bar Graphs
60
50
40
30
20
105
Num
ber o
f Med
als
US
SR
Rus
sia
US
A
Japa
n
Pol
and
Cub
a
Rom
ania
Can
ada
Competing Countries
1976 1996
Total Gold Medals at the Olympics

Page 32 Black Line Masters
Grade 4: Our Classroom Community Investigations in Data Management
(b) Circle Graph(a) Bar Graph
(c) Picto-graph
Ms. Marshman’s Grade Four Class collected data on their favourite “wheels”. Each student was asked, “Of the different types of “wheels” or vehicles you have, which is your favourite?”
The information collected is shown on three different graphs.
How are the three graphs alike?
How are they different?
Types of Wheels
12
10
8
6
4
2Num
ber o
f Stu
dent
s
Skat
eboa
rd
Rol
ler
Blad
es
Bicy
cle
represents1 personRoller Blades
Skateboard
Bicycle
Favourite Wheels
BLM 7: Different Types of Graphs
Bicycle
49
Our Favourite Wheels
Roller Blades29
39
Skateboard
Black Line Masters Page 33
Investigations in Data Management Grade 4: Our Classroom Community
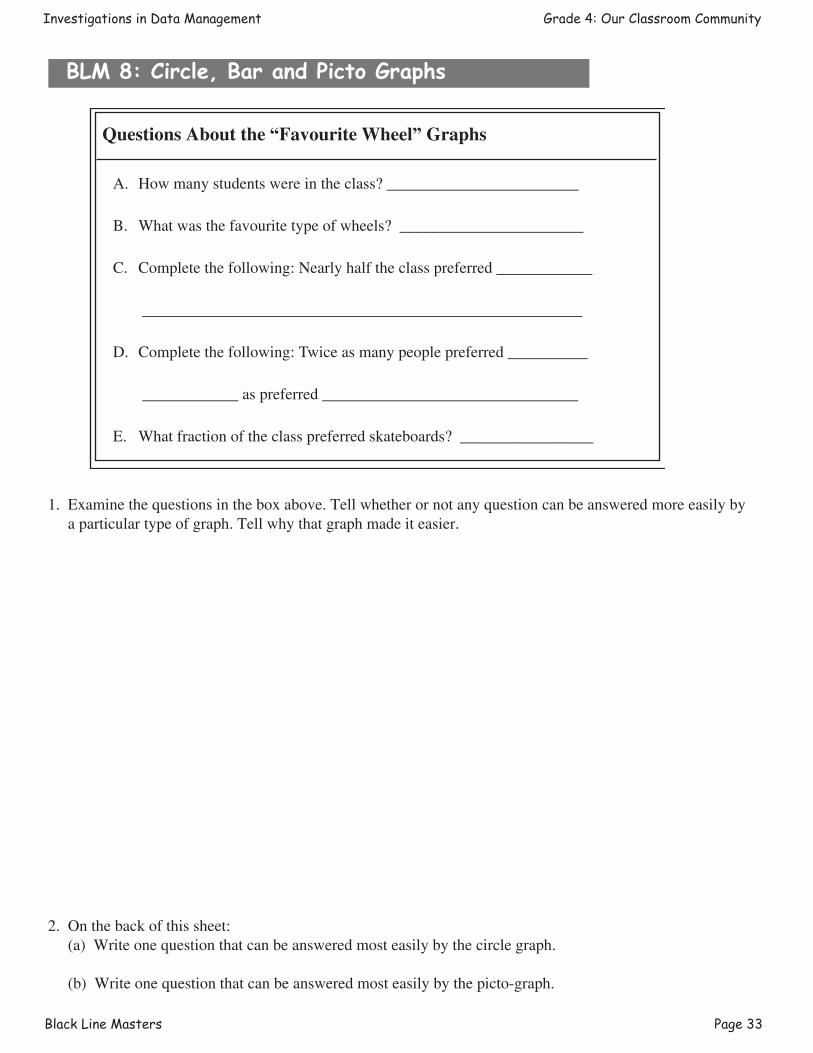
1. Examine the questions in the box above. Tell whether or not any question can be answered more easily by a particular type of graph. Tell why that graph made it easier.
2. On the back of this sheet: (a) Write one question that can be answered most easily by the circle graph.
(b) Write one question that can be answered most easily by the picto-graph.
BLM 8: Circle, Bar and Picto Graphs
Questions About the Favourite Wheel Graphs
A. How many students were in the class? ________________________
B. What was the favourite type of wheels? _______________________
C. Complete the following: Nearly half the class preferred ____________
_______________________________________________________
D. Complete the following: Twice as many people preferred __________
____________ as preferred ________________________________
E. What fraction of the class preferred skateboards? _______________
Page 34 Black Line Masters
Grade 4: Our Classroom Community Investigations in Data Management
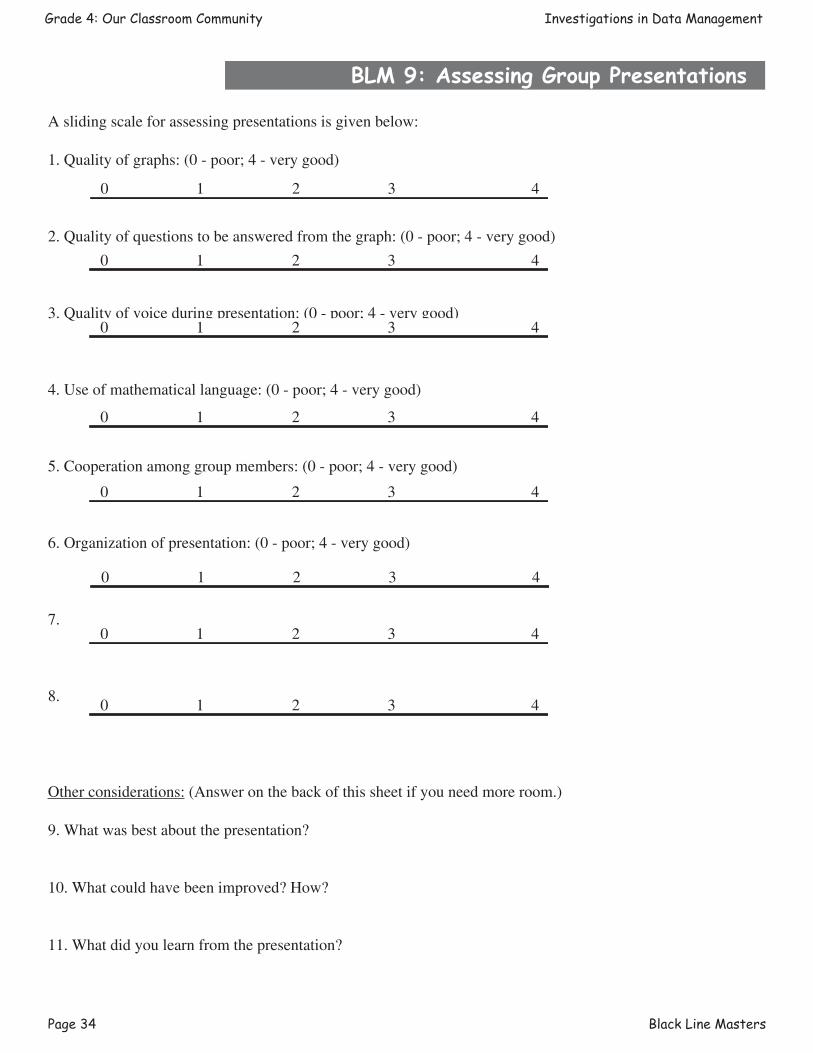
A sliding scale for assessing presentations is given below:
1. Quality of graphs: (0 - poor; 4 - very good)
2. Quality of questions to be answered from the graph: (0 - poor; 4 - very good)
3. Quality of voice during presentation: (0 - poor; 4 - very good)
4. Use of mathematical language: (0 - poor; 4 - very good)
5. Cooperation among group members: (0 - poor; 4 - very good)
6. Organization of presentation: (0 - poor; 4 - very good)
7.
8.
Other considerations: (Answer on the back of this sheet if you need more room.)
9. What was best about the presentation?
10. What could have been improved? How?
11. What did you learn from the presentation?
0 1 2 3 4
0 1 2 3 4
0 1 2 3 4
0 1 2 3 4
0 1 2 3 4
0 1 2 3 4
0 1 2 3 4
BLM 9: Assessing Group Presentations
0 1 2 3 4

Black Line Masters Page 35
Investigations in Data Management Grade 4: Our Classroom Community
Several types of graphs, with their components identified, are given here.
BAR GRAPH
Bar graphs may be constructed with bars or with repeating elements as shown.
Each axis should have a label or title. Axes should also have scales (see first graph) or lists of categories (see second graph).
Each graph has a title.
Usually there are spaces between the bars.
Bar graphs are used to compare items with each other.
A double bar graph (see BLM 6) is used to compare two sets of data.
LINE PLOT
The Line Plot is a very simple type of graph and is useful when comparing bits of data. However, the line plot does not indicate who (or, in the example shown, what country) each piece of data represents.
8
7
6
5
4
3
2
1
Num
ber o
f Stu
dent
sNumber of persons
0 1 2 3 4 5 6 7 8 9
Number of Persons in our Homes
����
����
���
��������
����� � �
Types of Wheels
12
10
8
6
4
2Num
ber o
f Stu
dent
s
Skat
eboa
rd
Rol
ler
Blad
es
Bicy
cle
Our Favourite Wheels
0 5 10 15
XX XX X X X X X X X
Total Olympic Medals Won, By Country, 1976
ScaleTitle
Scale
Label
Label
BLM 10: Sample Graphs - 1
Title
Label
Title
Scale
Categories

Page 36 Black Line Masters
Grade 4: Our Classroom Community Investigations in Data Management
PICTO-GRAPHA picto-graph is very like a bar graph, The major difference is the legend. One symbol may represent one person, as here, or any number of people. It is therefore useful when graphing a set of data with large numbers (e.g., populations of countries)
CIRCLE GRAPHA circle graph is used to illustrate parts of a whole, in this case a whole class. Circle graphs are not appropriate for things like daily temperature for which there is no “whole”.
“Glyph” GRAPHWhile not a traditional graph, graphs such as the one shown can be used to present several types of data, while giving students the opportunity to analyse data, which they must do in order to devise a workable “key”.
represents1 personRoller Blades
Skateboard
Bicycle
Favourite Wheels
Type
s of
Whe
els
Label Categories
Scale/Legend
Title
Categories
Fraction/Percent of
Categories
Title
Key
BLM 11: Sample Graphs - 2
Bicycle
49
Our Favourite Wheels
Roller Blades29
39
Skateboard
Monday Tuesday Wednesday Thursday Friday
Shape of head: the cloudier, the less round the headMouth the hotter, the longer the mouthNose the higher the wind, the larger the noseEyes the larger the eyes, the more rain
A Weather Graph
Black Line Masters Page 37
Investigations in Data Management Grade 4: Our Classroom Community
Each circle below is marked off into equal segments. Choose the template that is best for your graph.
BLM 12: Circle Graph Templates
1. 2.
3. 4.

Page 38 Solutions/Notes
Grade 4: Our Classroom Community Investigations in Data Management
Solutions & Notes
Activity 1: Interpreting Incomplete Bar Graphs
Probable matches of descriptions (BLM 2) with incomplete graphs (BLM 1): Graph 1: ages of grandmothers (d) Graph 2: number of pets (a) Graph 3: arm length in centimetres (shoulder to wrist) (b) Graph 4: holding breath (c) Graph 5: number of plants (f) Graph 6: name writing (e)
If students can justify other matches they should be encouraged to do so.
Activity 2: Predicting a Bar Graph
What to look for in the sketch of the predicted graph:- Title on the graph- Label on each axis- Reasonable scale or list of categories on each axis- Reasonable range of data (e.g., a graph of number of schools attended might range from 1 to 5; it is
unlikely that it would need to extend to 10.)
Student’s justification of the sketch should concentrate on the scales/categories and range, and should attempt to explain why these were selected as they were.
Activity 3: Collecting and Displaying Data
Possible responses for BLM 5: 1. Response should indicate that students who do not have bicycles will not be included in the survey.
Students owning bicycles of colours not listed will not be included.
2. Begin with the question ,”Do you own a bicycle?” Include other colours; alternatively, list the most common colours and include the category “Other” for bicycles of other colours.
Asking “What colour is your bicycle?” will collect the proper data, but in a disorganized fashion.
3. This question will give the proper data but in an unorganized fashion. Provide a tape measure so students can check the widths of their smiles.
A range of expected widths could be given and students asked to check the appropriate one — e.g., 5 cm, 6 cm, 7cm. etc.
Alternatively, have students check a range of measures: e.g., 5 cm to 9 cm; 10 cm to 14 cm; etc. , with measures rounded to the nearest centimetre; or 9.5 cm to 14.4 cm; 14.5 cm to 19.4 cm; etc., with measures rounded to the nearest half centimetre.

Solutions/Notes Page 39
Investigations in Data Management Grade 4: Our Classroom Community
Solutions & Notes
BLM 6: The actual data already on the graph are:
USSR ............................................47 USA ...........................................34 Japan ............................................ 9 Poland ........................................ 8 Cuba ............................................ 6 Romania ..................................... 4 Canada .......................................... 0
These countries, excepting Canada, were among the top countries in 1976 by number of gold medals won.
Ask students which countries appear to have done better in 1996 than in 1976. Ask what other information is needed before a true comparison is possible. In 1976 a total of 216 medals were awarded; in 1996, 668 were awarded. Students should be able to see that the number of medals in 1996 was about 3 times the number of medals in 1976. Therefore, if a country was to do better in 1996, the number of medals should be at least 3 times as great as for 1976.
The total number of all medals won by each of these countries is given below:
These data could be the basis for another double bar graph.
Students could be asked to suggest reasons why so many more medals were awarded in 1996 than in 1976. What events have been added? Have any been deleted? Why?
Further research topics: What events were included in the first “modern” Olympics in 1896? What events were included in the Greek Games held around 700 B.C.?
Country
USSR/Russia
USA
Japan
Poland
Cuba
Romania
Canada
Total Medals, 1976
125
34
25
25
13
27
11
Total Medals, 1996
63
44
14
17
25
20
22

Page 40 Solutions/Notes
Grade 4: Our Classroom Community Investigations in Data Management
Solutions & Notes
Activity 4: Types of Graphs
Similarities and differences identified by the students for the three graphs may include the following:
1Since the symbol represents one person, this is true for this picto-graph. Students may be familiar with picto-graphs in which the symbol represents more than one piece of data. For such a graph each piece of data is not shown separately.
Students may suggest other characteristics, such as “I think it is easier to make a bar graph than a circle graph.” or “Picto-graphs are easiest to read because it’s easy to count how many people are involved.” Students should be expected to justify their analyses by references to the appropriate graphs.
Responses to questions on BLM 7 may include: 1. There were 18 students; this is easiest in the picto-graph because all you have to do is count the hearts. 2. The favourite was the bicycle; all three graphs show this equally well. 3. Nearly half the class preferred bicycles; the circle graph is probably the easiest for this.
4. Twice as many people preferred bicycles as preferred roller blades; this is probably seen most easily on the circle graph, since the fractions of the class are given (2/9 and 4/9). However, it is easy to compare the lengths of the “bars” in both the other two graphs to answer this.
5. One-third or three-ninths of the class preferred skateboards. The circle graph indicates this directly. The other two graphs need a count and then a comparison of figures.
A question that might be more easily answered from the circle graph could be: “Approximately what fraction of the class preferred skateboards?”
A question that might be more easily answered from the picto-graph is: “How many of the class preferred skateboards?”
Bar Graph
X
X
X
X
X
X
Circle Graph
X
X
X
X
X
Picto-graph
X
X
X1
X
X
Has a title
Has two axes
Has a title for each axes
Has scale/categories on both axes
Shows each piece of data separately
Has no axes
Show fractions of the whole
Show how many people there were althogether
It is easy to see the category with the most people
Has a little logo to tell how many people

Solutions/Notes Page 41
Investigations in Data Management Grade 4: Our Classroom Community
Solutions & Notes
Some students may argue that the picto-graph does not , for example, show how many preferred skateboards, only how many of those who had skateboards preferred them. This is quite correct. The question would be better worded “How many of those surveyed preferred skateboards if they had them?” Discuss the need for accurate language or the need to have a common understanding of the language that is used. In the example above, as long as everyone agrees to word the question “How many preferred...?” to mean “How many of those who have skateboards preferred ...?” then this language is permissible.
Activity 5: Assessing Group Representations
Possible interpretations of questions on BLM 9
1. Graphs should be neat and easy to read.
2. The questions can (or cannot) be answered from the graph. The questions are clear. The questions make us think.
3. The speakers should speak clearly.
It should be easy to hear the speakers. The speakers should not just read notes.
4. Mathematical words like ‘graph’ are used correctly.
The speaker uses many math words.
5. We could follow the presentations from beginning to end.
The speakers told how they made the graph before telling us how they collected the data.

Page 42 Assessment
Grade 4: Our Classroom Community Investigations in Data Management
Suggested Assessment Strategies
Suggested strategies (Ministry of Education and Training, 1995) are as follows:
InvestigationsInvestigations involve explorations of mathematical questions that may be related to other subject areas. Investigations deal with problem posing as well as problem solving. Investigations give information about a student’s ability to:
• identify and define a problem;• make a plan;• create and interpret strategies;• collect and record needed information;• organize information and look for patterns;• persist, looking for more information if needed;• discuss, review, revise, and explain results.
JournalsA journal is a personal, written expression of thoughts. Students express ideas and feelings, ask questions, draw diagrams and graphs, explain processes used in solving problems, report on investigations, and respond to open-ended questions. When students record their ideas in math journals, they often:
• formulate, organize, internalize, and evaluate concepts about mathematics;• clarify their thinking about mathematical concepts, processes, or questions;• identify their own strengths, weaknesses, and interests in mathematics;• reflect on new learning about mathematics;• use the language of mathematics to describe their learning.
ObservationsResearch has consistently shown that the most reliable method of evaluation is the ongoing, in-class observation of students by teachers. Students should be observed as they work individually and in groups. Systematic, ongoing observation gives information about students’:
• attitudes towards mathematics;• feelings about themselves as learners of mathematics;• specific areas of strength and weakness;• preferred learning styles;• areas of interest;• work habits — individual and collaborative;• social development;• development of mathematics language and concepts.
In order to ensure that the observations are focused and systematic, a teacher may use checklists, a set of questions, and/or a journal as a guide. Teachers should develop a realistic plan for observing students. Such a plan might include opportunities to:
• observe a small number of students each day;• focus on one or two aspects of development at a time.

Assessment Page 43
Investigations in Data Management Grade 4: Our Classroom Community
Suggested Assessment Strategies
Student Self-AssessmentStudent self-assessment promotes the development of metacognitive ability (the ability to reflect critically on one’s own reasoning). It also assists students to take ownership of their learning, and become independent thinkers. Self-assessment can be done following a co-operative activity or project using a questionnaire which asks how well the group worked together. Students can evaluate comments about their work samples or daily journal writing. Teachers can use student self-assessments to determine whether:
• there is change and growth in the student’s attitudes, mathematics understanding, and achievement;• a student’s beliefs about his or her performance correspond to his/her actual performance;• the student and the teacher have similar expectations and criteria for evaluation.
Resources for Assessment
1. The Ontario Curriculum Grades 1-8: Mathematics, Ministry of Education and Training, 1997.
2. “Linking Assessment and Instruction in Mathematics: Junior Grades” by OAME/OMCA, Crompton et al, 1996.
The document provides a selection of open-ended problems tested in grades 4, 5, and 6. Performance Rubrics are used to assess student responses (which are included) at four different levels. Problems could be adapted for use at the Junior Level. Order from OAME/AOEM, P.O. Box 96, Rosseau, Ont., P0C 1J0. Phone/Fax 705-732-1990.
3. “Mathematics Assessment: Myths, Models, Good Questions, and Practical Suggestions”, by Jean Karr Stenmark (Ed.), NCTM, 1991.
This book contains a variety of assessment techniques and gives samples of student work at different levels. Order from Frances Schatz, 56 Oxford Street, Kitchener, Ont., N2H 4R7. Phone 519-578-5948; Fax 519-578-5144. email: [email protected]
4. “Assessment”, Arithmetic Teacher Focus Issue, February 1992, NCTM. This copy of NCTM’s journal for elementary school addresses several issues dealing with assessment. It
also includes suggested techniques and student activities.
5. “How to Evaluate Progress in Problem Solving”, by Randall Charles et al., NCTM, 1987. Suggestions for holistic scoring of problem solutions include examples of student work. Also given are
ways to vary the wording of problems to increase/decrease the challenge. A section on the use of multiple choice test items shows how these, when carefully worded, can be used to assess student work.
Page 44 Assessment
Grade 4: Our Classroom Community Investigations in Data Management
Suggested Assessment Strategies
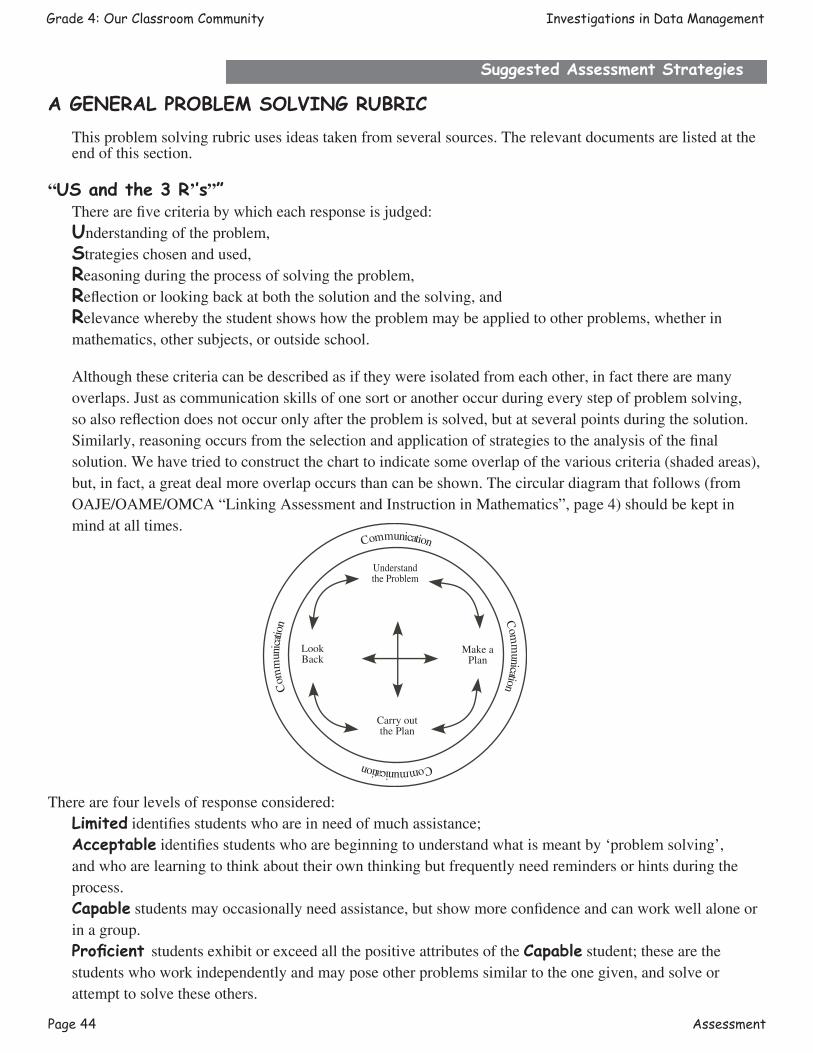
A GENERAL PROBLEM SOLVING RUBRICThis problem solving rubric uses ideas taken from several sources. The relevant documents are listed at the end of this section.
“US and the 3 R’’s””There are five criteria by which each response is judged:Understanding of the problem,Strategies chosen and used,Reasoning during the process of solving the problem,Reflection or looking back at both the solution and the solving, andRelevance whereby the student shows how the problem may be applied to other problems, whether in mathematics, other subjects, or outside school.
Although these criteria can be described as if they were isolated from each other, in fact there are many overlaps. Just as communication skills of one sort or another occur during every step of problem solving, so also reflection does not occur only after the problem is solved, but at several points during the solution. Similarly, reasoning occurs from the selection and application of strategies to the analysis of the final solution. We have tried to construct the chart to indicate some overlap of the various criteria (shaded areas), but, in fact, a great deal more overlap occurs than can be shown. The circular diagram that follows (from OAJE/OAME/OMCA “Linking Assessment and Instruction in Mathematics”, page 4) should be kept in mind at all times.
There are four levels of response considered: Limited identifies students who are in need of much assistance; Acceptable identifies students who are beginning to understand what is meant by ‘problem solving’,
and who are learning to think about their own thinking but frequently need reminders or hints during the process.
Capable students may occasionally need assistance, but show more confidence and can work well alone or in a group.
Proficient students exhibit or exceed all the positive attributes of the Capable student; these are the students who work independently and may pose other problems similar to the one given, and solve or attempt to solve these others.
Communication
Understandthe Problem
LookBack
Make aPlan
Carry outthe Plan
Com
munication
CommunicationC
omm
unica
tion

Assessment Page 45
Investigations in Data Management Grade 4: Our Classroom Community
Suggested Assessment Strategies
Limited Capable
• requires teacher assistance to interpret the problem
• fails to recognize all essential elements of the task
• needs assistance to choose an appropriate strategy
• applies strategies randomly or incorrectly
• does not show clear understanding of a strategy1
• shows no evidence of attempting other strategies
• makes major mathematical errors
• uses faulty reasoning and draws incorrect conclusions
• may not complete a solution
• describes4 reasoning in a disorganized fashion, even with assistance
• has difficulty justifying5 reasoning even with assisstance
• shows no evidence of reflection or checking of work
• can judge the reasonableness of a solution only with assistance
• unable to identify similar6 problems
• unlikely to identify extensions7 or applications of the mathematical ideas in the given problem, even with assistance
• shows partial understanding of the problem but may need assistance in clarifying
• identifies an appropriate strategy
• attempts an appropriate strategy, but may not complete it correctly2
• tries alternate strateges with prompting
• may present a solution that is partially
incorrect
• partially describes4 a solution and/or reasoning or explains fully with assistance
• justification5 of solution may be inaccurate, incomplete or incorrect
• shows little evidence of reflection or checking of work
• is able to decide whether or not a result is reasonable when prompted to do so
• unable to identify similar6 problems
• recognizes extensions7 or applications with prompting
• shows a complete understanding of the problem
• identifies an appropriate strategy
• uses strategies effectively
• may attempt an inappropriate strategy, but eventually discards it and tries another without prompting
• produces a correct and complete solution, possibly with minor errors
• is able to describe4 clearly the steps in reasoning; may need assistance with mathematical language
• can justify5 reasoning if asked; may need assistance with language
• shows some evidence of reflection and checking of work
• indicates whether the result is reasonable, but not necessarily why
• identifies similar6 problems with prompting
• can suggest at least one extension7, variation, or application of the given problem if asked
Acceptable Proficient
• shows a complete understanding of the problem
• identifies more than one appropriate strategy
• chooses and uses strategies effectively3
• recognizes an inappropriate strategy quickly and attempts others without prompting
• produces a correct and complete solution, and may offer alternative methods of solution
• explains reasoning in clear and coherent mathematical language
• justifies5 reasoning using appropriate mathematical language
• shows ample evidence of reflection and thorough checking of work
• tells whether or not a result is reasonable, and why
• identifies similar6 problems, and may even do so before solving the problem
• suggests extensions7, variation, or applications of the given problem independently
LEVEL OF RESPONSE
CRITERIA
FOR
ASSESSMENT
S T R A T E G I E SR E A S O N I N GR E F L E C T I O NR E L E V A N C E
U N D E R S T A N D I N G
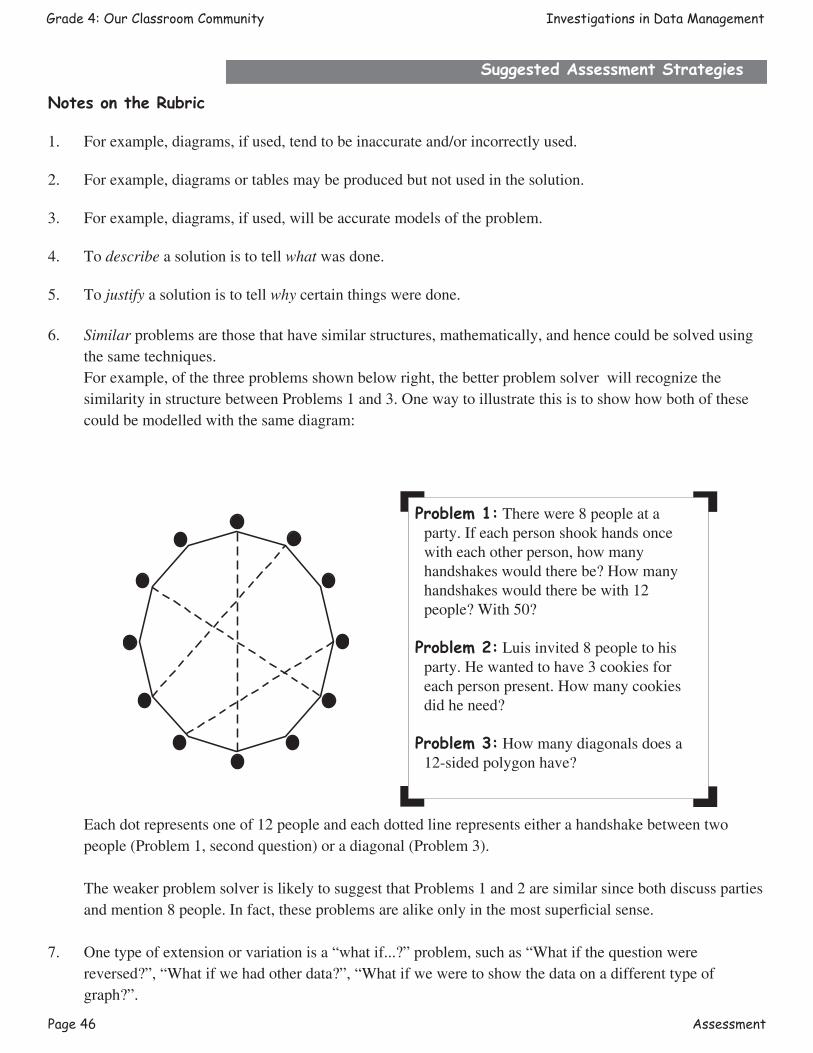
Page 46 Assessment
Grade 4: Our Classroom Community Investigations in Data Management
Suggested Assessment Strategies
Notes on the Rubric
1. For example, diagrams, if used, tend to be inaccurate and/or incorrectly used.
2. For example, diagrams or tables may be produced but not used in the solution.
3. For example, diagrams, if used, will be accurate models of the problem.
4. To describe a solution is to tell what was done.
5. To justify a solution is to tell why certain things were done.
6. Similar problems are those that have similar structures, mathematically, and hence could be solved using the same techniques.
For example, of the three problems shown below right, the better problem solver will recognize the similarity in structure between Problems 1 and 3. One way to illustrate this is to show how both of these could be modelled with the same diagram:
Each dot represents one of 12 people and each dotted line represents either a handshake between two people (Problem 1, second question) or a diagonal (Problem 3).
The weaker problem solver is likely to suggest that Problems 1 and 2 are similar since both discuss parties and mention 8 people. In fact, these problems are alike only in the most superficial sense.
7. One type of extension or variation is a “what if...?” problem, such as “What if the question were reversed?”, “What if we had other data?”, “What if we were to show the data on a different type of graph?”.
Problem 1: There were 8 people at a party. If each person shook hands once with each other person, how many handshakes would there be? How many handshakes would there be with 12 people? With 50?
Problem 2: Luis invited 8 people to his party. He wanted to have 3 cookies for each person present. How many cookies did he need?
Problem 3: How many diagonals does a 12-sided polygon have?

Assessment Page 47
Investigations in Data Management Grade 4: Our Classroom Community
Suggested Assessment Strategies
SuggeSted AdApted RubRic foR Activity 1
The rubric below has been adapted for Activity 1: Interpreting Incomplete Bar Graphs. Four components of the problem are considered: the matching of data descriptions (BLM 2) with given graphs (BLM 1); reasons given for these matches; reflective thinking both during the problem solving and after; presentation of the solution.
Limited Capable
• half (or more) of the matches of the data descriptions to the given graphs are unrealistic
• may not identify a data description for each graph
• shows a lack of flexibility in thinking: once a match of data for graph is made, it remains in place to the detriment of finding other matches
• reasons are missing or very brief; they also may be superficial or inappropriate
• cannot respond in any meaningful way to classmates’ questions or challenges about their reasoning
• shows limited understanding of the relationship between the data descriptions and the given graphs
• may have one or two questionable matches of data to graph
• identifies a match for each graph, and is resistant to the idea of changing any matches (i.e., to correct their initial choice)
• reasons show some logical thought, based on magnitudes of data sets, but may be incomplete
• responds to classmates’ questions or challenges with brief, sometimes repetitious statements
• shows some understanding of the relationship between the data description and the given graphs
• all the matches of data to graph are reasonable
• identifies a match for each graph; may change matches during the problem-solving process
• reasons are well thought out and show consideration of the magnitudes of the data sets
• responds to most classmates’ questions or challenges with clear reasons
Acceptable Proficient
• shows full understanding of the relationship between the data descriptions and the given graphs
• all the matches of data to graph are reasonable, and some alternative valid matches may be given
• shows great flexibility in matching data sets to graphs and in rethinking conclusions when appropriate
• reasons are clear and complete and use appropriate language; they are based on, or include reference to, the magnitudes of the data sets
• responds confidently to classmates’ questions or challenges using appropriate language

Page 48 Other Resources
Grade 4: Data Management Investigations in Data Management
Other Resources
1. “Making Sense of Data: Addenda Series, Grades K-6”, by Mary Lindquist et al., NCTM, 1992. Activities for each grade are presented with lesson outlines and selected black line masters. Students collect,
represent and analyze data.
2. “Dealing with Data and Chance: Addenda Series, Grades 5-8”, by Judith S. Zawojewski et al., National Council of Teachers of Mathematics, 1991.
Data gathering and reasoning are two of the themes of this book. Ways people use data and chance in their everyday lives are also discussed.
3. “Developing Graph Comprehension: Elementary and Middle School Activities”, by Frances R. Curcio, NCTM, 1989.
The book contains 25 activities for classroom use dealing with interpreting and constructing various types of graphs.
4. “Ideas”, by Calvin and Rosemary Irons, Arithmetic Teacher, NCTM, October 1991, pages 26-33. The activities presented involve mostly pictographs. Student pages are available for copying. One activity
focuses on “Favourite Type of Music.”
5. “Ideas”, by Helene Silverman, Arithmetic Teacher, NCTM, December 1989, pages 27-32, and April 1990, pages 27-32.
These two articles involve generating and collecting data, as well as making charts and graphs. Student pages are available for copying.
The Dec. ’89 article uses U.S. geography for data; you could just as easily use Canadian geography. The April ’90 article involves making various measurements, including the jump length of the “Incredible
Cotton-ball Frog”.
6. “Gender, Ninja Turtles, and Pizza: Using a Classroom Database for Problem Solving”, by Judith Day Siegel, Teaching Children Mathematics, NCTM, December 1996, pages 192-199.
Students collect a wide range of classroom data as a database in Clarisworks™, and select various sets of data to illustrate with graphs.
7. “Ideas”, by Joan Westley, Arithmetic Teacher, NCTM, February 1991, pages 30-36. Students use balloons to collect data for a variety of graphs from sources of free balloons to lung capacity.
Students pages are available for copying, and a letter for parents/caregivers is included.
8. “Ideas”, by Sharon L. Young, Arithmetic Teacher, NCTM, April 1991, Pages 26-33. Students discuss different ways to collect data, and then use one of the techniques, comparing their data with
national data provided. Black Line Masters and a Letter to Parents are included.
9. “ Ideas” by Sharon L. Young, Arithmetic Teacher, NCTM, December 1990, pages 23 - 33. Students collect data on bicycles, such as, colour, type of wheels, bicycle racing records, etc., and graph the data. Sample activity sheets are included.
Other Resources Page 49
Investigations in Data Management Grade 4: Our Classroom Community
Other Resources
10. “ Consumer Investigations: What Is The ‘Best Chip’”. by Dixie Methany, Teaching Children Mathematics, NCTM, March 2001, Pages 418 - 420
Students design surveys and collect data to determine favourites, to compare crispiness and to identify calories per serving for several varities of chips (potatoe, salsa, corn, etc.). They write reports “ for a consumer magazine” that include charts and graphs.
11. “ Our Heritage: Learning Data - Management Skills Meaningfully,” by Yvonne M. Pothier and Christine M. Nickerson, Teaching Children Mathematics, NCTM, October 1997, pages 82 -88
Students collect data about themselves and their families, such as ‘my choice of occupation’, ‘toys I own’, ‘allowances my grandparents received’, ‘sports my grandparents played’, and so on. Sample questionnaires are included.
12. “ Graphing in the Information Age: Using Data from the World Wide Web,” by Juli K. Dixon and Christy J. Falba, Mathematics Teaching in the Middle School, NCTM, March - April 1997, pages 298 - 304.
Ideas for activities include interpretation and creation of bar graphs, line graphs, and circle graphs. Examples of the type of data that can be found on the web page given (e.g., average earnings versus education, NHL stats, frequency of winning lotto numbers).
13. “ Adventures in Statistics”, by Thomas R. Scavo and Byron Petraroja, Teaching Childred Mathematics, NCTM, March 1998, pages 394 - 400.
Students collect and graph data on the length and width of classrooms and the number of students, then investigate the area per student in each classroom. Sample recording sheets are included.