INVESTOR PRESENTATION - Microsoft › assets › uploads › ... · -3.000-2.000-1.000 0 1.000...
33
INVESTOR PRESENTATION 1
Transcript of INVESTOR PRESENTATION - Microsoft › assets › uploads › ... · -3.000-2.000-1.000 0 1.000...

INVESTOR PRESENTATION
1

01REFINING INDUSTRY
02COMPANY OVERVIEW
03KEY FINANCIALS
04INVESTMENTS
CONTENTS
2
01 REFINING INDUSTRY
3

26,0
50,7
40,3
56,3
49,2
47,5
53,4
44,3
52,4
25
30
35
40
45
50
55
Jan-16 Feb-16 Mar-16 Apr-16 May-16 Jun-16 Jul-16 Aug-16 Sep-16 Oct-16 Nov-16 Dec-16 Jan-17 Feb-17 Mar-17 Apr-17 May-17 Jun-17 Jul-17 Aug-17
PROS
OPEC & Non OPEC Supply Cut
Healthy PMI data in US, Europe and China
Expectation of high global GDP
Protests in Venezuela
Inventory levels
Brent Crude Oil Prices ($/bbl)
4
CONS
Increase in number of rigs & production in US
Concerns about the impact of OPEC & Non
OPEC production cuts
Supply is still in line with demand, inventory
drawbacks has not stabilized yet
Increase in Libya, Brazil, Nigeria & Canada prod.
High crude exports of OPEC
-3.000
-2.000
-1.000
0
1.000
2.000
3.000China India Middle East Other Asia Other Japan North America Europe
810 640
160 195 52-255
-543 -486
334
150
340 135
-145
-109 -266
160
250
18184
180
-240
65
-421
530
526
302
-775
-546
520
400
120
390
-140
305
-352
270
510
198
-443
63
-189
244
300 417
150
40
-130
364
-57
70
156
-220
76
-143
105
-268
Th
ou
san
ds
2009 2010 2011 2012
2013 2014 2015 2016
Refinery Capacity ChangeTh
ou
san
dB
arre
ls/D
ay
0
200
400
600
800
1.000
1.200
1.400
1.600
1.800
2012 2013 2014 2015 2016 2017 2018 2019 2020
1.678 1.790
1.041
1.685
407
1.335
679
1.082 1.080
Source: Tüpraş, Reuters, Reports
Gross Capacity Additions
5
Turkish Economy Strengths
7980
8181
82
76
78
80
82
84
2016 2017 2018 2019 2020
Population (mn)
0-40 yrs >65%
9,28,8
2,1
4,2
3,0
4,0
2,9
5,0
0
2
4
6
8
10
2010 2011 2012 2013 2014 2015 2016 2017Q1
GDP Forecast (Million USD)
127
134 176
213
0
50
100
150
200
250
2014 2015 2020 2030
Car ownership per thousand people
67%
Source: EMRA, TSI
1.4% growth in last 5 yrs2002-2014 4.9%2010-2014 5.4%
22
23
24
25
26
20
21
22
23
24
25
26
27
2016 2017 2018 2019 2020
Diesel Consumption 3.5%
annual
growth8.7% average growth in last 5 yrs
6

Competitive Advantages of Tüpraş
Added Value
Created by Tüpraş
Best Fit for the Market with high diesel yield
High Complexity of Tüpraş
Presence in all overTurkey through
refineries and terminals
Local Market Dynamics
High Growth
Short on Diesel
Import Parity Pricing(Freight advantage of
Tüpraş)
Cost Base of Tüpraş
Energy Efficient
Crude Oil & FeedstockCost Advantage
Economies of Scale
7

8
Middle Distillate Cracks ($/bbl)
Kaynak: Platts*As of 10th Aug,2017
14,8
7,67,27,8 8,6
7,3
10,010,4
11,110,0
11,210,6
10,412,4
13,3
0
4
8
12
16
20
Jan Feb Mar Apr May Jun Jul Agu Sep Oct Nov Dec
Diesel2014 2015 2016 2017
15,1
8,06,6
7,6 7,76,7
9,1
9,5 10,18,9
10,29,5 10,1
11,7
12,6
0
4
8
12
16
20
Jan Feb Mar Apr May Jun Jul Agu* Sep Oct Nov Dec
Jet Fuel

Light Distillate Cracks ($/bbl)
-7,9
-11,7
-7,3
-7,3
2,4
-4,0
-0,5
-0,7
-2,2 -2,0-3,2 -3,0
-2,2-1,6
-12
-8
-4
0
4
Jan Feb Mar Apr May Jun Jul Agu* Sep Oct Nov Dec
Naphta
-46,0
-31,0
-4,7-2,2
-21,9
-17,2
-12,2-10,2
-19,5
-19,8
-14,9
-20,5
-15,8
-50
-40
-30
-20
-10
0
Jan Feb Mar Apr May Jun July Agu* Sep Oct Nov Dec
LPG
9,8
15,7
18,6
12,811,9
13,514,1
12,2
15,913,7 13,4
14,3
15,3
0
6
12
18
24
Jan Feb Mar Apr May Jun Jul Agu* Sep Oct Nov Dec
Gasoline2014 2015 2016 2017
Kaynak: Platts*As of 10th Aug,2017
9
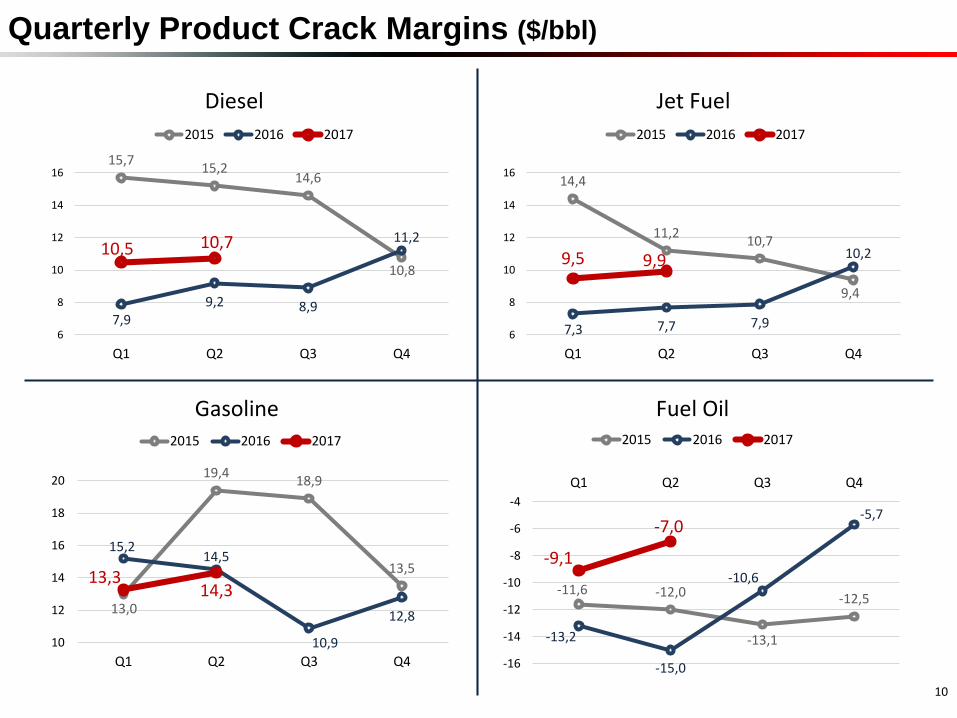
Quarterly Product Crack Margins ($/bbl)
10
14,4
11,210,7
9,4
7,3 7,7 7,9
10,29,5 9,9
6
8
10
12
14
16
Q1 Q2 Q3 Q4
Jet Fuel
2015 2016 2017
13,0
19,418,9
13,5
15,214,5
10,9
12,8
13,314,3
10
12
14
16
18
20
Q1 Q2 Q3 Q4
Gasoline2015 2016 2017
-11,6 -12,0
-13,1
-12,5
-13,2
-15,0
-10,6
-5,7
-9,1
-7,0
-16
-14
-12
-10
-8
-6
-4
Q1 Q2 Q3 Q4
Fuel Oil2015 2016 2017
15,715,2
14,6
10,8
7,99,2 8,9
11,210,5 10,7
6
8
10
12
14
16
Q1 Q2 Q3 Q4
Diesel
2015 2016 2017

Crude Price Differentials ($/bbl)
11
-12
-8
-4
0
Price Differentials
Ural Iran Light (KI) Iran Heavy (KI) Kirkuk Arab. Heavy
Brent
-1,23 -1,46
-1,73
-1,12 -1,37
-0,96
-4
-3
-2
-1
0
1
Jan Feb Mar Apr May Jun Jul Aug Sep Oct Nov Dec
2012-2017 Differental Range 2015 2016 2017
Ural DifferentialsBrent

Turkish Consumption (Million tons)
17,43
20,56
22,31
10 12 14 16 18 20 22 24
2014
2015
2016
Diesel
4,10
4,58
4,40
0,0 1,0 2,0 3,0 4,0 5,0
2014
2015
2016
Jet Fuel
1,92
2,10
2,23
0,8 1,0 1,2 1,4 1,6 1,8 2,0 2,2
2014
2015
2016
Gasoline
0,71
0,60
0,58
0,0 0,2 0,4 0,6 0,8
2014
2015
2016
Fuel Oil*
12Source: EMRA*bunker excluded.
+8.5 %
+15.8 %
+9.1 %
+6.5 %
-14.6%
-3.5%
+12 %
-4%
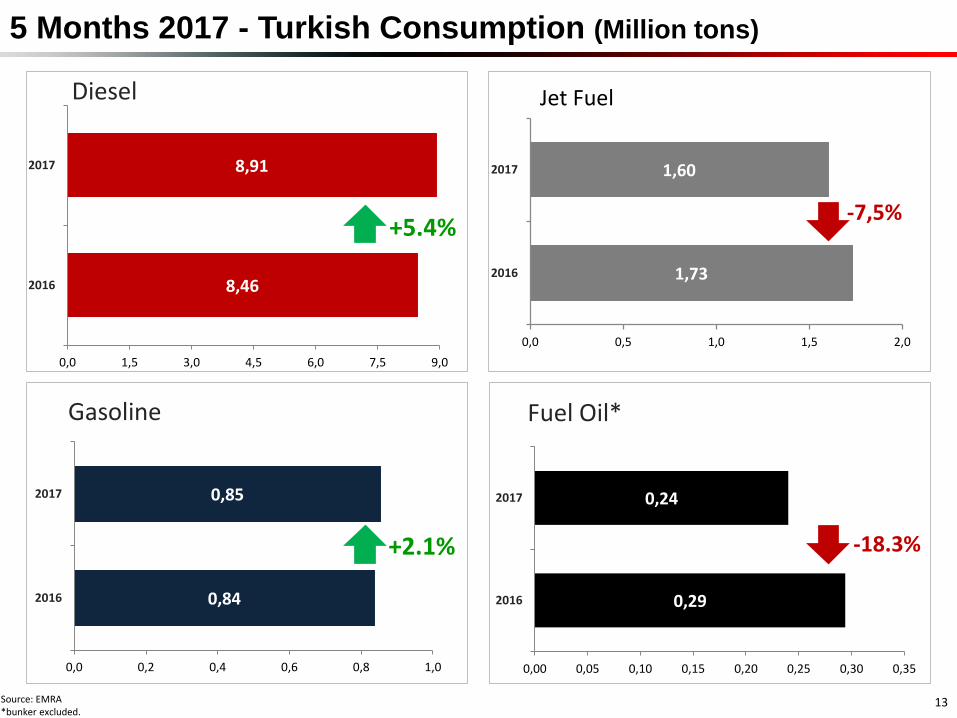
1,73
1,60
0,0 0,5 1,0 1,5 2,0
2016
2017
Jet Fuel
-7,5%
5 Months 2017 - Turkish Consumption (Million tons)
8,46
8,91
0,0 1,5 3,0 4,5 6,0 7,5 9,0
2016
2017
Diesel
0,84
0,85
0,0 0,2 0,4 0,6 0,8 1,0
2016
2017
Gasoline
+2.1%
0,29
0,24
0,00 0,05 0,10 0,15 0,20 0,25 0,30 0,35
2016
2017
Fuel Oil*
Source: EMRA*bunker excluded.
13
+5.4%
-18.3%

Turkey’s Import / Export Balance (Net) (Million Ton)
-3,0
2,1
-10,0
1,5
-3,0
2,5
-10,8
1,6
-3,1
2,4
-12,0
1,0
-3,1
2,5
-12,7
1,8
-3,0
3,0
-12,3
1,6
-3,4
2,8
-13,0
0,3
-14
-12
-10
-8
-6
-4
-2
0
2
4
LPG Gasoline Diesel Fuel
2011 2012 2013 2014 2015 2016
Export
Import
14

02 COMPANY OVERVIEW
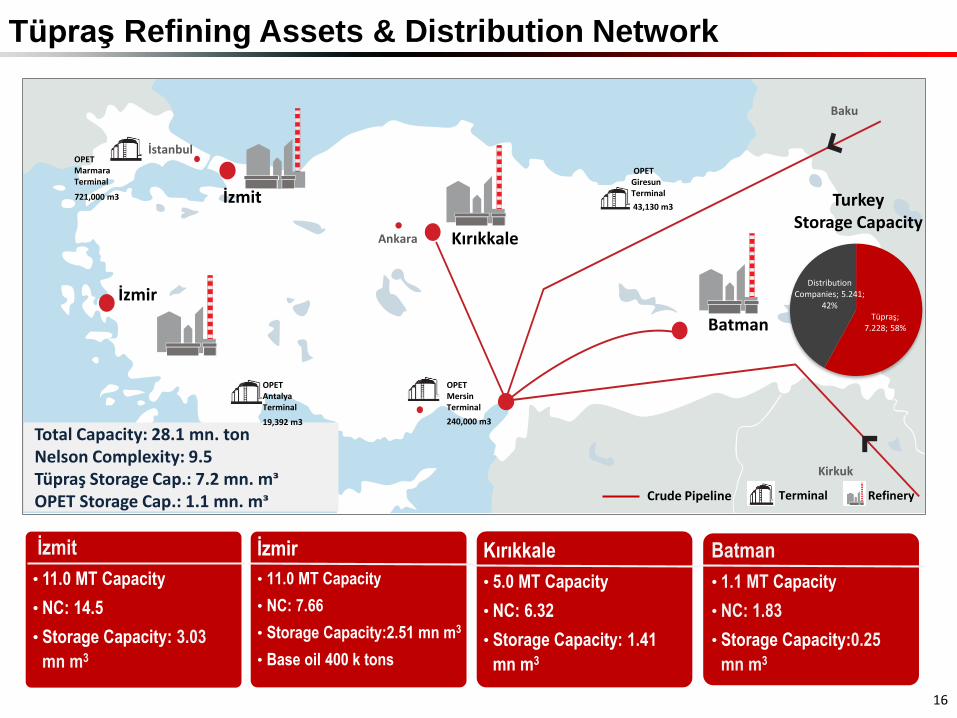
Kırıkkale
• 5.0 MT Capacity
• NC: 6.32
• Storage Capacity: 1.41
mn m3
Tüpraş Refining Assets & Distribution Network
İzmir
İzmit
Ankara
İstanbul
Kırıkkale
Batman
Kirkuk
Baku
Terminal Refinery
OPETGiresun Terminal
OPETMersin Terminal
OPETAntalya Terminal
OPETMarmara Terminal
Total Capacity: 28.1 mn. tonNelson Complexity: 9.5Tüpraş Storage Cap.: 7.2 mn. mᶟOPET Storage Cap.: 1.1 mn. mᶟ
19,392 m3 240,000 m3
721,000 m343,130 m3
İzmit
• 11.0 MT Capacity
• NC: 14.5
• Storage Capacity: 3.03
mn m3
İzmir
• 11.0 MT Capacity
• NC: 7.66
• Storage Capacity:2.51 mn m3
• Base oil 400 k tons
Batman
• 1.1 MT Capacity
• NC: 1.83
• Storage Capacity:0.25
mn m3
Crude Pipeline
Tüpraş; 7.228; 58%
Distribution Companies; 5.241;
42%
TurkeyStorage Capacity
16
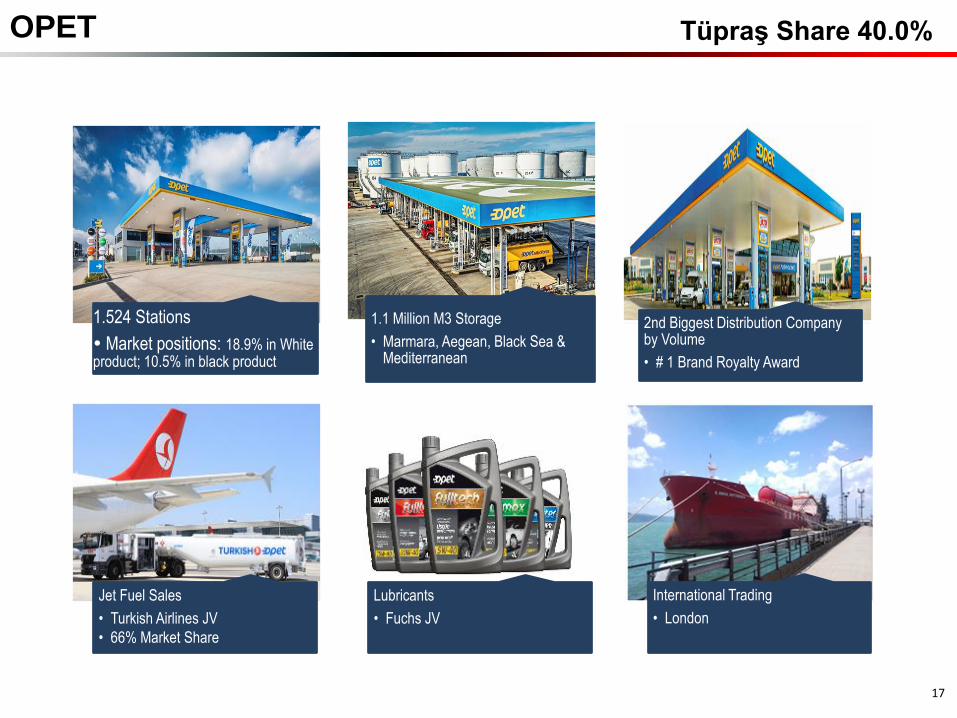
OPET
1.524 Stations
Market positions: 18.9% in White product; 10.5% in black product
1.1 Million M3 Storage
• Marmara, Aegean, Black Sea & Mediterranean
International Trading
• London
Jet Fuel Sales
• Turkish Airlines JV
• 66% Market Share
Lubricants
• Fuchs JV
2nd Biggest Distribution Companyby Volume
• # 1 Brand Royalty Award
17
Tüpraş Share 40.0%
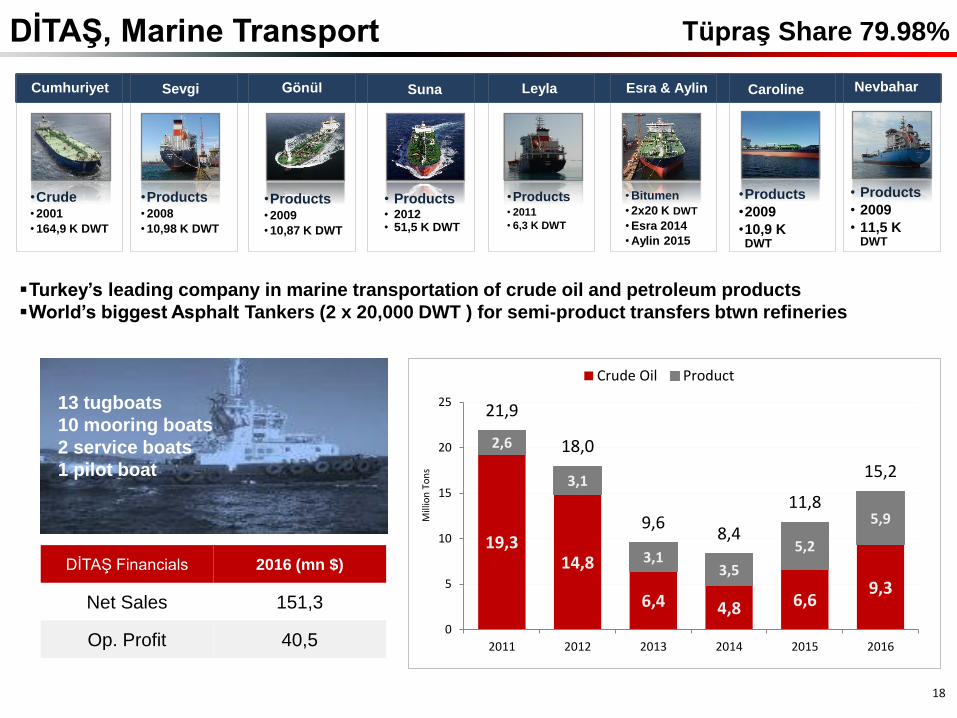
DİTAŞ, Marine Transport
•Crude• 2001
• 164,9 K DWT
Cumhuriyet
•Products• 2008
• 10,98 K DWT
Sevgi
•Products• 2009
• 10,87 K DWT
Gönül
• Products• 2012• 51,5 K DWT
Suna
•Products• 2011
• 6,3 K DWT
Leyla
• Bitumen
• 2x20 K DWT
• Esra 2014
• Aylin 2015
Esra & Aylin
•Products
•2009
•10,9 K DWT
Caroline
• Products
• 2009
• 11,5 K DWT
Nevbahar
DİTAŞ Financials 2016 (mn $)
Net Sales 151,3
Op. Profit 40,5
13 tugboats
10 mooring boats
2 service boats
1 pilot boat
Turkey’s leading company in marine transportation of crude oil and petroleum products
World’s biggest Asphalt Tankers (2 x 20,000 DWT ) for semi-product transfers btwn refineries
19,314,8
6,4 4,8 6,69,3
2,6
3,1
3,13,5
5,2
5,9
21,9
18,0
9,68,4
11,8
15,2
0
5
10
15
20
25
2011 2012 2013 2014 2015 2016
Mill
ion
Ton
s
Crude Oil Product
18
Tüpraş Share 79.98%
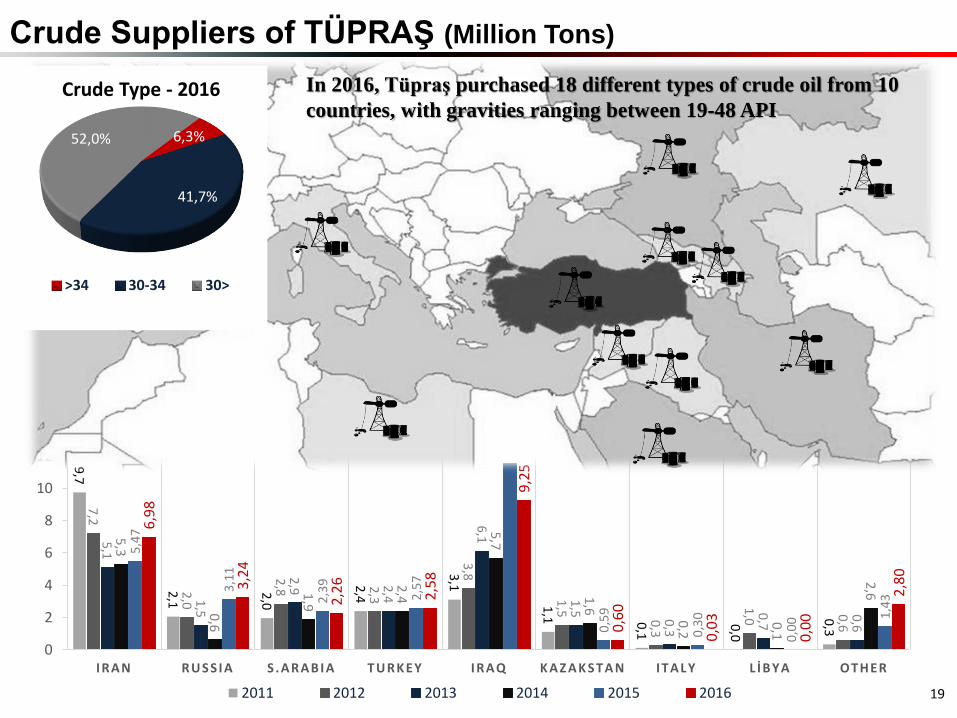
Crude Suppliers of TÜPRAŞ (Million Tons)
9,7
2,1
2,0
2,4
3,1
1,1 0
,1
0,0
0,3
7,2
2,0
2,8 2
,3
3,8
1,5
0,3
1,0 0
,6
5,1
1,5
2,9 2
,4
6,1
1,5
0,3
0,7
0,6
5,3
0,6
1,9
2,4
5,7
1,6
0,2
0,1
2,6
5,4
7
3,1
1
2,3
9
2,5
7
11
,54
0,5
9
0,3
0
0,0
0 1,4
3
6,9
8
3,2
4
2,2
6
2,5
8
9,2
5
0,6
0
0,0
3
0,0
0
2,8
0
0
2
4
6
8
10
12
I RAN RUSSI A S. ARABI A TURK EY I RAQ K A Z A K STA N I TAL Y L İ BYA OTHER
2011 2012 2013 2014 2015 2016 19
In 2016, Tüpraş purchased 18 different types of crude oil from 10
countries, with gravities ranging between 19-48 API
6,3%
41,7%
52,0%
Crude Type - 2016
>34 30-34 30>
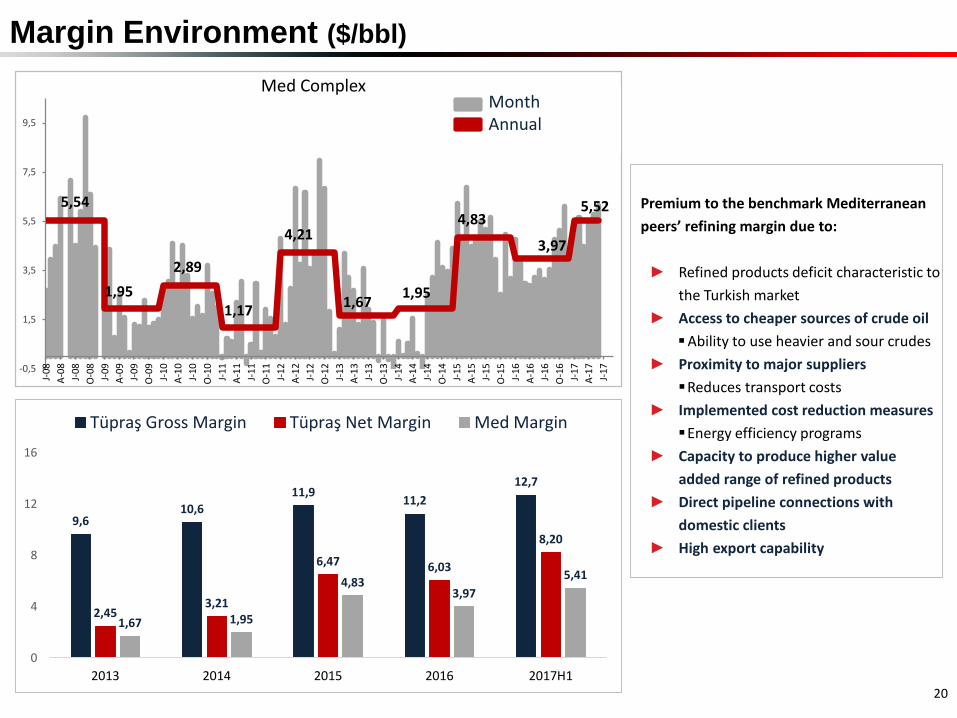
Margin Environment ($/bbl)
Premium to the benchmark Mediterranean
peers’ refining margin due to:
► Refined products deficit characteristic to
the Turkish market
► Access to cheaper sources of crude oil
Ability to use heavier and sour crudes
► Proximity to major suppliers
Reduces transport costs
► Implemented cost reduction measures
Energy efficiency programs
► Capacity to produce higher value
added range of refined products
► Direct pipeline connections with
domestic clients
► High export capability
5,54
1,95
2,89
1,17
4,21
1,671,95
4,83
3,97
5,52
-0,5
1,5
3,5
5,5
7,5
9,5
J-08
A-0
8
J-08
O-0
8
J-09
A-0
9
J-09
O-0
9
J-10
A-1
0
J-10
O-1
0
J-11
A-1
1
J-11
O-1
1
J-12
A-1
2
J-12
O-1
2
J-13
A-1
3
J-13
O-1
3
J-14
A-1
4
J-14
O-1
4
J-15
A-1
5
J-15
O-1
5
J-16
A-1
6
J-16
O-1
6
J-17
A-1
7
J-17
MonthAnnual
Med Complex
20
9,610,6
11,911,2
12,7
2,453,21
6,47 6,03
8,20
1,67 1,95
4,833,97
5,41
0
4
8
12
16
2013 2014 2015 2016 2017H1
Tüpraş Gross Margin Tüpraş Net Margin Med Margin

5,6
6,97,3 7,4
6,6 6,77,2 7,4
7,17,8
0
2
4
6
8
10
1Q 2Q 3Q 4Q
Min / Max 2007/2015
2015
2016
2017
Capacity Utilisation* (%)
Production
21*Nameplate capacity calculated by standard 330 days of operations.
64,9
99,6 96,8108,9
4,1
4,4 5,2
7,6
69,0
104,0 102,0
116,5
0
20
40
60
80
100
120
2014 Q2 2015 Q2 2016 Q2 2017 Q2
Crude Oil Other Total
Quarterly Production Volume (Mil. Tons)

Gasoline21%
Naphtha1%
Jet16%
ULSD35%
Other6%
Coke3%
Fuel Oil9%
ASRFO+Vac0%
Bitumen9%
Gasoline21%
Naphtha1%
Jet17%
ULSD31%
Other6%
Coke2%
Fuel Oil10%
ASRFO+Vac1%
Bitumen11%
1st Half Product Yields
22
Light Distil.22,5%
Mid. Distil.48,4%
Other 5,7%
Black Prod.23,4%
White Product %77,64Production : 14,88 mn tons
API: 30,71
White Product %75,59Production : 13,34 mn tons
API: 30,99
% +3
20172016
3
0,1
Light Distil.21,6%
Mid. Distil.51,4%
Other 5,8%
Black Prod.21,2%
-2,2 -0,9
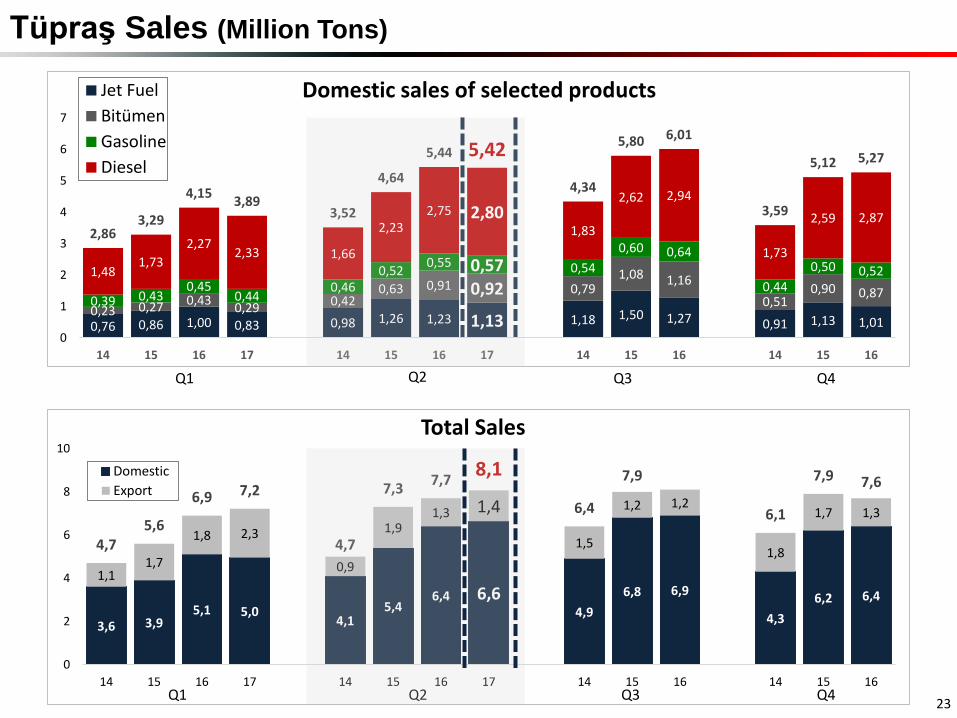
Tüpraş Sales (Million Tons)
23
Q1 Q2 Q3 Q4
3,6 3,95,1 5,0
4,15,4
6,4 6,64,9
6,8 6,9
4,3
6,2 6,4
1,11,7
1,8 2,3
0,9
1,91,3 1,4
1,5
1,2 1,2
1,8
1,7 1,3
4,75,6
6,9 7,2
4,7
7,37,7
8,1
6,4
7,9
6,1
7,9 7,6
0
2
4
6
8
10
14 15 16 17 14 15 16 17 14 15 16 14 15 16
Total Sales
Domestic
Export
Q1 Q2 Q3 Q4
0,76 0,86 1,00 0,83 0,98 1,26 1,23 1,13 1,18 1,50 1,27 0,91 1,13 1,010,23 0,27 0,43
0,29 0,420,63 0,91 0,92 0,79
1,08 1,16
0,510,90 0,87
0,39 0,430,45
0,440,46
0,520,55 0,57 0,54
0,60 0,64
0,44
0,50 0,521,481,73
2,272,33 1,66
2,232,75 2,80
1,83
2,62 2,94
1,73
2,59 2,872,86
3,29
4,153,89
3,52
4,64
5,44 5,42
4,34
5,80 6,01
3,59
5,12 5,27
0
1
2
3
4
5
6
7
14 15 16 17 14 15 16 17 14 15 16 14 15 16
Domestic sales of selected productsJet Fuel
Bitümen
Gasoline
Diesel

274355 400
186 177
628
974
1.213
959
344213
46,6
*125
2006 2007 2008 2009 2010 2011 2012 2013 2014 2015 2016 2017 H1
Investments (mn $)
24
Ongoing Projects
•New Power Plant
•Revamp of Crude Unit
•FCC Modernization
•New Sulphur Units
•Energy Saving Projects
•Optimization of
conversion units
Avg 943 mn $
Avg 278 mn $Avg. 279 mn $
• 9.5 Nelson complexity• High white product yield• Process more heavier and sour
crudes• Run all refineries with 100% capacity utilization RUP
Total Investment: $ 3,2 Billion Total Incentive: TL 3,78 Billion Remaining: TL 3,18 Billion

03 KEY FINANCIALS
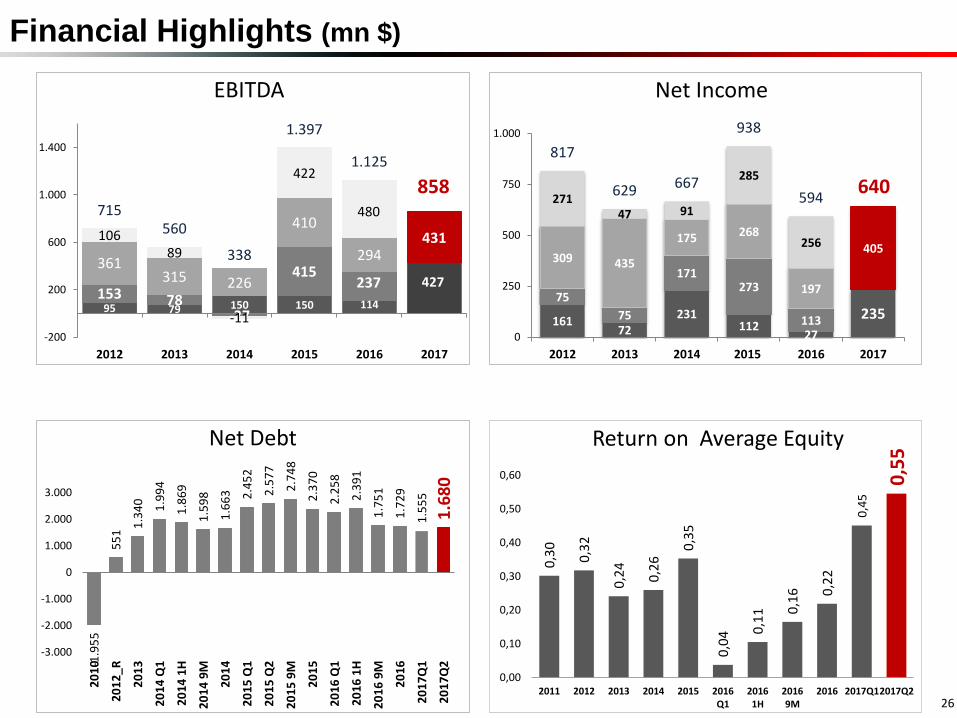
26
Financial Highlights (mn $)
95 79 150 150 114
427153 78
-27
415237
431
361315 226
410
294
10689
-11
422
480715560
338
1.397
1.125
-200
200
600
1.000
1.400
2012 2013 2014 2015 2016 2017
EBITDA
16172
231112
27
23575
75
171273
113
405309 435
175 268
197
27147 91
285
256
817
629 667
938
594
0
250
500
750
1.000
2012 2013 2014 2015 2016 2017
Net Income-1
.95
5
55
1
1.3
40 1.9
94
1.8
69
1.5
98
1.6
63 2.4
52
2.5
77
2.7
48
2.3
70
2.2
58
2.3
91
1.7
51
1.7
29
1.5
55
1.6
80
-3.000
-2.000
-1.000
0
1.000
2.000
3.000
20
10
20
12
_R
20
13
20
14
Q1
20
14
1H
20
14
9M
20
14
20
15
Q1
20
15
Q2
20
15
9M
20
15
20
16
Q1
20
16
1H
20
16
9M
20
16
20
17
Q1
20
17
Q2
Net Debt
0,3
0
0,3
2
0,2
4
0,2
6
0,3
5
0,0
4 0,1
1 0,1
6 0,2
2
0,4
5
0,5
5
0,00
0,10
0,20
0,30
0,40
0,50
0,60
2011 2012 2013 2014 2015 2016Q1
20161H
20169M
2016 2017Q12017Q2
Return on Average Equity
858 640
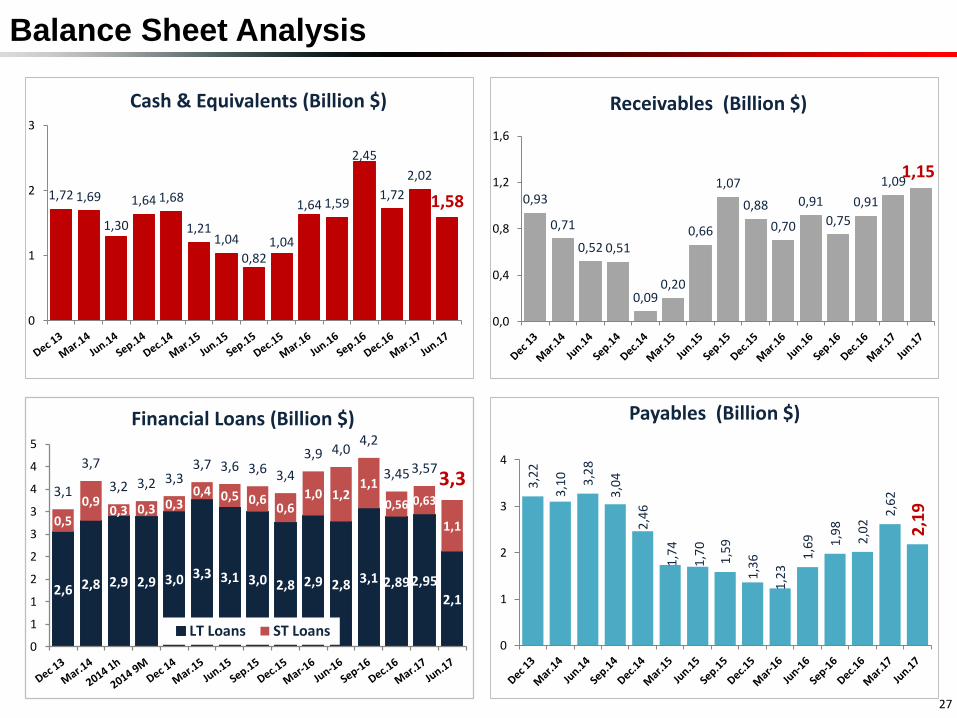
Balance Sheet Analysis
27
1,72 1,69
1,30
1,64 1,68
1,211,04
0,821,04
1,64 1,59
2,45
1,72
2,02
1,58
0
1
2
3
Cash & Equivalents (Billion $)
0,93
0,71
0,52 0,51
0,090,20
0,66
1,07
0,88
0,70
0,91
0,75
0,91
1,091,15
0,0
0,4
0,8
1,2
1,6
Receivables (Billion $)
2,6 2,8 2,9 2,9 3,0 3,3 3,1 3,0 2,8 2,9 2,8 3,1 2,892,95
2,1
0,5
0,90,3 0,3 0,3
0,4 0,5 0,60,6
1,0 1,21,1
0,56 0,63
1,1
3,1
3,7
3,2 3,2 3,33,7 3,6 3,6 3,4
3,9 4,04,2
3,45 3,573,3
0
1
1
2
2
3
3
4
4
5
Financial Loans (Billion $)
LT Loans ST Loans
3,2
2
3,1
0 3,2
8
3,0
4
2,4
6
1,7
4
1,7
0
1,5
9
1,3
6
1,2
3
1,6
9 1,9
8
2,0
2
2,6
2
2,1
9
0
1
2
3
4
Payables (Billion $)

Tüpraş Balance Sheet
28
Million USD 30.06.2017 31.12.2016 Difference % Difference
Current Assets 4.317 3.884 434 11
Cash & C. Equivalents 1.580 1.719 -140 -8
Receivables 1.151 911 240 26
Derivatives 96 10 86 872
Inventories 1.194 1.025 169 16
Pre-paid expenses 33 28 6 20
Other Current Assets 264 190 73 39
Long Term Assets 4.983 4.987 -4 0
Financial Assets & Subsidiaries 279 264 15 6
Fixed Assets 3.345 3.338 8 0
Derivatives 23 105 -82 -78
Pre-paid expenses 92 68 24 35
Deferred Tax 944 917 27 3
Other Long Term Assets 300 296 4 1
Total Assets 9.300 8.871 430 5
Short Term Liabilities 4.534 3.597 937 26
Financial Loans 1.142 556 586 105
Payables 2.186 2.020 166 8
Derivatives 16 8 8 92
Deferred Incomes 1 4 -3 -79
Provisions 37 18 18 98
Other ST Liabilities 1.152 990 162 16
Long Term Liabilities 2.182 2.953 -771 -26
Financial Loans 2.117 2.892 -775 -27
Payables & Provisions 62 59 3 6
Derivatives 1 1 0 35
Other LT Liabilities 2 2 0 0
Equity 2.558 2.298 260 11
Minority Interests 27 22 4 19
Total Liabilities 9.300 8.871 430 5

1,73
3,242,94
4,96
5,83
4,78
0
10,18
7,16
2,31 2,502,98
3,93 3,85
1,58
6,506,22
579626
746
985 964
396
1.6281.557
0
200
400
600
800
1.000
1.200
1.400
1.600
1.800
0
2
4
6
8
10
12
2008 2009 2010 2011 2012 2013 2014 2015 2016
Total Payout (Mn. TL)Earnings per Share Gross Dividend Total Payout
2012/2013 EPS includes the tax incentive 29
One of the highest dividend yield in BIST
In principle; as far as the related regulations, investment needs and financial situation allow, the entire amount of the “net distributable profit for the period”, calculated within the frame of the Capital Markets Regulations, is distributed in
cash – taking into consideration the market expectations, long term company strategies, investment and financing policies, profitability and cash position – as long as it is covered from the existing resources in our legal records.
Dividend

Foreign Currency
Long Term
Tüpraş BBB-(IG) Ba1 (Stab.)
Turkey BB+ (stable) Ba1 (Neg.) BB
Koç Holding Baa3- (IG) BBB (IG)
BUY67%
HOLD; 33%
Analyst Recommendations
• Tüpraş has one of the highest
Corporate Governance Ratings
92,80
97,66
92,55
95,51
94,15
B O A R D
S T A K EH O L D ER S
T R A N S P A R EN C Y
S H A R EH O L D ER S
O V ER A L L
CORPORATE GOVERNANCE RATING
30
Creating Competitive & Sustainable Shareholder Value

FX Risk Exposure (30 June 2017)
ConsolidatedAssets
ConsolidatedLiabilities
LT Financials: 1,797
RUP Loans: 1,111
Other credits 687
ST Financials 1.075
• RUP 305
•Eurobond 700
Payables
932
Forward & CFH
2,142
Stock
1.153
Receivables & otherassets
2
Cash
541
Million $
+34 million $
•A significant portion of the Group'scrude oil and refined product purchasesare denominated in US Dollars. Inaddition, the Group finances its capitalexpenditures mostly throughborrowings denominated in US Dollars.
•Natural Hedge: The Group is able tomitigate some of the impact of volatilityin exchange rates through naturalhedges: crude oil and refined productinventories are US Dollar denominatedassets.
•Cash flow Hedge: RUP Facility financingloans designated as hedginginstruments of highly probable exportrevenues.
•As a general Koç Holding financialpolicy, Group companies are allowed tokeep foreign exchange positions withincertain limits.
31

Future Expectations
Brent PriceEstimation
• The average Brent price in 2017 is expected to be 50-55 dollars per barrel.
Med Complex Margin
• We expect Med Complex margins to be between
4.75 - 5.25 dollars per barrel band in 2017.
TüpraşNet Margin
• Net Tüpraş refinery margin is expected to be in the region of 7.0 – 7.5 dollars per barrel
Capacity Utilisation
Expectations for 2017;
• Full Capacity Utilization
• Production: approximately 29.2 million tons
• Imports of finished products will be minimal, as we focus on selling increased volumes of production
• Total sales: 30.6 million tons
Investment • Refining investments is expected to be 225 Million dollars. Additionally, 125 million dollars investment is planned for increasing the marine tanker fleet capacity.
32

Updated information can be found in the Investor Relations section of the company website
www.tupras.com.tr
Investor Relations and Reporting DepartmentTel. : 262 316 3269Fax : 262 316 30 10-11Güney Mah. Petrol Cad. No .25 PK.41790 Körfez-Kocaeliwww.tupras.com.trE-mail: [email protected]
DISCLAIMER
This presentation contains forward-looking statements that reflect the Company management’s current
views with respect to certain future events. Although it is believed that the expectations reflected in
these statements are reasonable, they may be affected by a variety of variables and changes in
underlying assumptions that could cause actual results to differ materially.
Neither Tüpraş nor any of its directors, managers or employees nor any other person shall have any
liability whatsoever for any loss arising from use of this presentation.33

![[MIDES] Forges - Gestionale ForumPA · 2002 2003 2004 Active and Refereed 2006 2007 2008 2010 Active and Refereed and Online . 5.000 4.500 4.000 3.500 3.000 E 2.500 2.000 1.500 1.000](https://static.fdocuments.us/doc/165x107/60409c4cf066ae59ae600019/mides-forges-gestionale-forumpa-2002-2003-2004-active-and-refereed-2006-2007.jpg)