

Investment Boot Camp - Minnesota Government Finance...
58
Transcript of Investment Boot Camp - Minnesota Government Finance...
Why an Investment Plan / Program?“Governments have a fiduciary responsibility in managing their funds, includingthe ongoing management and monitoring of investment activity. Developing apublic funds investment program is essential to effective financial management,and it sets the foundation for creating protocols and internal controls,constructing and managing the portfolio, navigating changing economicconditions, and communicating information to stakeholders. While differenttypes and sizes of governments require differing levels of complexity in theirinvestment programs, all governments need to recognize their fiduciaryresponsibility. Having an established public funds investment program providesstructure to effectively set policy, make decisions, and safeguard a government’sfinancial assets”
GFOA Best Practice – “Investment Program for Public Funds

Developing an Investment Plan
Foundation• Investment Leadership Team• Portfolio Management Team• Decision Making Process• Investment Policy & Procedures • Cash Flows • Portfolio Strategies /Management
FiduciaryAn individual or institution that has a special relationship of trust with another person or group legally responsible for their assets. Examples Include:
• Treasurers • Finance Directors, • Investment Personnel, • Oversight Boards, • Investment Advisors. • Brokers are NOT fiduciaries at this time.
By Law A Fiduciary Must: 1.Make decisions in the best interest of the beneficiary; 2.Always put the beneficiaries’ interests before their own; and,3.Act prudently.
Prudence Standard
• Prudent Person• Prudent Investor• Prudent Expert
Prudence language typically includes statement similar to: “…shall act with care, skill, prudence, and diligence under the circumstances then prevailing…that a prudent person acting in a like capacity and familiarity with those matters would use…”
Myth• We should keep our cash safe and
Return On Investment (ROI) is of distant secondary importance
Fact• We need to Forecast / maintain
appropriate liquid cash and prudently invest residual
Fiduciary
Decision Making Process• What are Objectives of Plan / Program• What are Investment Constraints State Statutes / Codes Investment Policy Government Risk Tolerance Investment staff experience
What Strategies can be implemented that achieve objective and comply with constraints.
Decision Making ProcessObjectives of Plan / Program should include: • Cash Flow analysis• Determining portfolio structure (how you plan to manage)• Managing Risk • Managing External Factors (that are constantly changing)• Oversight plan (Compliance, Reporting, Rebalancing)

“GFOA makes the following recommendations to government investors with respectto managing market risk:1. Develop and update cash flow projections…2. Structure the portfolio to provide sufficient liquidity for anticipated cash flow
requirements…3. Understand fully the maturity structure of a security…4. Adopt weighted average maturity limitations and/or weighted average duration
targets consistent with the governments investment objectives, constraints, cashflow needs and risk tolerances…
5. Do not directly invest in securities with maturities greater than the limitsimposed by investment policy…”
9
GFOA Best Practice – “Managing Market Risk in Investment Portfolios”
Managing Risk

Managing Risk Interest Rate/Market Risk
• Portfolio duration (how does it compare to benchmark)• Maturity Structure (Ladder, Barbell, Bullet, Callable)
Credit Risk• Allocation limits to asset classes and issuers• Minimum credit ratings• Ongoing credit analysis and monitoring
Prepayment Risk• Callable securities• Amortizing securities
Liquidity Risk
Safekeeping & 3rd Party Custodian Services“One of the most important protections and a control against fraud is the separation of the safekeeping and custody functions from the investment function…By arranging to have securities held by a third party, governments can effectively minimize safekeeping or custodial risk in an investment transaction …Investments should be settled in a delivery-versus-payment (DVP) basis.”
11
GFOA Best Practice – “Using Safekeeping and Third-Party Custodian Services”
Decision Making Process
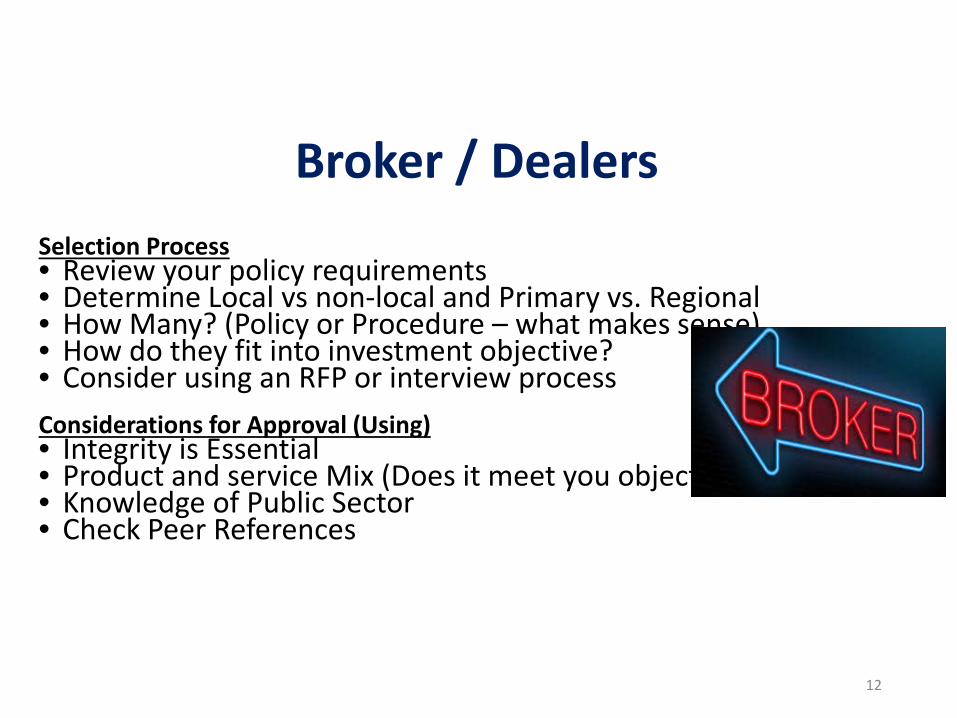
Selection Process• Review your policy requirements• Determine Local vs non-local and Primary vs. Regional• How Many? (Policy or Procedure – what makes sense) • How do they fit into investment objective?• Consider using an RFP or interview processConsiderations for Approval (Using) • Integrity is Essential • Product and service Mix (Does it meet you objective)?• Knowledge of Public Sector• Check Peer References
12
Broker / Dealers
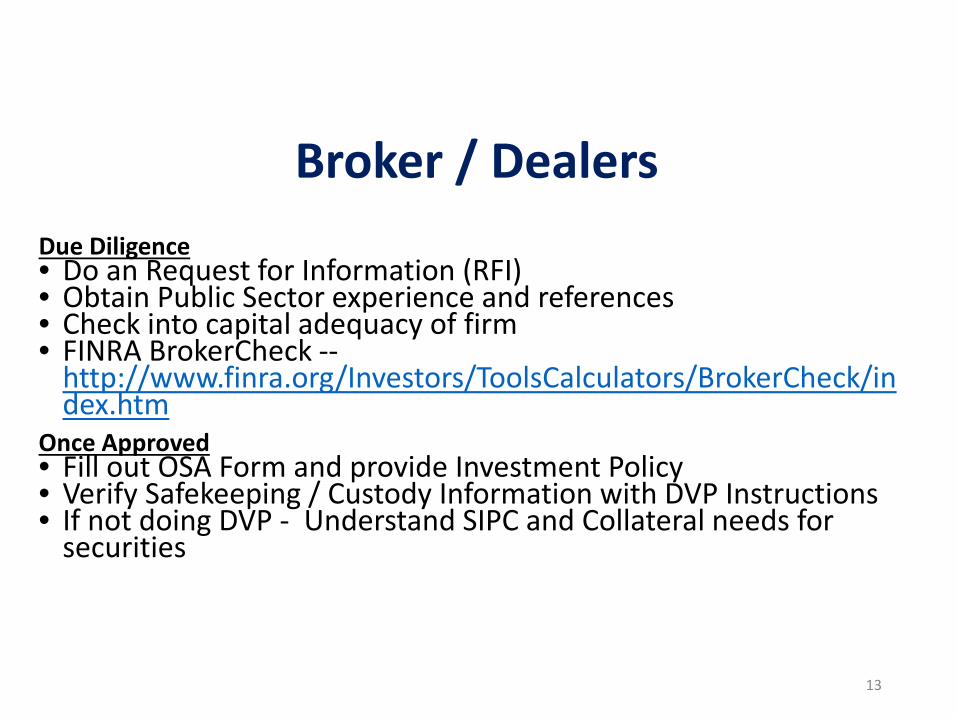
Due Diligence • Do an Request for Information (RFI)• Obtain Public Sector experience and references• Check into capital adequacy of firm • FINRA BrokerCheck --
http://www.finra.org/Investors/ToolsCalculators/BrokerCheck/index.htm
Once Approved• Fill out OSA Form and provide Investment Policy• Verify Safekeeping / Custody Information with DVP Instructions • If not doing DVP - Understand SIPC and Collateral needs for
securities
13
Broker / Dealers
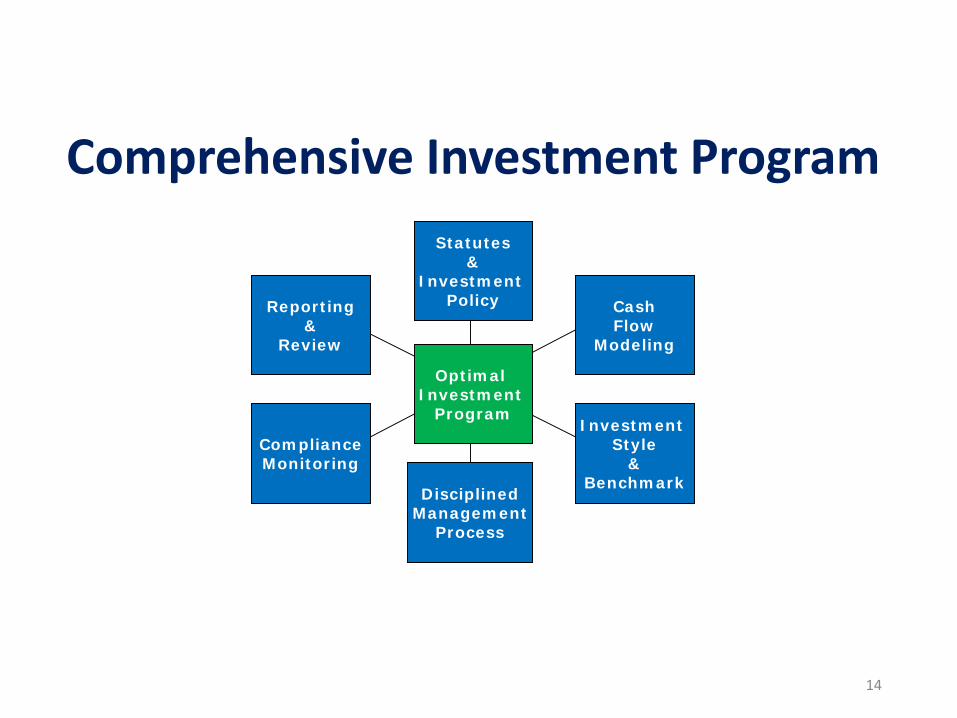
Statutes&
Investment Policy
DisciplinedManagement
Process
Optimal Investment
Program
CashFlow
Modeling
Reporting&
Review
Compliance Monitoring
Investment Style
&Benchmark
14
Comprehensive Investment Program
Why and Investment Policy
“An investment policy enhances the qualityof decision making and demonstrates acommitment to the fiduciary care of publicfunds, making it the most important elementin a public funds program.”
GFOA Best Practice – “Investment Policy”
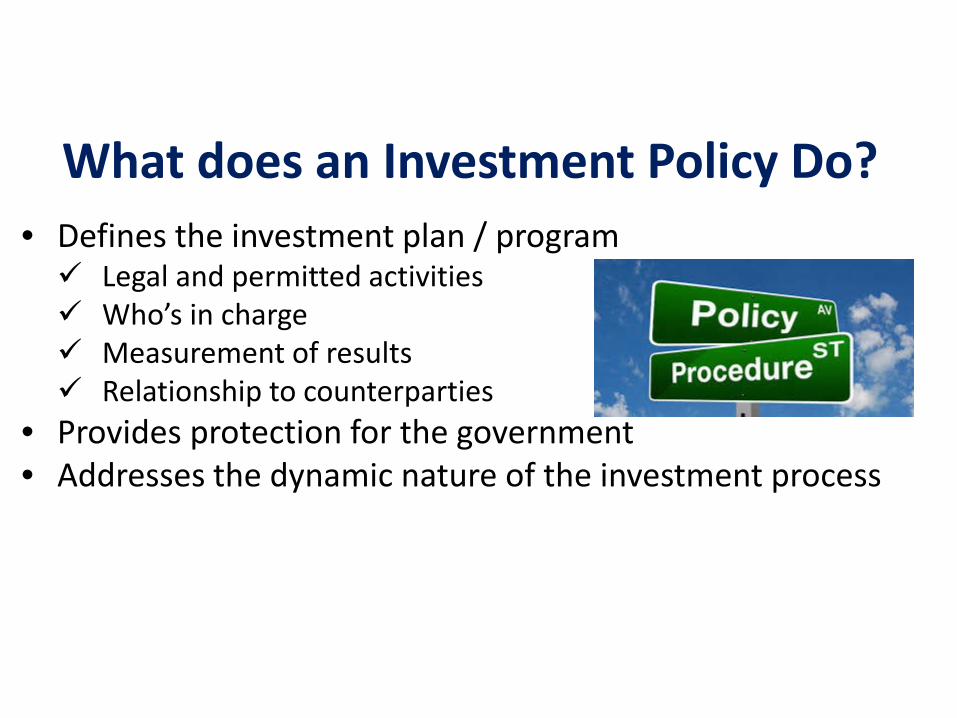
What does an Investment Policy Do?• Defines the investment plan / program Legal and permitted activities Who’s in charge Measurement of results Relationship to counterparties
• Provides protection for the government• Addresses the dynamic nature of the investment process
Investment Policy• Serves as both an internal and external document Defines the parameters of the Investment Program Distributed to outside parties (brokers, Investment managers,
Bond investors, rating agencies, etc… ). • Requires governing body approval (Resolution, ordinance, etc.…)• Should be reviewed periodically and updated
Investment Policy - Components• Policy statement of purpose• Scope / Objective• Prudence / Ethics / Conflict of Interest• Delegation of Authority / Oversight • Authorized broker dealers / External investment managers • Authorized suitable investments • Concentration of Credit Risk• Safekeeping and Custody • Maximum maturities • Internal control / Performance Standards / Reporting
“The analysis is intended to measure and assess thegovernment’s ability to meet its needs, to negate the needfor any short-term borrowing or liquidation of long-terminvestments before maturity, and to identify any idle funds,and the duration of that idle period, to determine whetherthose funds could be invested over that time frame. Cashflow analysis is therefore an essential tool for informedmanagement decision making.”
19
GFOA Best Practice – “Cash Flow Analysis”
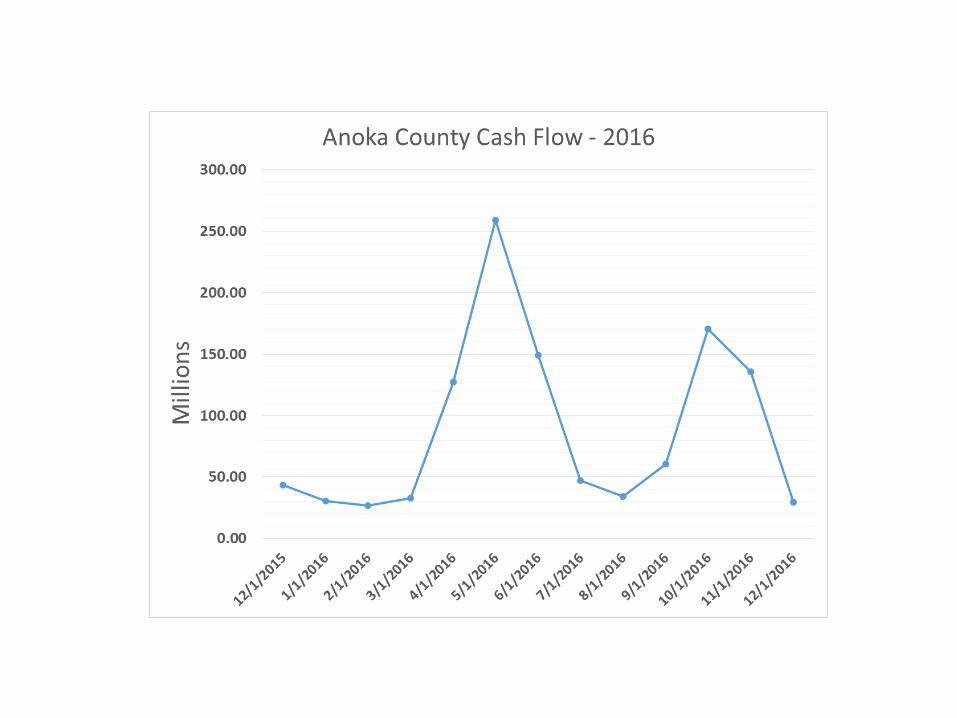
Why a Cash Flow Analysis?
The Cash Equation Managing Liquidity is first priority!!!• Cash Flow Forecasting - a must (keep it up to date)• Develop a Liquidity Formula and follow it
Moving from Intuition to informed Decision Making
The Cash Equation
Understand Your Liquidity• Review your Historical cash balances • Determine your comfort level – manage liquidity spikes• Awareness of projects and their timing• Determine your operating cash needs• Communicate with your departments
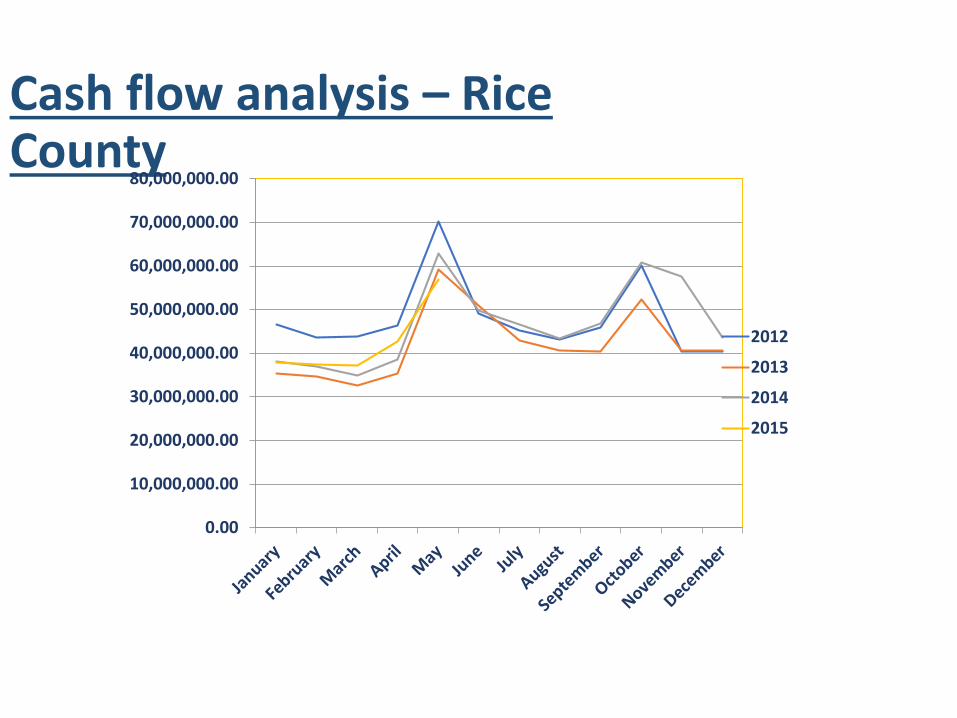
Cash flow analysis – Rice County
0.00
10,000,000.00
20,000,000.00
30,000,000.00
40,000,000.00
50,000,000.00
60,000,000.00
70,000,000.00
80,000,000.00
2012
2013
2014
2015
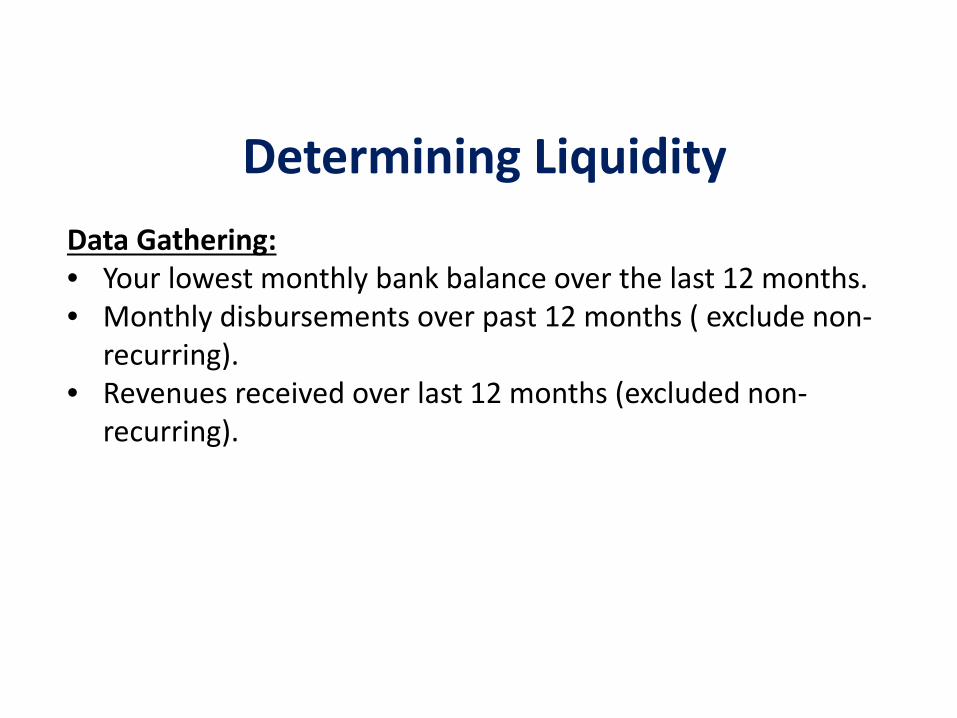
Determining LiquidityData Gathering: • Your lowest monthly bank balance over the last 12 months.• Monthly disbursements over past 12 months ( exclude non-
recurring). • Revenues received over last 12 months (excluded non-
recurring).
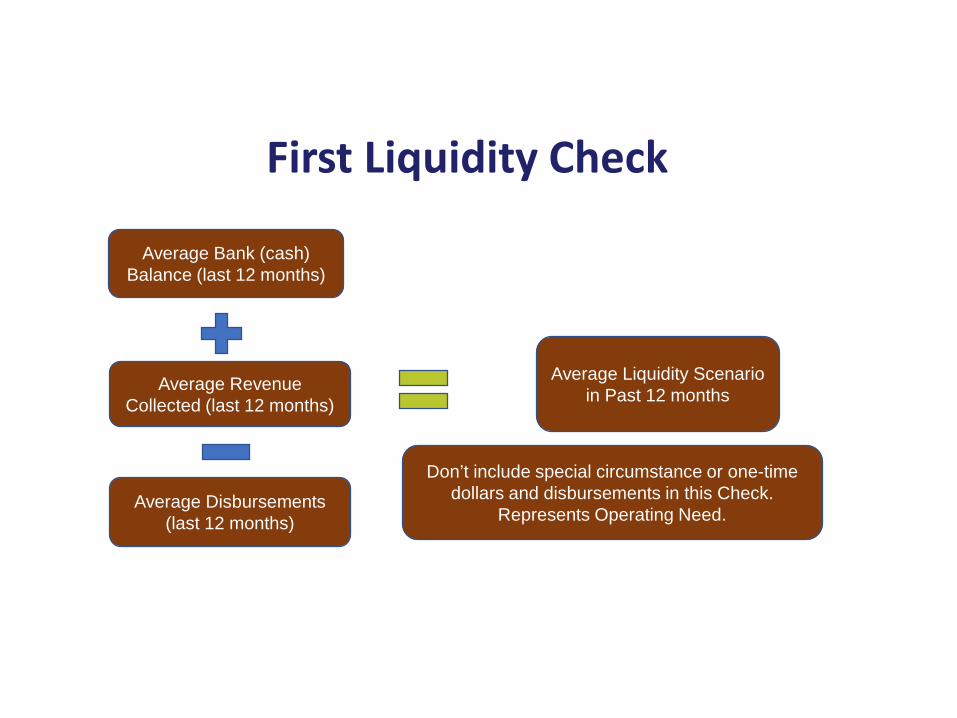
First Liquidity Check
Average Bank (cash) Balance (last 12 months)
Average Revenue Collected (last 12 months)
Average Disbursements (last 12 months)
Average Liquidity Scenario in Past 12 months
Don’t include special circumstance or one-time dollars and disbursements in this Check.
Represents Operating Need.
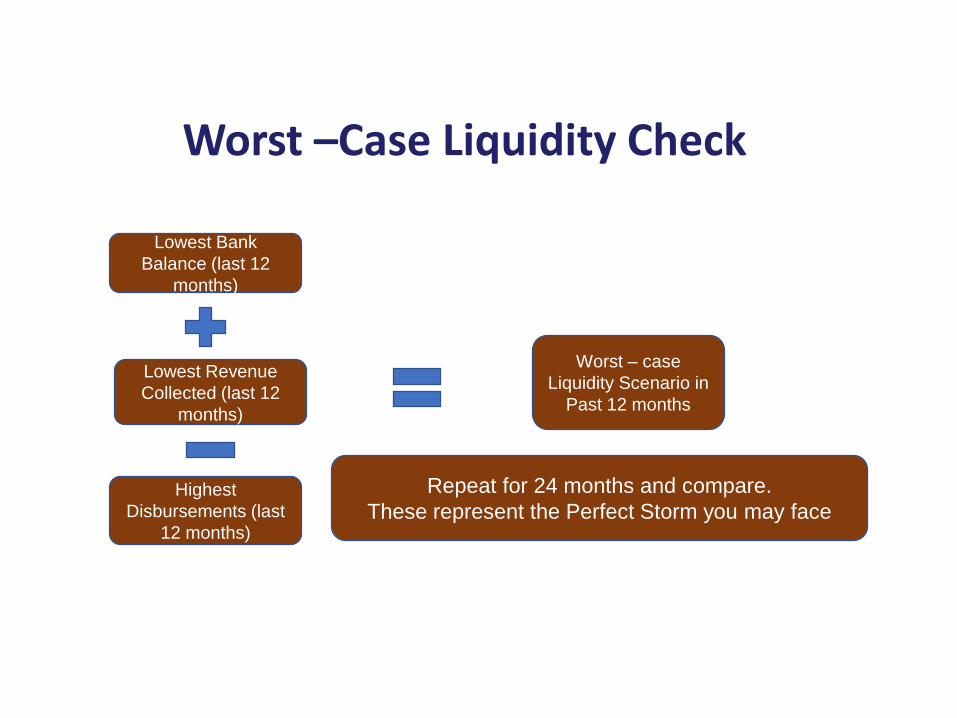
Worst –Case Liquidity Check
Lowest Bank Balance (last 12
months)
Lowest Revenue Collected (last 12
months)
Highest Disbursements (last
12 months)
Worst – case Liquidity Scenario in
Past 12 months
Repeat for 24 months and compare. These represent the Perfect Storm you may face
Slide 27 of 55
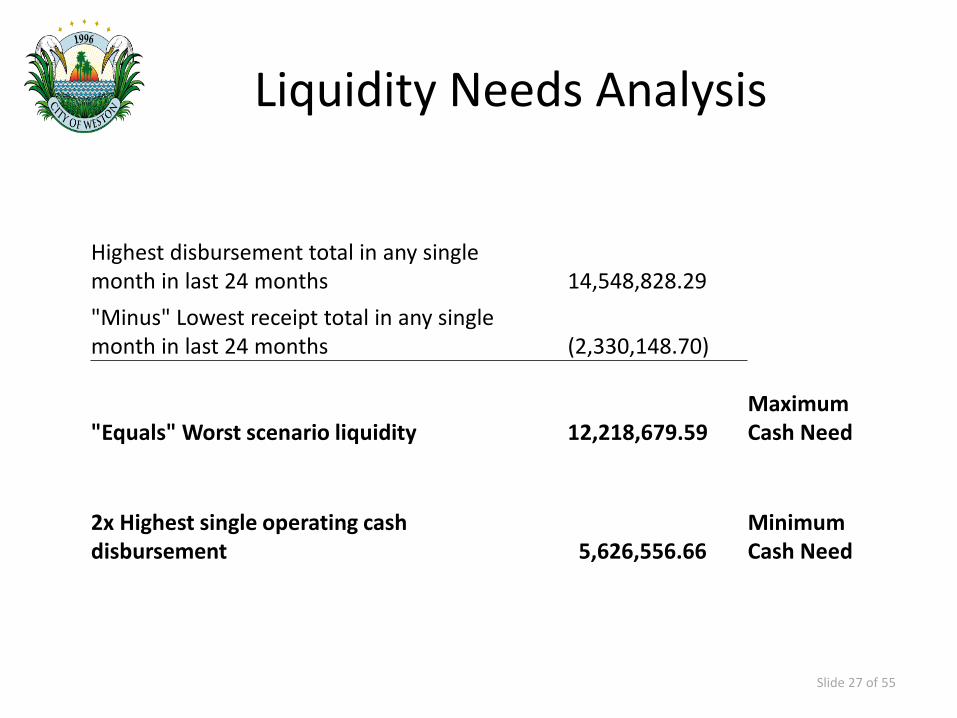
Liquidity Needs Analysis
Highest disbursement total in any single month in last 24 months 14,548,828.29 "Minus" Lowest receipt total in any single month in last 24 months (2,330,148.70)
"Equals" Worst scenario liquidity 12,218,679.59 Maximum Cash Need
2x Highest single operating cash disbursement 5,626,556.66
Minimum Cash Need
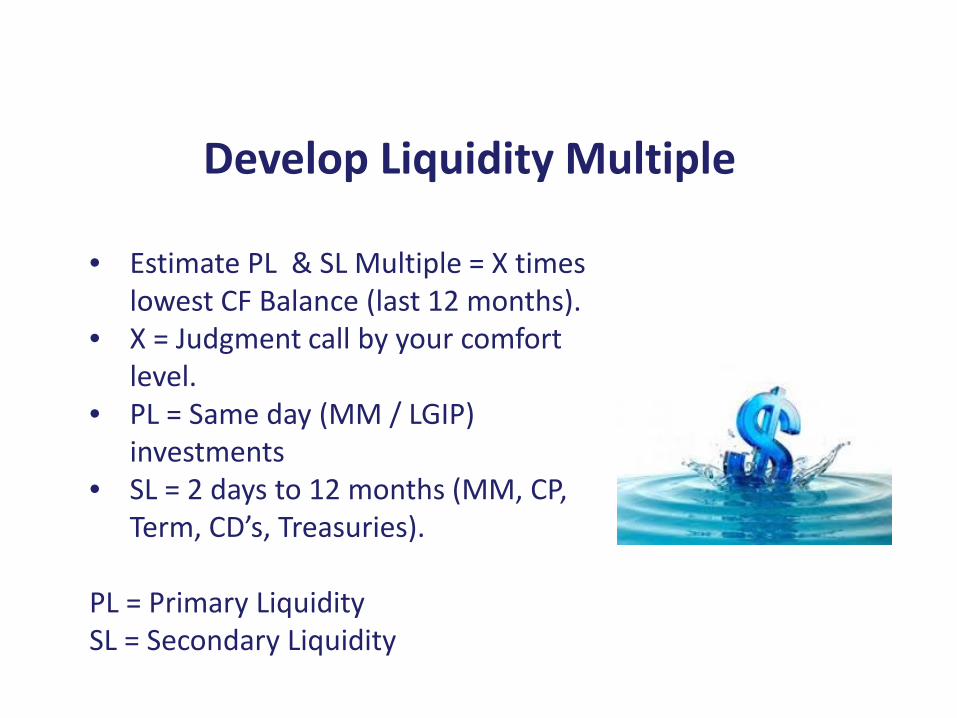
Develop Liquidity Multiple
• Estimate PL & SL Multiple = X times lowest CF Balance (last 12 months).
• X = Judgment call by your comfort level.
• PL = Same day (MM / LGIP) investments
• SL = 2 days to 12 months (MM, CP, Term, CD’s, Treasuries).
PL = Primary Liquidity SL = Secondary Liquidity
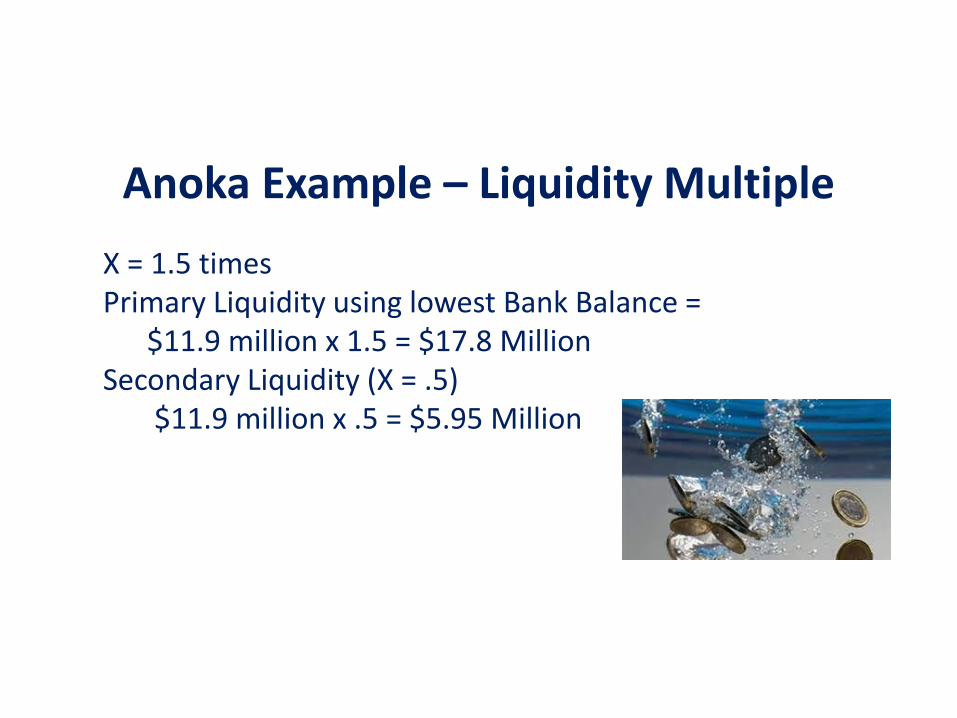
Anoka Example – Liquidity MultipleX = 1.5 times Primary Liquidity using lowest Bank Balance =
$11.9 million x 1.5 = $17.8 Million Secondary Liquidity (X = .5)
$11.9 million x .5 = $5.95 Million
30
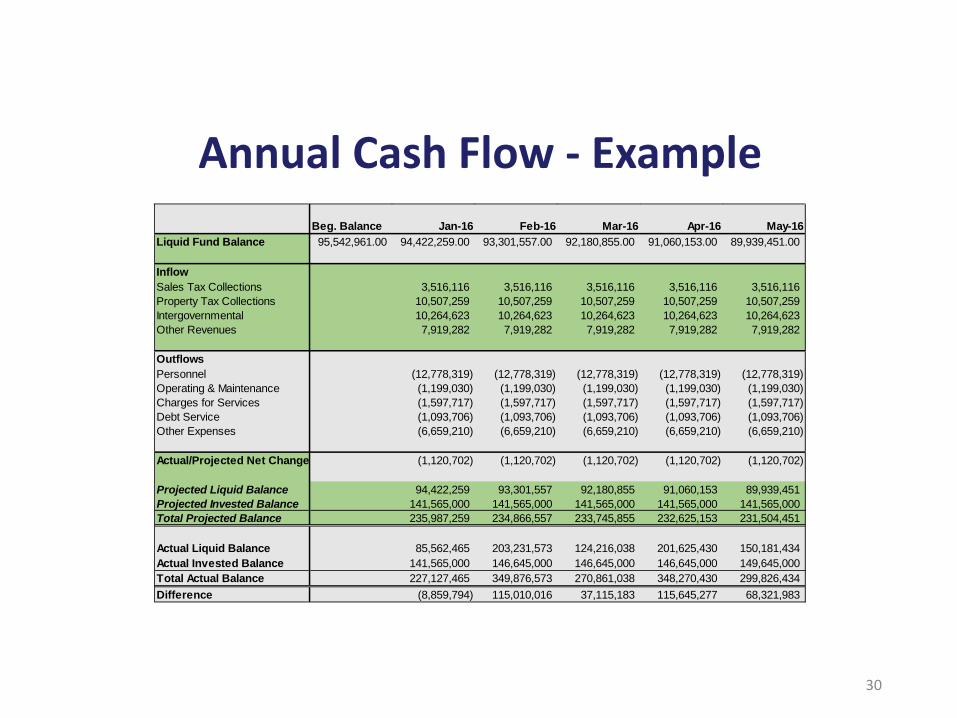
Beg. Balance Jan-16 Feb-16 Mar-16 Apr-16 May-16Liquid Fund Balance 95,542,961.00 94,422,259.00 93,301,557.00 92,180,855.00 91,060,153.00 89,939,451.00
InflowSales Tax Collections 3,516,116 3,516,116 3,516,116 3,516,116 3,516,116 Property Tax Collections 10,507,259 10,507,259 10,507,259 10,507,259 10,507,259 Intergovernmental 10,264,623 10,264,623 10,264,623 10,264,623 10,264,623 Other Revenues 7,919,282 7,919,282 7,919,282 7,919,282 7,919,282
OutflowsPersonnel (12,778,319) (12,778,319) (12,778,319) (12,778,319) (12,778,319) Operating & Maintenance (1,199,030) (1,199,030) (1,199,030) (1,199,030) (1,199,030) Charges for Services (1,597,717) (1,597,717) (1,597,717) (1,597,717) (1,597,717) Debt Service (1,093,706) (1,093,706) (1,093,706) (1,093,706) (1,093,706) Other Expenses (6,659,210) (6,659,210) (6,659,210) (6,659,210) (6,659,210)
Actual/Projected Net Change (1,120,702) (1,120,702) (1,120,702) (1,120,702) (1,120,702)
Projected Liquid Balance 94,422,259 93,301,557 92,180,855 91,060,153 89,939,451 Projected Invested Balance 141,565,000 141,565,000 141,565,000 141,565,000 141,565,000 Total Projected Balance 235,987,259 234,866,557 233,745,855 232,625,153 231,504,451
Actual Liquid Balance 85,562,465 203,231,573 124,216,038 201,625,430 150,181,434 Actual Invested Balance 141,565,000 146,645,000 146,645,000 146,645,000 149,645,000 Total Actual Balance 227,127,465 349,876,573 270,861,038 348,270,430 299,826,434 Difference (8,859,794) 115,010,016 37,115,183 115,645,277 68,321,983
Annual Cash Flow - Example
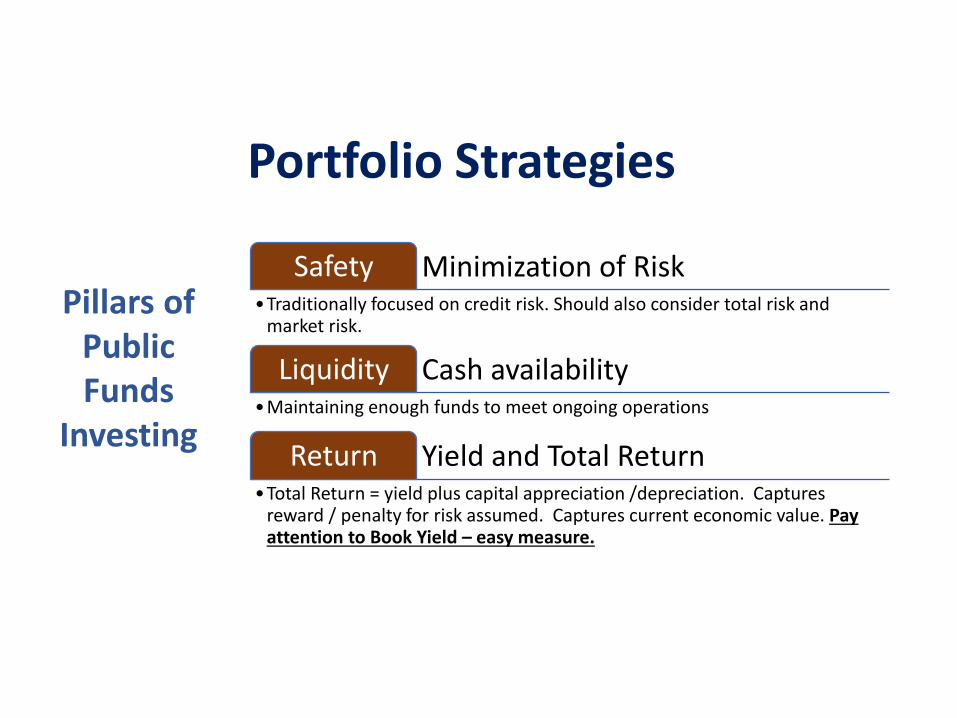
Portfolio Strategies
Pillars of Public Funds
Investing
Minimization of Risk Safety•Traditionally focused on credit risk. Should also consider total risk and
market risk.
Cash availabilityLiquidity•Maintaining enough funds to meet ongoing operations
Yield and Total ReturnReturn•Total Return = yield plus capital appreciation /depreciation. Captures
reward / penalty for risk assumed. Captures current economic value. Pay attention to Book Yield – easy measure.

Define your Portfolios: • Liquidity Portfolio (Current cash need / emergency
reserve) • Operational Portfolio (needed for
day to day operations)• Core Reserves (generally never
needed)
Portfolio Strategies

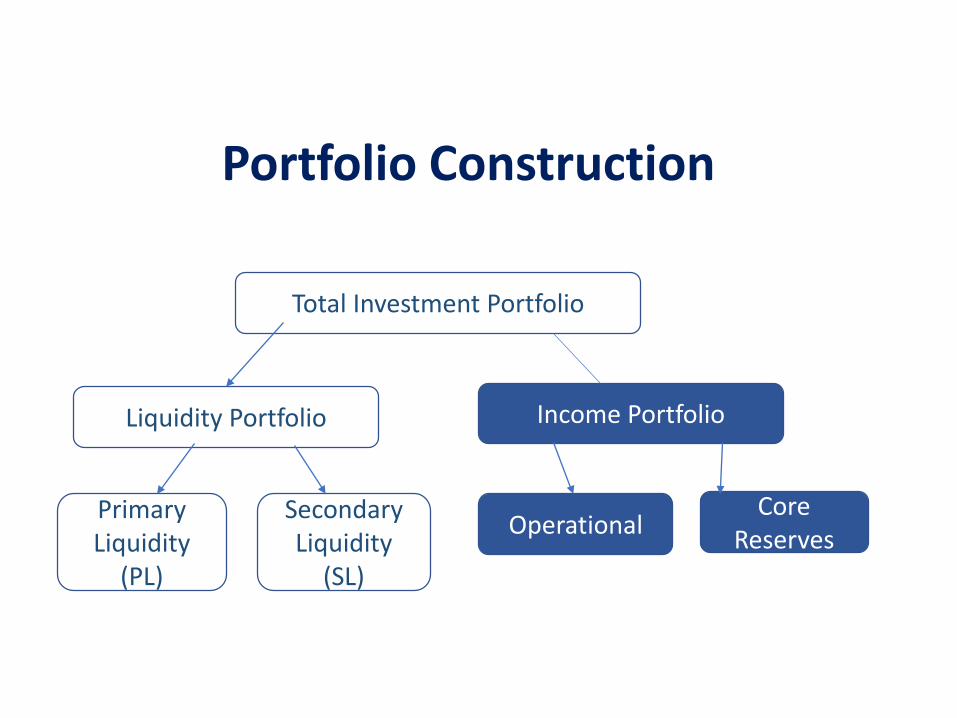
Portfolio Construction
Total Investment Portfolio
Liquidity Portfolio Income Portfolio
Primary Liquidity
(PL)
Secondary Liquidity
(SL)
Operational Reserves
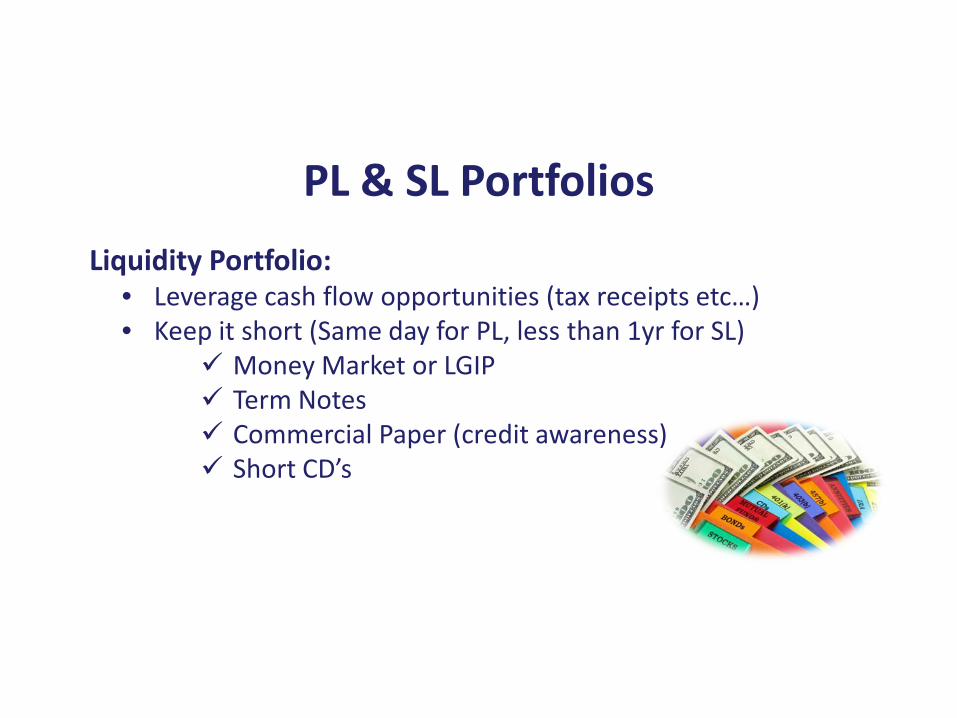
Liquidity Portfolio: • Leverage cash flow opportunities (tax receipts etc…)• Keep it short (Same day for PL, less than 1yr for SL)
Money Market or LGIP Term Notes Commercial Paper (credit awareness) Short CD’s
PL & SL Portfolios
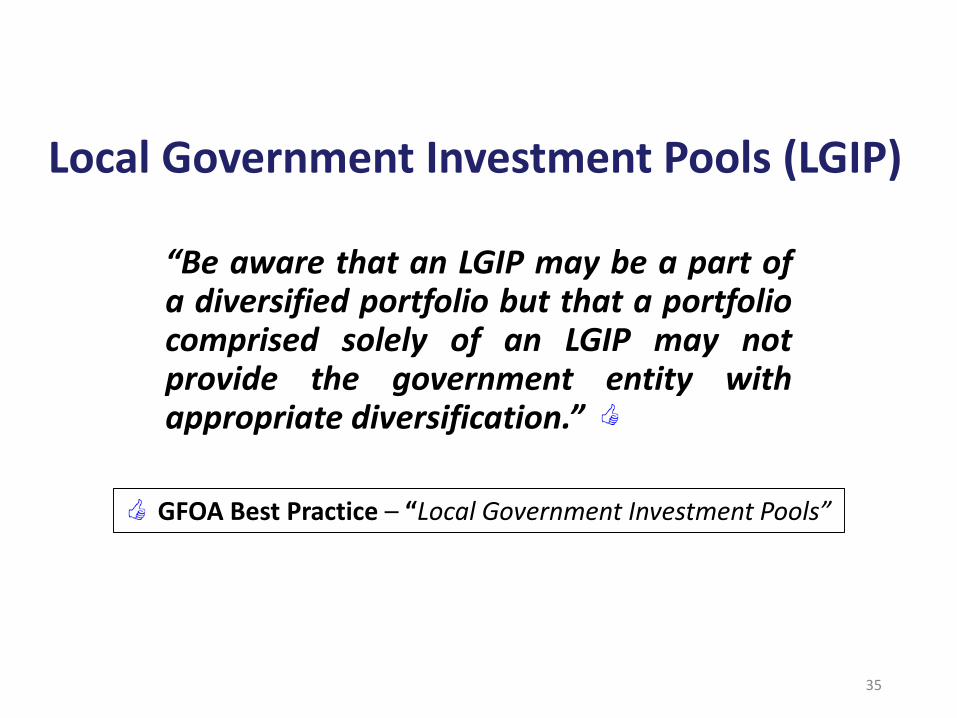
“Be aware that an LGIP may be a part ofa diversified portfolio but that a portfoliocomprised solely of an LGIP may notprovide the government entity withappropriate diversification.”
35
GFOA Best Practice – “Local Government Investment Pools”
Local Government Investment Pools (LGIP)
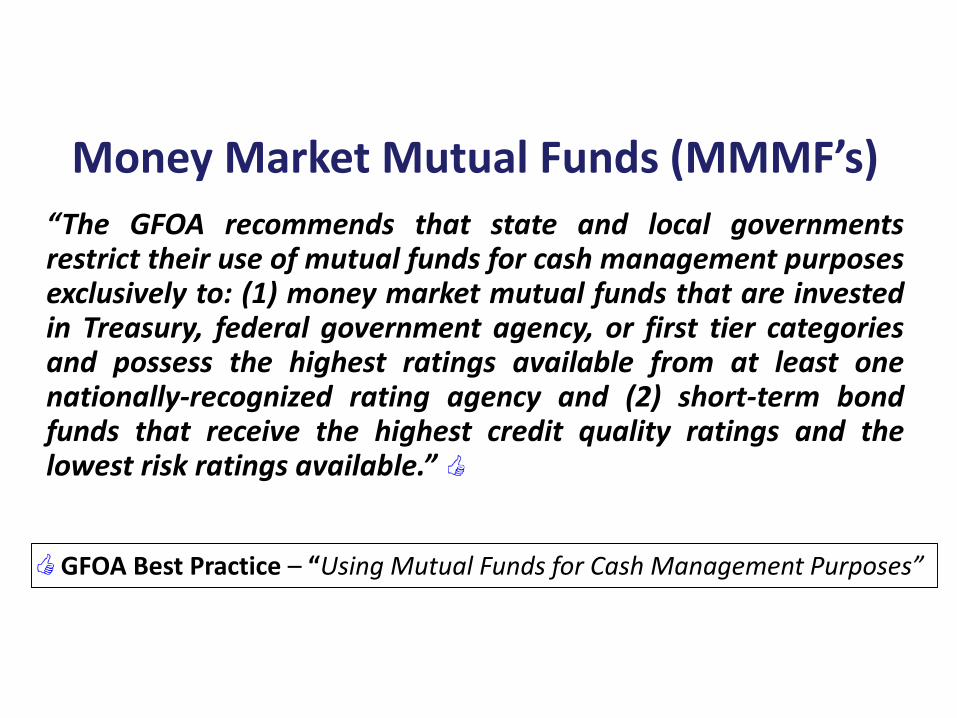
“The GFOA recommends that state and local governmentsrestrict their use of mutual funds for cash management purposesexclusively to: (1) money market mutual funds that are investedin Treasury, federal government agency, or first tier categoriesand possess the highest ratings available from at least onenationally-recognized rating agency and (2) short-term bondfunds that receive the highest credit quality ratings and thelowest risk ratings available.”
GFOA Best Practice – “Using Mutual Funds for Cash Management Purposes”
Money Market Mutual Funds (MMMF’s)
Portfolio Construction
Total Investment Portfolio
Liquidity Portfolio Income Portfolio
Primary Liquidity
(PL)
Secondary Liquidity
(SL)
OperationalCore
Reserves
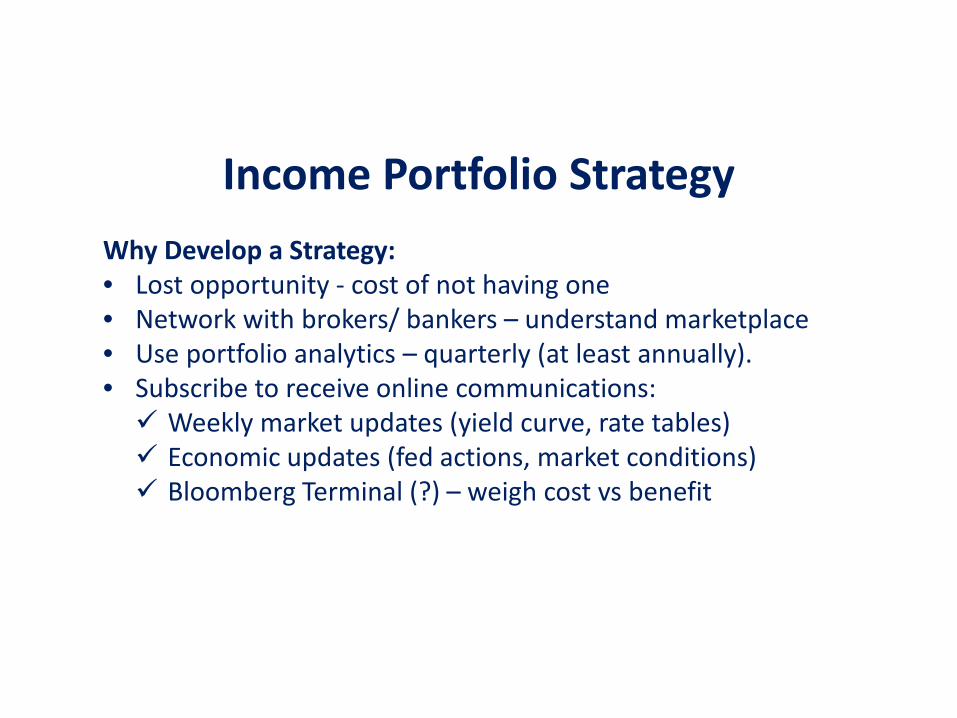
Income Portfolio StrategyWhy Develop a Strategy: • Lost opportunity - cost of not having one• Network with brokers/ bankers – understand marketplace• Use portfolio analytics – quarterly (at least annually). • Subscribe to receive online communications: Weekly market updates (yield curve, rate tables) Economic updates (fed actions, market conditions) Bloomberg Terminal (?) – weigh cost vs benefit
Keep the Following in Mind: • Generally hold to maturity • Determine your risk tolerance • Keep Best Practices in mind (GFOA):
Having an Investment Policy Managing Risk in Investment Portfolios Diversifying the Investment Portfolio Spreading risk (multiple institutions)
Income Portfolio Strategy

Some successful approaches include: • Matching maturities w/ disbursements • Bar Bell Approach (less often)• Ladder • Using External Money Managers
Operational Portfolio Strategies
Operational Portfolio: Multi-year Laddered Strategy• Define time frame (Example years 2-5 duration) • Design maturities around Cash Flow Needs:
Payroll A/P Debt Service Capital Projects
Operational Portfolio Strategies
Operational Portfolio: Barbell strategy• Split Portfolio example 50% short – 3 years and under 50% long – 10 years or more
• Designed to take advantage of rising interest rates• Not for the passive investor - needs your attention
Operational Portfolio Strategies
External Money Managers• Determine type of use (Core vs Operational)• Consider RFP (define scope / amount / benchmark)• Should meet at least twice annually for review• Define reporting (Monthly / Quarterly)• Consider using a Trust Account setup
GFOA Best Practice: Selection and review of Investment Advisorshttp://gfoa.org/selection-and-review-investment-advisors
• Pay Attention to Fed decisions • Familiarize yourself with Yield Curve• Develop an understanding of types of Securities
you may purchase • Understand their performance in this moment • Compare
Portfolio Techniques
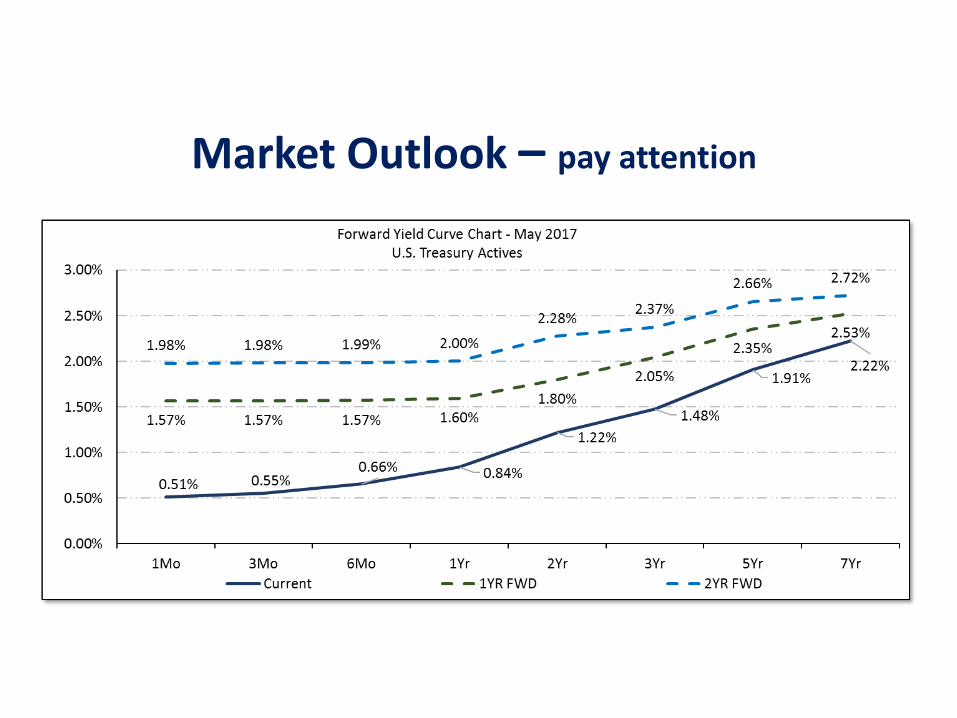
Market Outlook – pay attention
Buying Agencies Securities in syndicate
• Offered at par• Generally provide better yield than market
Secondary market• Price is negotiable• Competitive bids
Buying Brokered Investments
Buying Municipal Bonds – New Issue Get sale date information Research structure/ develop comfort with issue. Compare maturities with your needs (ladder and Yield Curve). Consider placing bid with multiple brokers (only if competitive
deal).
Buying Brokered Investments

Buying Municipal Bonds – Secondary Market Research structure/ develop comfort with issue. Compare maturities with your needs (ladder and Yield Curve). Compare yields to agencies around maturity date. Competitive not realistic (limited pool ).
Buying Brokered Investments
Bullets provide certainty (less volatile) Callable’s have a place: Use sparingly – generally yield grab. Stick to one-time callable’s Avoid continuous calls – creates more uncertainty.
Agencies: Bullets vs Callable’s

Two Ways to BuyThrough BrokerNegotiable Mark to Market required at YEDirect CDARS E-Connect DirectLGIP’s (Magic Fund / 4M Fund)Local Bank Not subject to Mark to Market Collateral needed above $250K w/ any bank
Buying Certificates of Deposit
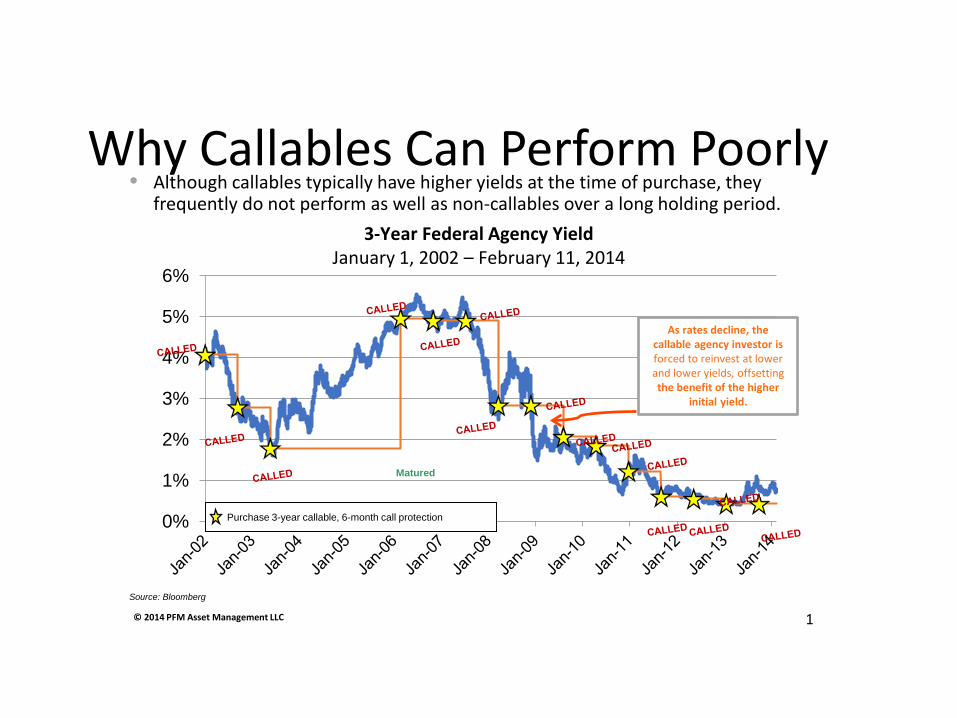
Why Callables Can Perform Poorly• Although callables typically have higher yields at the time of purchase, they
frequently do not perform as well as non-callables over a long holding period.3-Year Federal Agency Yield
January 1, 2002 – February 11, 2014
0%
1%
2%
3%
4%
5%
6%
Purchase 3-year callable, 6-month call protection
Matured
Source: Bloomberg
© 2014 PFM Asset Management LLC 1
As rates decline, the callable agency investor is forced to reinvest at lower and lower yields, offsetting the benefit of the higher
initial yield.
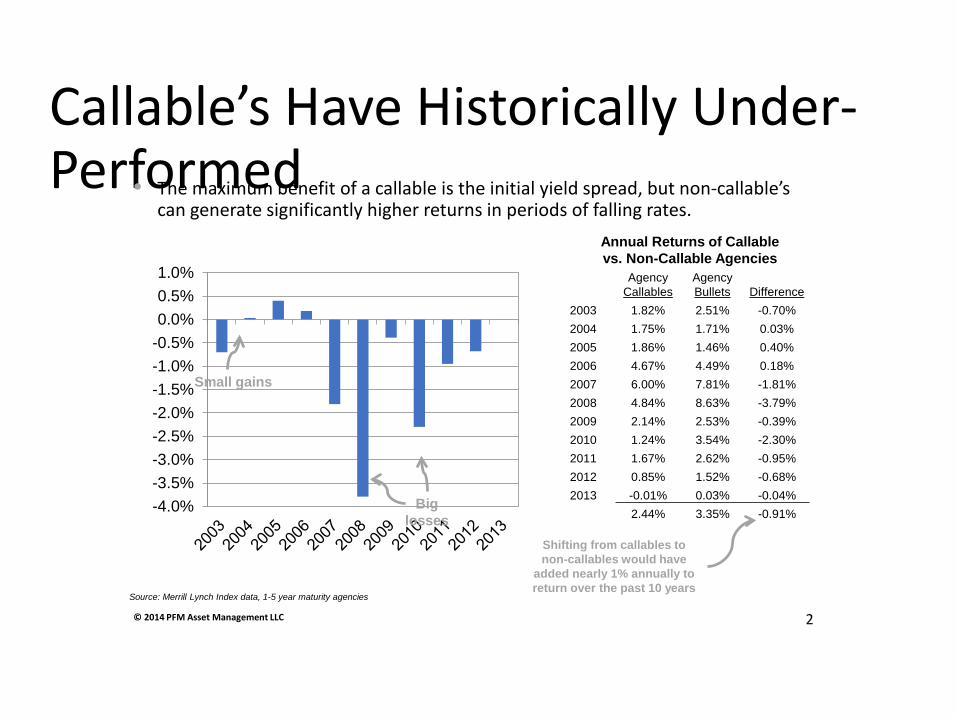
Callable’s Have Historically Under-Performed• The maximum benefit of a callable is the initial yield spread, but non-callable’s
can generate significantly higher returns in periods of falling rates.
AgencyCallables
AgencyBullets Difference
2003 1.82% 2.51% -0.70%2004 1.75% 1.71% 0.03%2005 1.86% 1.46% 0.40%2006 4.67% 4.49% 0.18%2007 6.00% 7.81% -1.81%2008 4.84% 8.63% -3.79%2009 2.14% 2.53% -0.39%2010 1.24% 3.54% -2.30%2011 1.67% 2.62% -0.95%2012 0.85% 1.52% -0.68%2013 -0.01% 0.03% -0.04%
2.44% 3.35% -0.91%
Shifting from callables to non-callables would have
added nearly 1% annually to return over the past 10 years
Annual Returns of Callable vs. Non-Callable Agencies
-4.0%-3.5%-3.0%-2.5%-2.0%-1.5%-1.0%-0.5%0.0%0.5%1.0%
Small gains
Big losses
Source: Merrill Lynch Index data, 1-5 year maturity agencies
© 2014 PFM Asset Management LLC 2

Swap’s - selling a security and then purchasing another security to take it’s place.
• Usually done at same time• Generates a better overall yield during the term• Yield Curve Trade Example:
Security Swap’s
Security Swap - Yield Curve Trade
• 250,000 negotiable CD 2% five Years 6-30-12.• If the take out yield is 1%, the gain is ~ $5,000 (2%-1% X 2
years X 250,000).• You can buy another cd to replace this at 2% for five years.• Your holding period gain is 2.67% for that 3 year period
Security Swap
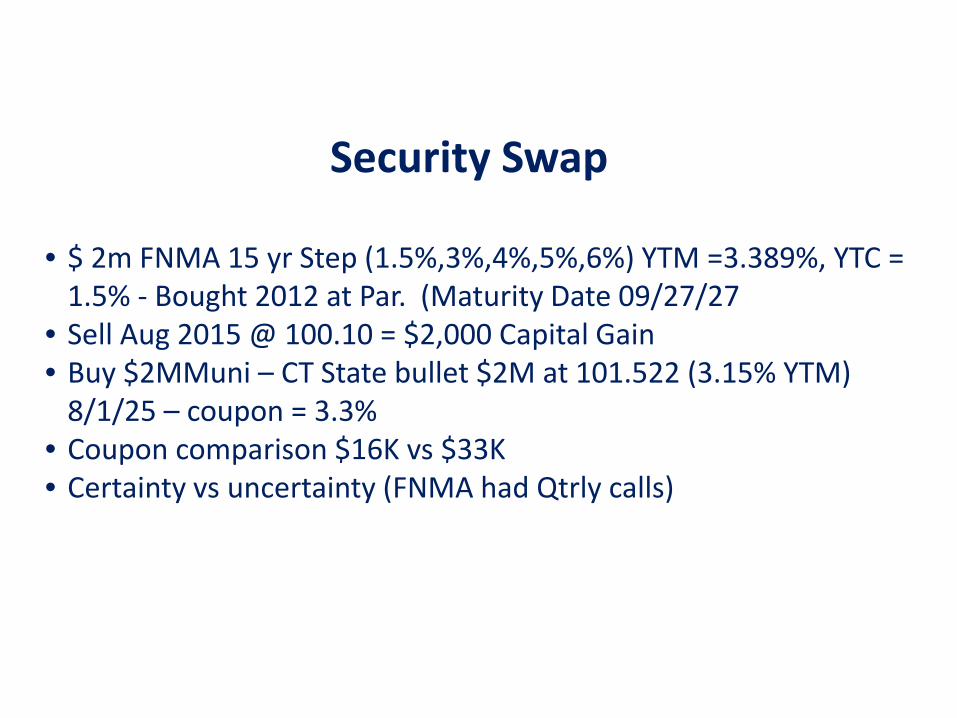
• $ 2m FNMA 15 yr Step (1.5%,3%,4%,5%,6%) YTM =3.389%, YTC = 1.5% - Bought 2012 at Par. (Maturity Date 09/27/27
• Sell Aug 2015 @ 100.10 = $2,000 Capital Gain • Buy $2MMuni – CT State bullet $2M at 101.522 (3.15% YTM)
8/1/25 – coupon = 3.3%• Coupon comparison $16K vs $33K• Certainty vs uncertainty (FNMA had Qtrly calls)
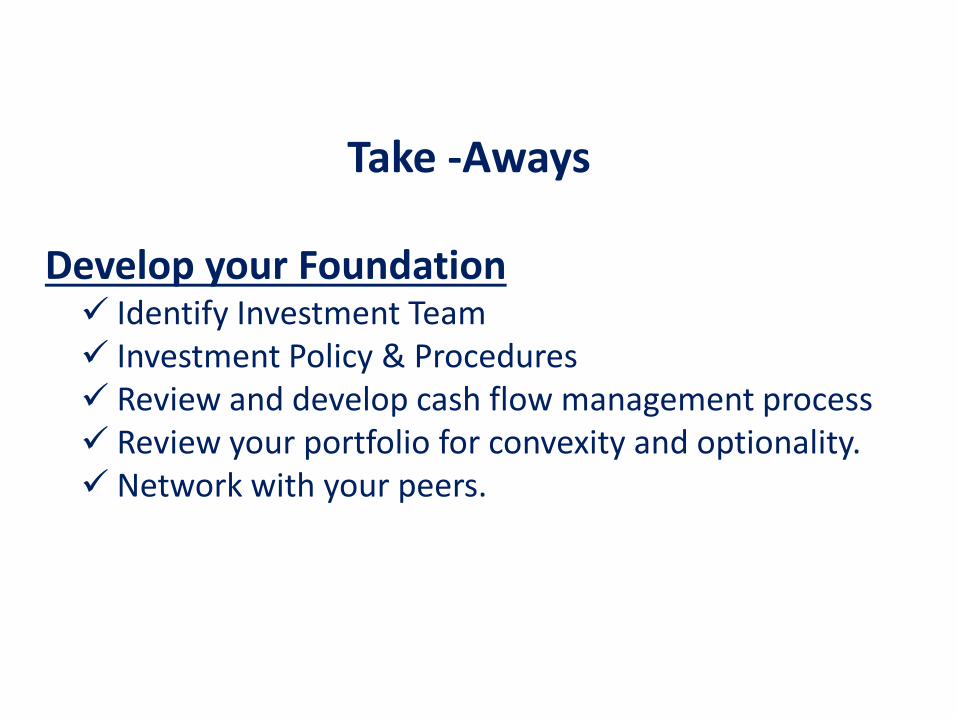
Take -Aways
Develop your Foundation Identify Investment Team Investment Policy & Procedures Review and develop cash flow management process Review your portfolio for convexity and optionality. Network with your peers.