
Investigating Discrete Event Simulation Method to Assess the Effectiveness of Wearable Health...
19
Procedia Economics and Finance 11 (2014) 838 – 856 2212-5671 © 2014 Elsevier B.V. This is an open access article under the CC BY-NC-ND license (http://creativecommons.org/licenses/by-nc-nd/3.0/). Selection and/or peer-review under responsibility of Symbiosis Institute of Management Studies. doi:10.1016/S2212-5671(14)00248-2 ScienceDirect Symbiosis Institute of Management Studies Annual Research Conference (SIMSARC13) Investigating Discrete Event Simulation Method to Assess the Effectiveness of Wearable Health Monitoring Devices Srinivasan Radhakrishnan a *, Arjun Duvvuru b , Sagar V. Kamarthi c a Academic Research Associate, Symbiosis Institute of Management Studies, Symbiosis International University, Pune b Quality Engineer at JDA Software Private Limited c Department of Mechanical and Industrial Engineering, Northeastern University, Boston, USA Abstract The current primary care units of the US healthcare system are strained by supply-demand deficiency. Last 12 years have seen a decline in number of US medical students opting for primary care after their medical education. Research studies have recommended solutions targeting, primary care payment reform, investment in primary care infrastructure and organization, and attracting more US medical students to primary care. Such reforms demand expensive implementation plans and might take years to yield benefits. Meanwhile, the generation of baby boomers and the healthcare reform under current US administration (insuring additional 33-43 million patients) may stress out the primary care providers in near future. In this paper, we investigate the usefulness of wearable health monitoring devices, to alleviate primary care patient load. To conduct our study, we adopted the discrete event simulation method to simulate the proposed model and analyze the behaviour of the same in terms of performance measures. We simulated three scenarios with different vital sign measurement time and physician consultation time. In addition we varied the percentage of patient population adopting the wearable device health monitoring (WHMS) program. In all the three scenarios, the WHMS system yielded beneficial results in absorbing more patients and reducing patient denials than the current primary care system irrespective of adoption percentages. However the average patient wait times were sensitive to the adoption percentages. On the whole the simulation results indicated that wearable health monitoring devices could act as a potential solution in reducing the patient load across the primary care system. * Corresponding author. Tel.: +0-000-000-0000 ; fax: +0-000-000-0000 . E-mail address: [email protected] © 2014 Elsevier B.V. This is an open access article under the CC BY-NC-ND license (http://creativecommons.org/licenses/by-nc-nd/3.0/). Selection and/or peer-review under responsibility of Symbiosis Institute of Management Studies. Available online at www.sciencedirect.com
Transcript of Investigating Discrete Event Simulation Method to Assess the Effectiveness of Wearable Health...

Procedia Economics and Finance 11 ( 2014 ) 838 – 856
2212-5671 © 2014 Elsevier B.V. This is an open access article under the CC BY-NC-ND license (http://creativecommons.org/licenses/by-nc-nd/3.0/).Selection and/or peer-review under responsibility of Symbiosis Institute of Management Studies.doi: 10.1016/S2212-5671(14)00248-2
ScienceDirect
Symbiosis Institute of Management Studies Annual Research Conference (SIMSARC13)
Investigating Discrete Event Simulation Method to Assess the Effectiveness of Wearable Health Monitoring Devices
Srinivasan Radhakrishnana*, Arjun Duvvurub, Sagar V. Kamarthic aAcademic Research Associate, Symbiosis Institute of Management Studies, Symbiosis International University, Pune
bQuality Engineer at JDA Software Private Limited
cDepartment of Mechanical and Industrial Engineering, Northeastern University, Boston, USA
Abstract
The current primary care units of the US healthcare system are strained by supply-demand deficiency. Last 12 years have seen a
decline in number of US medical students opting for primary care after their medical education. Research studies have
recommended solutions targeting, primary care payment reform, investment in primary care infrastructure and organization, and
attracting more US medical students to primary care. Such reforms demand expensive implementation plans and might take years
to yield benefits. Meanwhile, the generation of baby boomers and the healthcare reform under current US administration
(insuring additional 33-43 million patients) may stress out the primary care providers in near future. In this paper, we investigate
the usefulness of wearable health monitoring devices, to alleviate primary care patient load. To conduct our study, we adopted
the discrete event simulation method to simulate the proposed model and analyze the behaviour of the same in terms of
performance measures. We simulated three scenarios with different vital sign measurement time and physician consultation time.
In addition we varied the percentage of patient population adopting the wearable device health monitoring (WHMS) program. In
all the three scenarios, the WHMS system yielded beneficial results in absorbing more patients and reducing patient denials than
the current primary care system irrespective of adoption percentages. However the average patient wait times were sensitive to
the adoption percentages. On the whole the simulation results indicated that wearable health monitoring devices could act as a
potential solution in reducing the patient load across the primary care system.
© 2013 The Authors. Published by Elsevier B.V.
* Corresponding author. Tel.: +0-000-000-0000 ; fax: +0-000-000-0000 . E-mail address: [email protected]
© 2014 Elsevier B.V. This is an open access article under the CC BY-NC-ND license (http://creativecommons.org/licenses/by-nc-nd/3.0/).Selection and/or peer-review under responsibility of Symbiosis Institute of Management Studies.
Available online at www.sciencedirect.com

839 Srinivasan Radhakrishnan et al. / Procedia Economics and Finance 11 ( 2014 ) 838 – 856
Keywords: operations research, discrete event simulation, primary health care, wearable devices
1. Overview
The current US primary care is facing issues on three fronts: (1) decrease in number of primary care physicians, (2)
uneven distribution of primary care practitioners, and (3) difficulty in accessing primary care. In addition, the
generation of baby boomers and the healthcare reform under current US administration (insuring additional 33-43
million patients) might stress out the primary care providers in the near future. The failure to address the above
mentioned issues might cripple and render a primary care system incapable of absorbing excessive patient load.
Apart from the excessive patient load in primary care settings, there is the problem of communication across
different care units. Poor communication eventually leads to poor patient satisfaction and unnecessary expenditure.
Inefficient communication between primary care physicians and specialist, primary care physicians and ED,
physicians and source of diagnostic data, and hospital-based physicians and primary care physicians is elevating the
problems in addition to uneven load distribution.
The objective of this paper is to assess the effectiveness of wearable health monitoring devices in reducing the
primary care patient load and improve the communication across various healthcare units. The discrete event
simulation (DEs) method forms the backbone of this study, helping us achieve the objective. We initiate the paper
by highlighting the current problems faced by the US primary care setting. In the subsequent steps we propose the
wearable health monitoring system (WHMS)model for the primary care followed by a careful selection of target
patients and performance measures for the discrete event simulation. In the simulation we create the patient flow
sequence and study the behavior of both the current primary care system and the proposed WHMS primary care
model in terms of performance measures. The final part of the paper deals with the simulation results, discussion
and the future scope of the work.
In the following sections we will start with the discussion of the current primary care problems, identify the
requirements for the solution space, and introduce the proposed WHMS primary care model.
2. Background
In the US, the primary care responsibilities are distributed over several categories of practitioners: family
physicians, general internists, geriatricians, general paediatricians, nurse practitioners, and physician assistants [1].
These individuals are grouped under a class termed, primary care practitioners. Nurses, pharmacists, health
educators, medical assistants, and other health workers form an additive layer to the primary care practitioner base
[1]. The primary care clinics are usually located in the outpatient division of teaching hospitals (urban areas) and the
community health centers [1]. Community health centers are public or non-profit organizations that serve low-

840 Srinivasan Radhakrishnan et al. / Procedia Economics and Finance 11 ( 2014 ) 838 – 856
income and minority populations [1]. In this section we will take a look at the current US primary care, which is
facing issues on three fronts: (1) decrease in number of primary care physicians, (2) uneven distribution of primary
care practitioners, and (3) difficulty in accessing primary care.
3. Declining Primary Care Physicians
The mid-1990s saw a rise in health maintenance organizations (HMOs) who based their care structure on the
primary care as the initial entry point for patients entering the healthcare system [1]. The 90’s experienced an
increase in primary care physicians from 67 to 90 for every 100,000 people and the percentage of graduating US
medical students pursing primary care careers grew from 15% in 1992 to 40% in 1997 [1, 2]. The widening income
disparity between primary care physicians and specialists, coupled with increasing clinical workload led to the
decline in number of US medical students opting for primary care careers [1, 3]. In 2005, approximately 300,000
physicians, and another 100,000 nurse practitioners (NP) and physician assistants (PA) provided medical care in the
US [1]. Although these figures may seem impressive, they do little to solve the primary care crisis especially when
one considers the current and the future state of the primary care. Population growth and aging population are
estimated to increase the workload of adult primary care practitioners by 29% from 2005 to 2025, and the number of
adult primary care practitioners is estimated to grow by only 2%–7% [1]. The estimated shortage of adult primary
care practitioners is projected to be in the range 35,000 - 44,000 [1]. Including nurse practitioners and physician
assistants, the ratio of primary care practitioners to population is estimated to decline by 9% from 2005 to 2020 [1].
Therefore it is important to create new strategies to ensure availability of adequate primary care practitioners in
order to address the existing and the future primary care patient demands.
Uneven distribution of primary care practitioners: The uneven distribution of the primary care physicians (100
PCPs: 100,000 urban population and 46 PCPs: 100,000 rural population) means that 21% of the US rural population
is serviced by 10% of primary care physicians [1]. The areas where population to PCP ratio exceeds 2000:1 are
designated as primary care health professional shortage area by federal Health Resources and Services
Administration (HRSA) [1]. As of 2009, 65 million people live in these shortage areas. In short, the primary care
part of the healthcare system is facing issues regarding declining PCPs, uneven distribution of PCPs and
inaccessibility. We have outlined the existing problems faced by the primary care, but that alone is not sufficient to
solve their problems. In addition to the above mentioned problems, we must understand the stress involved in other
components of the healthcare system. The following section looks into the uneven distribution of the patient load
across the healthcare system and how they create additional problems for the primary care.
4. Need for a Patient Load Sharing System
The complexity of the current US healthcare system inhibits the ability to design an entire new system. The most
feasible solutions are those that can be injected into the current healthcare system in order to boost its efficiency,

841 Srinivasan Radhakrishnan et al. / Procedia Economics and Finance 11 ( 2014 ) 838 – 856
efficacy, and quality. The wearable health monitoring devices offer a promise solution. In this research we plan to
investigate a framework with wearable health monitoring devices and their diffusion into current healthcare system.
The primary objective of our work is to discover the benefits of wearable devices, if any, to understand the primary
care system using simulation models. Before proceeding further we need to understand the patient flow through the
existing healthcare system. Theoretically, the primary care is the initial entry point for a patient in the health care
system except in case of emergencies. The primary care providers perform preliminary health checkup, short term
treatment, and establish a patient medical record. For above mentioned functions a hospital admission is not
necessary and the care is delivered on an outpatient basis (termed as Ambulatory Care). In case of complex
abnormalities the patients are referred to a specialist by the primary care physician (PCP). Thus the PCP’s form the
link between the patients and the specialists.
5. Patient Load Problem
Although the largest proportion of ambulatory care services occurs in physician offices, approximately 11% of all
ambulatory medical care visits in the US occur in the emergency department (ED). From 1996 through 2006 the
number of ED visits increased by 32% (from 90.3 million to 119.2 million) and the number of hospital ED
decreased from 4019 to 3833[4]. Other studies acknowledged the cause of excessive ED load and long primary care
patient wait time [5], to patient groups such as low income groups who were offered health care via ED [6] and
Medicare beneficiaries who couldn’t access the primary care [7]. Thus the US healthcare ED which forms one of the
important components of healthcare system is overburdened due to a significant gap between the supply and
demand. Moreover, recent studies have indicated that the number of visits to specialists exceeded the number of
visits to PCPs, particularly among the elderly, highlighting the fact that the trend of excessive load is creeping into
specialty care also [8]. The stressed up ED and specialty care providers initiates the concept of load distribution,
especially redirecting the unnecessary visits to the primary care hospitals. This concept of redirecting patients is
rightly brought out by Yaneer Bar-Yam [9], who proposed the separation of simple care (vaccination, health
screening, and healthy-habits counselling) from that of the complex care. He also highlighted the fact that the
existing system is inefficient to handle large volume of preventive care; he suggested that the doctors must
concentrate on what they are good at-complex care [9]. This calls for additional responsibilities from the primary
care sector, but the redistribution of the load over primary care providers is easier said than done. As discussed in
the earlier section, the primary care has its own share of problems. The generation of baby boomers and the
healthcare reform under current US administration (insuring additional 33 million patients) will stress out the
primary care providers in near future. Bodenheimer, et al. [10] suggested remedies to avert the declining size of the
PCP’s: concentrate on primary care payment reform, invest in primary care infrastructure and organization, and
attract more US medical students to primary care. It may take years to arrive at agreeable changes to the primary
care, implement the reforms, and to determine the outcome of the reforms, but we need a solution to address the
existing primary care patient load at the current ling.

842 Srinivasan Radhakrishnan et al. / Procedia Economics and Finance 11 ( 2014 ) 838 – 856
6. Communication Problems in Care Settings
Apart from excessive patient load in primary care settings, there is the problem of communication across different
care units. Poor communication eventually leads to poor patient satisfaction and unnecessary expenditure.
Inefficient communication between primary care physicians and specialist, primary care physicians and ED,
physicians and source of diagnostic data, and hospital-based physicians and primary care physicians is elevating the
problems in addition to uneven load distribution. Thomas Bodenheimer [11], reported that the communication
problems stems from lack of interoperable computerized records and lack of integrated systems of care. His studies
also highlighted the dysfunctional communication system between providers, patients and their families. The
solution space for tackling the above mentioned issues must contain a patient load sharing mechanism backed up by
strong information support system.
Solution Space: Our proposed model (see Figure 1) addresses the load sharing issue by incorporating wearable
devices for health monitoring to existing primary care setting. This will enable the patients to use wearable devices
at home and communicate the quantitative vital signs data (heart beat, blood pressure, respiration, etc.) and
qualitative data (sleeplessness, skin discoloration, etc.) via internet to a data analysis center which in turn will send
the results to the primary care provider. The data analysis center is responsible for interpreting, analyzing and
visualizing the medical data; it is also responsible for detecting incidences and abnormalities, creating health reports,
and publishing and updating health records which are compatible across all platforms. The presence of Common
Medical Records (CMR) will help us address the communication problems that exist across various components of
the healthcare system. The proposed model ensures participation of primary care physicians, NPs and MAs who
have the sole authority to take individual case-based decisions. By taking care of the low priority tasks, the data
analysis center eliminates the time wasted by primary care physicians on low priority tasks and thereby enables the
providers to absorb more patients. More importantly it advocates and enables the concept of home-monitoring and
preventive care which is regarded by many as one of the important area of focus for improving healthcare.
7. Shifting the Health Monitoring base to Home
The proposed model indicates a partial health monitoring responsibility shift towards patients (in-home). This raises
several important questions regarding home monitoring, especially concerning, data reliability, incidence detection,
patient adherence, and patient satisfaction. In this section we will try to outline several research works conducted
previously to address the above mentioned issues.
The medical devices in case of telemonitoring generate streams of data. Several studies have revealed good accuracy
and reliability of the reported medical data with minimal data transfer problems and errors, in case of chronic illness
[12-20]. Other studies have revealed the close agreement of the data collected from home monitoring using wearable
devices with that of laboratory results [21, 22]. Such studies boost the confidence on the wearable health monitoring

843 Srinivasan Radhakrishnan et al. / Procedia Economics and Finance 11 ( 2014 ) 838 – 856
Figure1: Existing primary care system vs. proposed primary care system
devices which forms a crucial component of our proposed model. The ability of telemonitoring to identify early
changes in health conditions related to patients suffering from pulmonary abnormalities [23 - 26], and diabetes [27-
30] have increased the confidence on the efficacy of telemonitoring. However, the relation between early detection
and its effects on reducing the number of complications is not firmly established [12, 31], and only future research
will helps us understand this relation much better. Additionally, several studies on pulmonary conditions and
diabetes have demonstrated high patient acceptance and satisfaction with various telemonitoring systems and
procedures [12] and high compliance with telemonitoring programs were observed in case of cardiac and
hypertensive patients [32, 33]. On other hand, there were several instances that reflected decrease in patient
adherence with respect to time [34, 35]. Though the patient satisfaction and adherence to telemonitoring procedures
are polarized, we must consider the positive effects and try to implement novel systems directly involve of patients
in the care process. Ryan, et al. [36] and Piette, et al. [37] report that the direct involvement of patients empower

844 Srinivasan Radhakrishnan et al. / Procedia Economics and Finance 11 ( 2014 ) 838 – 856
them with knowledge and awareness regarding their medical condition; we argue that telemonitoring helps patients
achieve the same. Studies have shown that the benefits of the telemonitoring are not limited to the patients;
telemonitoring could also significantly decrease in-hospital admissions, emergency department visits, and hospital
length of stay in case of patients suffering from cardiac and pulmonary abnormalities [38, 39]. This is an
encouragement for researchers to further study systems involving home monitoring and analyze their effects on
patients who take part in the system and also on the healthcare providers overall. To sum up all, the proposed model
incorporates wearable device technology and information system to address the challenges of patient load and care
setting communication that exists in current primary care system, achieving true integration of in-home monitoring,
customized care and smart healthcare system. Currently the wearable device studies are widely implemented as
hospital programs to ease the burden on the emergency department. The success or failure of such programs can be
observed only after their implementation, making it a risky approach. The use of simulation method to assess the
effectiveness of the wearable devices is a unique approach. This approach will enable the hospitals to design and
simulate various wearable device related programs for both inpatient and outpatient setting and obtain results
without implementation, thereby saving time and costs. In this paper we limit our scope to primary care unit and use
simulation method to assess the effectiveness of the wearable device in reducing patient load. In the following
sections we will discuss the classification of wearable devices, basic wearable device architecture and explain the
simulation method, simulation results followed by discussion and future work.
8. Classification of Wearable Devices
Raskovic, et al.[40] formed two groups to introduce the taxonomy of personal health monitoring devices: usage, and
implementation. The usage group was further classified according to the wearability of the devices
aswornorimplanted. Recording, processing, correcting and replacing or combination of these capabilities form the
core objectives for both worn and implanted sensors[40].Devices that send or store relevant signals and data from
the patient, but do not evaluate the signals to provide feedbacks to the patient are termed recording devices[40].The
recording devices cannot be classified as wearable computational devices due to their limited computational
capabilities[40]. Processing devices are those devices that process relevant information and provide immediate or
conscious feedback to the patients regarding their health condition[40]. Processing devices may or may not provide
continuous feedback. For example ECG device provides alert only if there is any irregular cardiac events[40].
Correcting devices act on malfunctioning organs in order to enhance organ functioning (eg. hearing aid) and in
contrast replacing devices substitute for failed organs (eg. artificial heart)[40]. Wearable devices falling under the
category of worn are used external to the body either embedded in clothes or attached as accessory[40]. Implanted
devices are usually surgically inserted inside the body or consumed orally (eg.Endoscopy capsule)[40].
Raskovic, et al. [40]represented the taxonomy of implementation with two axis. One axis dealt with patient mobility
while the other axis represented gateway ability. The patient mobility can be static or moving and the gateway
ability can be local or global[40]. It is important to understand the patient mobility state. Inside the hospital the

845 Srinivasan Radhakrishnan et al. / Procedia Economics and Finance 11 ( 2014 ) 838 – 856
patient can be in non-mobile state or ambulatory state. The design criteria for wearable sensor devices can change
just by knowing the mobility state of the patient. One can design heavy, reliable, cable electricity, high
computational power devices if the patient is static. On the other hand the design dynamics change to light weight,
reliable, battery operated, lesser computational ability, wireless devices if the patient is in ambulatory condition. The
gateway ability is the access point to connect to the medical network in order to obtain relevant information [40].
Satellites are an example for global gatewaypoints while in-city health kiosks represent local
gatewaypoints[40].From the above described broad classification of wearable health monitoring devices, we now
move on to the generic architecture of the same.
9. General Architecture of Wearable Devices
Wearable Health Monitoring Systems (WHMS) have seen increased research and development efforts in the last
decade [41-44]. The research has proliferated in both sensor design and its data transmission network. Figure 2
depicts the Generic WHMS architecture, as stated by Pantelopoulos, et al.[45, 46].The Biosensors form the front end
of the WHMS pipeline. Sensing appropriate bio signals are their main function. These biosensors can be embedded
in textiles or worn on body[45, 46]. The biosensors send data wirelessly through Bluetooth-enabled or Zigbee motes
channel[45, 46]. This form of data transfer network is termed as Body Area Network (BAN). Filtering,amplifying
and other AD conversion forms the basic signal processing steps that are performed by a dedicated hardware
attached to the sensor or by the central node (see Figure 2). The central node which can be a portable PDA, portable
computer or smart phone is responsible for tasks such as handling the communication of the biosensors, performing
additional data processing, verifying and validating the data, comparing the extracted features or values from each
signal with the thresholds, generating alarm signals, displaying real time data on GUI and transmitting the processed
data to the database server, hospitals or the physicians cell phone[45, 46]. It is to be noted that the existing WHMS
framework incorporates both quantitative (heartbeat rate, blood oxygen level, respiration rate etc.) and qualitative
data (sleeping condition, body pain, skin discoloration etc.). In case of the qualitative data there is a need for verbal
interactions with the patient[45, 46]. The basic types of bio-signal sensed are, ECG (electrocardiogram), blood
glucose, respiration rate, blood pressure, heart rate, heart sound and body movements. The respective types of
sensors used for the above mentioned signals are skin/chest electrodes, strip-based glucose meter,
piezoelectric/piezoresistive sensors, arm-cuff monitor, pulse oximeter, phonocardiograph and, accelerometer. For
further classification of types of signals, sensors and data measured one can refer to Pantelopoulos, et al.[45, 46].
10. Applying Discrete Event Simulation to Wearable Devices Framework
Before moving on to the discrete event simulation (DEs) we will discuss about the limitations of DEs and suggest
alternate simulation method that will enable to analyze the behavior of the WHMS primary care model on whole.
The key performance measures required for assessing the behavior of the WHMS primary care model are, primary
care patient wait time (WT), patient satisfaction, patient population absorbed by the primary care, number of patients

846 Srinivasan Radhakrishnan et al. / Procedia Economics and Finance 11 ( 2014 ) 838 – 856
Figure 2: Generic WHMS architecture [20, 21]
denied primary care, and patient visits per episode. The patient satisfaction and patient visits per episode represents
entity behavior i.e. behavior based on individual patients. The entity level behavior cannot be captured using
discrete event simulation method. The entity level behavior can be captured by adopting agent-based simulation
method. In this paper we concentrate on primary care patient wait time (WT), patient population absorbed by the
primary care, and number of patients denied primary care which represents event level behavior. The event level
behavior can be captured by discrete event simulation method. We have used discrete event simulation method to
simulate and analyze the behavior of our proposed model in terms of performance measures. The following section
deals with identification of the patient categories and selection of performance measures for the simulation.
11. Patient Categories
UpkarVarshney [47] divided the healthcare applications among the following categories: prevention, healthcare
maintenance and checkups, short-term monitoring (or home monitoring), long-term monitoring (nursing home),
personalized healthcare monitoring, incidence detection and management, and, emergency intervention,

847 Srinivasan Radhakrishnan et al. / Procedia Economics and Finance 11 ( 2014 ) 838 – 856
transportation and treatment. The important prerequisite for studying WHMS framework is to identify the category
of the patients. We use these categories as suggested by UpkarVarshney [47] and accommodate them into two broad
categories of patients; (1) Preventive care patients who receive prevention, healthcare maintenance and checkups,
short-term monitoring or home healthcare monitoring, personalized healthcare monitoring, incidence detection and
management; and (2) Post-treatment patients who have been recently operated on, surgically or non-surgically, and
are in their recovery phase, patients with need for long-term in-hospital monitoring. In this study we will
concentrate on preventive care patients and study the effects of wearable devices when used for pervasive health
care.
12. Selecting Performance Measures
Quality indicators are the explicitly defined measurable indicators that describe the structures, processes, or
outcomes of care [48, 49].Activity indicators measure the frequency of events (e.g., flu vaccination
frequency)[48].Quality indicators infer a judgment about the quality of care provided and performance indicators
are statistical devices for monitoring performance (such as use of resources) without any necessary inference about
quality[48, 50]. Indicators do not provide definitive answers but indicate potential problems or quality of care[48].
Though most indicators are developed for in-hospital use, the primary care is witnessing an increase in the use of
indicators[48].Usually quality indicators are developed using non-systematic research methods or systematic
evidence based methods[48]. The evidence based methods rely on evidence alongside the expert’s opinion. But due
to difference in interpretation of the evidence, various consensus methods have been developed to address this
issue[48, 49-54]. The quality measures developed by consensus techniques are subjected to, acceptability,
feasibility, reliability, sensitivity to change, and validity[48]. Before developing indicators, one needs to identify;
Structures (staff, equipment, appointment systems, etc), Process (such as prescribing, investigation, patient-
personnel interaction) and Outcomes (such as mortality, patient satisfaction)[48]. In this paper we wish to
investigate the effects of proposed model on the structures and outcomes. The factors affecting the performance
indicators are displayed in Table 1. The performance measures/indicators selected for the current model are, primary
care patient wait time (WT), patient population absorbed by the primary care, and number of patients denied primary
care.
13. Simulation
The simulation model consists of two environments; current primary care setting, and new primary care setting that
use wearable health monitoring system (WHMS). The snapshot of the discrete event simulation (DEs) model is
shown in Figure 3. The simulation model has the following elements; patient generator, filtering mechanism, patient
admission, vital signs measurement, and physician consultation. The patient generator is responsible for generating
scheduled and unscheduled patients. The scheduled patients are those who have already secured an appointment for
a particular day. The unscheduled patients are those who turn up every day, and seek appointment for that particular

848 Srinivasan Radhakrishnan et al. / Procedia Economics and Finance 11 ( 2014 ) 838 – 856
Table1: Selected performance measures/indicators
day they need care. The filtering mechanism sends scheduled patients into the primary care system. A percentage of
scheduled patients cancel their appointments, and those slots are given to unscheduled patients who seek
appointment for that day. In addition the filtering mechanism sends unscheduled patients into the system if the
physician is free.
For the simplification of the model we have assumed that the care provider is notified beforehand about the
cancellation of certain scheduled patients and the unscheduled patients are given the cancelled slots. Once the
patients enter the primary care setting, they are subjected to admission procedure, vital sign measurement and
eventually sent to physician consultation. For both the primary care settings patient arrivals were modelled as
Poisson processes, where the number of patients arriving per unit time is described by Poisson distribution. Because
patient arrivals are probabilistic in nature and independent of each other, a Poisson distribution can be used to
describe the events (patient arrivals) that occur during a period of time [55]. A uniform random distribution was
used to model the probability of scheduled patients cancelling appointments. The time a patient spends at each stage
in the primary care settings: admission, vital signs and physician consultation was assumed to follow an exponential
distribution. An exponential distribution is an appropriate choice as it models the time elapsed between events
(Example: customer enters admission process, leaves admission process) very well in a statistical context [55]. For
the WHMS setting the time spent at each stage was also assumed to be exponential, but the mean value of time was
set to a lower value than its counterpart. As stated in the previous sections, the effect of WHMS on time spent at
each stage of length of stay is not known. So a sensitivity analysis was performed by decreasing in steps the mean
Performance Indicators Measurable Influencing Factors Non-measurable Influencing
Factors
• Primary Care Patient
Wait Time (WT)
• Patient Population
Absorbed by Primary
Care
• Number of Patients
denied care due to lack
of care unavailability
• Admission time
• Initial medical data collection
(Vital Signs) time
• Patient waiting for primary care
physician (Wait Time)
• Patient-Doctor consultation time
(Visit Time)
• Percentage of population
adopting Wearable device based
health monitoring system
• Wearable Health
Monitoring Device
Technology
Development

849 Srinivasan Radhakrishnan et al. / Procedia Economics and Finance 11 ( 2014 ) 838 – 856
values of time in spent at each stage and comparing the results with those of the current primary care setting model.
The results of the simulation are discussed in the following section.
Figure 3: Snapshot of the discrete event simulation model built using Arena

850 Srinivasan Radhakrishnan et al. / Procedia Economics and Finance 11 ( 2014 ) 838 – 856
14. Results and Discussion
The y-axis of Figure 4 shows the average patient wait time in minutes and the x-axis shows the percentage of patient
population adopting WHMS model. In addition, Figure 4 compares three scenarios by varying the vitals
measurement time and the physician consultation time. The vital 5-5 and physician 10-5 as indicated in Figure 4
represent a normal distribution (vital 5-5 mean-5 minutes and SD-5 minutes). The same convention is used in case
of Figure 5 (number of patients denied care) and Figure 6 (number of patients absorbed by the system). Scenario 1
represents vital5-5 and physician 10-5, scenario 2 represents vital 10-5 and physician 15-5, and scenario 3 represents
vital 15-5 and physician 20-5.
Figure 4: Average patient wait time
The factors that promoted the reduction in the average wait time were the time taken for vital sign measurement, the
physician consultation time, and the percentage of population that adopted the WHMS model. The average wait time
for current primary care system was 30 minutes. The scenario 1 yielded better results than scenario 2 and scenario 3
concerning the reduction in the average wait time across all percentage population of patient adoption. Comparing
the current primary care system and 80%-100% population adoption rate, scenario 1 and scenario 2 yielded average
patient wait time of 6 and 16 minutes respectively. On the other hand for 80%-100% adoption rate, the scenario 3
05
1015202530354045
Avg.
patie
nt w
ait t
ime
(min
s)
% Population adopting WHMS model
Avg.Patient Wait Time
Vital 5-5 and Physician 10-5
Vital 10-5 and Physician 15-5
Vital 15-5 and Physician 20-5
851 Srinivasan Radhakrishnan et al. / Procedia Economics and Finance 11 ( 2014 ) 838 – 856
yielded same value for average patient wait time as the current primary care system. Overall, scenario 3 yielded
higher average patient wait time than the current system across all the adoption percentages. Scenario 2 was
effective in reducing the average patient wait time for adoption greater than 50% and Scenario 1 was effective in
reducing the average patient wait time for adoption greater than 35%. These results are obtained under a system
constraint of physician capacity and daily working hours. The physician capacity was not changed and the daily
working hours were set to 8 hours per day. This essentially takes into consideration the effect of reducing primary
care professionals.
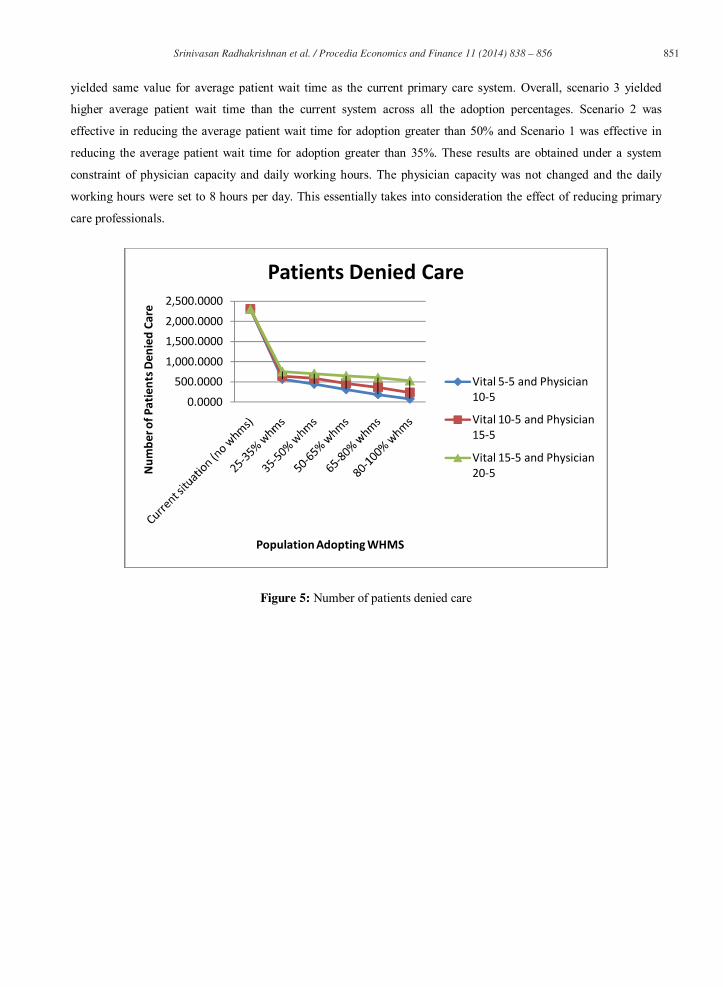
Figure 5: Number of patients denied care
0.0000
500.00001,000.0000
1,500.00002,000.0000
2,500.0000
Num
ber o
f Pat
ient
s Den
ied
Care
Population Adopting WHMS
Patients Denied Care
Vital 5-5 and Physician 10-5
Vital 10-5 and Physician 15-5
Vital 15-5 and Physician 20-5

852 Srinivasan Radhakrishnan et al. / Procedia Economics and Finance 11 ( 2014 ) 838 – 856
Figure 5 gives the results of the number of patients who were denied care on the day of visit. All the three scenarios
yielded better results in reducing number of patient denials than the current system. Scenario 1 had lowest number
of patient denials as compared to scenario 2 and 3. Scenario1 for 80%-100% adoption rate yielded 90 denials which
was the least number of denials. The patient denials are applied only for last minute schedule requests. The patients
already scheduled for the day are not denied care. In real situation there may be cases where the scheduled patients
are denied care due to some problems at the care provider side or due to uncertain changes in physician’s schedule.
Figure 6 gives the number of patients absorbed by the current system and the WHMS model (according to
percentage adoption). All the three scenarios yielded better results and showed an increasing patient absorption
capacity compared to the current system. Scenario 1 yielded better results than scenario 2 and scenario 3.
Figure 6: Number of patients absorbed by the system
The aforementioned three scenarios performed better than the current primary care system irrespective of adoption
percentages (in case of patient absorption and patient denials). However the same observations are absent in case of
the average wait time. In all the three scenarios the WHMS system reflected increasing patient absorption capacity.
This increase in patient load had a negative impact on patient wait time. Scenario 1 and Scenario 2 were effective in
reducing the average patient wait time for adoption percentages above 35% and 50% respectively. The simulation
0.0000500.0000
1,000.00001,500.00002,000.00002,500.00003,000.00003,500.0000
Num
ber o
f Pat
ient
s Abs
orbe
d
Population Adopting WHMS
Number of Patients Absorbed
Vital 5-5 and Physician 10-5
Vital 10-5 and Physician 15-5
Vital 15-5 and Physician 20-5

853 Srinivasan Radhakrishnan et al. / Procedia Economics and Finance 11 ( 2014 ) 838 – 856
shows that the WHMS model works well across all adoption percentages in absorbing more patients and reducing
patient denials. However the average patient wait time is sensitive to the adoption percentages. The novel method of
using simulation to study the effects of wearable devices will enable researchers and healthcare providers to save
implementation costs and reduce time consumption.
15. Future Work
In this work we analyzed the primary care system at the process level using discrete event simulation. The use of DE
simulation restricts our ability to understand the system at the macro and micro level. In future we wish to
incorporate agent-based and system dynamics technique to get a better understanding of the primary care system at
the micro and macro level respectively.
References
1. T. Bodenheimer and H. H. Pham, "Primary care: Current problems and proposed solutions," Health Aff, vol. 29,
no. 5, pp. 799-805, May 2010.
2. Steinwald B. Primary care professionals: recent supply trends, projections, and valuation of services [Internet].
Statement in testimony before the Senate Committee on Health, Education, Labor, and Pensions. Washington
(DC): GAO; 2008 [cited 2010 Mar 49]. Available from: http://www.gao.gov/new.items/d08472t.pdf
3. Bodenheimer T. Primary care—will it survive? N Engl J Med. 2006;355: 861–4.
4. National Hospital Ambulatory Medical Care Survey: 2006 Emergency Department Summary. 39 pp. (PHS)
2008-1500. August 6, 2008
5. Massachusetts Medical Society. 2008 Physician Workforce Study. Waltham (MA): Massachusetts Medical
Society; 2008 Oct 7.
6. Petterson S, Rabin D, Phillips RL, Bazemore A, Dodoo MS. Having a usual source of care reduces ED visits.
Washington (DC): Robert Graham Center; 2009 Jan.
7. California HealthCare Foundation. Overuse of emergency departments among insured Californians. Oakland
(CA): CHCF; 2006 Oct. Issue Brief.
8. Sandy LG, Bodenheimer T, Pawlson LG, Starfield B., “The political economy of U.S. primary care.”, Health
Aff (Millwood), Jul-Aug;28(4):1136-45, 2009.
9. Y. Bar-Yam, Healthcare costs: the roadmap, New England Complex Systems Institute
10. Bodenheimer T, Grumbach K, Berenson RA, “A lifeline for primary care”, N Engl J Med. Jun
50;360(26):2693-6, 2009.
11. Bodenheimer T., “Coordinating care-a perilous journey through the health care system”, N Engl J Med, Mar
6;358(10):1064-71, 2008
12. G. Pare, M. Jaana, and C. Sicotte, Systemic review of home telemonitoring for chronic diseases: The evidence
base," J Am Med Inform Assoc, vol. 14, no. 3, pp. M2270-277, February 2007.

854 Srinivasan Radhakrishnan et al. / Procedia Economics and Finance 11 ( 2014 ) 838 – 856
13. Marrero DG, Vandagriff JL, Kronz K, et al. Using telecommunication technology to manage children with
diabetes: The Computer-Linked Outpatient (CLOC) study. Diabetes Educ. 1995;49:313–9.
14. Finkelstein SM, Lindgren B, Prasad B, et al. Reliability and validity of spirometry measurements in a paperless
home monitoring diary program for lung transplantation. Heart Lung. 1993;22:548–33.
15. Kjellstrom B, Igel D, Abraham J, Bennett T, Bourge R. Transtelephonic monitoring of continuous
haemodynamic measurements in heart failure patients. J TelemedTelecare. 2005;11: 490–4.
16. Gomez EJ, Hernando ME, Garcia A, et al. Telemedicine as a tool for intensive management of diabetes: The
DIABTel experience. Comput Methods Programs Biomed. 2002;69:163–77.
17. Lindgren B, Finkelstein SM, Prasad B, et al. Determination of reliability and validity in home monitoring data
of pulmonary function tests following lung transplantation. Res Nurs Health. 1997;20:539 –50.
18. Aris IB, Wagie AAE, Mariun NB, Jammal ABE. An internetbased blood pressure monitoring system for
patients. J TelemedTelecare. 2001;7:51–3.
19. Moller DS, Dideriksen A, Sorensen S, Madsen LD, Pedersen EB. Tele-monitoring of home blood pressure in
treated hypertensive patients. Blood Press. 2003;12:56–62.
20. Capomolla S, Pinna G, LaRovere MT, et al. Heart failure case disease management program: A pilot study of
home telemonitoring versus usual care. Eur Heart J Suppl. 2004;6:F91– 8.
21. Finkelstein SM, Lindgren B, Prasad B, et al. Reliability and validity of spirometry measurements in a paperless
home monitoring diary program for lung transplantation. Heart and Lung 1993;22:548 33
22. Finkelstein J, Cabrera MR, Hripcsak G. Internet-based home asthma telemonitoring: can patients handle the
technology? Chest 2000;117:148 55
23. Morlion B, Knoop C, Paiva M, Estenne M. Internet-based home monitoring of pulmonary function after lung
transplantation. Am J RespCrit Care Med. 2002;165:694 –7.
24. Maiolo C, Mohammed EI, Fiorani CM, DeLorenzo A. Home telemonitoring for patients with severe respiratory
illness: The Italian experience. J TelemedTelecare. 2003;9:67–71.
25. Finkelstein SM, Snyder M, Edin-Stibbe C, et al. Staging of bronchiolitis obliterans syndrome using home
spirometry. Chest. 1999;116:120–6.
26. Bruderman I, Abboud S. Telespirometry: Novel system for home monitoring of asthmatic patients. Telemed J.
1997;3:127–33.
27. Ahring KK, Joyce C, Ahring JP, Farid N. Telephone modem access improves diabetes control in those with
insulin-requiring diabetes. Diabetes Care. 1992;15:971–5.
28. Shultz EK, Bauman A, Hayward M, Holzman R. Improved care of patients with diabetes through
telecommunications. Ann N Y Acad Sci. 1992;670:141–5.
29. Tsang MW, Mok M, Kam G, et al. Improvement in diabetes control with a monitoring system based on a hand-
held touchscreen electronic diary. J TelemedTelecare. 2001;7:47–50.

855 Srinivasan Radhakrishnan et al. / Procedia Economics and Finance 11 ( 2014 ) 838 – 856
30. Chase HP, Pearson JA, Wightman C, Roberts MD, Oderberg AD, Garg SK. Modem transmission of glucose
values reduces the cost and need for clinic visits. Diabetes Care. 2003;26:1475–9.
31. Lavery LA, Zamorano RG, Higgins KR, et al. Home monitoring of foot skin temperatures to prevent ulceration.
Diabetes Care. 2004;27:2642–7.
32. Bondmass M, Bolger N, Castro G, Avitall B. The effect of home monitoring and telemanagement on blood
pressure control among African Americans. Telemed J. 2000;6:15–48.
33. Nanevicz T, Piette J, Zipkin D, et al. The feasibility of atelecommunications service in support of outpatient
congestiveheart failure in a diverse patient population. Congest Heart Fail.2000;6:140 –5.
34. Morlion B, Knoop C, Paiva M, Estenne M. Internet-based home monitoring of pulmonary function after lung
transplantation. Am J RespCrit Care Med. 2002;165:694 –7.
35. Mengden T, Ewald S, Kaufmann S, Esche JVD, Uen S, Vetter H. Telemonitoring of blood pressure self
measurement in the OLMETEL study. Blood Press Monit. 2004;9:321–5.
36. Ryan D, Cobern W, Wheeler J, Price D, Tarassenko L. Mobile phone technology in the management of asthma.
J TelemedTelecare. 2005;11:43– 6.
37. Piette JD, Weinberger M, McPhee SJ, Mah CA, Kraemer FB, Crapo LM. Do automated calls with nurse follow-
up improve self-care and glycemic control among vulnerable patients with diabetes? Am J Med. 2000;108:20 –
7.
38. Cordisco ME, Beniaminovitz A, Hammond K, Mancini D. Use of telemonitoring to decrease the rate of
hospitalization in patients with severe congestive heart failure. Am J Cardiol. 1999;84:860 –2.
39. Heidenreich PA, Ruggerio CM, Massie BM. Effect of a home monitoring system on hospitalization and
resource use for patients with heart failure. Am Heart J. 1999;138:633– 40.
40. DejanRaskovic, Thomas Martin, and Emil Jovanov, “Medical Monitoring Applications for Wearable
Computing”, The Computer Journal, 47(4): 495-504, 2004.
41. Journal of Clinical Monitoring and Computing , Volume 19, Number 6, 427-436, 42. L. Gatzoulis and I. Iakovidis, “Wearable and portable ehealth systems,” IEEE Eng. Med. Biol. Mag., vol. 26,
no. 5, pp. 51–56, Sep.–Oct. 2007.
43. A. Lymperis and A. Dittmar, “Advanced wearable health systems and applications, research and development
efforts in the european union,” IEEE Eng. Med. Biol. Mag., vol. 26, no. 3, pp. 29–33, May/Jun. 2007.
44. G. Tr¨oster, “The Agenda of Wearable Healthcare,” in IMIA Yearbook of Medical Informatics. Stuttgart,
Germany: Schattauer, 2005, pp. 150–138.
45. Pantelopoulos, A. and Bourbakis, N. G. 2010. Prognosis: a wearable health-monitoring system for people at
risk: methodology and modeling. Trans. Info. Tech. Biomed. 14, 3, 613-621, May. 2010.
46. Pantelopoulos, A. and Bourbakis, N. G. 2010. A survey on wearable sensor-based systems for health
monitoring and prognosis. Trans. Sys. Man Cyber Part C 40, 1-12, 1 Jan. 2010.
47. Varshney, U. 2007. Pervasive healthcare and wireless health monitoring. Mob. Netw. Appl. 12, 2-3, 113-127,
Mar. 2007

856 Srinivasan Radhakrishnan et al. / Procedia Economics and Finance 11 ( 2014 ) 838 – 856
48. S M Campbell, J Braspenning, A Hutchinson, M Marshall, “Research methods used in developing and
applying quality indicators in primary care”, QualSaf Health Care,11:358-364, 2002
49. McGlynn EA, Asch SM. Developing a clinical performance measure. Am J Prev Med;14:14-21, 1998.
50. Lawrence M, Olesen F. Indicators of quality health care. Eur J Gen Pract, 3:103-8, 1997
51. Jones JJ, Hunter D. Consensus methods for medical and health services research. BMJ, 311:376-80, 1995.
52. Murphy MK, Black NA, Lamping DL, McKee CM, Sanderson CFB, Ashkam J, et al. Consensus development
methods, and their use in clinical guideline development. Health Technol Assess, 2(3), 1998.
53. Fink A, Kosecoff J, ChassinM, Brook RH. Consensus methods: characteristics and guidelines for use. Am J Pub
Health,74:979-83, 1984.
54. Black N, Murphy M, Lamping D, McKee M, Sanderson C, Ashkam J, et al. Consensus development methods: a
review of best practice in creating clinical guidelines. Journal of Health Services Research and Policy, 4:486-
48, 1999.
55. Averill M. Law and W. David Kelton. 1997. Simulation Modeling and Analysis (2nd ed.). McGraw-Hill Higher
Education.


![Wearable [REDACTED]](https://static.fdocuments.us/doc/165x107/559f58221a28abf0078b482f/wearable-redacted.jpg)