
Introduction to PPT v2 - Oak Ridge Leadership Computing ...
31
© 2017 IBM Corporation HPC Tools, IBM Systems and Technology Group Introduction to the IBM Parallel Performance Toolkit v2.3 IBM Parallel Performance Toolkit v.2.3 “Quick Start Cookbooks” Series
Transcript of Introduction to PPT v2 - Oak Ridge Leadership Computing ...

© 2017 IBM CorporationHPC Tools, IBM Systems and Technology Group
Introduction to theIBM Parallel Performance Toolkit v2.3
IBM Parallel Performance Toolkit v.2.3“Quick Start Cookbooks” Series
© 2017 IBM CorporationIBM Confidential
Welcome and Overview§ IBM Parallel Performance Toolkit v2.3
– Previously known as the IBM Parallel Environment Developer Edition– An integrated set of performance analysis tools for Power Linux LE binaries– Designed to assist application developers in tuning parallel or serial HPC
applications
§ IBM Parallel Performance Toolkit v2.3 is based on:– Eclipse Release 4.6.1, “Neon”– Release 9.1.0 of the “Parallel Tools Platform” (PTP) Eclipse plugins
§ Documentation– http://www.ibm.com/support/knowledgecenter/SSFK5S/pedev23/pedev.v2r3_
welcome.html
2 10 January 2017

© 2017 IBM CorporationIBM Confidential
What Does it Provide?§ Utilities for gathering and analyzing
– Call graph data– Profiling and trace data for
• Hardware performance counters - CPU and GPU• MPI activity• Modular I/O (MIO)• OpenMP
§ Programming interfaces for application instrumentation
§ Binary instrumentation– Entire application– Functions and call sites– Code regions
3 10 January 2017

© 2017 IBM CorporationIBM Confidential
How is it Structured?§ Three main components
– Application Programming Interface (API) and shared libraries– Command-line interface (CLI)– Graphical user interface (GUI)
§ API and shared libraries– Add calls to hardware performance counter tools
§ CLI– Used on the server nodes to instrument applications
§ GUI– Used on the client machines to
• Instrument and run user applications• Visualize the profile and trace files produced by back-end instrumentation components
§ The GUI comes in two flavors– hpctView, a stand-alone Eclipse Rich Client Program (RCP)– The HPCT Plug-in for Eclipse PTP, to be installed in existing Eclipse IDE installations
4 10 January 2017

© 2017 IBM CorporationIBM Confidential
What Can I Do With It?§ Instrument a binary application, either from the CLI or from the GUI
– for specific individual tools or in combination, e.g.• HPM & GPM• MPI, or MPI & HPM/GPM• MIO• OpenMP
§ Collect performance data from an instrumented application– Set environment variables for the specific analysis tool– Invoke the application from the command line
§ Modify an application to add calls to the hardware performance counter tool– For both CPU and GPU– Rebuild your application linking with the hardware performance counter library– Run the application to get hardware performance counter data
§ Link an application directly with the MPI profiling and trace library– Run the application to get MPI profiling and trace data
5 10 January 2017

© 2017 IBM CorporationIBM Confidential
What Can I Do With It? (cont)§ Link an application with the I/O profiling and trace library
– Run the application to get I/O profiling and trace data
§ Use preloaded instrumentation libraries to get profiling and trace data– For MPI, GPM and OpenMP– Use the LD_PRELOAD mechanism– Set environment variables for the selected tool– Launch the application setting LD_PRELOAD to the corresponding tool library
6 10 January 2017

© 2017 IBM CorporationIBM Confidential
New Features in IBM Parallel Performance Toolkit v2.3§ Use of MRNet for data reduction protocol
– Reduction in the amount of network data generated for profiling and tracing
§ Support for IBM XL C compiler v13.1.5 and IBM FORTRAN compiler v15.1.5
§ Support for Spectrum MPI
§ Improvements to the hpctView and PPT Plug-in GUIs– Improved events-based trace viewing with filtering capabilities– Substantial new features to the Performance Data Analysis View
• New “Sum Metrics by Task” feature• New “Show Instrumentation Point Metrics” feature shows metrics such as minimum, maximum, and
average thread times for all threads within a task that executed at an OpenMP instrumentation point• New filtering feature shows the n rows where the selected metric is closest to its minimum or maximum
value• The tree view now computes an average for each metric for all threads in all tasks where data was
collected at an instrumentation point• The user can now show or hide individual metric columns in both the tree and table views
7 10 January 2017

© 2017 IBM CorporationIBM Confidential
Installation of IBM Parallel Performance Toolkit§ Back-end component and CLI – installed by sys/admin on the cluster nodes
–ppedev_runtime and ppedev_mrnet packages on compute and login nodes–ppedev_hpct package on the login nodes
§ The GUI (front-end component)– 64 bit Eclipse RCP for Windows, MacOS and x86 Linux x86
•hpctView-2.3.0-1-win64.zip•hpctView-2.3.0-1-macosx-cocoa-x86_64.tar.gz•hpctView-2.3.0-1-linux-gtk-x86_64.tar.gz
– HPCT Plug-in for Eclipse IDE•ppedev_update-2.3.0-1.zip
§ Installing hpctView on Windows– Extract the files from the hpctView-2.3.0-1-win64.zip archive into the directory of your choice
• e.g. using Windows Explorer, by right-clicking on it and selecting “Extract All”• extracted data will be a folder named “hpctView”
– “Uninstalling” hpctView is as easy as deleting the directory
8 10 January 2017

© 2017 IBM CorporationIBM Confidential
Installation of IBM Parallel Performance Toolkit (cont)§ Installing hpctView on MacOS
– Extract the files from the hpctView-2.3.0-1-macosx-cocoa-x86_64.tar.gz archive• e.g. by right-clicking on it and select “Open With” and “Archive Utility”• extracted application will be hcptView(.app)
– “Uninstalling” hpctView is as easy as moving the application to ”Trash”
§ Installing hpctView on x86 Linux– Extract the files from the hpctView-2.3.0-1-linux-gtk-x86_64.tar.gz archive
• e.g. in a terminal shell, using the tar command• extracted files will be in a directory named “hpctView”
– “Uninstalling” hpctView is as easy as removing the directory
§ Installing the HPCT plugin on ppc64le (login nodes)– Install the Eclipse IDE on the login node, in your home directory
• go to http://download.eclipse.org/eclipse/downloads/index.html, pick the 4.6.2 builds and then find, download and unpack the eclipse-platform-4.6.2-linux-gtk-ppc64le.tar.gz image
• on your client machine, launch the Eclipse IDE from a VNC or other xterm session to your login node• Before starting Eclipse ensure a 64 bit Java 8.0 JRE or SDK is installed on the node
9 10 January 2017

© 2017 IBM CorporationIBM Confidential
Installation of IBM Parallel Performance Toolkit (cont)§ Installing the HPCT plugin on ppc64le (cont)
– Install the following plugins• go to ”Help->Install New Software” from the main Eclipse menu• in the “Install” dialog window, choose to work with “Neon - http://download.eclipse.org/releases/neon”
(uncheck ”Group items by category”)
– Install the HCPT Plug-in for Eclipse PTP from the ppedev_update-2.3.0-1.zip update site• go to “Help->Install New Software” from the Eclipse main menu• in the “Install” dialog window, click on “Add” and point at the update site image ppedev_update-2.3.0-1.zip in the ”Location” field in the “Add Repository” dialog window
10 10 January 2017
© 2017 IBM CorporationIBM Confidential
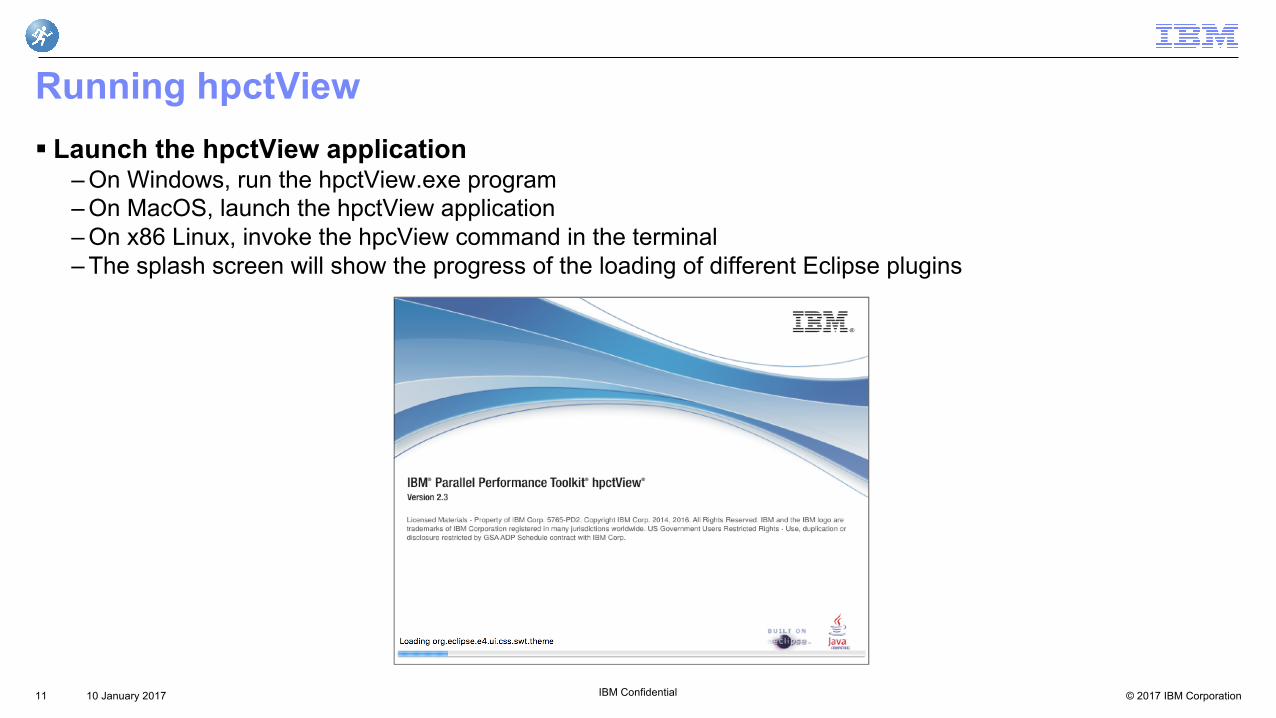
Running hpctView§ Launch the hpctView application
– On Windows, run the hpctView.exe program– On MacOS, launch the hpctView application– On x86 Linux, invoke the hpcView command in the terminal– The splash screen will show the progress of the loading of different Eclipse plugins
11 10 January 2017

© 2017 IBM CorporationIBM Confidential
Running hpctView (cont)§ Accept the end user license agreement (EULA)
– Common to both the hpctView RCP and the HPCT Plug-in for Eclipse PTP
12 10 January 2017

© 2017 IBM CorporationIBM Confidential
Running hpctView (cont)§ You should now see hpctView’s welcome
screen– You can click on hpctView to open the tool
§ Open the IBM Parallel Performance Toolkit perspective in the Eclipse IDE
– Go to “Window->Perspective->Open Perspective->Other” in the Eclipse main menu
– Select IBM Parallel Performance Toolkit
13 10 January 2017

© 2017 IBM CorporationIBM Confidential
Instrument for HPM and/or GPM using hpctView§ From the “File” menu, select “Open Executable...”
– It will bring up the “Select Executable To Load” dialog– If this is your first time using hpctView, you will need to add a new server connection
• Begin by pressing the “New...” button on the top right of the dialog
14 10 January 2017
• Use the resulting “New Connection” dialog to enter the connection information of your remote server
• If you need to enter any special connection settings (such as a login shell other than bash), click on the “Advanced” collapsible section
• When ready, press “Finish”– If you already created a connection, simply select it from
the “Connection name” selector

© 2017 IBM CorporationIBM Confidential
Instrument for HPM and/or GPM using hpctView (cont)§ Select the application binary
– The “Select Executable To Load” dialog displays a file tree view of your remote directory
– Navigate to the desired location and select the binary executable* you want to instrument, then press ”OK”
– hpctView will display a progress dialog as it loads and analyzes the binary executable
– Once the progress dialog has cleared, the “Instrumentation” view of hpctView should be populated
15 10 January 2017
* You must use the –g -Wl,--emit-stub-syms -Wl,--hash-style=sysvflags when building your application

© 2017 IBM CorporationIBM Confidential
Instrument for HPM and/or GPM using hpctView (cont)§ HPM and GPM use the same instrumentation points for your
application– They can be found listed in the “Instrumentation” view under the “HPM”
tab• This is the tab visible on top by default
§ Select the instrumentation points by clicking on the check box next to them
– e.g. you can select to instrument a function (i.e. call calls of that function) or a call site (i.e. a specific invocation of a function)
§ To begin instrumentation for the selected points, press the instrumentation icon at the top of the “Instrumentation” view
– This will produce a new binary with the same name as the original binary and with the added extension “.inst”
16 10 January 2017
© 2017 IBM CorporationIBM Confidential
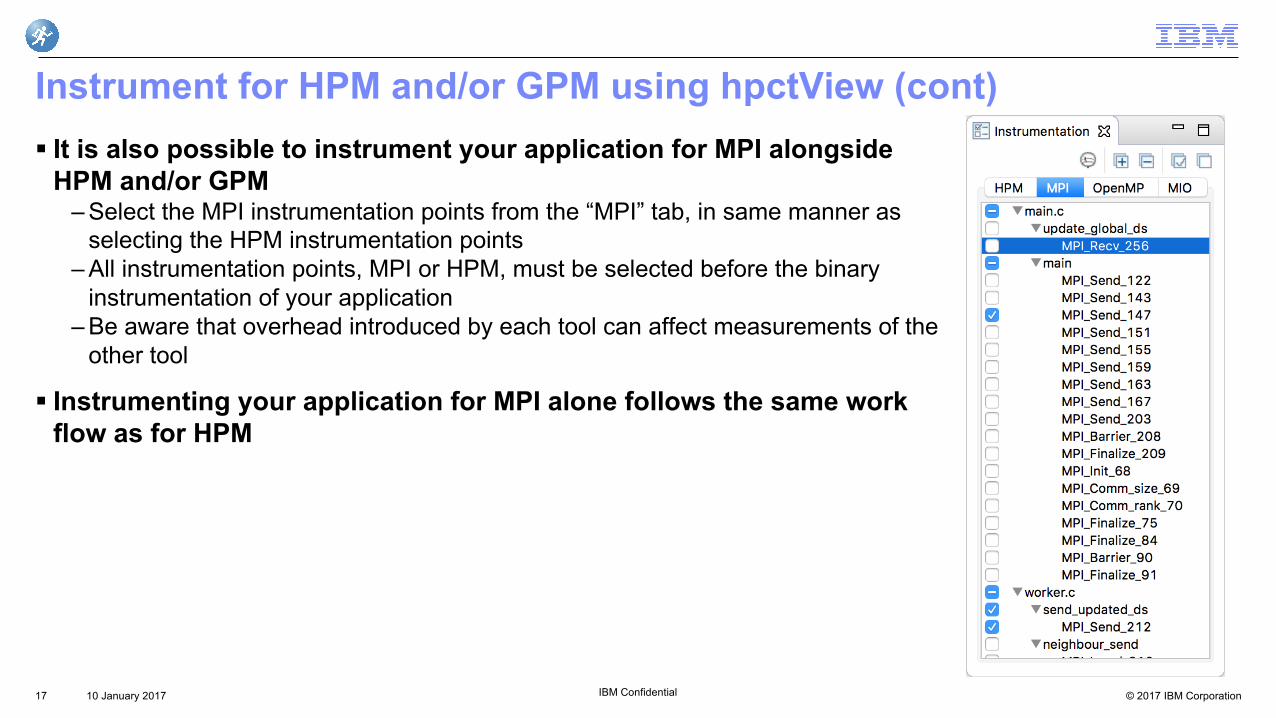
Instrument for HPM and/or GPM using hpctView (cont)§ It is also possible to instrument your application for MPI alongside
HPM and/or GPM– Select the MPI instrumentation points from the “MPI” tab, in same manner as
selecting the HPM instrumentation points– All instrumentation points, MPI or HPM, must be selected before the binary
instrumentation of your application– Be aware that overhead introduced by each tool can affect measurements of the
other tool
§ Instrumenting your application for MPI alone follows the same work flow as for HPM
17 10 January 2017

© 2017 IBM CorporationIBM Confidential
Run instrumented application using hpctView§ Create a run configuration
– Select “Run->Profile Configurations” from the main hpctViewmenu; this will open the ”Profile Configurations” dialog window
– Select ”Parallel Application” and press the ”New” button– After a dialog asking for your permission to run a command on a
remote system, you will be presented with the “Create, manage, and run configurations” screen
– Click on the “Target System Configuration” box and select “IBM OpenMPI” from the drop-down list
• You need to add the Spectrum MPI bin and lib directories to PATH and LD_LIBRARY_PATH env. vars. respectively, in your .bash_profile or .profile
– Select your remote connection (one of the connections you created in the previous steps)
18 10 January 2017

© 2017 IBM CorporationIBM Confidential
Run instrumented application using hpctView (cont)§ Create a run configuration (cont)
– Selecting a remote connection change the view as shown to the right
– Fill in all the relevant information in the “Resources”, ”Application”, ”Arguments”, ”Environment” tabs
– The settings that specify which data to gather are under the “Performance Analysis” tab
• To gather HPM data, make sure that one or more of the following checkboxes are selected under the “HPM” tab.
• Generally, it is a good idea to check at least those shown to the right
• To generate OTF2 trace data for your HPM instrumentation points, make sure to select the box marked “Generate OTF2 trace files”.
• If you do not wish to gather HPM data, make sure all boxes are unchecked
19 10 January 2017
© 2017 IBM CorporationIBM Confidential
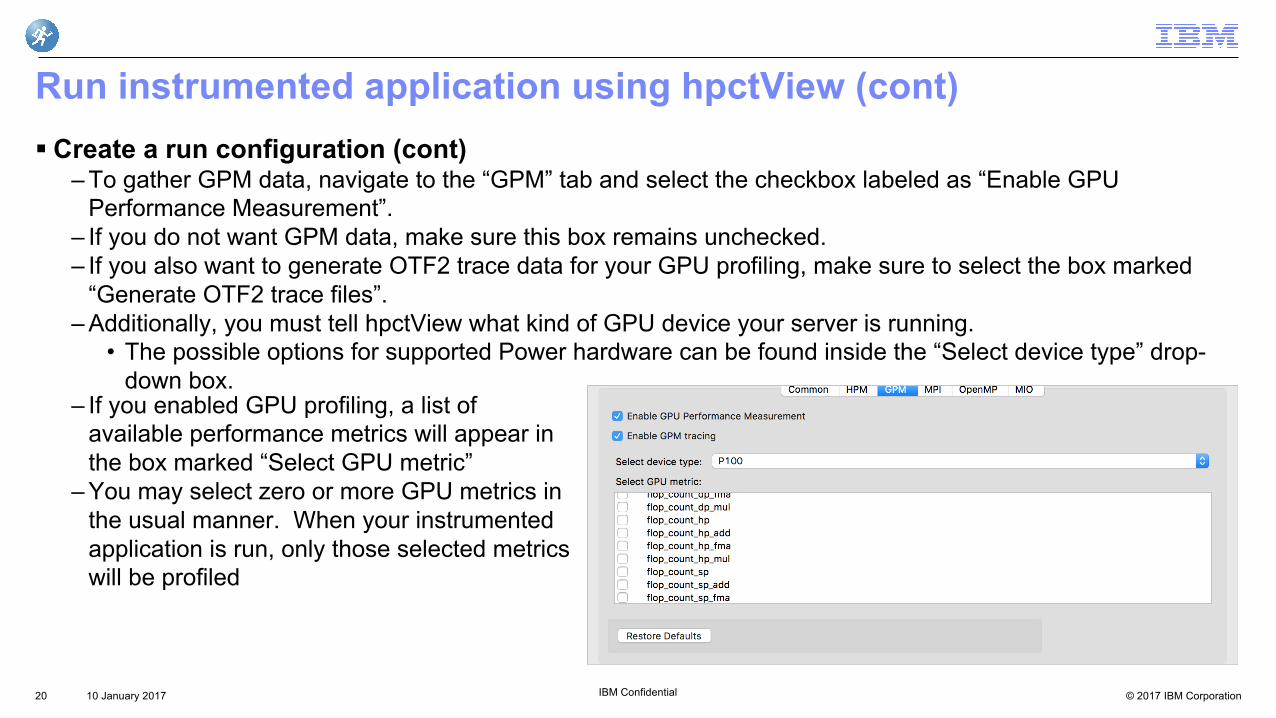
Run instrumented application using hpctView (cont)§ Create a run configuration (cont)
– To gather GPM data, navigate to the “GPM” tab and select the checkbox labeled as “Enable GPU Performance Measurement”.
– If you do not want GPM data, make sure this box remains unchecked.– If you also want to generate OTF2 trace data for your GPU profiling, make sure to select the box marked
“Generate OTF2 trace files”.– Additionally, you must tell hpctView what kind of GPU device your server is running.
• The possible options for supported Power hardware can be found inside the “Select device type” drop-down box.
20 10 January 2017
– If you enabled GPU profiling, a list of available performance metrics will appear in the box marked “Select GPU metric”
– You may select zero or more GPU metrics in the usual manner. When your instrumented application is run, only those selected metrics will be profiled

© 2017 IBM CorporationIBM Confidential
Run instrumented application using hpctView (cont)§ Create a run configuration (cont)
– If you have instrumented your application for MPI, you can enable MPI data gathering alongside HPM and/or GPM data gathering
– From the “MPI” tab of the “Profile Configuration” dialog's “Performance Analysis” tab, select the check box labeled “Enable MPI call tracing”
– When you are ready to profile your application's performance, press the button labeled “Profile”.
21 10 January 2017

© 2017 IBM CorporationIBM Confidential
Run instrumented application using hpctView (cont)§ As your application runs
– You will see an indicator in the lower-right corner of the hpctView window
22 10 January 2017
– Output from your application will appear inside the “Console” view which sits at the bottom portion of the hpctView screen by default
– If your application does not execute successfully, error messages will appear inside the “Console” view

© 2017 IBM CorporationIBM Confidential
Visualize profiling data§ After the application runs
– If the profiling of the application produced profiling data, a window will pop up asking the user to download the visualization (.viz) files
– Press “Yes” to download the profile data and visualize the results in hpctView
23 10 January 2017

© 2017 IBM CorporationIBM Confidential
Visualize trace data§ Need to explicitly load the trace data
– Large trace files– Two (2) trace formats
• OTF2 for HPM, GPM and OpenMP• Proprietary for MPI and MIO
– Go to the ”File->OTF2->Load OTF2 Trace (event)” menu from the hpctView main menu– Search for OTF2 archives with extensions .hpt for HPM, .gpt for GPM and .ompt for OpenMP– Select the .otf2 file in the chosen archive
24 10 January 2017

© 2017 IBM CorporationIBM Confidential
Parallel Performance Toolkit Command Line Interface§ Allows users to instrument an application and generate performance data from command
line
§ Generates performance data in several formats– Flat text file, containing summary performance data, viewable in text editor or printable– XML file (*.viz) containing summary performance data, viewable using hpctView– Detailed event traces, viewable using hpctView
§ Common workflow for all tools– Run setup script as first step in command line session (. /opt/ibmhpc/ppedev.hpct/env_sh)– Compile/link application with -g -Wl,--hash-style=sysv -Wl,--emit-stub-syms– Instrument application using hpctInst command, for instance hpctInst –dhpm shallow
• Generates new, instrumented executable, for instance shallow.inst– Set environment variables as needed– Run the instrumented executable– View the generated performance data
§ Multiple tools can be combined in one run– Be aware overhead of each tool can affect measurements by other tools
25 10 January 2017

© 2017 IBM CorporationIBM Confidential
Hardware Performance Counters Profiling and Tracing§ Instrument the application
– All function entry/exit points in application•hpctInst –dhpm shallow
– Selected function call sites•hpctInst –dhpm_func_call <func_list> shallow• func_list is text file containing list of locations to instrument• See hpctInst man page for format of func_list file
§ Set required environment variables– HPM_EVENT_SET=<n> specifies counter event set (use hpclist –l to list available groups)– HPM_ASC_OUTPUT=yes to generate flat text files– HPM_VIZ_OUTPUT=yes to generate XML (*.viz) files– HPM_ENABLE_TRACE=yes to generate event trace– See hpmInit man page for more environment variables
§ Run instrumented application– for instance mpirun –np 5 shallow.inst
§ View profile and/or trace data with hpctView
26 10 January 2017

© 2017 IBM CorporationIBM Confidential
MPI Profiling and Tracing§ Instrument the application
– Instrument all MPI function calls•hpctInst –dmpi shallow
– Instrument MPI function calls at specified locations•hpctInst –dhpm_func_call <func_list> shallow• func_list is text file containing list of locations to instrument• See hpctInst man page for format of func_list file
§ Set required environment variables– MAX_TRACE_EVENTS=<n> specify size of trace buffer (default 30,000 events)– TRACE_ALL_TASKS=y to profile and trace all tasks in the application– MAX_TRACE_RANK=<n> specifies maximum application task rank to profile/trace (default 256)– OUTPUT_ALL_RANKS=y to profile/trace all application tasks
• Default is task 0, task with min time, task with max time and task with avg time
§ Run instrumented application– e.g. mpirun –np 5 shallow.inst
§ View profile and/or trace data with hpctView– Note that flat text file, XML (*.viz) file and trace file are always generated for each selected task
27 10 January 2017

© 2017 IBM CorporationIBM Confidential
OpenMP Profiling and Tracing§ Instrument the application
– Instrument all OpenMP regions•hpctInst –dpomp mm
§ Set required environment variables– POMPROF_TXT_OUTPUT=y to generate flat text file with profile data– POMPROF_VIZ_OUTPUT=y to generate XML (*.viz) file with profile data– POMPROF_TRACE_OUTPUT=y to generate OpenMP event trace– POMPROF_LONG_INFO=y to generate detailed profile data– Filter subsets of OpenMP events with POMPROF_TRACE_* environment variables
• See appendix C of Installation and Use Guide for details
§ Run the instrumented application–./mm.inst
§ View the profile and/or trace data
§ Note that OpenMP trace data cannot be generated for an MPI application– OpenMP profile data can be generated for an MPI application
28 10 January 2017

© 2017 IBM CorporationIBM Confidential
I/O Profiling and Tracing§ Instrument the application
– Instrument all I/O calls•hpctInst –dmio iotest
§ Set required environment variables– TKIO_ALTLIB=$IHPCT_BASE/lib64/get_hpcmio_ptrs.so to specify location of get_hpcmio_ptrs.so – MIO_FILES=<mio_options>
• For instance MIO_FILES=*[trace/xml/events={./mio.evt}] to generate I/O trace for all filesª See Installation and Use guide for further explanation of MIO_FILES environment variable
§ Run the instrumented application– e.g.,./iotest.inst
§ View the profile and/or trace data with hpctView
§ Restrictions– C++ and Fortran applications cannot be profiled or traced– Only system I/O calls can be profiled and traced
• STDIO calls are ignored
29 10 January 2017

© 2017 IBM CorporationIBM Confidential
Using the preload trace libraries§ Preload trace libraries are an easy way to profile and trace entire application
– Located in /opt/ibmhpc/ppedev.hpct/lib64/preload on the login and compute nodes– Libraries for the following tools
• MPI profiling, libmpitrace.so• GPU profiling, libgpm.so• OpenMP profiling, libpomp.so
– Simply run your application with LD_PRELOAD set to the tool library you want to use• e.g., LD_PRELOAD=/opt/ibmhpc/ppedev.hpct/lib64/preload/libpomp.so ./mm
– Do not use the preload libraries with an instrumented application or an application instrumented with the profiling API
– Use documented environment variables for each tool to control what is profiled and what type of output is produced
– Visualize the profile and trace data with hpctView
30 10 January 2017

© 2017 IBM CorporationIBM Confidential
Profiling and Tracing Applications With Large Task Count § By default, all tools except MPI profile and trace generate data for all application tasks
– Can flood system/network with excessive file I/O for applications with large task counts
§ hpcrun command performs basic filtering to reduce number of tasks generating data– Selects <n> tasks with min, max and average time and task zero to generate profile and/or trace data
• Time may be elapsed time or CPU time (-exmetric ELAPSED_TIME or -exmetric CPU_TIME)• Performance data for all other tasks is not written to files.
§ hpcrun command is front end that invokes athe pplication and selects tasks that generate data
– e.g., hpcrun –exmetric ELAPSED_TIME –excount 5 mpirun –np 1023 shallow.inst
§ Visualize the profile and trace data with hpctView, the same as when hpcrun is not used
31 10 January 2017