Introducing Data Science to Undergraduates through Big Data: Answering … · 2017-06-08 ·...
10
Introducing Data Science to Undergraduates through Big Data: Answering Questions by Wrangling and Profiling a Yelp Dataset Scott Jensen Lucas College and Graduate School of Business, San José State University [email protected] Abstract There is an insatiable demand in industry for data scientists, and graduate programs and certificates are gearing up to meet this demand. However, there is agreement in the industry that 80% of a data scientist’s work consists of the transformation and profiling aspects of wrangling Big Data; work that may not require an advanced degree. In this paper we present hands-on exercises to introduce Big Data to undergraduate MIS students using the CoNVO Framework and Big Data tools to scope a data problem and then wrangle the data to answer questions using a real world dataset. This can provide undergraduates with a single course introduction to an important aspect of data science. 1. Introduction With an increasing demand for Big Data and data science skills, companies are facing a shortage of job candidates with the necessary talent. As early as 2011 Gartner projected that by 2018 there would be a shortage of 140,000 – 190,000 data scientists, along with a shortage of 1.5 million managers that could understand and interpret the analysis generated by the data scientists [13]. More recent studies have shown that employers continue to identify an increasing need for Big Data and data science skills [26]. This demand in the job market has led to an emphasis in academia on the development of courses, certificates, (and more recently degree programs) in data science and analytics, but mainly at the graduate level [4]. While the focus in data science has been on statistics, machine learning, and predictive analytics, leading to the data scientist’s role being described as the sexiest job of the 21 st century, 50% - 90% of the work in data science is the data acquisition and data wrangling needed to prepare data for analytics [3,6,20]. Additionally, non-technical skills often sought when hiring data science teams include an insatiable curiosity about data, the ability to formulate data questions, and domain business knowledge. In a recent study of analytics and data science programs at the undergraduate level, Aasheim et al. [1] found that data mining and analytics/modeling were covered in 100% of such programs. Of the four major areas reviewed, the area least frequently covered was Big Data. However, Big Data is the fuel that powers data science. Undergraduate students could be introduced to data science by learning to wrangle a dataset and answer questions using Big Data tools. Since a key aspect of data science is learning to decide what questions to ask of a dataset, students also need to learn to formulate their own questions. However, an issue raised by researchers in examining the teaching of Big Data and analytics is a lack of business datasets that can be easily used in a classroom setting [26]. The research questions we examine in this paper are: (1) In a semester course, can students learn a framework for scoping data questions and apply it to their own projects? (2) Through a series of lab exercises can undergraduate students successfully apply Big Data tools to answer their own student- generated data questions? To answer these questions, we analyzed the results of student teams from an undergraduate course focused on Big Data. This course teaches students to work with semi-structured data, formulate business questions to be answered, wrangle the data, query using a cloud-based Hadoop sandbox, and visualize the results using an iterative approach. The rest of this paper is organized as follows. In Section 2 we review the literature on Big Data with an emphasis on data wrangling. Section 3 discusses the methodology, structure, and tools used in the lab exercises and how they fit into the overall course, Section 4 presents our results, and section 5 concludes the paper. 2. Related work Although businesses have been using statistical analysis for decades to improve business decisions, 1033 Proceedings of the 50th Hawaii International Conference on System Sciences | 2017 URI: http://hdl.handle.net/10125/41275 ISBN: 978-0-9981331-0-2 CC-BY-NC-ND
Transcript of Introducing Data Science to Undergraduates through Big Data: Answering … · 2017-06-08 ·...

Introducing Data Science to Undergraduates through Big Data: Answering Questions by Wrangling and Profiling a Yelp Dataset
Scott Jensen
Lucas College and Graduate School of Business, San José State University [email protected]
Abstract There is an insatiable demand in industry for data
scientists, and graduate programs and certificates are gearing up to meet this demand. However, there is agreement in the industry that 80% of a data scientist’s work consists of the transformation and profiling aspects of wrangling Big Data; work that may not require an advanced degree. In this paper we present hands-on exercises to introduce Big Data to undergraduate MIS students using the CoNVO Framework and Big Data tools to scope a data problem and then wrangle the data to answer questions using a real world dataset. This can provide undergraduates with a single course introduction to an important aspect of data science. 1. Introduction
With an increasing demand for Big Data and data science skills, companies are facing a shortage of job candidates with the necessary talent. As early as 2011 Gartner projected that by 2018 there would be a shortage of 140,000 – 190,000 data scientists, along with a shortage of 1.5 million managers that could understand and interpret the analysis generated by the data scientists [13]. More recent studies have shown that employers continue to identify an increasing need for Big Data and data science skills [26]. This demand in the job market has led to an emphasis in academia on the development of courses, certificates, (and more recently degree programs) in data science and analytics, but mainly at the graduate level [4].
While the focus in data science has been on statistics, machine learning, and predictive analytics, leading to the data scientist’s role being described as the sexiest job of the 21st century, 50% - 90% of the work in data science is the data acquisition and data wrangling needed to prepare data for analytics [3,6,20]. Additionally, non-technical skills often sought when hiring data science teams include an insatiable curiosity about data, the ability to
formulate data questions, and domain business knowledge. In a recent study of analytics and data science programs at the undergraduate level, Aasheim et al. [1] found that data mining and analytics/modeling were covered in 100% of such programs. Of the four major areas reviewed, the area least frequently covered was Big Data. However, Big Data is the fuel that powers data science. Undergraduate students could be introduced to data science by learning to wrangle a dataset and answer questions using Big Data tools. Since a key aspect of data science is learning to decide what questions to ask of a dataset, students also need to learn to formulate their own questions. However, an issue raised by researchers in examining the teaching of Big Data and analytics is a lack of business datasets that can be easily used in a classroom setting [26].
The research questions we examine in this paper are: (1) In a semester course, can students learn a framework for scoping data questions and apply it to their own projects? (2) Through a series of lab exercises can undergraduate students successfully apply Big Data tools to answer their own student-generated data questions?
To answer these questions, we analyzed the results of student teams from an undergraduate course focused on Big Data. This course teaches students to work with semi-structured data, formulate business questions to be answered, wrangle the data, query using a cloud-based Hadoop sandbox, and visualize the results using an iterative approach.
The rest of this paper is organized as follows. In Section 2 we review the literature on Big Data with an emphasis on data wrangling. Section 3 discusses the methodology, structure, and tools used in the lab exercises and how they fit into the overall course, Section 4 presents our results, and section 5 concludes the paper. 2. Related work
Although businesses have been using statistical analysis for decades to improve business decisions,
1033
Proceedings of the 50th Hawaii International Conference on System Sciences | 2017
URI: http://hdl.handle.net/10125/41275ISBN: 978-0-9981331-0-2CC-BY-NC-ND

Patil and Hammerbacher first defined the term “data scientist” in 2008 while building analytics teams at LinkedIn and Facebook respectively. Four years later, Davenport and Patil described data science as the sexiest job of the 21st century [7]. How is data science different from traditional statistical analysis? One characteristic is its relationship to Big Data. Although the two are not the same, they are interrelated: Big Data is the fuel for data science. In the past, analytics was based on data sampling with a focus on the quality of the sample. In data science, the focus is on using all of the data. Because of cheap data storage, it’s now possible to justify keeping all of the data [14]. This approach has changed the way knowledge is discovered. Instead of formulating a hypothesis and then sampling the data to evaluate it, data scientists can search for unknown and unexpected patterns in the data. As Dhar notes [8], we have moved from asking of a dataset, “what data satisfies this pattern?” to asking “what patterns satisfy this data?” Using all of the data is enabled by the lower cost of storage, and as famously stated by Peter Norvig (Google’s Director of Research) in discussing their development of translation software, “We don’t have better algorithms than anyone else. We just have more data” [5].
This change in focus to using all of the data has significant implications on the data scientist’s job. Data is often coming from different sources and is “messy”; containing errors or missing values. This “messy” aspect of Big Data, along with an increasing use of external data, has led to data wrangling being a significant portion of the data scientist’s job. In fact, Davenport has more recently described data scientists as “data plumbers” [6] because up to 90% of their job is data wrangling which is getting the data ready for analysis. While Big Data analytics has been identified as one of the five critical research areas within MIS for business intelligence and analytics (BI&A) [4], and the development of analytics algorithms may get more research attention, data wrangling consumes much of a data scientist’s day.
Data wrangling shares similarities with the Extract-Transform-Load (ETL) processes used to prepare and load data into a data warehouse, but unlike ETL for data warehousing, where the specification of the target schema is an extensive process, Big Data projects often evolve faster and the tools are schema on query. Another significant issue is that 80% of Big Data is estimated to consist of unstructured and semi-structured data [11] and 70% of managers at companies with over 1,000 employees considered dealing with unstructured data to be a challenge going forward [9]. Data wrangling is not only a significant issue, but as noted by Patil [17],
“Good data scientists understand, in a deep way, that the heavy lifting of [data] cleanup and preparation isn’t something that gets in the way of solving the problem: it is the problem.”
The bulk of the data scientist’s effort involves transforming and profiling the data which is an iterative process in which the data is cleaned, structured, and enriched, and then profiled to learn about the data. The profiling often involves summary statistics and visualization. Finally, the data source and all of the transformations done to the data should be documented both to engender trust by management in the results and to enable reuse. This has led to a proliferation of tools to address these problems. Some of the leading tools have grown out of academic projects, such as Wrangler from Berkley [11] and Data Tamer from MIT [23], some are open source tools such as Google Refine [10], and many are part of the Hadoop ecosystem. For a partial overview of data wrangling tools, see [19]. For academic use, a number of tools are available through academic initiatives, freemium pricing models, or as developer editions. Since data wrangling is a significant portion of a data scientist’s job, introducing undergraduates to formulating data questions and using these tools to present an initial analysis of their question provides valuable skills. A course focused on data wrangling can provide undergraduate students with an introduction to data science and a recruiting advantage.
From an instructor’s perspective, a 2012 survey of 319 business school faculty teaching in fields related to data science [26] found that although more vendors have started academic alliances and provide both teaching materials and resources, a common concern was the need for better case studies and the number one challenge professors faced was access to adequate data sets. Similarly, a workshop convened in 2014 by the National Academies of Science on training students in Big Data identified the availability of data sets as an existing hurdle in teaching the topic [15]. In our course we overcame this limitation by building exercises around the Yelp Dataset Challenge [27] as described in the next section. 3. Methodology
In teaching Big Data to undergraduate MIS students, this course placed an emphasis on students formulating realistic business questions and then using Big Data tools in an iterative process against an actual semi-structured business dataset to wrangle the data and answer their questions. A secondary goal
1034

was to familiarize them with the processes and tools used in Big Data, but without requiring extensive prior technical skills. The undergraduate students would have taken an introductory course in business programming and had either taken a course in databases or were taking it concurrently.
The dataset from round seven of the Yelp Dataset Challenge [27] was used in these exercises and also in a semester-long team project. This dataset contains all of the Yelp reviews for businesses in 10 U.S., Canadian, and European cities. Data on each user who wrote these reviews is also included, along with data on each business reviewed. Although the dataset is not “Big Data” in the sense that Manyika et al. defined it, “datasets whose size is beyond the ability of typical database software tools to capture, store, manage, and analyze” [13], the data is semi-structured JSON and contains over 2.2 million reviews written by more than 550,000 users covering 77,000 businesses. This is a large enough dataset to get MIS students out of their comfort zone and make it difficult to fall back on familiar tools such as Microsoft Excel. In the exercises discussed here, students are also introduced to the concept of integrating external data sources - in this case a U.S. Social Security Administration (SSA) dataset containing the first names of men and women who have applied for a social security card since 1880 [22]. The Yelp Dataset Challenge is generally run twice per year and the dataset has grown over the years; prior rounds of the dataset were used in earlier versions of this class. 3.1. Identifying the business data need
We found that students think in terms of products, so when starting with social media data such as Yelp reviews, they think in terms of designing new mobile apps or designing new features for Yelp’s existing app instead of being data-driven and thinking first in terms of questions to ask of the data. To help students focus first on asking questions of the data, we use the CoNVO framework developed by Shron [21] to scope a data problem.
The CoNVO framework as proposed by Shron consists of four components; the Context, Need, Vision, and Outcome [21]. The framework defines a data problem as a Need (the question to be answered) in a particular Context (the business unit that is interested in an answer to the question). An initial mockup of what a potential answer to the question could look like is defined as the Vision and the process by which the result is put into production is the Outcome. The CoNVO framework provides multiple benefits in helping students refine their
question throughout the semester: (1) at the start of the project they must define a realistic business context within Yelp that would be interested in an answer to their question. This forces them to think of the context as being broader than a specific question, but also forces them to think of the data from the perspective of an actual business. (2) It emphasizes an iterative process common in data science and data wrangling whereby they must examine their data and refine their question. (3) It forces them to first think of a question that needs to be answered before thinking about a new product or product feature, and (4) by creating a mockup at the start of the process, it forces them to consider what success could look like; which helps in refining their question.
For their own semester projects, student teams use this framework and are responsible for defining the question (need) they want to answer, but in this exercise we provide the following “need”:
Are there gender differences in how men and women review restaurants and bars? Are their ratings similar? Do some restaurants or bars skew differently by gender in their ratings?
As a first step, we walk through a “kitchen-sink interrogation” [21] of our need, which is a process whereby the students try to think of every question the need raises. This is an exercise we do in class before the lab to get the students to think about the question (for their own questions we also do this as a cross-team exercise). The students will come up with many questions, but a few we want to be sure are considered include the following: Do we have gender for each user? If we do not have the user’s gender, is there a
proxy we could use? How do we know if a business is a bar or
restaurant? Do we have an equal number of male and female
reviewers? Are males and females both prolific at writing
reviews? Is there gender bias in review ratings generally?
In other words, are women or men “kinder” overall when reviewing a business?
The above questions guide the students towards starting to learn about their data and develop intuitions about the questions it can answer - a step that Patil and Mason identify as the “data scientific method” [18]. At this point we discuss the fields contained in the JSON data as described on the home page of the Yelp Dataset Challenge [27]. By reviewing the data definition and some sample records, the students realize the data does not contain the user’s gender, but it does contain each user’s name - possibly that could be used as a proxy for the
1035

user’s gender if we can match names with genders using an automated process.
In reviewing the Yelp data on businesses, students will see the data contains a “categories” field with a JSON array that in some cases contains the terms “Restaurants” and/or “Bars.” At this point we discuss that unlike some fields which are free text, Yelp has a controlled vocabulary that provides a hierarchy of categories used to describe businesses. In working through the controlled vocabulary with the students, they will see that there are top-level categories and “Restaurants” is one of those categories. The term “Bars” is not a top-level category, but is instead contained within the category “Nightlife.” Figure 1 shows the categories within Nightlife using the Neo4j graph database. We discuss how we could filter
based on these categories. For purposes of this exercise, we inform them that the categories field in the business data will include parent categories, so if a business is in the “Bars” category, the category field in the data for that business will also include “Nightlife.” It is important that the students understand that if they did not know this was the case, they would need to wrangle their data to check. At this point the students start to develop some basic understanding of how to develop an intuition about their data and the importance of understanding what their data contains. 3.2. Wrangling business, user, and review data
After reviewing the descriptions of the data files, and reviewing a few examples, the students realize they need three of the Yelp data files in addition to the SSA data – businesses, users, and reviews. Figure 2 shows the flow of the process. It should be noted that during the exercise the students will iterate through some of the transformation and profiling. In order to be able to profile the data in Hive on Hadoop, the students first need to wrangle the data and extract what they need from the JSON files to create comma-separated value (CSV) files to load into Hive. To do this we have them use two different data wrangling tools.
First, the students wrangle the business data to filter the data to include only those businesses that are a restaurant and/or a nightlife business. For this step we introduce Trifacta’s Wrangler [25] which is one of the more popular end-user data preparation
Figure 1: Yelp categories within “Nightlife”
Nightlife
Bars
Figure 2: Transforming and profiling as part of the data wrangling process
HDFS
Ambari
1036

tools on the market. Such end-user data prep tools are still relatively new as indicated by a 2015 report by the Aberdeen Group [12] which found that out of 175 organizations with data wrangling capabilities, only 15% made such tools available to a variety of users.
When students load the business JSON data into Wrangler, they will immediately see that it flattens the first layer of the JSON object for each business. Columns are automatically created for key / value pairs with the key as the column heading and the values for different businesses on separate rows. Since JSON is semi-structured, they will also see that not all of the columns are populated for each business. Since the value in the JSON file for the categories key is a JSON array (comma-separated values enclosed in square brackets), the values in the categories column are all JSON arrays. When the data is displayed (see Figure 3), Wrangler will load a sample of the data and will display some profiling of the data above each column. For the “open” column, the students will see that there are two values (true and false) and that the histogram shows most businesses have a value of true. This indicates whether the business is still operating or has permanently closed, but is an easy example to ask them to go determine the meaning of the column.
The students filter the data to include only businesses that are in the restaurant and nightlife categories. Similar to other end-user data prep software, Wrangler suggests transformations that can be done on a selected column. As students select columns or highlight values within a column, Wrangler will display different suggestions along the bottom of the screen. Students should be encouraged to explore these transformations. There is a script being created automatically on the right-hand side and they can revert to an earlier step by selecting that step in the script. For this exercise we want them to start getting familiar with the transform editor and the functions in Wrangler, so we have them add the “keep” function in as shown in Figure 3. This will keep only those records related to restaurants or nightlife businesses. After they complete the formula, Wrangler will highlight the rows to be kept. When the students click the button to add this step to the script, the preview sample will be filtered. We leave it to the student to then determine the transformations needed to delete unwanted columns.
To wrangle the user data, the students load the data into Google Refine [10], an open-source data wrangling tool. Although Trifacta’s Wrangler could be used in a commercial environment, the desktop version has a 100MB limit on the file size, so the user data file is too large. This also introduces the students to another approach to wrangling data. Due
to space constraints, we do not go into details here on using Google Refine, but for this exercise the students only need to extract the user’s ID and name. Although the data is in JSON format (each user is represented as a JSON object), the data should be loaded as a line-based text file and then the parseJson function should be used to add columns and extract the two fields needed. In other exercises we run through additional examples with the students of transforming the data using Google Refine. As they did with the business data, the students will generate a csv file of the transformed user data that can be loaded into Hive.
Wrangling the review data is the next step. However, the review data within the Yelp dataset is the largest file, and at 1.8GB, it’s too large to wrangle on the student desktop computers. For this exercise the students need to get the business ID, user ID, and rating for each review. This is fairly straight-forward using Apache Pig [2] which is part of the Hadoop ecosystem and included in the Hortonworks Hadoop sandbox that the students use on Azure. We made wrangling using Pig an optional step and provided an already wrangled file the students could use. 3.3. Integrating external data
One of the key characteristics of Big Data is that companies are integrating external data. For this exercise we have the students use a dataset made available by the SSA that contains the first names of social security card applicants since 1880. For each year the data provides the name and how many male and female applicants had that name. Names are only included if at least 5 applicants had that name in a given year (so Moon Unit, daughter of the musician Frank Zappa, is not in the data). The data is already in a CSV format, so the students do not need to
Figure 3: Filtering in Trifacta Wrangler
1037
extract it from JSON. The data is separated into files by year, so the data could be merged into a single file or loaded into Hive as separate files. At this point it can be pointed out to students that Hadoop works best with large files. In Hive the students will be doing additional transformations to the user data to enrich it with gender counts of each name from this data. 3.4. Transforming data on Hadoop
In both this exercise and throughout the semester the students used the Microsoft Azure Cloud platform. Under the Microsoft Educator Grant Program, faculty can sign up their class for Azure accounts where each student will receive a credit of $100/mo. for six months and faculty will receive a credit of $250/mo. for one year [16]. Compared to other initiatives, this provides greater cloud resources and does not require students to submit a credit card. The Azure platform includes some Big Data tools, and for a more advanced class Microsoft’s HD Insights which leverages Hortonworks Hadoop distribution would be an option. In this class we have students select the Hortonworks Hadoop sandbox VM from the Azure marketplace. Signing up for Azure and spinning up the Hortonworks sandbox is fairly straight-forward. Initially it uses the A4 VM configuration, which as of Spring 2016 was the equivalent of an 8-core machine with 14GB of memory. Later in the semester we had the students upgrade to an A7 configuration which has 56GB of RAM. Even with the A7 configuration, they could use Hadoop for up to 100 hours per month.
The Hortonworks VM has the Hadoop ecosystem installed, so in addition to other modules, it has Pig, Hive, and the Ambari web interface which provides monitoring, an easy interface for configuration changes, access to HDFS (the Hadoop file system), and an interface to run Hive queries and Pig scripts.
Students load data onto HDFS through the Ambari interface. Since they are not familiar with Hadoop, have them create a sub-directory in the /tmp directory (they will need to give all users on their VM permission to write to this directory so Hive can move the files). They need to define tables using the SQL-like syntax of HiveQL’s Data Definition Language (DDL). If they had a database course, this should look familiar. Following is the HiveQL for the SSA data: CREATE TABLE ssa_names_by_year ( Year INT, Name VARCHAR(100), Gender CHAR(1), Annual_count INT ) ROW FORMAT DELIMITED FIELDS TERMINATED BY ',';
The table definition is similar to SQL, but the last line tells Hive data will be loaded as CSV files. When loading the business data wrangled in Trifacta’s Wrangler they should use a format that takes into account that every field in the CSV file is enclosed in quotes and there is a header line with the column names. Depending on the columns they kept, one possible definition is as follows: CREATE TABLE IF NOT EXISTS business ( business_id CHAR(22), open CHAR(5), review_count INT, business_name VARCHAR(100), state CHAR(5), stars FLOAT) ROW FORMAT SERDE 'org.apache.hadoop.hive.serde2.OpenCSVSerde' STORED AS TEXTFILE TBLPROPERTIES("skip.header.line.count"="1");
This is a good point to emphasize to the students that unlike relational databases, Hive is schema on query, so the table definition is stored in Hive’s metastore, but when data is loaded, it is not validated against the schema. The following statement would load the SSA data: LOAD DATA INPATH '/tmp/yelp_data/names_by_year.csv' OVERWRITE INTO TABLE ssa_names_by_year;
If the SSA data is in multiple files, an asterisk can be used as a wildcard to load all of the files from a subdirectory. When students loaded the data to HDFS (particularly the review data), it will have taken a while, but at this point it is good to discuss why the Hive load statement ran quickly. Since Hive is schema on query, the load statement just picked the file up (like one of those carnival claw games) and dropped it into a directory on HDFS that Hive controls. It created a directory for the table, but it did no validation against the schema.
As part of this exercise, we have the students loading and transforming the data, enriching the data by creating new tables to total the number of times each name was used by men or women when applying for social security cards, and creating a table that combines the Yelp user data and the SSA data to indicate how many times each user’s name was used as a male or female name. Throughout this process, it is important to emphasize that as data is loaded, or a query does an insert, new files are created in folders in Hive and divided into chunks. On a production system, the chunks would also be replicated across multiple nodes (three by default). As the students create new tables, some students may raise a question as to why they are creating new tables instead of modifying the existing tables when enriching the data. If not, then it is good to ask them at this point. If they look at the HiveQL documentation, the DDL contains statements to alter the table, but it is helpful
1038
to ask the students what would happen to their data if they altered the table. Many students are surprised to learn the answer is “nothing”, but their queries will not work. HDFS provides many benefits as a distributed file system, but although they are taught that it is read-only, an example helps. Since Hive is schema-on-query the alter statement is just changing what they are telling Hive the data will look like at query time, but since their data does not change, the query would not return the correct results. 3.5. Profiling using Hive
Throughout the transformation process, students are also profiling the data. Here we cover just a couple examples. After the students have loaded the SSA data, we ask them if “Elizabeth” is a man’s name or a woman’s name. Most will answer that it’s a woman’s name, so we have them query the data. Many students are surprised to learn that across over a century of SSA data, a small but consistent percentage of the social security card applicants named “Elizabeth” were in fact male. As part of the transformation when combining the user and SSA data we have them add a field with a value 1-3 to indicate if the name was more often female (1), male (2), or unknown (3) because it did not appear in the SSA data. They also calculate a ratio for the dominant gender. As part of the profiling, we have them query for a sample of female names, and the results are not surprising. We also have them query for the users with names of unknown gender and they see that these are often single-character names or names such as “Fast Food”. As the last part of the exercise, we have them profile the data visually in Tableau. 3.6. Visually profiling data in Tableau
Just as end-user data preparation tools have started to see increased adoption, end-user analytics tools, and particularly visualization tools such as Tableau or Qlik have seen increased usage. These tools allow users to define SQL queries using a drag-and-drop approach. Tableau is one of the most popular tools, and through the Tableau for Teaching [24] initiative, each student gets a free license to the desktop version. Tableau also provides licenses for faculty and lab computers. In addition to being able to query local files, Tableau and similar tools can query remote data sources using an ODBC connection. We have the students install a Hortonworks ODBC driver (which is one of the easiest connector installations we have encountered). As depicted in Figure 2, students can connect directly
from Tableau to their Azure VM running Hadoop and Hive (they need to be sure the VM is running). This is a good point to emphasize the power of this to the students in that it can provide business analysts with the power to run Big Data queries. After upgrading their VM, they are running a server with 8 cores and 56GB of RAM on the East Coast (the Azure default) and accessing it from across the country via a web browser. As they create queries, these are sent over the ODBC connection to Hive, converted into MapReduce jobs, run on the server, and then the results are returned via ODBC and displayed on their desktop. This drives home to the students how this new approach can substantially drive the democratization of data in an enterprise environment.
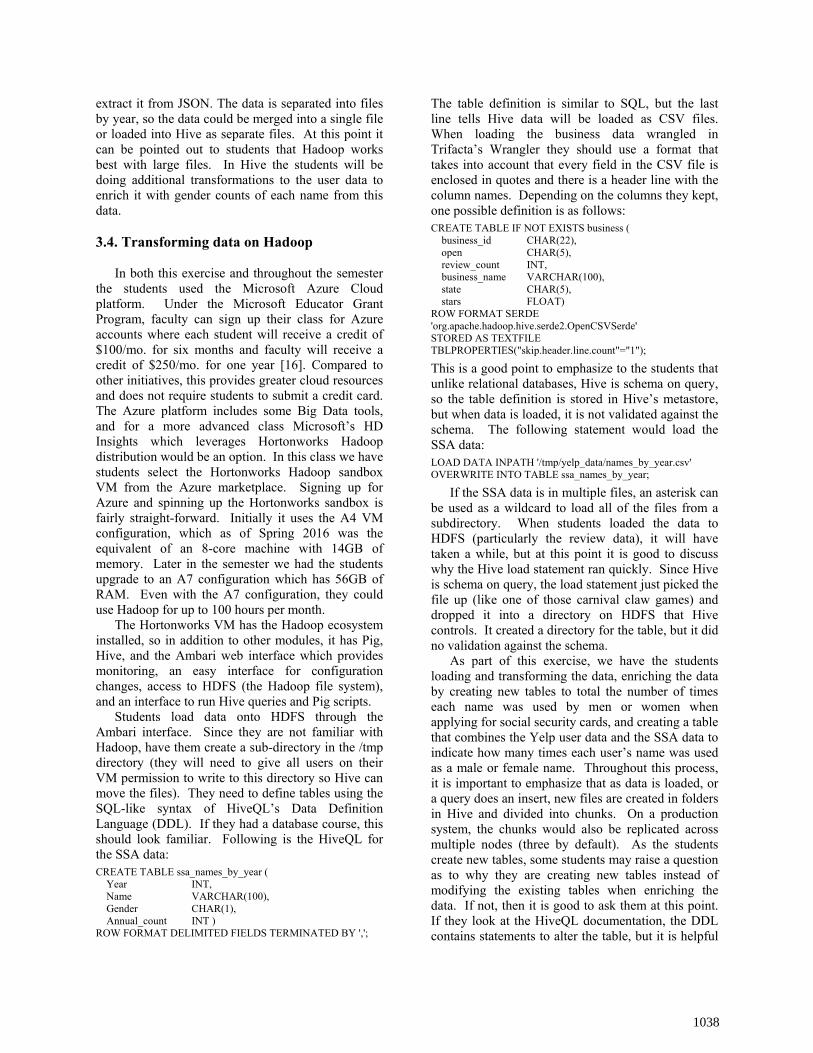
In Tableau we have the students join the enriched user data (that now contains an estimate of the user’s gender) with the review data for the restaurant and nightlife businesses. As a first step, the students do a quick profiling to see the number of users for which they could not estimate a gender. We also want to know whether most users have names that are predominantly male or female, or are there a lot of users with names that are of uncertain gender. At this stage the students create the graph shown in Figure 4, and as we can see, out of 550,000+ users, roughly 50,000 (about 9%) we are totally uncertain about the user’s gender. For those users with a name in the SSA data, the graph easily communicates that for most of the users, their name is one gender or the other over 95% of the time. As can be seen in the graph, of those users where we can estimate their gender, more were female than male, so as the next aspect to profile, we have them create a bar chart of the number of reviews by users in each of the three groups, and the ratios are similar across more than 1.4 million reviews.
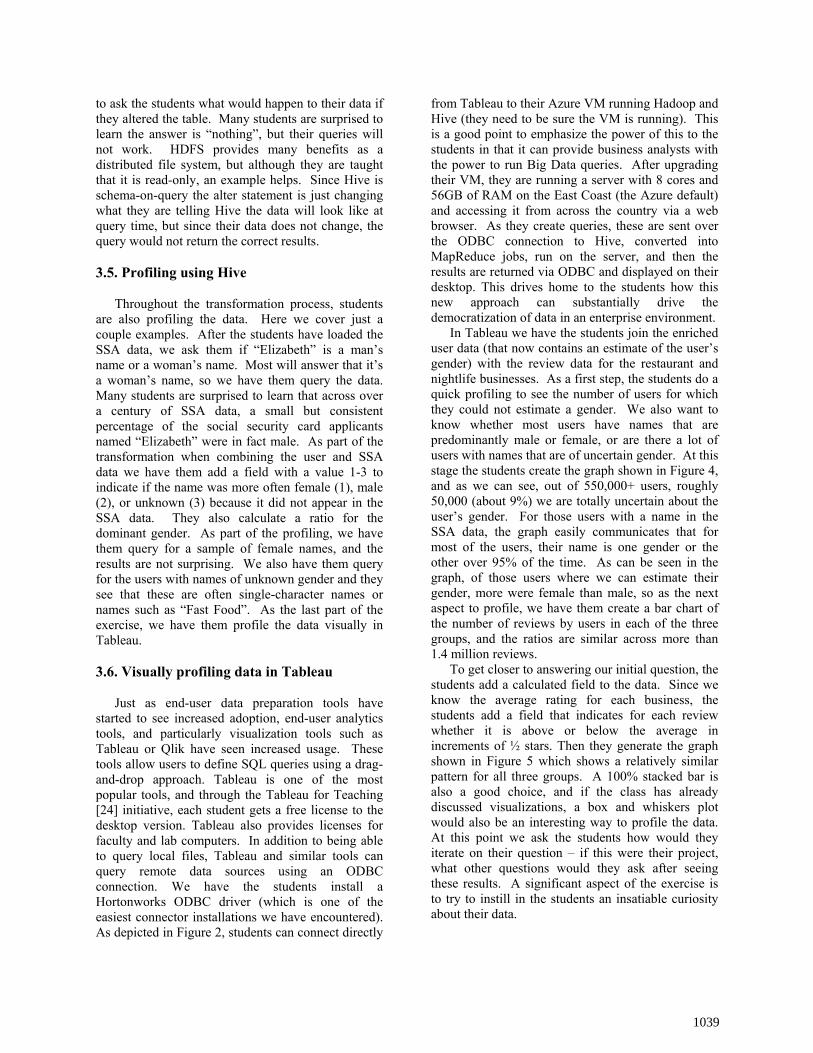
To get closer to answering our initial question, the students add a calculated field to the data. Since we know the average rating for each business, the students add a field that indicates for each review whether it is above or below the average in increments of ½ stars. Then they generate the graph shown in Figure 5 which shows a relatively similar pattern for all three groups. A 100% stacked bar is also a good choice, and if the class has already discussed visualizations, a box and whiskers plot would also be an interesting way to profile the data. At this point we ask the students how would they iterate on their question – if this were their project, what other questions would they ask after seeing these results. A significant aspect of the exercise is to try to instill in the students an insatiable curiosity about their data.
1039
4. Evaluation
The students used the CoNVO framework and these Big Data tools throughout the semester on 3-4 person teams to iterate over a data question they proposed. There were 23 teams (73 students), and the exercise was divided into 3 lab sessions focused on (1) data wrangling, (2) loading and querying data in Hive, and (3) visualizing the query results in Tableau. The second and third labs include more complex data wrangling and using ODBC to connect to Hive. The third session also included additional queries in Hive to profile the data. This provides a structured hands-on session to wrangle the data, become familiar with the process of transforming and profiling a dataset, and applying the CoNVO framework.
To evaluate the performance of students, we collected screen captures and scripts. Both Trifacta Wrangler and Google Refine generate scripts of the steps taken. These scripts are valuable data provenance (discussed in lecture), and a teaching assistant can rerun the scripts for grading. For queries and visualizations, students submitted screen captures. The purpose of the labs is to learn the tools and framework so that they can apply them to their projects. Most students earned 100% on the exercises and those that did not, generally had minor errors.
To evaluate if students felt confident in applying the tools in their projects, students completed an anonymous survey covering the lab and the tools learned. The responses as to whether students could apply the material in their own project were independently coded as having a high, medium, or low degree of confidence. These results are shown in Table 1. As an example of a response from a student who understood the lab assignment but was coded as a medium level of confidence in their ability to apply it going forward, one student wrote, “Through the lab, I learned the basics of these tools and I believe that it will be able to help with the semester project. The only thing is that those were just basic steps and it will take a bit of messing around to really understand how to use it to its full affect.”
In addition, the first two labs had extra-credit options for using Apache Pig to wrangle data and applying the tools to profile their project data respectively. While less than 50% of the teams attempted the extra-credit, most of those were successful in running Pig, but only 3 of the 10 teams were initially successful in profiling their data. Although students could understand that they should be able to profile their data, this was new to them. An additional assignment was added where they used these tools to profile two questions specific to their team’s project.
Figure 5: Profiling reviews by gender Figure 4: Profiling user data by gender
1040

Table 1. Student confidence in applying tool Lab High Medium Low
1:Wrangling 70% 27% 3% 2: Hive 75% 5% 20% 3: Tableau 64% 26% 10%
In parallel with the lab sessions, each team scoped
their data problem using the CoNVO framework and applied these tools. They went through an iterative process of first defining the initial context, need, and vision for their project (one week after the first lab), submitting a progress report mid-semester, and a final project presentation/paper at the end of the semester.
In the progress report and final report each team continued to refine the context, need, and vision (the final report omits the vision since the actual results are included). Table 2 shows the average scores across teams for the CoNVO framework components in each iteration.
Table 2. Scoping performance across iterations
CoNVO Component
Initial Scope
Progress Report
Final Report
Context 57% 78% 89% Need 65% 90% 91%
Vision 43% 88% n/a
A review of the final project reports identified which tools were used. Except where teams were able to partially use data wrangled in the lab, only two teams used both Trifacta’s Wrangler and Google Refine. Of the remaining teams, 58.3% used Data Wrangler and 41.6% used Google Refine. Only 1 team used Apache Pig in their project. All but one of the teams used Hive (one team used Data Wrangler to generate a CSV file they could load into Tableau as a file). All but one of the teams visualized their results in Tableau or Neo4j (a graph database we also covered). One team was unable to get their visualization to work in Tableau and used Excel. 4.1. Discussion
In respect to our first RQ the results were positive. Table 2 shows that through an iterative process student could learn and apply the CoNVO framework. Students struggle significantly initially, particularly in defining the context and vision. In the progress report, students grasped defining the vision faster than the context, and in the final report, 20 of 23 teams successfully defined the context.
As to the second RQ, can the lab exercises teach students unfamiliar with these tools to apply them to
their project, the results were positive. As Table 1 shows that after the lab sessions, the majority of students were confident that these tools could be applied to their projects. This confidence and learning was then successfully applied to the final projects. All of the teams used at least one of the data wrangling tools, 2 teams used both tools, and all but one team profiled their data in Hive. Furthermore, 22 of 23 teams successfully visualized their results with a Big Data tool learned in class. 4.2. Issues that arose in this exercise
Students who had not taken a database course may have been initially less confident about applying Hive to their project. Since we had a mix of SQL skill levels among the students, we had an SQL review session in an early lecture and provided additional materials for them to review, but having videos they could watch on their own time that covered some aspects of HiveQL may have helped even out the skill difference. We also had links to some of the documentation, but more links, and even team assignments where each team needs to figure out how to use one specific query function and present it to the class would be beneficial if there is time in the class. Some students found the HiveQL queries complex while others were clamoring for more advanced queries.
The Microsoft Azure credit of $100/mo. for each student’s account is generous (AWS is $100/semester), but students still need to shut down their VMs when they are not using them. Some students will forget and burn through their allocation, disabling their account for the rest of the month. Students worked as teams, so they could to share an account for the remainder of the month. We provided easy instructions for setting up a Linux cron job on their VM to send an email reminder when it is running.
Throughout the semester we ran into a couple memory limitations in Hive and Google Refine, but these were resolved relatively easily with minor configuration changes. In Hive we ran into memory limitations with the default settings on the sandbox, but changing the execution engine setting and upgrading from an Azure A4 VM which has 14GB of RAM to an A7 VM with 56GB of RAM (and more disk space) solved those issues.
5. Conclusion and future research
In discussing the path forward for BI&A in MIS programs, Chen et al. [4] emphasize the need for
1041

hands-on “learning by doing” and that big data analytics requires trial-and-error and experimentation. To introduce undergraduates to this topic, we use a set of exercises leveraging a real social media dataset that students can use to scope a business question and then wrangle the data in an iterative process. Although most BI&A programs and certificates are offered at the graduate level, exercises based on data wrangling, which can constitute 80% of a data scientist’s work, introduce undergraduates to this fast growing field. Although students found some of the work challenging in that they were learning a number of new methods and tools, overall the feedback has been positive.
Using an iterative approach with detailed feedback resulted in students showing considerable improvement in applying the CoNVO framework. In evaluating their initial need, we had student teams do a kitchen-sink interrogation of another team’s need. Many of the teams found this peer feedback beneficial, but an open issue is whether additional iterations on data profiling or the development of a team’s context, need, and vision could also be done using a peer-reviewed approach while students are learning the framework. 6. References [1] C.L. Aasheim, S. Williams, P. Rutner, & A. Gardiner, (2015). Data analytics vs. data science: A study of similarities and differences in undergraduate programs based on course descriptions. Journal of Information Systems Education, 26(2), 103-115. [2] Apache Pig. https://pig.apache.org [3] Balboni, F., Finch, G., Reese, C. R., & Shockley, R. (2013). Analytics: A Blueprint for Value. IBM Global Business Services. Late accessed 2016/06/08 http://www-935.ibm.com/services/us/gbs/thoughtleadership/ninelevers [4] H. Chen, R.H.L. Chiang, & V.C. Storey, 2012. Business Intelligence and Analytics: From Big data to Big Impact, MIS Quarterly, Vol. 36, No. 4, pp. 1165-1188. [5] S. Cleland, Google’s “Infringenovation” Secrets, Forbes, 2011.10.03, Last accessed 2016.06.11: http://www.forbes.com/sites/scottcleland/2011/10/03/googles-infringenovation-secrets https://help.ubuntu.com/community/CronHowto [6] T.H. Davenport, Taming the ‘Data Plumbing’ Problem, Wall Street Journal – CIO Journal, 2014, last accessed 2016.06.06: http://blogs.wsj.com/cio/2014/05/21/taming-the-data-plumbing-problem [7] T. H. Davenport & D.J. Patil, 2012. Data Scientist: The Sexiest Job of the 21st Century, Harvard Business Review, Vol. 90, No. 10, pp. 70-76. [8] V. Dhar, 2013. Data Science and Prediction, Communications of the ACM, Vol. 56, No. 12, pp. 64-73. [9] Digitizing the enterprise creates content transformation challenges: Big Data adds format complexity to the mix,
2014. Forrester Research. Last accessed 2016/06/06: http://www-01.ibm.com/common/ssi/cgi-bin/ssialias?htmlfid=WVL12358USEN [10] Google Refine. http://openrefine.org [11] S. Kandel, A. Paepcke, J. Hellerstein, & J. Heer. 2011. Wrangler: interactive visual specification of data transformation scripts. In Proceedings of the SIGCHI Conference on Human Factors in Computing Systems (CHI '11). Vancouver, B.C., pp. 3363-3372. [12] P. Krensky, 2015. Data Prep Tools: Goals, Benefits, and the advantage of Hadoop, Aberdeen Group. Last accessed 2016.06.13: http://aberdeen.com/research/10683/10683-RR-data-prep-Hadoop.aspx/content.aspx [13] J. Manyika, M. Chui, B. Brown, J. Bughin, R. Dobbs, C. Roxburgh, & A. Hung Byers. Big Data: The Next Frontier for Innovation, Competition, and Productivity. McKinsey and Company, Washington, D.C., 2011. [14] V. Mayer-Schonberger & K. Cukier, 2013. Big Data: A Revolution That Will Transform How We Live, Work, and Think. Houghton Mifflin Harcourt. [15] M. Mellody (rapporteur), Training students to extract value from Big Data: Summary of a workshop, National Academies Press, Washington, D.C., 2014. [16] Microsoft Educator Grant Program. https://azure.microsoft.com/en-us/community/education [17] D.J. Patil, Building Data Science Teams. O’Reilly Media, Sebastopol, CA, 2011. [18] D.J. Patil & H. Mason, Data-Driven: Creating a Data Culture, O’Reilly Media, Sebastopol, CA, 2015. [19] L. Randall, R. L. Sallam, B. Hostmann, & E. Zaidi, 2015. Market Guide for Self-Service Data Preparation for Analytics, Gartner. Accessed 2016.06.14: https://www.gartner.com/doc/reprints?id=1-2M322M2&ct=150828&st=sb [20] T. Rattenbury, J.M. Hellerstein, J. Heer, & S. Kandel, Data Wrangling: Techniques and Concepts for Agile Analytics, O’Reilly Media, Sebastopol, CA, 2015. [21] M. Shron, Thinking With Data, O’Reilly Media, Sebastopol, CA, 2014. [22] Social Security Administration. Last accessed 2016.06.07: https://www.ssa.gov/oact/babynames/names.zip [23] M. Stonebraker, G. Beskales, A. Pagan, D. Bruckner, M. Cherniack, S. Xu, I. F. Ilyas, & S. Zdonik, 2013. Data Curation at Scale: The Data Tamer System, Sixth Biennial Conference on Innovative Data Systems Research (CIDR 2013). Last accessed: 2016.06.11: http://cidrdb.org/cidr2013/Papers/CIDR13_Paper28.pdf [24] Tableau for Teaching. http://www.tableau.com/academic/teaching [25] Trifacta Wrangler. https://www.trifacta.com/products/wrangler [26] B. Wixom T. ArIyachandra, D. Douglas, M. Goul, B. Gupta, L. Iyer, U. Kulkarni, J. G. Mooney, G. Phillips-Wren, & O. Turetken, “The Current State of Business Intelligence in Academia: The Arrival of Big Data”, Communications of the Association for Information Systems, Vol. 34, No. 1, 2014, pp. 1-13. [27] Yelp Dataset Challenge. Round 7 last accessed, 2016/6/4: https://www.yelp.com/dataset_challenge
1042