Interpretation of AMS-02 electrons and positrons data · account as constraints on their emission...
34
Prepared for submission to JCAP Interpretation of AMS-02 electrons and positrons data M. Di Mauro, a,b,c F. Donato, a,b N. Fornengo, a,b R. Lineros, d and A. Vittino a,b,e a Dipartimento di Fisica, Università di Torino, via P. Giuria 1, 10125 Torino, Italy b Istituto Nazionale di Fisica Nucleare, Sezione di Torino, Via P. Giuria 1, 10125 Torino, Italy c Laboratoire d’Annecy-le-Vieux de Physique Théorique (LAPTh), Univ. de Savoie, CNRS, B.P.110, Annecy-le-Vieux F-74941, France d AHEP Group, Institut de Física Corpuscular, C.S.I.C. Universitat de València, Edificio Institutos de Paterna, Apt 22085, E-46071 Valencia, Spain e Institut de Physique Théorique, CNRS, URA 2306 & CEA/Saclay, F-91191 Gif-sur-Yvette, France E-mail: [email protected], [email protected], [email protected], rlineros@ific.uv.es, [email protected] Abstract. We perform a combined analysis of the recent AMS-02 data on electrons, positrons, electrons plus positrons and positron fraction, in a self-consistent framework where we realize a theoretical modeling of all the astrophysical components that can contribute to the observed fluxes in the whole energy range. The primary electron contribution is modeled through the sum of an average flux from distant sources and the fluxes from the local supernova remnants in the Green catalog. The secondary electron and positron fluxes originate from interactions on the interstellar medium of primary cosmic rays, for which we derive a novel determination by using AMS-02 proton and helium data. Primary positrons and electrons from pulsar wind nebulae in the ATNF catalog are included and studied in terms of their most significant (while loosely known) properties and under different assumptions (average contribution from the whole catalog, single dominant pulsar, a few dominant pulsars). We obtain a remarkable agreement between our various modeling and the AMS-02 data for all types of analysis, demonstrating that the whole AMS-02 leptonic data admit a self-consistent interpretation in terms of astrophysical contributions. LAPTH–008/14, SACLAY–T14/010 arXiv:1402.0321v2 [astro-ph.HE] 7 Apr 2014
Transcript of Interpretation of AMS-02 electrons and positrons data · account as constraints on their emission...

Prepared for submission to JCAP
Interpretation of AMS-02 electronsand positrons data
M. Di Mauro,a,b,c F. Donato,a,b N. Fornengo,a,b R. Lineros,d andA. Vittinoa,b,e
aDipartimento di Fisica, Università di Torino, via P. Giuria 1, 10125 Torino, ItalybIstituto Nazionale di Fisica Nucleare, Sezione di Torino, Via P. Giuria 1, 10125 Torino, ItalycLaboratoire d’Annecy-le-Vieux de Physique Théorique (LAPTh), Univ. de Savoie, CNRS,B.P.110, Annecy-le-Vieux F-74941, FrancedAHEP Group, Institut de Física Corpuscular, C.S.I.C. Universitat de València, EdificioInstitutos de Paterna, Apt 22085, E-46071 Valencia, SpaineInstitut de Physique Théorique, CNRS, URA 2306 & CEA/Saclay, F-91191 Gif-sur-Yvette,FranceE-mail: [email protected], [email protected], [email protected],[email protected], [email protected]
Abstract. We perform a combined analysis of the recent AMS-02 data on electrons, positrons,electrons plus positrons and positron fraction, in a self-consistent framework where we realizea theoretical modeling of all the astrophysical components that can contribute to the observedfluxes in the whole energy range. The primary electron contribution is modeled through thesum of an average flux from distant sources and the fluxes from the local supernova remnantsin the Green catalog. The secondary electron and positron fluxes originate from interactionson the interstellar medium of primary cosmic rays, for which we derive a novel determinationby using AMS-02 proton and helium data. Primary positrons and electrons from pulsar windnebulae in the ATNF catalog are included and studied in terms of their most significant(while loosely known) properties and under different assumptions (average contribution fromthe whole catalog, single dominant pulsar, a few dominant pulsars). We obtain a remarkableagreement between our various modeling and the AMS-02 data for all types of analysis,demonstrating that the whole AMS-02 leptonic data admit a self-consistent interpretation interms of astrophysical contributions.
LAPTH–008/14, SACLAY–T14/010
arX
iv:1
402.
0321
v2 [
astr
o-ph
.HE
] 7
Apr
201
4

Contents
1 Introduction 1
2 Sources of galactic positron and electrons 22.1 Primary electrons from SNR 22.2 Primary electrons and positrons from PWN 32.3 Secondary positron and electrons 5
3 The propagation of electrons and positrons in the Galaxy 6
4 Fit to AMS-02 data: method and free parameters 84.1 The case for secondary positrons 104.2 The case for pulsars cut-off energy 11
5 High-energy window and local sources 125.1 “Single-source” analysis 145.2 “Powerful-sources” analisys 17
6 Conclusions 19
1 Introduction
A huge experimental effort undertaken in the last decades has led to increasingly accuratemeasurements of cosmic rays (CRs) by means of space borne detectors. In particular, excellentdata have been provided for the positron fraction (e+/(e++e−)) and for the absolute positron(e+), electron (e−) and total (e+ + e−) CR spectra by the Pamela [1–3] and Fermi-LAT [4, 5]Collaborations. Very recently, also the AMS-02 Collaboration has provided its first data onthe positron fraction spectrum measured by the Alpha Magnetic Spectrometer installed onthe International Space Station [6], and preliminary results for the other leptonic observables[7, 8]. The data cover an energy range spanning from about one GeV up to hundreds of GeV,depending on the species.
The most direct interpretation of these data refers to secondary production from nuclearcollisions with primary CRs and the atoms of the interstellar medium (ISM), as well as togalactic astrophysical sources injecting fresh primary leptons into the ISM (see e.g. Ref. [9]and references therein, and Refs. [10–22]). The observed raise of the positron fraction, firstlyreported by the Pamela Collaboration and confirmed with higher precision by the AMS-02data, has stimulated an extensive speculation on a possible dark matter (DM) contributionat high energies [23–40].
In this paper, we explore at which level the new AMS-02 data on the whole leptonic ob-servables may be accommodated in a purely astrophysical (i.e. without invoking contributionsfrom exotic sources such as DM annihilation) scenario, which counts the contribution frompowerful stellar sources as well as from secondary reactions among primary CRs and atomsin the ISM. Specifically, we study the possible contribution that supernova remnants (SNRs)can give to high energy electron fluxes, and pulsar wind nebulae (PWN) to both positronand electron spectra. Whenever available, independent data on these sources are taken into
– 1 –
account as constraints on their emission properties. We also employ the new preliminaryAMS-02 data for proton and helium cosmic fluxes, in order to obtain a new evaluation of thesecondary e+ and e− fluxes. All these components are added together and propagated in theMilky Way. A key point of our analysis is the requirement for any theoretical model to fitsimultaneously all the four AMS-02 leptonic observables, namely the e+/(e+ + e−), e+, e−
and e+ + e− spectra. As we will show in next Sections, we find several astrophysical modelscompatible with all the AMS-02 leptonic data. Our results imply that a consistent and globalpicture of the Galaxy is possible, at least for the leptonic sector. Even more so, we showthat high precision, low energy positron data, such as the ones collected by AMS-02, are onthe verge of acting as a remarkable tool to constrain propagation models, and cooperate withthe boron-to-carbon observations to this fundamental task. Our analyses are all implementedby a thorough estimation of the underlying possible uncertainties. This method allows us toderive predictions on the AMS-02 data at very high energy, expected after some increase inthe collected statistics. As a final remark, we notice that our analysis indicates that there isno particular need to invoke DM annihilation in the halo of the Milky Way in order to explainhigh energy positron and electron data.
2 Sources of galactic positron and electrons
As a first step of our analysis, we describe and model the various possible galactic sources forpositrons and electrons. We can, as usual, identify two main categories: primary production,which refers to electrons and positrons directly injected in the galactic medium from astro-physical sources, like PWN and SNR; secondary production, which refers to electrons andpositrons produced from a spallation reaction of a progenitor cosmic ray in the Galaxy.
2.1 Primary electrons from SNR
SNR in our Galaxy are believed to be the major accelerators of charged particles up to veryhigh energies (at least 100 TeV), via a first-type Fermi mechanism [41–44]. Among acceleratedspecies there are also electrons. The mechanism of acceleration of cosmic rays through non-relativistic expanding shock-waves, activated by the star explosion, predicts power-law spectrawith a cut-off at high energies:
Q(E) = Q0
(E
E0
)−γexp
(− EEc
), (2.1)
where Q0 is the normalization of the spectrum, γ is the power-law index, Ec is the cut-offenergy which in our analysis we fix at Ec = 2 TeV, and E0 = 1 GeV is just a referencevalue. The values for the spectral index γ for electrons are typically found around 2 [41, 45],although they exhibit significant variations in analyses of radio data. Radio and gamma-rayobservations also indicate that Ec might be in the TeV range (see e.g. Ref. [46–50]). Thevalue of Q0 is by far non trivial to fix, but can in principle be estimated from radio data onsingle sources, assuming that the radio flux Bν
r at a specific frequency ν is entirely due tosynchrotron emission of the ambient electrons in the SNR magnetic field B [14, 51, 52]:
Q0 = 1.2 · 1047 GeV−1 (0.79)γ[d
kpc
]2 [ ν
GHz
](γ−1)/2[
B
100µG
]−(γ+1)/2 [Bνr
Jy
](2.2)
where d is the distance of the source from the observer. The well-known relation between theradio and electron flux index αr = (γ − 1)/2 is here manifest.
– 2 –

The most complete SNR catalog is provided by the Green catalog [53], where 274 SNRsare listed. Among them, 88 objects have a distance measurement, and 209 have an observedradio spectral index. Following the procedure described in Ref. [14], we can determine theaverage values for the relevant parameters for those 88 SNRs with a clear distance information.We obtain: 〈αr〉 = 0.50 ± 0.15, 〈d2B1Ghz
r 〉 = exp (7.1± 1.7) Jy kpc2. From these resultswe then infer: 〈γ〉 = 2 · 〈αr〉 + 1 = 2.0 ± 0.3. Moreover, fixing a typical magnetic field ofB = 30µG (adopted in the following of our analysis) [47, 52, 54–60], and employing Eq. (2.2),we estimate 〈Q0〉 = 9.0×1049 GeV−1 for an index γ = 2, which implies a total emitted energyof 〈E? · f · Γ?〉 = 8.9 × 1050 GeV = 1.4 × 1048 erg (for a cut-off energy Ec = 2 TeV), whereΓ? ≈ [2, 4] is the SN explosion rate [61, 62], E? is the kinetic energy released by the explosion,and f ≈ [10−5, 10−4] [42] is the fraction of this energy converted into electrons.
For the purposes of the analysis discussed in the next Sections, we divide the SNRpopulation into a near component, for sources lying at distances d ≤ 3 kpc from the Earth,and a far component, for sources located outside this region. For a discussion on the choiceof the separation distance between far and close sources, see Ref. [14]. In the catalog we find41 near-SNRs, out of which only 35 have a measured distance, age, radio flux and spectralindex. Therefore only these 35 sources have been taken into consideration in our analysis.These sources are listed in Tab. 1, where we report their characteristics: together with theGreen-catalog name and (when available) the association name, we list the radio flux at 1GHz B1Ghz
r , the radio index αr, the distance d and the age T . As done in Ref. [14] (notethat the critical distance, which separates near from far SNR, is now assumed to be 3 kpcinstead of 2 kpc), the near-SNRs are considered as single, independent sources, with theirtypical parameters fixed to the ones reported in Tab. 1 or derived via Eq. (2.2). The far-SNRpopulation is instead treated as an average source population, with typical parameters (Q0
and γ) fixed according to the analysis of Sect. 4, and following the radial profile derived inRef. [63].
2.2 Primary electrons and positrons from PWN
Pulsars, rapidly spinning neutron stars with a strong surface magnetic field, are consideredto be among the most powerful sources of electrons and positrons in the Galaxy [15, 153–157]. It is believed that the rotating magnetic field of the pulsar generates an intense electricfield that can tear particles apart from the neutron star surface. These charged particles canthen be accelerated and induce an electromagnetic cascade through the emission of curvatureradiation that, in turns, produces again particle/antiparticle pairs [158–160]. The star, andthe wind of charged particles that surrounds it, are initially located inside the remnants of thesupernova explosion that creates the pulsar. The impact of the relativistic wind produced bythe pulsar on the much slower ejecta of the supernova usually creates a reverse shock (the so-called termination shock) that propagates backwards, towards the pulsar [161]. In the regionbound by the wind termination shock on one side and the ejecta on the other side, a bubbleof relativistically hot magnetized plasma is created: this is the so-called pulsar wind nebula(PWN). The termination shock is also the place where the incoming pairs are accelerated tovery high energies. After acceleration, these particles enter the PWN and then are trapped bythe PWN magnetic field until it is disrupted. What is usually assumed is that the acceleratedparticles are completely released into the interstellar medium (ISM) after a time of about 50kyr from the nebula formation. As stressed in Ref. [162], since this injection is assumed to bequite fast and the subsequent energy emission of the pulsar negligible, a mature pulsar canbe treated as a burst-like source of e±. The emitted leptons can then reach the Earth with
– 3 –

Green Association B1GHzr [Jy] αr d [kpc] T [kyr] Refs.
G006.4-00.1 W28 287±27 -0.35 2.0±0.4 [33,150] [53, 64, 65]G018.9-01.1 37±2 -0.39±0.03 2 [4.4,6.1] [53, 66–69]G034.7-00.4 W44 213±11 -0.33±0.05 3.0 [10,20] [53, 66, 70–74]G065.3+05.7 52±2 -0.58±0.07 0.9±0.1 26 [53, 75–77]G065.7+01.2 DA495 4.88±0.25 -0.57±0.01 [1.0,1.8] 20 [53, 66, 78, 79]G069.0+02.7 CTB80 60±10 -0.36±0.02 2 20 [66, 80–83]G074.0-08.5 Cygnus loop 175±30 -0.40±0.06 0.58± 0.06 10 [53, 84–86]G078.2+02.1 DR4 275±25 -0.75±0.03 1.5±0.1 7 [53, 87–89]G082.2+05.3 W63 105±10 -0.36±0.08 [1.6,3.3] [13,27] [53, 81, 90, 91]G089.0+04.7 HB21 200±15 -0.27±0.07 1.7±0.5 5.6±0.3 [53, 81, 92–94]G093.3+06.9 DA530 7.0±0.5 -0.45±0.04 2.2±0.5 [5.2,6.6] [53, 81, 95, 96]G093.7-00.2 DA551 42±7 -0.52±0.12 1.5±0.2 [29,74] [53, 81, 97, 98]G109.1-01.0 CTB109 20.2±1.1 -0.45±0.04 3.0±0.5 [13,17] [53, 66, 81, 99–101]G113.0+0.2 3.8±1.0 -0.45±0.25 3.1 20 [53, 66, 102]G114.3+00.3 6.4±1.4 -0.49±0.25 0.7 7.7 [53, 60, 81, 103]G116.5+01.1 10.9±1.2 -0.16±0.11 1.6 [15,50] [53, 60, 81, 103]G116.9+00.2 CTB 1 7.9±1.3 -0.33±0.13 1.6 [15,50] [53, 60, 66, 81, 103]G119.5+10.2 CTA 1 42±3 -0.57±0.06 1.4±0.3 [5,15] [53, 104, 105]G127.1+00.5 R5 12±1 -0.43±0.10 1.0±0.1 [20,30] [53, 60, 81, 106, 107]G130.7+03.1 3C58 35±3 -0.07±0.02 3.0±0.2 [2.7,5.4] [53, 66, 81, 108, 109]G132.7+01.3 HB3 36±3 -0.59±0.14 2.2±0.2 30 [53, 81, 94, 110, 111]G156.2+05.7 5.0±0.8 -0.53±0.17 1.0±0.3 [15,26] [53, 81, 112–115]G160.9+02.6 HB9 88±9 -0.59±0.02 0.8±0.4 [4,7] [53, 60, 81, 92, 116]G180.0-01.7 S147 74±12 -0.30±0.15 1.47+0.42
−0.27 [30,40] [53, 92, 117–120]G184.6-05.8 Crab 1040 -0.3 2.0±0.5 [6,9] [53, 121]G189.1+03.0 IN 443 160±5 -0.36±0.04 1.5±0.1 [20,30] [53, 60, 92, 122, 123]G205.5+00.5 Monoceros 156±20 -0.47±0.06 1.63±0.25 [29,150] [53, 124, 124–127]G260.4-03.4 Puppis A 137±10 -0.52±0.03 2.2±0.3 3.7 [53, 128–131]G263.9-03.3 Vela(XYZ) 2000±700 variable 2.94+0.76
−0.50 11.3 [53, 53, 132–136]G266.2-01.2 Vela Jr ±4 -0.3 0.75 [1.7,4.3] [53, 137–140]G315.1+02.7 35±6 -0.7 1.7 [40,60] [53, 141, 142]G315.4-02.3 RCW 86 49 -0.61 2.3±0.2 10 [53, 55, 143–145]G327.6+14.6 SN1006 16±2 -0.6 2.2±0.1 [0.9,1.3] [53, 146–149]G330.0+15.0 Lupus loop 350 -0.5 1.2±0.4 [20,50] [53, 150, 151]G347.3005 4±1 -0.3 1 [1.6,4.9] [53, 59, 152]
Table 1. Characteristic parameters for our sample of near (≤ 3 kpc) SNRs: the columns report theGreen-catalog name, the association name, the radio flux at 1 GHz B1GHz
r , the radio index αr, thedistance d [kpc] and the SNR age T [kyr].
huge Lorentz factors (see, e.g., Ref. [163] for the Crab Nebula).In order to determine the flux of emitted electrons and positrons by a pulsar, we follow themodel described in Ref. [14] (and references therein) and remind here only the main ingredientsrelevant to our analysis. Nevertheless, we remark here that the actual process through whichthe electrons are injected from the PWN into the ISM is only very little known. As explainedin Ref. [164], the spectrum of electrons and positrons trapped inside the PWN can be inferred
– 4 –
by observing their broadband emission which is due to synchrotron radiation (at low energies)and to inverse Compton (IC) scattering off background photons (at higher energies). Thisbroadband spectrum shows a break between the radio and X-ray regimes which is believedto be the result of synchrotron cooling. However, even the time evolution of the electronsspectrum inside the PWN is not known: this means that the snapshot picture that onecan derive from the observation of the broadband spectrum of the emitted radiation is notnecessarily representative of the electron spectrum that eventually reaches the Earth. Thisis the reason for the large uncertainty that surrounds the parameters related to the e± fluxproduced by a PWN.
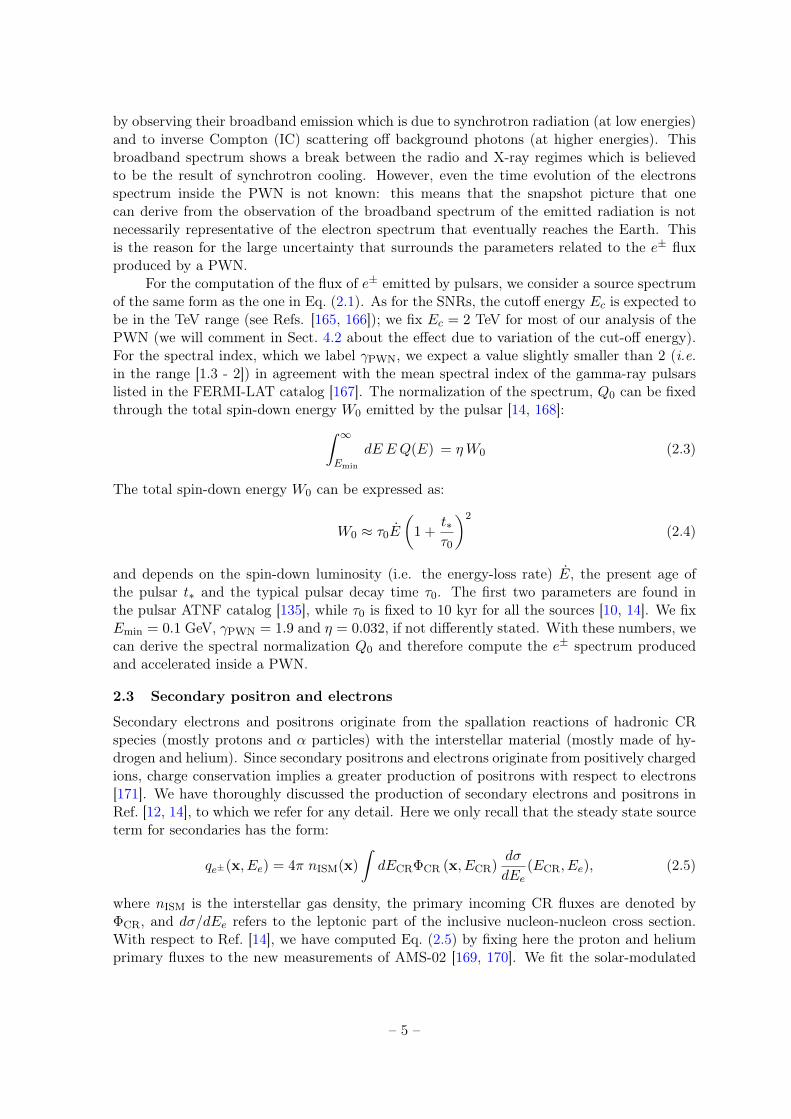
For the computation of the flux of e± emitted by pulsars, we consider a source spectrumof the same form as the one in Eq. (2.1). As for the SNRs, the cutoff energy Ec is expected tobe in the TeV range (see Refs. [165, 166]); we fix Ec = 2 TeV for most of our analysis of thePWN (we will comment in Sect. 4.2 about the effect due to variation of the cut-off energy).For the spectral index, which we label γPWN, we expect a value slightly smaller than 2 (i.e.in the range [1.3 - 2]) in agreement with the mean spectral index of the gamma-ray pulsarslisted in the FERMI-LAT catalog [167]. The normalization of the spectrum, Q0 can be fixedthrough the total spin-down energy W0 emitted by the pulsar [14, 168]:∫ ∞
Emin
dE E Q(E) = ηW0 (2.3)
The total spin-down energy W0 can be expressed as:
W0 ≈ τ0E
(1 +
t∗τ0
)2
(2.4)
and depends on the spin-down luminosity (i.e. the energy-loss rate) E, the present age ofthe pulsar t∗ and the typical pulsar decay time τ0. The first two parameters are found inthe pulsar ATNF catalog [135], while τ0 is fixed to 10 kyr for all the sources [10, 14]. We fixEmin = 0.1 GeV, γPWN = 1.9 and η = 0.032, if not differently stated. With these numbers, wecan derive the spectral normalization Q0 and therefore compute the e± spectrum producedand accelerated inside a PWN.
2.3 Secondary positron and electrons
Secondary electrons and positrons originate from the spallation reactions of hadronic CRspecies (mostly protons and α particles) with the interstellar material (mostly made of hy-drogen and helium). Since secondary positrons and electrons originate from positively chargedions, charge conservation implies a greater production of positrons with respect to electrons[171]. We have thoroughly discussed the production of secondary electrons and positrons inRef. [12, 14], to which we refer for any detail. Here we only recall that the steady state sourceterm for secondaries has the form:
qe±(x, Ee) = 4π nISM(x)
∫dECRΦCR (x, ECR)
dσ
dEe(ECR, Ee), (2.5)
where nISM is the interstellar gas density, the primary incoming CR fluxes are denoted byΦCR, and dσ/dEe refers to the leptonic part of the inclusive nucleon-nucleon cross section.With respect to Ref. [14], we have computed Eq. (2.5) by fixing here the proton and heliumprimary fluxes to the new measurements of AMS-02 [169, 170]. We fit the solar-modulated
– 5 –

101
102
103
104
100
101
102
103
104
(T)2
Φ [
Ge
V/n
ucle
on
m-2
s-1
sr-1
]
T [GeV/nucleon]
p and He
p AMS-02
He AMS-02
p fit
He fit
IS p fit
IS He fit
Figure 1. Primary interstellar (dot-dashed) and solar modulated (dashed) fluxes of protons (upperflux) and helium (lower flux) in function of the kinematic energy per nucleon T. Data points refer tothe recent AMS-02 measurements [169, 170], dashed lines show out best fit to the data sets.
data by assuming interstellar proton and He fluxes described by the function Φ = AβP1R−P2 ,where R = pc/Ze is the rigidity of the nucleus of charge number Z and momentum p,and solar modulation described by the force-field method. We obtain: A = 22450 ± 560m−2s−1sr−1(GeV/n)−1, P1 = 2.32 ± 0.56 and P2 = 2.8232 ± 0.0053 for the proton flux, andA = 5220 ± 110 m−2s−1sr−1(GeV/n)−1, P1 = 1.34 ± 0.27 and P2 = 2.6905 ± 0.0043 forthe helium flux (and for a Fisk solar modulation potential of 615 ± 30 MV). The results ofour fits on the primary proton and helium fluxes, compared to the AMS data, are shownin Fig. 1. The best-fit chi-squared value, for 236 data points and 7 degrees of freedom, isχ2/d.o.f. = 0.17. Let us mention that a determination of the interstellar proton spectrumfree from solar modulation effects could be derived by using diffuse γ-ray data: this techniquehas been disucssed and undertaken, in a preliminary analysis, in Refs. [172, 173], where abreak in the interstellar spectrum around a few GeV is found.
We consider the p-p cross section parameterization described in Ref. [171], which includesadditional processes (especially resonances other than the ∆ at low interaction energies) andhas been calibrated with recent data. For reactions including helium, both as a target and asthe incoming particle, we use the empirical prescription and the results described in Ref. [12].
3 The propagation of electrons and positrons in the Galaxy
Once produced in their respective sources, electrons and positrons propagate throughout theGalaxy, where they diffuse on the magnetic field inhomogeneities. Most importantly, theylose their energy by electromagnetic interactions with the interstellar radiation field (ISRF)through inverse Compton (IC) scattering, and by synchrotron emission on the galactic mag-netic field (notably, bremsstrahlung, ionization and Coulomb interactions on the interstellarmedium are negligible and can be safely neglected). The diffusion equation for the electron(positron) number density N = N (E, ~x, t) ≡ dn/dE may be written as (see Ref. [14] and
– 6 –

10-5
10-4
10-3
10-2
10-1
100
100
101
102
103
104
E3 Φ
[G
eV
2 c
m-2
s-2
sr-1
]
E [GeV]
SNR Contribution
SNR Tot ISSNR Tot
SNR d>3kpcSNR d<3kpc
VelaCygnus Loop
W 28CTB 1S 147
IN 443Monoceros
Vela Jr.G347.3-00.5
10-5
10-4
10-3
10-2
100
101
102
103
104
E3 Φ
[G
eV
2 c
m-2
s-2
sr-1
]
E [GeV]
PWN Contribution
ATNF PWN Tot ISATNF PWN Tot
Powerful PWN TotGeminga
J2043+2740B0355+54Monogem
J0538+2817J1908+0734
B1742-30J1741-2054
B1702-19
Figure 2. Left: Top of atmosphere electron flux (times E3) from the nine most powerful and close(≤ 3 kpc) SNRs (from Tab. 1), shown together with their sum (red dashed line). The green dashedline represents the electron flux from the far (> 3 kpc) SNR population, while the solid black line isthe sum of all the contributions. Right: Positron flux (the same occurs for electrons) from the ninemost powerful pulsars of the ATNF catalog, along with their sum (solid red line) and the sum of thefluxes of all the pulsars of the catalogue (solid black line). Galactic propagation with the MED model;solar modulation parameter φ = 830 MV. In both panels, the dot-dashed (violet) line refers to theinterstellar flux.
references therein):
∂tN − ~∇ ·{K(E)~∇N
}+ ∂E
{dE
dtN}
= Q(E, ~x, t) . (3.1)
where we have neglected the effect of convection and reacceleration [12]. In this equation,K(E) is the energy-dependent diffusion coefficient while dE/dt is the energy-loss term andQ(E, ~x, t) denotes the source term (discussed in the previous Section). The solution toEq. (3.1) is found within a semi-analytical model in which the Galaxy is shaped as a cylinder,made of the stellar thin disk (with half-height of 100 pc), and a thick magnetic halo whoseheight L varies from 1 to 15 kpc [174]. In our analysis we closely follow Ref. [14], to whichwe refer for any detail. We only remind here that we have included a full relativistic treat-ment of the IC energy losses, while for the synchrotron emission we have set the magneticfield to 1 µG. The spatial diffusion coefficient K(E) = βK0(R/1 GV)δ is set to one of thethree benchmark sets of parameters derived in Ref. [175] and compatible with the boron-to-carbon analysis [174]. Namely, for the MIN/MED/MAX models we fix δ = 0.85/0.70/0.46,K0 = 0.0016/0.0112/0.0765 kpc2/Myr and L = 1/4/15 kpc, respectively. Finally, for thesolar modulation affecting low energy (about < 10 GeV) charged CRs, we use the force fieldapproximation [176, 177], with a solar modulation parameter φ determined within our fittingprocedure on the electron and positron data sets. Apart from the force field approximation,more complex models, in which solar modulation is assumed to depend on the sign of theparticles charge, have been employed (see, for example, Refs. [178, 179]).
We show in Fig. 2 the electron and positron fluxes produced from SNR and pulsars,propagated according to the above prescriptions, for the MED propagation parameters. Theleft panel shows the electron flux from the nine most-powerful among the near (≤ 3 kpc aroundthe Solar System) SNRs, along with the sum of their single fluxes. The source parametershave been derived from Tab. 1, as explained in Sect. 2.1. We also plot the contribution fromthe average population of distant (> 3 kpc) SNR, whose spectral index γ and normalization
– 7 –

Q0 have been fixed to 2.38 and 2.75×1050 GeV−1, respectively, according to the results of thefit on the AMS-02 data explained in the next Sect. 4. As expected, the far SNRs contributepredominantly to the electron flux up to about 100 GeV, above which the local sourcesdominate. We observe that Vela(XYZ) – a near, young and strong radio-emitter SNR – is thedominant contributor, exhibiting an electron flux much higher than the other SNRs. In theright panel, we plot the positron flux (which is the same as for electrons) from the nine mostpowerful pulsars of the ATNF catalog, their sum and the sum of the fluxes of all the pulsarsof the catalogue. We display also the top of atmosphere (solid black line) and interstellar(dot-dashed violet line) total contribution for both SNR and PWN emission. Again, thesource parameters are fixed according to the analysis performed in Sect. 4: γPWN = 1.90and η = 0.032. The two highest fluxes in the AMS-02 high-energy range are provided byGeminga and J2043-2740, but do not really dominate over the other ones. We also observethat the flux of the most powerful PWN is indeed lower (by a factor of two up to an order ofmagnitude) than the flux provided by the whole PWN in the ATNF catalog. As a consistencycheck, we point out that our positrons and electrons interstellar fluxes appear to be in goodagreement with the determination of these fluxes given in Refs. [180] and [181] as the result ofan analysis based on synchrotron observations, thus completely independent from any detailconcerning solar modulation.
4 Fit to AMS-02 data: method and free parameters
The AMS-02 Collaboration has recently published data about the positron fraction (e+/(e+ +e−)) [6] and presented preliminary results on the electron, positron and electron plus positronflux [7, 8]. For the latter three quantities, for which a specific information on the experi-mental uncertainty is not currently available, we assume an energy independent error of 8%,comprehensive of statistical and systematic uncertainties. We employ all the four observables(e+ +e−, e−, e+, e+/(e+ +e−)) in order to explore whether a unique source-model can explainAMS-02 data.
Our model is built up by the components described in Sect. 2: i) electrons produced bynear SNRs treated as individual sources; ii) electrons from an average population of distantSNR; iii) electrons and positrons from PWN, considered as individual sources; iv) secondaryelectrons and positrons produced by the spallation of p and He primary cosmic rays. Forthe electrons produced by the closest (≤ 3 kpc) SNRs, we derive their source parametersaccording to the prescriptions given in Sect. 2.1 and employ the radio, distance and agedata listed in Tab. 1. For the electrons arriving to the Earth from the population of far(> 3 kpc) SNRs, we proceed as described in Sect. 2.1, leaving the spectral index γ and theoverall normalization Q0 as free parameters. The ATNF catalog pulsars are included here bymaking the simplifying hypothesis that they all shine with a common spectral index γPWN
and efficiency η, following the discussion outlined in Sect. 2.2. Finally, the secondary positronsand electrons are computed from the observed primary p and He (see Sect. 2.3), and do notdepend on any free parameter. However, we allow the normalization to be adjusted (by anoverall renormalization factor that we call here qsec) in the fit to the AMS-02 data, in orderto verify a-posteriori if the secondary positron production (determined by CR hadrons) isconsistent with the measured lepton data. In summary, the free parameters of the model are:γ, Q0, γPWN, η, qsec and φ, where the latter (the solar modulation potential) is let free inorder to accommodate low energy data. We jointly fit all the four datasets together.
– 8 –

10-3
10-2
10-1
100
101
102
103
104
E3 Φ
[G
eV
2 c
m-2
s-2
sr-1
]
E [GeV]
e-
3σ bandII
PWNSNR local
SNR d > 3 kpcTOT IS
TOTAMS-02
PAMELAFERMI
AMS-01HEAT
CAPRICE
10-4
10-3
10-2
100
101
102
103
104
E3 Φ
[G
eV
2 c
m-2
s-2
sr-1
]
E [GeV]
e+
3σ bandII
PWNTOT IS
TOTAMS-02
PAMELAFERMIHEAT
CAPRICE
10-3
10-2
10-1
100
101
102
103
104
E3 Φ
[G
eV
2 c
m-2
s-2
sr-1
]
E [GeV]
e+ + e
-
3σ bandII
PWNSNR local
SNR d > 3 kpcTOT IS
TOTAMS-02FERMI
ATICHEAT
CAPRICEBETSHESS
10-2
10-1
100
100
101
102
103
e+/(
e++
e- )
E [GeV]
e+/(e
++e
-)
3σ bandII
PWNTOT IS
TOTAMS-02
PAMELAFERMI
AMS-01HEAT
CAPRICE
Figure 3. Results of our simultaneous fit on the AMS-02 data for the electron flux (top left), positronflux (top right), electron plus positron flux (bottom left) and positron fraction (bottom right). Thebest fit model is represented by the solid black line, and is embedded in its 3σ uncertainty band (cyanstrip). In each panel, the dot-dashed yellow line represents the electron flux from the far (>3 kpc)SNR population, the dotted green line the electrons from the local SNRs, while the short dashed blueline describes the positron and electron flux from PWN and the long dashed red takes into accountthe secondary contribution to both electron and positron flux. The fit is performed on all the AMS-02data simultaneously. Together with our theoretical model, data from AMS-02 [6–8], Fermi-LAT [4, 5],Pamela [1–3], Heat [182–185], Caprice [186, 187], Bets [188, 189] and Hess experiments [46, 190] arereported. Long-dashed lines report the corresponding interstellar fluxes, before solar modulation.
In Fig. 3, we show the result of the fit on all the four leptonic observables: the fluxof electrons plus positrons, electrons, positrons and the positron fraction. The four panelsreport the total flux for each observable, together with the single subcomponents arisingfrom the different categories of sources. Fig. 3 also shows AMS-02 data and data fromprevious experiments. The best fit to each observable is shown as a solid line, embedded inits 3σ uncertainty band. The result of the analysis shows a quite remarkable agreement withAMS-02 data: this is confirmed by the value of the best-fit chi-squared: χ2/d.o.f. = 0.65,for 236 data points and 6 degrees of freedom. The best fit-values of the 6 parameters are:η = 0.0320± 0.0016, γPWN = 1.90± 0.03 for the PWN sources, Q0 = (2.748± 0.027)× 1050
GeV−1 and γ = 2.382± 0.004 for the far SNRs, the renormalization of e+ and e− secondarycontribution is qsec = 1.080 ± 0.026, and the Fisk potential turns out be 830 ± 22 MV. Thevalue of Q0 is similar to the one derived in Sec. 2.1 for the 88 sources of the Green catalogwith measured radio index, flux and distance.
The various electrons and positrons sources have different impact in the reconstruction
– 9 –

10-4
10-3
10-2
100
101
102
103
E3 Φ
[G
eV
2 c
m-2
s-2
sr-1
]
E [GeV]
e+
II MINPWN MINTOT MIN
II MEDPWN MEDTOT MED
II MAXPWN MAXTOT MAX
AMS-02PAMELA
FERMI
Figure 4. The positron spectrum for the MIN (red), MED (blue) and MAX (green) propagationmodels are displayed together with AMS-02, Fermi-LAT [4, 5] and Pamela [2] data. The theoreticalcontribution has been derived for the secondary (dashed), PWNs (dot-dashed) and total spectra(solid).
of the properties of the four set of observables. At high energies, local sources are the mostrelevant: SNR for the electron flux and the (e+ + e−) total flux, PWN for the positron fluxand, in turn, the positron fraction; at lower energies, far SNR are dominating the flux ofelectrons and of (e+ + e−) (this occurs for energies below about 100 GeV), while secondariesdetermine the positron flux and the positron fraction (for energies below 10-20 GeV). It istherefore remarkable that a single model for all the source components, for both positronand electrons, fits simultaneously all the leptonic AMS-02 data, without any further ad-hocadjustment. The best fit values found for the free parameters of SRN and PWN are in verygood agreement with the ones quoted in Sections 2.1 and 2.2.
Another quite interesting result concerns the positron flux interpretation. The secondarypositron component adopted in our analysis, as discussed above, depends only on the p and Heprimary fluxes (which we have determined by a separate, independent, fit on the recent AMS-02 data), on the nuclear cross sections involved in the spallation process and on propagationin the Galaxy. Therefore, this component does not require additional assumptions (like itis in the case of the SNR and PWN contributions, which have free unknown parameters),and is therefore somehow fixed once a specific propagation model is assumed. In order tocheck a posteriori the compatibility with the AMS-02 data, we have allowed the normalizationparameter qsec to freely vary: the fact that we find a best-fit value of qsec very close to one,for the MED propagation parameters, is a confirmation of the good level of consistency inthe analysis. A further discussion of the secondary positron component is given in the nextSection.
4.1 The case for secondary positrons
The positron spectra is interpreted in terms of a secondary production at low energy and of aPWNs emission at higher (>10 GeV) energies. As already recalled, the secondary positronsdepend on their progenitor p and He spectra, on the involved spallation cross sections, andon the propagation in the Galaxy. The uncertainties of the first two ingredients are definitelysmaller than the ones induced by propagation. We study here the effect of the different MIN,
– 10 –

10-4
10-3
10-2
100
101
102
103
104
E3 Φ
[G
eV
2 c
m-2
s-2
sr-1
]
E [GeV]
e+
II3σ band Ec=1 TeV
3σ band Ec=10 TeVPWN Ec=1 TeV
PWN Ec=10 TeVTOT Ec=1 TeV
TOT Ec=10 TeVAMS-02
PAMELAFERMI
10-2
10-1
100
100
101
102
103
e+/(
e++
e- )
E [GeV]
e+/(e
++e
-)
II3σ band Ec=1 TeV
3σ band Ec=10 TeVPWN Ec=1 TeV
PWN Ec=10 TeVTOT Ec=1 TeV
TOT Ec=10 TeVAMS-02
PAMELAFERMI
Figure 5. Positron flux (left) and positron fraction (right) for two different extreme values of thecut-off energy of pulsars: Ec = 1 TeV (lower red curve) and Ec = 10 TeV (upper blue curve). Thecurves show the best-fit agreement with the whole AMS-02 data set; the band around each curverepresents the 3σ allowed range. AMS-02 [6, 7], Fermi-LAT [4, 5] and Pamela [1, 2] data are displayedtogether with theoretical expectations.
MED and MAX models described in Sect. 3 on the secondary and PWN positrons. Thistheoretical emission is then compared with the e+ spectrum measured by AMS-02 [7].
We derive the secondary and PWNs production of positrons considering the MIN, MED,MAX propagation models and fit the measured spectrum of positrons with the Fisk potentialφ, the efficiency η and the index γPWN for PWN as free parameters. We have allowed the Fiskpotential to vary in the range (0.6, 1.0) GV, in accordance to results1 of combined analysis ofproton and helium spectra correlated with neutron monitors data [191, 192], and compatiblewith our determination for the AMS-02 data taking period derived in Sect. 2.3 with the fiton AMS-02 proton and helium fluxes.
The positron spectra are displayed in Fig. 4 for MIN, MED and MAX models, and forthe secondary, PWNs and total spectra. The best fit values for the Fisk potential are 0.6, 0.77and 1.0 GV, for the PWNs efficiency 0.011, 0.032 and 0.087 while for γPWN are 1.43, 1.90 and2.08 for the MIN, MED, MAX respectively. Notice that in the case of MIN and MAX the Fiskpotential best fit values are the minimal and maximal allowed in this analysis. The best-fitchi-squared is for 56 data points and 3 degrees of freedom χ2/d.o.f. = {2.43, 0.66, 4.62} forthe MIN, MED, MAX. We see that the MED set of parameters predicts a positron spectrumfully compatible with the data, as previously derived in Sect. 4. On the other hand, theMIN (MAX) are not compatible with the data, mostly because of the low energy secondarypositrons, which depend sensibly on galactic diffusion. We have checked that one would needto renormalize the secondary component by a factor qsec = 0.72 (1.78) for the MIN (MAX)cases, in order to reproduce the e+ AMS-02 measurements below 10 GeV. Remarkably, theMIN model predicts an exceedingly high positron flux and indicates that a small halo sizetogether with a very soft diffusion coefficient are strongly disfavored by low energy positrondata.
4.2 The case for pulsars cut-off energy
The high-energy part of the positron data (positron flux and positron fraction) is of specialinterest, since it might disclose relevant information on their source (including a very intrigu-
1http://cosmicrays.oulu.fi/phi/Phi_mon.txt
– 11 –

ing dark matter origin). We have examined the impact of the uncertain cut-off energy inpulsar emission. Fig. 5 shows the positron flux and the positron fractions calculated undertwo extreme situations (which encompass the case adopted in all other analysis in this paper,i.e. Ec = 2 TeV): the lower red curve shows the best-fit to the whole AMS-02 data whenwe assume Ec = 1 TeV; the upper blue curve is the best-fit obtained when Ec = 10 TeV.The band around each curve represents the 3σ allowed range. We notice that current data,which extend up to about 300 GeV, can be explained remarkably well for a wide interval ofvariation for Ec: they are not yet sensitive to the drop expected from the exponential cut-off,and the expectation for the positron flux and for the positron fraction above the currentAMS-02 highest energy, suggest a either a mild decrease (for Ec close to 1 TeV) or even analmost constant value up to energies well above the TeV scale (for Ec close to 10 TeV). Anincrease in positron fraction is not likely to be expected in the 300− 1000 TeV energy range.Notice that the positron fraction at these energies depends also on the cut-off energy of SNR,discussed in Sect. 2.1: however, the electron+positron flux measured up to energies of fewTeV by HESS, points toward a value around 2 TeV (as can be seen in Fig. 3) and therefore itdoes not appear to be allowed to substantially vary, and therefore alter the positron fractionshown in Fig. 5. We also wish to comment that the two extreme values adopted here for thepulsars cut-off energy are representative cases, adopted to encompass the possible maximaleffect. Expected values for Ec should be more close to a few TeV, at most.
From Fig. 5 we can also observe that a sharp drop in the positron observables just abovethe current AMS-02 highest energy could hardly be attributed to a pulsar origin: it wouldtherefore represent an interesting clue to a positron exotic origin, like dark matter annihilationor decay in a hard production channel. On the contrary, if pulsars are a major contributor atthe current experimental energies, it would be difficult to have a clear signal of dark matterat higher energies, unless dark matter is very heavy.
5 High-energy window and local sources
In this Section we attempt additional analyses of the full set of AMS-02 observables, witha special attention to the interpretation of the higher energy window. Data above about 10GeV are of special interest, since they clearly show a rise in the positron fraction, which is dueto a positron production at high energies much larger than what is expected by secondaryinteractions only. The analysis of Sect. 4 shows that this can be ascribed to the positronemission from local pulsars. In Sect. 4 we considered the whole integrated contributionfrom the PWN reported in the ATNF catalog, where each pulsar was tuned to its catalogparameters as far as the spin-down energyW0 is concerned, while the spectral index γPWN andthe efficiency η of e± emission were allowed to vary, but they were assumed to be common toall the PWN in the catalog (the actual values of these two parameters were then determinedby the fit).
In this Section we attempt a more detailed inspection of the PWN contribution, andto this aim we carry out two different analyses, with somewhat opposite strategies. In thefirst approach (called “single-source” analysis) we try to understand if a single, powerful,pulsar among the ones present in the ATNF catalog, is able alone to properly explain thehigh-energy part of the AMS-02 data, still retaining, in the global analysis, a good agreementin the whole energy range: in fact, we include in our analysis all the electron and positronsources and analyze the whole energy range for all the four AMS-02 observables, one of whichis the single-source PWN. It is a global-fit to the AMS-02 data, where the PWN contribution
– 12 –
101
102
103
104
105
10-1
100
T [kyr]
d [kpc]
γ = 1.5
ηW0 = [1046
,1047
] ergηW0 = [10
47,10
48] erg
ηW0 = [1048
,1049
] ergηW0 = [10
49,10
50] erg
ηW0 = [1050
,1051
] ergPWN ATNF cataloguePWN near and young
101
102
103
104
105
10-1
100
T [kyr]
d [kpc]
γ = 1.8
ηW0 = [1046
,1047
] ergηW0 = [10
47,10
48] erg
ηW0 = [1048
,1049
] ergηW0 = [10
49,10
50] erg
ηW0 = [1050
,1051
] ergPWN ATNF cataloguePWN near and young
101
102
103
104
105
10-1
100
T [kyr]
d [kpc]
γ = 2.0
ηW0 = [1046
,1047
] ergηW0 = [10
47,10
48] erg
ηW0 = [1048
,1049
] ergηW0 = [10
49,10
50] erg
PWN ATNF cataloguePWN near and young
101
102
103
104
105
10-1
100
T [kyr]
d [kpc]
γ = 2.2
ηW0 = [1046
,1047
] ergηW0 = [10
47,10
48] erg
ηW0 = [1048
,1049
] ergPWN ATNF cataloguePWN near and young
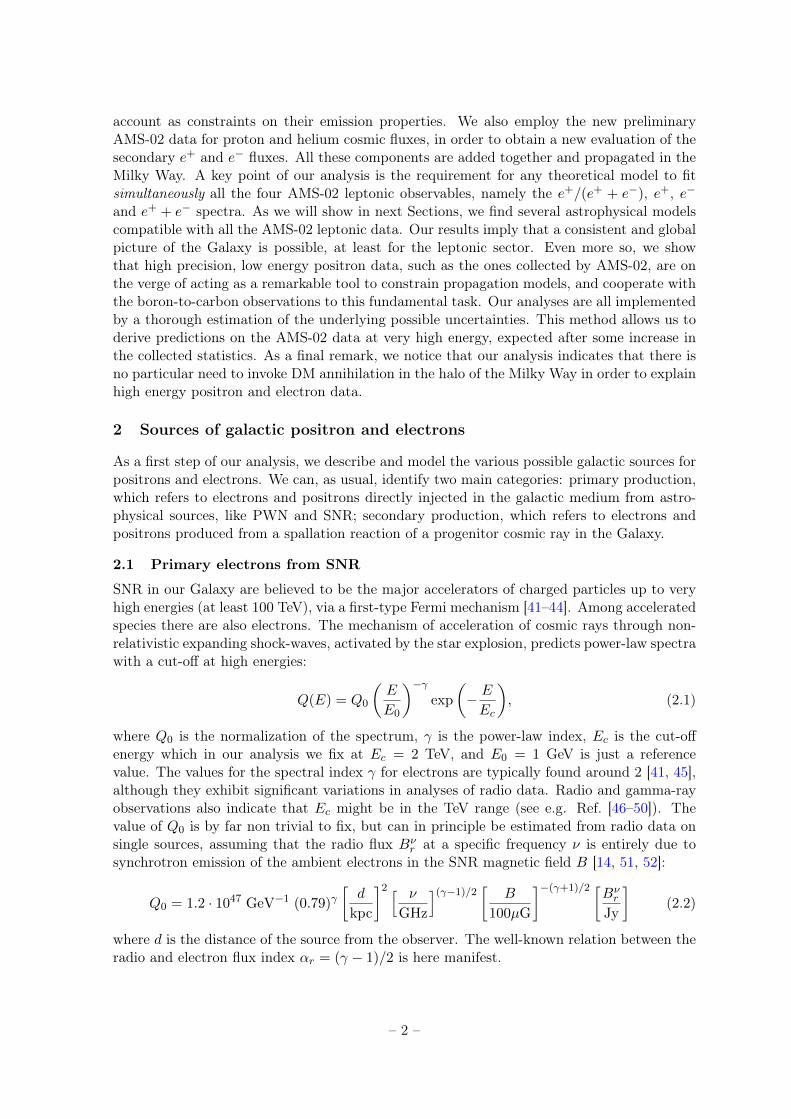
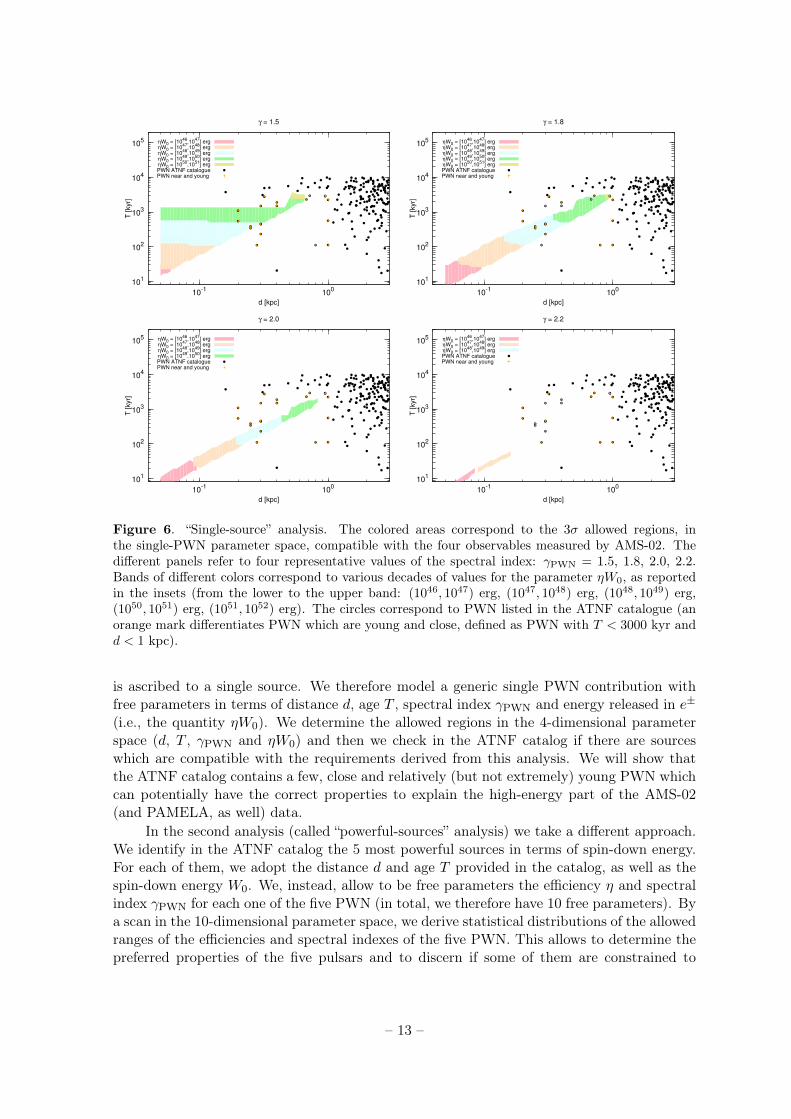
Figure 6. “Single-source” analysis. The colored areas correspond to the 3σ allowed regions, inthe single-PWN parameter space, compatible with the four observables measured by AMS-02. Thedifferent panels refer to four representative values of the spectral index: γPWN = 1.5, 1.8, 2.0, 2.2.Bands of different colors correspond to various decades of values for the parameter ηW0, as reportedin the insets (from the lower to the upper band: (1046, 1047) erg, (1047, 1048) erg, (1048, 1049) erg,(1050, 1051) erg, (1051, 1052) erg). The circles correspond to PWN listed in the ATNF catalogue (anorange mark differentiates PWN which are young and close, defined as PWN with T < 3000 kyr andd < 1 kpc).
is ascribed to a single source. We therefore model a generic single PWN contribution withfree parameters in terms of distance d, age T , spectral index γPWN and energy released in e±
(i.e., the quantity ηW0). We determine the allowed regions in the 4-dimensional parameterspace (d, T , γPWN and ηW0) and then we check in the ATNF catalog if there are sourceswhich are compatible with the requirements derived from this analysis. We will show thatthe ATNF catalog contains a few, close and relatively (but not extremely) young PWN whichcan potentially have the correct properties to explain the high-energy part of the AMS-02(and PAMELA, as well) data.
In the second analysis (called “powerful-sources” analysis) we take a different approach.We identify in the ATNF catalog the 5 most powerful sources in terms of spin-down energy.For each of them, we adopt the distance d and age T provided in the catalog, as well as thespin-down energy W0. We, instead, allow to be free parameters the efficiency η and spectralindex γPWN for each one of the five PWN (in total, we therefore have 10 free parameters). Bya scan in the 10-dimensional parameter space, we derive statistical distributions of the allowedranges of the efficiencies and spectral indexes of the five PWN. This allows to determine thepreferred properties of the five pulsars and to discern if some of them are constrained to
– 13 –

possess specific features or, at the opposite, if the data are somehow blind to PWN properties(all this, we recall, under the hypothesis that the 5 most powerful PWN are the dominantcontributors). We will find that in this context, Geminga is required to have a relatively softemission spectrum and a relatively large efficiency, regardless of the properties of the otherfour pulsars, which instead are allowed to span a broad band of values both for the efficiencyand for the spectral index.
Finally, we extend the “powerful-sources” analisys to comprise an additional component,represented by all the other PWN listed in ATNF catalogue (a sort of additional “PWN back-ground”): while we assume for all of them the position, age and spin-down energy reportedin the catalog, we attribute to them a common spectral index and efficiency. We thereforerepeat the analysis with a 12-dimensional parameter space and derive the statistical distri-bution of the values which allow a good fit to the AMS-02 data. In this case, we will obtainthat the prominent role of Geminga is reduced (its efficiency can now be smaller than in theprevious case) but the additional “backgound” pulsars are constrained to possess relativelysmall efficiencies.
Let us move now to the discussion of the two types of analyses.
5.1 “Single-source” analysis
In the “single-source” analysis we attempt to reproduce the full set of AMS-02 data by invokinga single PWN contributing to the high-energy part of the positron flux. While the SNRcontribution and the secondaries are fixed at their best-fit configuration determined in Sect. 4,pulsar emission is attributed to a single source, for which we vary the spectral index γPWN
in the interval [1.4, 2.2], the distance d in [0.01, 3] kpc, the age T in [1, 20000] kyr, andthe power emitted in the electron/positron channel ηW0 in [1046, 1051] erg (η representingthe efficiency of emission in this channel). We therefore determine the regions in this 4-dimensional parameter space which are able to reproduce the AMS-02 observables. The fourpanels of Fig. 6 show the 3σ allowed regions in the plane distance-age, at different valuesof the spectral index (γPWN = 1.5, 1.8, 2.0, 2.2) and for various decades of values for theparameter ηW0, depicted by bands of different colors (from the lower to the upper band:(1046, 1047) erg, (1047, 1048) erg, (1048, 1049) erg, (1050, 1051) erg, (1051, 1052) erg). In our4-dimensional parameter space, the best-fit configurations has a reduced-χ2 of 0.45 for 236data points and 6 degrees of freedom, and the regions denote the 3σ allowed area. The figureshows that, regardless of the spectral index, only local (closer than about 1 kpc) and young(age below about 3000 kyr) sources are compatible with the AMS-02 data, and that very softspectra would require extremely young and close PWN.
We can now verify if in the ATNF catalog we can identify sources which have the rightproperties to explain the AMS-02 leptonic data. This is obtained by reporting, in the samepanels of Fig. 4, the position and age of all observed PWN with d ≤ 3 kpc and T ≤ 10000kyr (an orange mark differentiates PWN which are young and close, defined as objects withT < 3000 kyr and d < 1 kpc). We can see that, depending on the spectral index and on theemission power, we can identify 9 PWN which are potentially able to explain the AMS-02data with a high level of confidence These PWN are listed in Tab. 2, together with theircatalog name and parameters. Tab. 2 also shows, for different allowed spectral indexes, theallowed interval for the effective emission power (in the electron/positron channel) ηW0,fit
determined by our fit (in units of 1049 erg). From the information on the total emitted powerW0,cat, we can infer information on the efficiency ηfit required by these sources in order to
– 14 –

reproduce the data:
ηfit =ηW0,fit
W0,cat(5.1)
The last columns of Tab. 2 reports the allowed intervals obtained for ηfit: we notice that inmost of the cases the required emitted power is too large (i.e. ηfit is too large, even much largerthan 1) as compared to observations. However, and most notably, in a few cases the requiredvalues of the efficiency are quite reasonable: this occurs for Geminga, for which efficiencies ofthe order of 0.3− 0.4 are obtained for a wide interval of spectral indexes (ranging from 1.5 to1.9); for B1742-30, where efficiencies of the order of 0.6 are possible in the case of hard spectra(γPWM ∼ 1.6−1.7); and for J1741-2054, with ηfit ∼ 0.6 for γPWM ∼ 1.7−1.8. All other PWNinstead appear quite disfavored. Although in Tab. 2 we emphasize (in boldface) all solutionswith γPWM < 2, to account for possible uncertainties in the determination of the emittedpower W0,cat, we nevertheless conclude that a “single-source” solution to the AMS-02 data isindeed possible, but only for a very limited number of PWN, namely Geminga [10, 193, 194],B1742-30 or J1741-2054.
For those three emitters, plus J1918+1541 which is the only remaining candidate whichadmits solution with γPWM < 2, we show in Tab. 3 their best-fit solutions: it is remarkable(although expected from the above analysis) that the best-fit values for the distance andage of the sources reported in Tab. 3 are quite close to the corresponding values in theATNF catalog. From Tab. 3 we can conclude that in the case of a single-source contributor,Geminga appears to be best option, with a derived spectral index γPWN = 1.74 and efficiencyη = 0.27. The electron, positron, electron+positron fluxes and the positron flux obtainedwith the Geminga solution are shown in Fig. 7.
– 15 –

Name dcat Tcat W0,cat γPWN ηW0,fit ηfit
B1742-30 0.20 546 0.829 1.4 (0.85,1.2) (1.0,1.5)1.5 (0.61,1.00) (0.79,1.2)1.6 (0.52,0.85) (0.63,1.0)1.7 (0.52,0.61) (0.63,0.74)
B1749-28 0.20 1100 0.700 1.4 (2.3,3.2) (3.3,4.6)1.5 (1.9,2.7) (2.71,3.86)1.6 (1.4,1.9) (2.0,2.7)
Geminga 0.25 342 1.25 1.5 (0.44,0.61) (0.35,0.41)1.6 (0.32,0.52) (0.26,0.42)1.7 (0.27,0.44) (0.22,0.35)1.8 (0.27,0.37) (0.22,4.57)1.9 (0.32,0.37) (0.26,0.30)
J1741-2054 0.25 386 0.470 1.5 (0.44,0.61) (0.94,1.1)1.6 (0.32,0.52) (0.68,1.1)1.7 (0.27,0.44) (0.57,0.94)1.8 (0.27,0.52) (0.57,1.1)
B0959-54 0.30 443 0.044 1.5 (0.72,0.85) (16,19)1.6 (0.44,0.85) (10,19)1.7 (0.44,0.72) (10,16)1.8 (0.44,0.61) (10,14)1.9 (0.37,0.52) (8.4,12)
B0940-55 0.30 461 0.217 1.5 (0.72,0.85) (3.3,3.9)1.6 (0.44,0.85) (2.0,3.9)1.7 (0.44,0.72) (2.2,3.3)1.8 (0.44,0.61) (2.0,2.8)1.9 (0.44,0.52) (2.0,2.4)
B0834+0 0.72 2970 0.364 1.6 (8.4,10) (23,28)1.7 (7.2,8.5) (20,4.23)
J1918+1541 0.68 2310 3.39 1.6 (6.1,10) (1.8,2.9)1.7 (5.1,8.5) (1.5,2.5)1.8 (4.4,6.1) (1.3,1.8)1.9 (6.1,7.2) (1.8,2.2)
B1822-09 0.30 232 0.0849 1.8 (0.19,0.27) (2.2,3.2)1.9 (0.23,0.32) (2.7,3.8)2.0 (0.23,0.32) (2.7,3.8)2.1 (0.32,0.37) (3.8,4.4)
Table 2. “Single-source” analysis. List of the pulsars reported in the ATNF catalogue whose distanceand age lie inside the regions of parameter space compatible with AMS-02 measurements, identifiedby our single-source analysis (for a few representative values of the spectral index γPWN, these pulsarsare those shown in Fig. 6 which fall inside the reconstructed regions). The columns report the pulsarcatalog name, the distance dcat (in kpc), age Tcat (in kyr) and total emitted power W0,cat (in units of1049 erg) reported in the ATNF catalog, the spectral index γPWN, the range of the emissivity ηW0,fit
for which the source is able to reproduce the AMS-02 observables and finally the reconstructed valueof the pulsar efficiency which is required to match the emissivity W0,cat (in bold, we emphasize thosecases where this effective efficiency parameter is smaller than 2).
– 16 –

Name γfit dfit Tfit ηW0,fit χ2/dof dcat Tcat W0,cat ηfit
Geminga 1.74 0.24 344.6 0.341 0.68 0.25 342 1.25 0.27J1741-2054 1.68 0.25 378.0 0.413 0.62 0.25 386 0.47 0.88B1742-30 1.52 0.19 539.1 0.770 0.54 0.2 546 0.83 0.92
J1918+1541 1.65 0.64 2355 6.48 0.92 0.68 2310 3.4 1.90
Table 3. “Single-source” analysis. For the four PWN identified in the “single-source” analysis asthose which can provide the best agreement to the AMS-02 data (the ones that in Tab. 2 exhibit aneffective efficiency smaller than 2), we report here the best-fit values obtained for their spectral indexγfit, distance dfit (in kpc), age Tfit (in kyr) and emitted power ηW0,fit (in units of 1049 erg), and forcomparison the catalog values of distance dcat, age Tcat and power W0,cat. From ηW0,fit and W0,cat
we derive the efficiency ηfit.
We wish to emphasize that, with the results of this analysis, we are not claiming thatwe have unambiguously identified the source of the high-energy positron flux (equivalentlygood solutions have been obtained in Sect. 4, where all pulsars in the ATNF catalog are con-tributing, and others will be found in the next Section with the “’powerful sources” analysis).Instead, we attempted to investigate if a solution in terms of a single emitter is possible andif the ATNF catalog contains viable candidates, which indeed occurs. A verification that thesources reported in Tab. 3 have the spectral index and efficiency quoted in the table wouldrequire additional observational data. At the same time, we wish to comment that the useof catalog sources might be biased from incompleteness of the catalog. The ATNF catalogmight not (and very likely, does not) contain all local PWN, since for a fraction of them theelectromagnetic emission may not be resolved. This might occur for the SNR in the Greencatalog, as well. Nevertheless, it is remarkable that current data can be properly and fullyexplained in terms of known sources. In the case of the “single-source analysis” discussed inthis Section, the results of Fig. 6 can also be interpreted as bringing information on the age-distance parameters required for any unknown single, powerful PWN to explain the AMS-02leptonic data: any putative source likely needs to be closer than 1 kpc and younger than about3000 kyr, with specific correlations with its spectral index and emitted power, as reported inthe panels of Fig. 6.
5.2 “Powerful-sources” analisys
In this Section we adopt a somehow complementary approach to the “single-source analysis”discussed in Sect. 5.1: we identify, in the ATNF catalog, a limited number of PWN whichare potentially able to sizably contribute to the local positron flux at high-energies, and weuse them in the global analysis of the full set of AMS-02. For definiteness, we adopt the 5“most powerful” sources, and for each of them we allow a free spectral index γPWN and afree efficiency factor η, which are then determined by fitting the AMS-02 data. All the otherleptonic components (SNR and secondaries) are taken at their best-fit configuration of Sect.4, for definiteness. We label this analysis "powerful-sources” analysis.
The criterion used to identify the 5 “most powerful” sources relies on a ranking-algorithmbased on the contribution of the PWN to the high-energy part of the positron flux. Sincepulsars contribution becomes dominant above about 10 GeV, we have subdivided the energyrange (10−550) GeV into 4 equally spaced in log-scale bins, and for each bin we have calculatedthe integrated positron flux for all the PWN present in the ATNF catalog, by adopting forthem a common spectral index and efficiency (taken at the best-fit values of Sect. 4). Byusing the calculated fluxes Φa
i (i = 1, . . . , 4 counts the energy bins, a counts the PWN in
– 17 –

10-3
10-2
10-1
100
101
102
103
104
E3 Φ
[G
eV
2 c
m-2
s-2
sr-1
]
E [GeV]
e-
IIGeminga
SNR localSNR d > 3 kpc
TOTAMS-02
PAMELAFERMI
AMS-01HEAT
CAPRICE
10-5
10-4
10-3
10-2
10-1
100
101
102
103
104
E3 Φ
[G
eV
2 c
m-2
s-2
sr-1
]
E [GeV]
e+
IIGeminga
TOTAMS-02
PAMELAFERMIHEAT
CAPRICE
10-3
10-2
10-1
100
101
102
103
104
E3 Φ
[G
eV
2 c
m-2
s-2
sr-1
]
E [GeV]
e++e
-
IIGeminga
SNR localSNR d > 3 kpc
TOTAMS-02FERMI
ATICHEAT
CAPRICEBETSHESS
10-2
10-1
100
100
101
102
103
e+/(
e++
e- )
E [GeV]
e+/(e
++e
-)
IIGeminga
TOTAMS-02
PAMELAFERMI
AMS-01HEAT
CAPRICE
Figure 7. “Single-source” analysis. Results of our simultaneous fit on the AMS-02 data for the electronflux (top left), positron flux (top right), electron plus positron flux (bottom left) and positron fraction(bottom right) when the pulsar contribution is fully supplied by Geminga alone. The fit is performedon all the AMS-02 data simultaneously and the derived Geminga parameters are those reported inTab. 3. The colors and styles of the lines are the same as in Fig. 3. Together with our theoreticalmodel, data from AMS-02 [6–8], Fermi-LAT [4, 5], Pamela [1–3], Heat [182–185], Caprice [186, 187],Bets [188, 189] and Hess experiments [46, 190] are reported.
the catalog) we have created a rank Rai of the sources a in each bin i (Rai = 1, 2, . . . for themost-powerful, second most-powerful, and so on). The 5 “most-powerful” sources are thenidentified as those who possess the highest ranking Ra =
∑iR
ai (i.e. the smaller value of
Ra). These pulsars are listed in Table 4.Now that we have identified the PWN to be used in the analysis, we allow for them a
variation of the spectral index γPWN and efficiency η parameters, while assuming their distanced, age T and total emitted power W0 at their catalog values. The analysis therefore relies on10 free parameters, which are varied independently. By fitting the whole set of AMS-02 data,we can identify the best-fit configuration and the corresponding 3σ allowed region in this 10-dimensional parameter space. For those configurations falling in the 3σ allowed region, Fig.8 shows the frequency distribution of the two parameters for each of the 5 “’most-powerful”sources. We can notice that there is a preferred trend for Geminga: the efficiency is requiredto be larger than about 0.1, with a peak value around 0.2−0.3 (not far from the best-fit value0.27 obtained in the “single-source” analysis) and that its spectral index is lower-boundedarounded 1.6, with a small (but not significant) preference toward softer spectra (we cannotice that in the case Geminga is the only, largely dominant, contributor the “single-source”analysis has determined a best-fit value of 1.74). The other four “most-powerful” PWN are
– 18 –

ATNF Association d[kpc] T [kyr] W0[1049 erg]
J0633+1746 Geminga 0.25 343 1.26J2043+2740 1.13 1204 26.0B0355+54 1 567 4.73B0656+14 Monogem 0.28 112 0.178J0538+2817 1.3 622 6.18
Table 4. “Powerful-sources analysis”. List of the 5 pulsars identified as “most-powerful” with thecriteria defined in the text, as used in the analysis. The columns report the ATNF-catalog name, theassociation name, the distance d [kpc], the age T [kyr] and the emitted power W0 (in units of 1049
erg), as reported in the catalog.
much less constrained: they have a mild preference for efficiencies lower than 0.1 and no clearpreference for the value of the spectral index.
In order to understand the role of the additional PWN present in the ATNF catalog,we have performed an extended version of the “power-source” analysis where, in addition tothe 5 sources defined above, we have added the contribution of all the remaining pulsars inthe catalog (a sort of “PWN background”, just to fix a denomination): for each of them, weadopt a common spectral index and efficiency, while the other 3 parameters (d, T , and W0)are taken at the value reported in the catalog. The analysis now deals with 12 parameters.We have again performed a fit on the whole set of AMS-02 data, identified the 3σ allowedregions around the best-fit configuration on the 12-dimensional parameter space: Fig. 9shows the frequency distribution of the values of γPWN and η for each of the 5 “most-powerful”pulsars, as well as the frequency distribution of the spectral index and efficiency of the pulsarscontributing to the “PWN background”. The presence of the additional pulsars makes therole of Geminga less relevant, as can be seen by the fact that now the allowed interval forthe efficiency is widely distributed, contrary to the previous case: while the most probablevalue is still around 0.1−0.2, much lower efficiencies are now accepted, while only efficienciesin excess of 0.1 were accepted with a negligible contribution of the “PWN background”. Theadditional pulsars have a tendency toward low efficiencies, around 0.05. The spectral featuresdo not exhibit strong preferences, except for Geminga and for the “PWN background”, wherea mild tendency toward soft spectra appears, as shown in the right panel of Fig. 9.
The kind of agreement which can be obtained with the “powerful-sources” approach canbe appreciated in Fig. 10, where we show the best-fit configuration of the analysis for the 5“most-powerful” pulsars for the combined analysis of the electron flux (top left), positron flux(top right), electron plus positron flux (bottom left) and positron fraction (bottom right).All four data sets are reproduced quite well, with a similar level of agreement already ob-tained with the other approaches discusses above. The best-fit configuration correspondsto a reduced-χ2 of 0.41 for 236 data points and 12 free parameters. Also in this case, theagreement is remarkably good.
6 Conclusions
In this paper we have performed a combined analysis of the recent AMS-02 data on theelectron flux, positron flux, electrons plus positrons flux and positron fraction, in a theoret-ical framework that self-consistently accounts for all the astrophysical components able tocontribute to the leptonic fluxes in their whole energy range.
– 19 –

10-2
10-1
100
10-1
Fra
ctio
n
η
GemingaJ2043+2740
B0355+54Monogem
J0538+2817
10-2
10-1
100
1.4 1.5 1.6 1.7 1.8 1.9 2 2.1 2.2
Fra
ctio
n
γPWN
GemingaJ2043+2740
B0355+54Monogem
J0538+2817
Figure 8. “Powerful-source analysis”. Frequency distribution of the values of the efficiency η (left)and the spectral index γ (right) of the five “most powerful” sources. The distributions refer to thePWN configurations which lie inside the 3σ allowed region around the best-fit configuration on theAMS-02 full data set.
10-2
10-1
100
10-1
Fra
ctio
n
η
GemingaJ2043+2740
B0355+54Monogem
J0538+2817PWN background
10-2
10-1
100
1.4 1.5 1.6 1.7 1.8 1.9 2 2.1 2.2
Fra
ctio
n
γPWN
GemingaJ2043+2740
B0355+54Monogem
J0538+2817PWN background
Figure 9. “Powerful-source analysis”. The same as in Fig. 8, with the difference that, in addition tothe 5 “most-powerful” pulsars, an aggregate contribution from all the additional PWN in the ATNFcatalog is added (considered as a “PWN background”). All the additional pulsars are assumed to havea common efficiency and a common spectral index.
The primary electron contribution is modeled through the sum of an average flux pro-duced by distant sources and the fluxes arising from the local supernova remnants in theGreen catalog. The secondary electron and positron fluxes originate from interactions on theinterstellar medium of primary cosmic rays, for which we have derived a novel determinationby using AMS-02 proton and helium data. Finally, the pulsar wind nebulae contribution tothe positron (and electron) fluxes at high energies relies on a modeling of the sources re-ported in the ATNF catalog (where information on age, distance and total emitted powerof the pulsars is available), under a number of assumptions on the way the different pulsarsmight contribute to the local fluxes. We have in fact specifically performed three differenttype of analysis: we have studied the average contribution from the whole catalog; we haveinvestigated if the ATNF catalog contains a single, dominant, pulsar which alone can allowagreement with the data; finally we have examined the possibility that a few powerful sourcesin the ATNF catalog may concurrently contribute to the local observed fluxes.
For all three different types of analysis, we obtain a remarkable agreement between our
– 20 –

10-4
10-3
10-2
10-1
100
100
101
102
103
104
E3 Φ
[G
eV
2 c
m-2
s-2
sr-1
]
E [GeV]
e-
IISNR local
SNR d > 3 kpcPWN TotGeminga
J2043+2740B0355+54Monogem
J0538+2817TOT
AMS-02PAMELA
FERMI
10-5
10-4
10-3
10-2
10-1
100
101
102
103
104
E3 Φ
[G
eV
2 c
m-2
s-2
sr-1
]
E [GeV]
e+
IIPWN TotGeminga
J2043+2740B0355+54Monogem
J0538+2817TOT
AMS-02PAMELA
FERMI
10-2
10-1
100
100
101
102
103
e+/(
e++
e- )
E [GeV]
e+/(e
++e
-)
IIPWN TotGeminga
J2043+2740B0355+54Monogem
J0538+2817TOT
AMS-02PAMELA
FERMI
10-3
10-2
10-1
100
101
102
103
104
E3 Φ
[G
eV
2 c
m-2
s-2
sr-1
]
E [GeV]
e++e
-
IISNR local
SNR d > 3 kpcPWN TotGeminga
J2043+2740B0355+54Monogem
J0538+2817TOT
AMS-02FERMI
Figure 10. “Powerful-source” analysis. Results of our simultaneous fit on the AMS-02 data for theelectron flux (top left), positron flux (top right), electron plus positron flux (bottom left) and positronfraction (bottom right) when the pulsar contribution is supplied by the 5 “most-powerful” pulsars inthe ATNF catalog, listed in Table 4. The fit is performed on all the AMS-02 data simultaneouslyand the result shown in the figure refers to best-fit configuration for the 5+1 efficiences and the 5+1spectra indexes. The colors and styles of the lines are the same as in Fig. 3. Together with ourtheoretical model, data from AMS-02 [6–8], Fermi-LAT [4, 5], Pamela [1–3], Heat [182–185], Caprice[186, 187], Bets [188, 189] and Hess experiments [46, 190] are reported.
modelings and the whole set of AMS-02 data. The supernova remnants and the secondarycontribution are able to properly explain the electron data and the low-energy part of thepositron spectra, and to some extent they also point toward a disfavoring of small cosmic-rays confinement volumes. The high-energy part of the positron flux, which has receivedgreat attention because of its implications not only for the astrophysics of sources but alsofor dark matter studies, finds a remarkable solution in terms of pulsars present in the ATNFcatalog. We find that AMS-02 data can be properly explained either in the case of an averagecontribution from the whole catalog, or for the situation where a single and close pulsar isthe dominant contributor, or even in the case where a few and powerful dominant pulsars inthe catalog are mostly contributing. For all cases, we have identified the required ranges ofthe relevant parameters (spectral index and efficiency of the emission) for the contributingpulsars, once the other parameters (age, distance, total emitted power) are fixed at theirvalues reported in the ATNF catalog.
We can therefore conclude that the whole set of AMS-02 leptonic data admits a self-consistent interpretation in terms of astrophysical contributions. Alternative solutions, likee.g. a dark matter production of electrons and positrons, are indeed a viable alternative or
– 21 –

complementary possibility: however, a self-consistent solution in terms of purely astrophysicalsources can be properly met.
Acknowledgments
We thank Pasquale Serpico for interesting and useful discussions on the physics of super-nova remnants and pulsar wind nebulae and Timur Delahaye for discussions on the studyof electron and positron cosmic rays. This work is supported by the research grant Theo-retical Astroparticle Physics number 2012CPPYP7 under the program PRIN 2012 fundedby the Ministero dell’Istruzione, Università e della Ricerca (MIUR), by the research grantTAsP (Theoretical Astroparticle Physics) funded by the Istituto Nazionale di Fisica Nucleare(INFN), by the Strategic Research Grant: Origin and Detection of Galactic and Extragalac-tic Cosmic Rays funded by Torino University and Compagnia di San Paolo, by the Span-ish MINECO under grants FPA2011-22975 and MULTIDARK CSD2009-00064 (Consolider-Ingenio 2010 Programme), by Prometeo/2009/091 (Generalitat Valenciana), and by the EUITN UNILHC PITN-GA-2009-237920. This work is also supported in part by the EuropeanResearch Council (Erc) under the EU Seventh Framework Programme (FP7/2007-2013) /Erc Starting Grant (agreement n. 278234 - ‘NewDark’ project). At LAPTh this activitywas supported by the Labex grant ENIGMASS. R.L. is supported by a Juan de la Ciervacontract (MINECO). A.V. acknowledges the hospitality of the Institut d’Astrophysique deParis (IAP).
References
[1] O. Adriani, G. C. Barbarino, G. A. Bazilevskaya, et al., An anomalous positron abundance incosmic rays with energies 1.5-100GeV, Nature 458 (Apr., 2009) 607–609, [arXiv:0810.4995].
[2] PAMELA Collaboration, The cosmic-ray positron energy spectrum measured by PAMELA,ArXiv e-prints (Aug., 2013) [arXiv:1308.0133].
[3] O. Adriani, G. C. Barbarino, G. A. Bazilevskaya, et al., Cosmic-Ray Electron Flux Measuredby the PAMELA Experiment between 1 and 625 GeV, Phys.Rev.Lett. 106 (May, 2011) 201101,[arXiv:1103.2880].
[4] M. Ackermann, M. Ajello, Allafort, et al., Measurement of Separate Cosmic-Ray Electron andPositron Spectra with the Fermi Large Area Telescope, Phys.Rev.Lett. 108 (Jan., 2012)011103, [arXiv:1109.0521].
[5] M. Ackermann, M. Ajello, W. B. Atwood, L. Baldini, et al., Fermi LAT observations ofcosmic-ray electrons from 7 GeV to 1 TeV, Phy. Rev. D 82 (Nov., 2010) 092004,[arXiv:1008.3999].
[6] AMS Collaboration, M. Aguilar et al., First Result from the Alpha Magnetic Spectrometer onthe International Space Station: Precision Measurement of the Positron Fraction in PrimaryCosmic Rays of 0.5–350 GeV, Phys.Rev.Lett. 110 (2013), no. 14 141102.
[7] S. Shael and the Ams-02 Collaboration, Precision measurements of the electron spectrum andthe positron spectrum with AMS, Talk at the 33rd ICRC Conference (2013).
[8] B. Bertucci and the Ams-02 Collaboration, Precision measurement of the electron pluspositron spectrum with AMS, Talk at the 33rd ICRC Conference (2013).
[9] P. D. Serpico, Astrophysical models for the origin of the positron ”excess”, AstroparticlePhysics 39 (Dec., 2012) 2–11, [arXiv:1108.4827].
– 22 –

[10] D. Hooper, P. Blasi, and P. D. Serpico, Pulsars as the Sources of High Energy Cosmic RayPositrons, JCAP 0901 (2009) 025, [arXiv:0810.1527].
[11] S. Profumo, Dissecting cosmic-ray electron-positron data with Occam’s Razor: the role ofknown Pulsars, Central Eur.J.Phys. 10 (2011) 1–31, [arXiv:0812.4457].
[12] T. Delahaye, R. Lineros, F. Donato, N. Fornengo, J. Lavalle, P. Salati, and R. Taillet, Galacticsecondary positron flux at the Earth, A&A 501 (July, 2009) 821–833, [arXiv:0809.5268].
[13] P. Mertsch and S. Sarkar, Testing Astrophysical Models for the PAMELA Positron Excess withCosmic Ray Nuclei, Physical Review Letters 103 (Aug., 2009) 081104, [arXiv:0905.3152].
[14] T. Delahaye, J. Lavalle, R. Lineros, F. Donato, and N. panel, Galactic electrons and positronsat the Earth: new estimate of the primary and secondary fluxes, A&A 524 (Dec., 2010) A51,[arXiv:1002.1910].
[15] S. Della Torre, M. Gervasi, P. Rancoita, D. Rozza, and A. Treves, Possible Contribution toElectron and Positron Fluxes from Pulsars and their Nebulae, ArXiv e-prints (Dec., 2013)[arXiv:1312.3483].
[16] A. D. Erlykin and A. W. Wolfendale, Cosmic ray positrons from a local, middle-agedsupernova remnant, Astroparticle Physics 49 (Sept., 2013) 23–27, [arXiv:1308.4878].
[17] D. Gaggero, D. Grasso, L. Maccione, G. Di Bernardo, and C. Evoli, PAMELA positron andelectron spectra are reproduced by 3-dimensional cosmic-ray modeling, arXiv:1311.5575.
[18] D. Gaggero and L. Maccione, Model independent interpretation of recent CR lepton data afterAMS-02, JCAP 1312 (2013) 011, [arXiv:1307.0271].
[19] D. Gaggero, L. Maccione, G. Di Bernardo, C. Evoli, and D. Grasso, Three-Dimensional Modelof Cosmic-Ray Lepton Propagation Reproduces Data from the Alpha Magnetic Spectrometeron the International Space Station, Phys.Rev.Lett. 111 (2013) 021102, [arXiv:1304.6718].
[20] D. Grasso, G. Di Bernardo, C. Evoli, D. Gaggero, and L. Maccione, Galactic electron andpositron properties from cosmic ray and radio observations, arXiv:1306.6885.
[21] Q. Yuan and X.-J. Bi, Reconcile the AMS-02 positron fraction and Fermi-LAT/HESS total e±spectra by the primary electron spectrum hardening, Phys.Lett. B727 (2013) 1–7,[arXiv:1304.2687].
[22] I. Cholis and D. Hooper, Constraining the origin of the rising cosmic ray positron fractionwith the boron-to-carbon ratio, arXiv:1312.2952.
[23] M. Ibe, S. Matsumoto, S. Shirai, and T. T. Yanagida, AMS-02 Positrons from Decaying Winoin the Pure Gravity Mediation Model, ArXiv e-prints (May, 2013) [arXiv:1305.0084].
[24] P. S. Bhupal Dev, D. K. Ghosh, N. Okada, and I. Saha, Neutrino Mass and Dark Matter inlight of recent AMS-02 results, ArXiv e-prints (July, 2013) [arXiv:1307.6204].
[25] V. C. Spanos, The Price of a Dark Matter Annihilation Interpretation of AMS-02 Data,ArXiv e-prints (Dec., 2013) [arXiv:1312.7841].
[26] A. Ibarra, A. S. Lamperstorfer, and J. Silk, Dark matter annihilations and decays after theAMS-02 positron measurements, ArXiv e-prints (Sept., 2013) [arXiv:1309.2570].
[27] K. R. Dienes, J. Kumar, and B. Thomas, Dynamical Dark Matter and the positron excess inlight of AMS results, Phy. Rev. D 88 (Nov., 2013) 103509, [arXiv:1306.2959].
[28] A. Hektor, M. Raidal, A. Strumia, and E. Tempel, The cosmic-ray positron excess from a localDark Matter over-density, Physics Letters B 728 (Jan., 2014) 58–62, [arXiv:1307.2561].
[29] M. Cirelli, M. Kadastik, M. Raidal, and A. Strumia, Model-independent implications of thee+-, anti-proton cosmic ray spectra on properties of Dark Matter, Nuclear Physics B B813(2009) 1–21, [arXiv:0809.2409].
– 23 –

[30] Y. Zhao and K. M. Zurek, Indirect Detection Signatures for the Origin of Asymmetric DarkMatter, arXiv:1401.7664.
[31] S. Baek, H. Okada, and T. Toma, Radiative Lepton Model and Dark Matter with Global U(1)′
Symmetry, arXiv:1401.6921.
[32] J. Kopp, L. Michaels, and J. Smirnov, Loopy Constraints on Leptophilic Dark Matter andInternal Bremsstrahlung, arXiv:1401.6457.
[33] A. Hryczuk, I. Cholis, R. Iengo, M. Tavakoli, and P. Ullio, Indirect Detection Analysis: WinoDark Matter Case Study, arXiv:1401.6212.
[34] K.-Y. Choi, B. Kyae, and C. S. Shin, Decaying WIMP dark matter for AMS-02 cosmicpositron excess, arXiv:1307.6568.
[35] A. Ibarra, D. Tran, and C. Weniger, Indirect Searches for Decaying Dark Matter,Int.J.Mod.Phys. A28 (2013), no. 27 1330040, [arXiv:1307.6434].
[36] L. Bergstrom, T. Bringmann, I. Cholis, D. Hooper, and C. Weniger, New limits on darkmatter annihilation from AMS cosmic ray positron data, Phys.Rev.Lett. 111 (2013) 171101,[arXiv:1306.3983].
[37] H.-B. Jin, Y.-L. Wu, and Y.-F. Zhou, Implications of the first AMS-02 measurement for darkmatter annihilation and decay, JCAP 1311 (2013) 026, [arXiv:1304.1997].
[38] A. De Simone, A. Riotto, and W. Xue, Interpretation of AMS-02 Results: Correlations amongDark Matter Signals, JCAP 1305 (2013) 003, [arXiv:1304.1336].
[39] L. Feng, R.-Z. Yang, H.-N. He, T.-K. Dong, Y.-Z. Fan, et al., AMS-02 positron excess: newbounds on dark matter models and hint for primary electron spectrum hardening, Phys.Lett.B728 (2014) 250–255, [arXiv:1303.0530].
[40] I. Masina and F. Sannino, Hints of a Charge Asymmetry in the Electron and PositronCosmic-Ray Excesses, Phys.Rev. D87 (2013) 123003, [arXiv:1304.2800].
[41] D. C. Ellison, D. J. Patnaude, P. Slane, P. Blasi, and S. Gabici, Particle Acceleration inSupernova Remnants and the Production of Thermal and Nonthermal Radiation, ApJ 661(June, 2007) 879–891, [astro-ph/0702674].
[42] V. Tatischeff, Radio emission and nonlinear diffusive shock acceleration of cosmic rays in thesupernova SN 1993J, A&A 499 (May, 2009) 191–213, [arXiv:0903.2944].
[43] P. Cristofari, S. Gabici, S. Casanova, R. Terrier, and E. Parizot, Acceleration of cosmic raysand gamma-ray emission from supernova remnants in the Galaxy, MNRAS 434 (Oct., 2013)2748–2760, [arXiv:1302.2150].
[44] P. Blasi, The Origin of Galactic Cosmic Rays, arXiv:1311.7346.
[45] E. A. Helder, J. Vink, A. M. Bykov, Y. Ohira, J. C. Raymond, and R. Terrier, ObservationalSignatures of Particle Acceleration in Supernova Remnants, SSRv 173 (Nov., 2012) 369–431,[arXiv:1206.1593].
[46] F. Aharonian, A. G. Akhperjanian, et al., Energy Spectrum of Cosmic-Ray Electrons at TeVEnergies, Phys.Rev.Lett. 101 (Dec., 2008) 261104, [arXiv:0811.3894].
[47] F. Aharonian, A. G. Akhperjanian, U. B. de Almeida, et al., Discovery of Gamma-RayEmission From the Shell-Type Supernova Remnant RCW 86 With Hess, ApJ 692 (Feb., 2009)1500–1505, [arXiv:0810.2689].
[48] VERITAS Collaboration, V. A. Acciari et al., Observations of the Shell-type SupernovaRemnant Cassiopeia A at TeV Energies with VERITAS, ApJ 714 (May, 2010) 163–169,[arXiv:1002.2974].
[49] F. Aharonian, A. Akhperjanian, J. Barrio, K. Bernlöhr, H. Börst, H. Bojahr, O. Bolz,J. Contreras, J. Cortina, S. Denninghoff, V. Fonseca, J. Gonzalez, N. Götting,
– 24 –

G. Heinzelmann, G. Hermann, A. Heusler, W. Hofmann, D. Horns, A. Ibarra, C. Iserlohe,I. Jung, R. Kankanyan, M. Kestel, J. Kettler, A. Kohnle, A. Konopelko, H. Kornmeyer,D. Kranich, H. Krawczynski, H. Lampeitl, M. Lopez, E. Lorenz, F. Lucarelli, N. Magnussen,O. Mang, H. Meyer, R. Mirzoyan, A. Moralejo, E. Ona, L. Padilla, M. Panter, R. Plaga,A. Plyasheshnikov, J. Prahl, G. Pühlhofer, G. Rauterberg, A. Röhring, W. Rhode, G. P.Rowell, V. Sahakian, M. Samorski, M. Schilling, F. Schröder, M. Siems, W. Stamm,M. Tluczykont, H. J. Völk, C. A. Wiedner, and W. Wittek, Evidence for TeV gamma rayemission from Cassiopeia A, A&A 370 (Apr., 2001) 112–120, [astro-ph/0102391].
[50] F. Aharonian, A. G. Akhperjanian, A. R. Bazer-Bachi, M. Beilicke, W. Benbow, D. Berge,K. Bernlöhr, C. Boisson, O. Bolz, V. Borrel, I. Braun, E. Brion, A. M. Brown, R. Bühler,I. Büsching, S. Carrigan, P. M. Chadwick, L.-M. Chounet, G. Coignet, R. Cornils,L. Costamante, B. Degrange, H. J. Dickinson, A. Djannati-Ataï, L. O’C. Drury, G. Dubus,K. Egberts, D. Emmanoulopoulos, P. Espigat, F. Feinstein, E. Ferrero, A. Fiasson,G. Fontaine, S. Funk, S. Funk, M. Füßling, Y. A. Gallant, B. Giebels, J. F. Glicenstein,B. Glück, P. Goret, C. Hadjichristidis, D. Hauser, M. Hauser, G. Heinzelmann, G. Henri,G. Hermann, J. A. Hinton, A. Hoffmann, W. Hofmann, M. Holleran, S. Hoppe, D. Horns,A. Jacholkowska, O. C. de Jager, E. Kendziorra, M. Kerschhaggl, B. Khélifi, N. Komin,A. Konopelko, K. Kosack, G. Lamanna, I. J. Latham, R. Le Gallou, A. Lemière,M. Lemoine-Goumard, T. Lohse, J. M. Martin, O. Martineau-Huynh, A. Marcowith,C. Masterson, G. Maurin, T. J. L. McComb, E. Moulin, M. de Naurois, D. Nedbal, S. J.Nolan, A. Noutsos, J.-P. Olive, K. J. Orford, J. L. Osborne, M. Panter, G. Pelletier, S. Pita,G. Pühlhofer, M. Punch, S. Ranchon, B. C. Raubenheimer, M. Raue, S. M. Rayner,A. Reimer, O. Reimer, J. Ripken, L. Rob, L. Rolland, S. Rosier-Lees, G. Rowell, V. Sahakian,A. Santangelo, L. Saugé, S. Schlenker, R. Schlickeiser, R. Schröder, U. Schwanke,S. Schwarzburg, S. Schwemmer, A. Shalchi, H. Sol, D. Spangler, F. Spanier, R. Steenkamp,C. Stegmann, G. Superina, P. H. Tam, J.-P. Tavernet, R. Terrier, M. Tluczykont, C. vanEldik, G. Vasileiadis, C. Venter, J. P. Vialle, P. Vincent, H. J. Völk, S. J. Wagner, andM. Ward, Primary particle acceleration above 100 TeV in the shell-type supernova remnant<ASTROBJ>RX J1713.7-3946</ASTROBJ> with deep HESS observations, A&A 464(Mar., 2007) 235–243, [astro-ph/0611813].
[51] T. Shimizu, K. Masai, and K. Koyama, Non-Thermal Radio and Gamma-Ray Emissions froma Supernova Remnant by Blast Wave Breaking Out of the Circumstellar Matter, PASJ 65(June, 2013) 69, [arXiv:1303.6049].
[52] I. Sushch and B. Hnatyk, Modelling of the radio emission from the Vela supernova remnant,A&A 561 (Jan., 2014) A139, [arXiv:1312.0777].
[53] D. A. Green, A revised Galactic supernova remnant catalogue, Bulletin of the AstronomicalSociety of India 37 (Mar., 2009) 45–61, [arXiv:0905.3699].
[54] S. G. Lucek and A. R. Bell, Non-linear amplification of a magnetic field driven by cosmic raystreaming, MNRAS 314 (May, 2000) 65–74.
[55] J. Vink, J. Bleeker, K. van der Heyden, A. Bykov, A. Bamba, and R. Yamazaki, The X-RaySynchrotron Emission of RCW 86 and the Implications for Its Age, ApJL 648 (Sept., 2006)L33–L37, [astro-ph/0607307].
[56] A. A. Abdo, M. Ackermann, M. Ajello, Allafort, et al., Fermi Large Area TelescopeObservations of the Supernova Remnant W28 (G6.4-0.1), ApJ 718 (July, 2010) 348–356.
[57] A. R. Bell, K. M. Schure, B. Reville, and G. Giacinti, Cosmic-ray acceleration and escapefrom supernova remnants, MNRAS 431 (May, 2013) 415–429, [arXiv:1301.7264].
[58] K. M. Schure and A. R. Bell, Cosmic ray acceleration in young supernova remnants, MNRAS435 (Oct., 2013) 1174–1185, [arXiv:1307.6575].
– 25 –

[59] G. Morlino, E. Amato, and P. Blasi, Gamma-ray emission from SNR RX J1713.7-3946 andthe origin of galactic cosmic rays, MNRAS 392 (Jan., 2009) 240–250, [arXiv:0810.0094].
[60] J. L. Han, W. Reich, X. H. Sun, X. Y. Gao, L. Xiao, W. B. Shi, P. Reich, and R. Wielebinski,The Sino-German λ6 CM Polarization Survey of the Galactic Plane: a Summary,International Journal of Modern Physics Conference Series 23 (2013) 82–91,[arXiv:1202.1875].
[61] P. Madau, M. della Valle, and N. Panagia, On the evolution of the cosmic supernova rates,MNRAS 297 (June, 1998) L17, [astro-ph/9803284].
[62] R. Diehl, H. Halloin, K. Kretschmer, G. G. Lichti, V. Schönfelder, A. W. Strong, A. vonKienlin, W. Wang, P. Jean, J. Knödlseder, J.-P. Roques, G. Weidenspointner, S. Schanne,D. H. Hartmann, C. Winkler, and C. Wunderer, Radioactive 26Al from massive stars in theGalaxy, Nature 439 (Jan., 2006) 45–47, [astro-ph/0601015].
[63] D. R. Lorimer, The Galactic Population and Birth Rate of Radio Pulsars, in Young NeutronStars and Their Environments (F. Camilo and B. M. Gaensler, eds.), vol. 218 of IAUSymposium, p. 105, 2004. astro-ph/0308501.
[64] D. H. Clark and J. L. Caswell, A study of galactic supernova remnants, based onMolonglo-Parkes observational data, MNRAS 174 (Feb., 1976) 267–305.
[65] P. F. Velázquez, G. M. Dubner, W. M. Goss, and A. J. Green, Investigation of the Large-scaleNeutral Hydrogen near the Supernova Remnant W28, AJ 124 (Oct., 2002) 2145–2151,[astro-ph/0207530].
[66] X. H. Sun, P. Reich, W. Reich, L. Xiao, X. Y. Gao, and J. L. Han, A Sino-German λ6 cmpolarization survey of the Galactic plane. VII. Small supernova remnants, A&A 536 (Dec.,2011) A83, [arXiv:1110.1106].
[67] E. Furst, E. Hummel, W. Reich, Y. Sofue, W. Sieber, K. Reif, and R.-J. Dettmar, A study ofthe composite supernova remnant G 18.95-1.1, A&A 209 (Jan., 1989) 361–368.
[68] E. Fuerst, W. Reich, and B. Aschenbach, New radio and soft X-ray observations of thesupernova remnant G 18.95-1.1., A&A 319 (Mar., 1997) 655–663.
[69] I. M. Harrus, P. O. Slane, J. P. Hughes, and P. P. Plucinsky, An X-Ray Study of theSupernova Remnant G18.95-1.1, ApJ 603 (Mar., 2004) 152–158, [astro-ph/0311410].
[70] D. A. Green, Sensitive OH observations towards 16 supernova remnants, MNRAS 238 (May,1989) 737–751.
[71] E. B. Giacani, G. M. Dubner, N. E. Kassim, D. A. Frail, W. M. Goss, P. F. Winkler, andB. F. Williams, New Radio and Optical Study of the Supernova Remnant W44, AJ 113 (Apr.,1997) 1379.
[72] J. L. Caswell, J. D. Murray, R. S. Roger, D. J. Cole, and D. J. Cooke, Neutral hydrogenabsorption measurements yielding kinematic distances for 42 continuum sources in thegalactic plane, A&A 45 (Dec., 1975) 239–258.
[73] A. Wolszczan, J. M. Cordes, and R. J. Dewey, Discovery of a young, 267 millisecond pulsar inthe supernova remnant W44, ApJL 372 (May, 1991) L99–L102.
[74] J. Rho, R. Petre, E. M. Schlegel, and J. J. Hester, An X-ray and optical study of thesupernova remnant W44, ApJ 430 (Aug., 1994) 757–773.
[75] L. Xiao, W. Reich, E. Fürst, and J. L. Han, Radio properties of the low surface brightnessSNR G65.2+5.7, A&A 503 (Sept., 2009) 827–836, [arXiv:0904.3170].
[76] P. W. Gorham, P. S. Ray, S. B. Anderson, S. R. Kulkarni, and T. A. Prince, A Pulsar Surveyof 18 Supernova Remnants, ApJ 458 (Feb., 1996) 257.
– 26 –

[77] F. Mavromatakis, P. Boumis, J. Papamastorakis, and J. Ventura, Deep optical observations ofG 65.3+5.7, A&A 388 (June, 2002) 355–362, [astro-ph/0204079].
[78] R. Kothes, T. L. Landecker, and M. Wolleben, H I Absorption of Polarized Emission: A NewTechnique for Determining Kinematic Distances to Galactic Supernova Remnants, ApJ 607(June, 2004) 855–864.
[79] R. Kothes, T. L. Landecker, W. Reich, S. Safi-Harb, and Z. Arzoumanian, DA 495: An AgingPulsar Wind Nebula, ApJ 687 (Nov., 2008) 516–531, [arXiv:0807.0811].
[80] G. Castelletti and G. Dubner, A multi-frequency study of the spectral index distribution in theSNR CTB 80, A&A 440 (Sept., 2005) 171–177, [astro-ph/0507716].
[81] R. Kothes, K. Fedotov, T. J. Foster, and B. Uyanıker, A catalogue of Galactic supernovaremnants from the Canadian Galactic plane survey. I. Flux densities, spectra, and polarizationcharacteristics, A&A 457 (Oct., 2006) 1081–1093.
[82] R. G. Strom and B. W. Stappers, Supernova Remnant CTB 80 and PSR 1951+32, in IAUColloq. 177: Pulsar Astronomy - 2000 and Beyond (M. Kramer, N. Wex, and R. Wielebinski,eds.), vol. 202 of Astronomical Society of the Pacific Conference Series, p. 509, 2000.
[83] G. Castelletti, G. Dubner, K. Golap, W. M. Goss, P. F. Velázquez, M. Holdaway, and A. P.Rao, New High-Resolution Radio Observations of the Supernova Remnant CTB 80, AJ 126(Nov., 2003) 2114–2124, [astro-ph/0310655].
[84] X. H. Sun, W. Reich, J. L. Han, P. Reich, and R. Wielebinski, New λ6 cm observations of theCygnus Loop, A&A 447 (Mar., 2006) 937–947, [astro-ph/0510509].
[85] W. P. Blair, R. Sankrit, and J. C. Raymond, Hubble Space Telescope Imaging of the PrimaryShock Front in the Cygnus Loop Supernova Remnant, AJ 129 (May, 2005) 2268–2280.
[86] W. P. Blair, R. Sankrit, S. I. Torres, P. Chayer, and C. W. Danforth, Far UltravioletSpectroscopic Explorer Observations of KPD 2055+3111, a Star behind the Cygnus Loop, ApJ692 (Feb., 2009) 335–345.
[87] Y. Ladouceur and S. Pineault, New perspectives on the supernova remnant G78.2+2.1, A&A490 (Oct., 2008) 197–211.
[88] A. M. Bykov, A. M. Krassilchtchikov, Y. A. Uvarov, H. Bloemen, R. A. Chevalier, M. Y.Gustov, W. Hermsen, F. Lebrun, T. A. Lozinskaya, G. Rauw, T. V. Smirnova, S. J. Sturner,J.-P. Swings, R. Terrier, and I. N. Toptygin, Hard X-ray emission clumps in the γ-Cygnisupernova remnant: An INTEGRAL-ISGRI view, A&A 427 (Dec., 2004) L21–L24,[astro-ph/0410688].
[89] F. Mavromatakis, Deep optical observations of the supernova remnant G 78.2+2.1, A&A 408(Sept., 2003) 237–243.
[90] F. Mavromatakis, B. Aschenbach, P. Boumis, and J. Papamastorakis, Multi-wavelength studyof the {G 82.2+5.3} supernova remnant, A&A 415 (Mar., 2004) 1051–1063,[astro-ph/0311530].
[91] M. Rosado and J. Gonzalez, The Radial Velocity Field of the Optical Filaments Associatedwith the Supernova Remnant W63, RMxAA 5 (June, 1981) 93.
[92] W. Reich, X. Zhang, and E. Fürst, 35 cm observations of a sample of large supernovaremnants, A&A 408 (Sept., 2003) 961–969.
[93] D.-Y. Byun, B.-C. Koo, K. Tatematsu, and K. Sunada, Interaction between the SupernovaRemnant HB 21 and Molecular Clouds, ApJ 637 (Jan., 2006) 283–295.
[94] J. S. Lazendic and P. O. Slane, Enhanced Abundances in Three Large-DiameterMixed-Morphology Supernova Remnants, ApJ 647 (Aug., 2006) 350–366, [astro-ph/0505498].
– 27 –

[95] T. L. Landecker, D. Routledge, S. P. Reynolds, R. J. Smegal, K. J. Borkowski, and F. D.Seward, DA 530: A Supernova Remnant in a Stellar Wind Bubble, ApJ 527 (Dec., 1999)866–878.
[96] T. Foster and D. Routledge, A New Distance Technique for Galactic Plane Objects, ApJ 598(Dec., 2003) 1005–1016.
[97] B. Uyaniker, R. Kothes, and C. M. Brunt, The Supernova Remnant CTB 104A: MagneticField Structure and Interaction with the Environment, ApJ 565 (Feb., 2002) 1022–1034,[astro-ph/0110001].
[98] F. Mantovani, M. Nanni, C. J. Salter, and P. Tomasi, Further observations of radio sourcesfrom the BG survey. I - The non-thermal sources near L equals 94 deg, A&A 105 (Jan., 1982)176–183.
[99] R. Kothes, B. Uyaniker, and A. Yar, The Distance to Supernova Remnant CTB 109 Deducedfrom Its Environment, ApJ 576 (Sept., 2002) 169–175, [astro-ph/0205034].
[100] A. N. Parmar, T. Oosterbroek, F. Favata, S. Pightling, M. J. Coe, S. Mereghetti, and G. L.Israel, A BeppoSAX observation of the X-ray pulsar 1E2259+586hfill and the supernovaremnant (CTB109), A&A 330 (Feb., 1998) 175–180, [astro-ph/9709248].
[101] V. A. Hughes, R. H. Harten, and S. van den Bergh, A new supernova remnant G109.2-1.0,ApJL 246 (June, 1981) L127–L131.
[102] R. Kothes, B. Uyanıker, and R. I. Reid, Two new Perseus arm supernova remnants discoveredin the Canadian Galactic Plane Survey, A&A 444 (Dec., 2005) 871–881.
[103] A. Yar-Uyaniker, B. Uyaniker, and R. Kothes, Distance of Three Supernova Remnants from HI Line Observations in a Complex Region: G114.3+0.3, G116.5+1.1, and CTB 1(G116.9+0.2), ApJ 616 (Nov., 2004) 247–256, [astro-ph/0408386].
[104] S. Pineault, T. L. Landecker, C. M. Swerdlyk, and W. Reich, The supernova remnant CTA1(G 119.5+10.3): a study. of the breakout phenomenon, A&A 324 (Aug., 1997) 1152–1164.
[105] S. Pineault, T. L. Landecker, B. Madore, and S. Gaumont-Guay, The supernova remnantCTA1 and the surrounding interstellar medium, AJ 105 (Mar., 1993) 1060–1073.
[106] D. Leahy and W. Tian, Radio observations and spectrum of the SNR G127.1+0.5 and itscentral source 0125+628, A&A 451 (May, 2006) 251–257, [astro-ph/0601487].
[107] G. Joncas, R. S. Roger, and P. E. Dewdney, New radio observations of two supernovaremnants in Cassiopeia - G 126.2 + 1.6 and G 127.1 + 0.5, A&A 219 (July, 1989) 303–307.
[108] R. Fesen, G. Rudie, A. Hurford, and A. Soto, Optical Imaging and Spectroscopy of theGalactic Supernova Remnant 3C 58 (G130.7+3.1), ApJS 174 (Feb., 2008) 379–395.
[109] Y. A. Shibanov, N. Lundqvist, P. Lundqvist, J. Sollerman, and D. Zyuzin, Opticalidentification of the 3C 58 pulsar wind nebula, A&A 486 (July, 2008) 273–282,[arXiv:0802.2386].
[110] W. B. Shi, J. L. Han, X. Y. Gao, X. H. Sun, L. Xiao, P. Reich, and W. Reich, The radiospectrum and magnetic field structure of SNR HB3, A&A 487 (Aug., 2008) 601–604,[arXiv:0806.1647].
[111] Y. Xu, M. J. Reid, X. W. Zheng, and K. M. Menten, The Distance to the Perseus Spiral Armin the Milky Way, Science 311 (Jan., 2006) 54–57, [astro-ph/0512223].
[112] W. Reich, E. Fuerst, and E. M. Arnal, Radio observations of the bright X-ray supernovaremnant G156.2+5.7, A&A 256 (Mar., 1992) 214–224.
[113] S. Katsuda, R. Petre, U. Hwang, H. Yamaguchi, K. Mori, and H. Tsunemi, SuzakuObservations of Thermal and Non-Thermal X-Ray Emission from the Middle-Aged SupernovaRemnant G156.2+5.7, PASJ 61 (Jan., 2009) 155, [arXiv:0902.1782].
– 28 –

[114] J. W. Xu, J. L. Han, X. H. Sun, W. Reich, L. Xiao, P. Reich, and R. Wielebinski,Polarization observations of SNR G156.2+5.7 at λ6 cm, A&A 470 (Aug., 2007) 969–975,[arXiv:0705.2806].
[115] S. Yamauchi, K. Koyama, H. Tomida, J. Yokogawa, and K. Tamura, ASCA Observations ofthe Supernova Remnant G156.2+5.7, PASJ 51 (Feb., 1999) 13–22.
[116] D. A. Leahy and W. W. Tian, Radio spectrum and distance of the SNR HB9, A&A 461 (Jan.,2007) 1013–1018, [astro-ph/0606598].
[117] L. Xiao, E. Fürst, W. Reich, and J. L. Han, Radio spectral properties and the magnetic field ofthe SNR S147, A&A 482 (May, 2008) 783–792, [arXiv:0801.4803].
[118] S. B. Anderson, B. J. Cadwell, B. A. Jacoby, A. Wolszczan, R. S. Foster, and M. Kramer, A143 Millisecond Radio Pulsar in the Supernova Remnant S147, ApJL 468 (Sept., 1996) L55.
[119] C.-Y. Ng, R. W. Romani, W. F. Brisken, S. Chatterjee, and M. Kramer, The Origin andMotion of PSR J0538+2817 in S147, ApJ 654 (Jan., 2007) 487–493, [astro-ph/0611068].
[120] M. Kramer, A. G. Lyne, G. Hobbs, O. Löhmer, P. Carr, C. Jordan, and A. Wolszczan, TheProper Motion, Age, and Initial Spin Period of PSR J0538+2817 in S147, ApJL 593 (Aug.,2003) L31–L34, [astro-ph/0306628].
[121] F. Aharonian, A. G. Akhperjanian, A. R. Bazer-Bachi, et al., Observations of the Crab nebulawith HESS, A&A 457 (Oct., 2006) 899–915, [astro-ph/0607333].
[122] B. Y. Welsh and S. Sallmen, High-velocity NaI and CaII absorption components observedtowards the IC 443 SNR, A&A 408 (Sept., 2003) 545–551.
[123] J.-J. Lee, B.-C. Koo, M. S. Yun, S. Stanimirović, C. Heiles, and M. Heyer, A 21 cm Spectraland Continuum Study of IC 443 Using the Very Large Array and the Arecibo Telescope, AJ135 (Mar., 2008) 796–808.
[124] D. A. Graham, C. G. T. Haslam, C. J. Salter, and W. E. Wilson, A continuum study ofgalactic radio sources in the constellation of Monoceros, A&A 109 (May, 1982) 145–154.
[125] V. Borka Jovanović and D. Urošević, The Monoceros radio loop: Temperature, brightness,spectral index, and distance, Astronomische Nachrichten 330 (July, 2009) 741,[arXiv:0904.2261].
[126] C. Bonatto and E. Bica, Probing the age and structure of the nearby very young open clustersNGC2244 and 2239, MNRAS 394 (Apr., 2009) 2127–2140, [arXiv:0901.0833].
[127] B. Y. Welsh, D. M. Sfeir, S. Sallmen, and R. Lallement, Far Ultraviolet Spectroscopic Explorerobservations of high-velocity gas associated with the Monoceros Loop SNR, A&A 372 (June,2001) 516–526.
[128] G. Castelletti, G. Dubner, K. Golap, and W. M. Goss, New VLA observations of the SNRPuppis A: the radio properties and the correlation with the X-ray emission, A&A 459 (Nov.,2006) 535–544, [astro-ph/0607200].
[129] G. M. Dubner and E. M. Arnal, Neutral hydrogen and carbon monoxide observations towardsthe SNR Puppis A, A&AS 75 (Nov., 1988) 363–369.
[130] E. M. Reynoso, G. M. Dubner, W. M. Goss, and E. M. Arnal, VLA Observations of NeutralHydrogen in the Direction of Puppis A, AJ 110 (July, 1995) 318.
[131] P. F. Winkler, J. H. Tuttle, R. P. Kirshner, and M. J. Irwin, Kinematics of Oxygen-RichFilaments in Puppis a, in IAU Colloq. 101: Supernova Remnants and the Interstellar Medium(R. S. Roger and T. L. Landecker, eds.), p. 65, 1988.
[132] H. Alvarez, J. Aparici, J. May, and P. Reich, The radio spectral index of the Vela supernovaremnant, A&A 372 (June, 2001) 636–643.
– 29 –

[133] A. N. Cha, K. R. Sembach, and A. C. Danks, The Distance to the VELA Supernova Remnant,ApJL 515 (Apr., 1999) L25–L28, [astro-ph/9902230].
[134] P. A. Caraveo, A. De Luca, R. P. Mignani, and G. F. Bignami, The Distance to the VelaPulsar Gauged with Hubble Space Telescope Parallax Observations, ApJ 561 (Nov., 2001)930–937, [astro-ph/0107282].
[135] J. H. Taylor, R. N. Manchester, and A. G. Lyne, Catalog of 558 pulsars, ApJS 88 (Oct., 1993)529–568.
[136] M. Miceli, F. Bocchino, and F. Reale, Physical and Chemical Inhomogeneities inside the VelaSNR Shell: Indications of Ejecta Shrapnels, ApJ 676 (Apr., 2008) 1064–1072,[arXiv:0712.3017].
[137] S. Katsuda, H. Tsunemi, and K. Mori, The Slow X-Ray Expansion of the Northwestern Rimof the Supernova Remnant RX J0852.0-4622, ApJL 678 (May, 2008) L35–L38,[arXiv:0803.3266].
[138] M. P. Redman and J. Meaburn, A possible association of a young pulsar (PSR J0855-4644)with the young Vela supernova remnant RX J0852.0-4622, MNRAS 356 (Jan., 2005) 969–973.
[139] B. Aschenbach, Discovery of a young nearby supernova remnant, Nature 396 (Nov., 1998)141–142.
[140] A. F. Iyudin, V. Schönfelder, K. Bennett, H. Bloemen, R. Diehl, W. Hermsen, G. G. Lichti,R. D. van der Meulen, J. Ryan, and C. Winkler, Emission from 44Ti associated with apreviously unknown Galactic supernova, Nature 396 (Nov., 1998) 142–144.
[141] A. R. Duncan, R. T. Stewart, R. F. Haynes, and K. L. Jones, Supernova remnant candidatesfrom the Parkes 2.4-GHz survey, MNRAS 287 (June, 1997) 722–738.
[142] M. Stupar, Q. A. Parker, and M. D. Filipović, G315.1+2.7: a new Galactic supernovaremnant from the AAO/UKST Hα survey, MNRAS 374 (Feb., 2007) 1441–1448,[astro-ph/0612771].
[143] J. R. Dickel, R. G. Strom, and D. K. Milne, The Radio Structure of the Supernova RemnantG315.4-2.3 (MSH 14-63), ApJ 546 (Jan., 2001) 447–454, [astro-ph/0008042].
[144] M. Rosado, P. Ambrocio-Cruz, E. Le Coarer, and M. Marcelin, Kinematics of the galacticsupernova remnants RCW 86, MSH 15-56 and MSH 11-61A., A&A 315 (Nov., 1996) 243–252.
[145] J. Sollerman, P. Ghavamian, P. Lundqvist, and R. C. Smith, High resolution spectroscopy ofBalmer-dominated shocks in the RCW 86, Kepler and SN 1006 supernova remnants, A&A407 (Aug., 2003) 249–257, [astro-ph/0306196].
[146] R. S. Roger, D. K. Milne, M. J. Kesteven, K. J. Wellington, and R. F. Haynes, Symmetry ofthe radio emission from two high-latitude supernova remnants, G296.5 + 10.0 and G327.6 +14.6 (SN 1006), ApJ 332 (Sept., 1988) 940–953.
[147] E. Kalemci, S. E. Boggs, P. A. Milne, and S. P. Reynolds, Searching for AnnihilationRadiation from SN 1006 with SPI on INTEGRAL, ApJL 640 (Mar., 2006) L55–L57,[astro-ph/0602233].
[148] P. F. Winkler, G. Gupta, and K. S. Long, The SN 1006 Remnant: Optical Proper Motions,Deep Imaging, Distance, and Brightness at Maximum, ApJ 585 (Mar., 2003) 324–335,[astro-ph/0208415].
[149] A. Bamba, Y. Fukazawa, J. S. Hiraga, J. P. Hughes, H. Katagiri, M. Kokubun, K. Koyama,E. Miyata, T. Mizuno, K. Mori, H. Nakajima, M. Ozaki, R. Petre, H. Takahashi,T. Takahashi, T. Tanaka, Y. Terada, Y. Uchiyama, S. Watanabe, and H. Yamaguchi, SuzakuWide-Band Observations of SN1006, PASJ 60 (Jan., 2008) 153, [arXiv:0708.0073].
– 30 –

[150] D. A. Leahy, J. Nousek, and A. J. S. Hamilton, HEAO 1 A-2 low-energy detector X-rayspectra of the Lupus Loop and SN 1006, ApJ 374 (June, 1991) 218–226.
[151] J.-H. Shinn, K. W. Min, C.-N. Lee, J. Edelstein, E. J. Korpela, B. Y. Welsh, W. Han, U.-W.Nam, H. Jin, and D.-H. Lee, Diffuse Far-Ultraviolet Observations of the Lupus Loop Region,ApJL 644 (June, 2006) L189–L192, [astro-ph/0604454].
[152] J. S. Lazendic, P. O. Slane, B. M. Gaensler, S. P. Reynolds, P. P. Plucinsky, and J. P. Hughes,A High-Resolution Study of Nonthermal Radio and X-Ray Emission from Supernova RemnantG347.3-0.5, ApJ 602 (Feb., 2004) 271–285, [astro-ph/0310696].
[153] C. S. Shen, Pulsars and Very High-Energy Cosmic-Ray Electrons, ApJL 162 (Dec., 1970)L181.
[154] A. K. Harding and R. Ramaty, The Pulsar Contribution to Galactic Cosmic Ray Positrons, inInternational Cosmic Ray Conference, vol. 2 of International Cosmic Ray Conference, p. 92,1987.
[155] J. Arons, Pulsars as Gamma-Rays Sources: Nebular Shocks and Magnetospheric Gaps, SSRv75 (Jan., 1996) 235–255.
[156] L. Zhang and K. S. Cheng, Cosmic-ray positrons from mature gamma-ray pulsars, A&A 368(Mar., 2001) 1063–1070.
[157] E. Amato, The theory of pulsar wind nebulae, arXiv:1312.5945.
[158] M. Ruderman and P. Sutherland, Theory of pulsars: Polar caps, sparks, and coherentmicrowave radiation, AJ 196 (1975) 51.
[159] A. Cheng, M. Ruderman, and P. Sutherland, Current flow in pulsar magnetospheres, ApJ 203(Jan., 1976) 209–212.
[160] K. Cheng, C. Ho, and M. A. Ruderman, Energetic Radiation from Rapidly Spinning Pulsars.1. Outer Magnetosphere Gaps. 2. Vela and Crab, AJ 300 (1986) 500–539.
[161] M. J. Rees and J. E. Gunn, The origin of the magnetic field and relativistic particles in theCrab Nebula, MNRAS 167 (Apr., 1974) 1–12.
[162] Fermi-LAT Collaboration, D. Grasso et al., On possible interpretations of the high energyelectron-positron spectrum measured by the Fermi Large Area Telescope, Astropart.Phys. 32(2009) 140–151, [arXiv:0905.0636].
[163] A. M. Atoyan and F. A. Aharonian, On the mechanisms of gamma radiation in the CrabNebula, MNRAS 278 (Jan., 1996) 525–541.
[164] D. Malyshev, I. Cholis, and J. Gelfand, Pulsars versus dark matter interpretation ofATIC/PAMELA, Phy. Rev. D 80 (Sept., 2009) 063005, [arXiv:0903.1310].
[165] F. Aharonian, A. G. Akhperjanian, A. R. Bazer-Bachi, M. Beilicke, W. Benbow, D. Berge,K. Bernlöhr, C. Boisson, O. Bolz, V. Borrel, I. Braun, F. Breitling, A. M. Brown, R. Bühler,I. Büsching, S. Carrigan, P. M. Chadwick, L.-M. Chounet, R. Cornils, L. Costamante,B. Degrange, H. J. Dickinson, A. Djannati-Ataï, L. O’C. Drury, G. Dubus, K. Egberts,D. Emmanoulopoulos, B. Epinat, P. Espigat, F. Feinstein, E. Ferrero, G. Fontaine, S. Funk,S. Funk, Y. A. Gallant, B. Giebels, J. F. Glicenstein, P. Goret, C. Hadjichristidis, D. Hauser,M. Hauser, G. Heinzelmann, G. Henri, G. Hermann, J. A. Hinton, W. Hofmann, M. Holleran,D. Horns, A. Jacholkowska, O. C. de Jager, B. Khélifi, N. Komin, A. Konopelko, I. J. Latham,R. Le Gallou, A. Lemière, M. Lemoine-Goumard, T. Lohse, J. M. Martin,O. Martineau-Huynh, A. Marcowith, C. Masterson, T. J. L. McComb, M. de Naurois,D. Nedbal, S. J. Nolan, A. Noutsos, K. J. Orford, J. L. Osborne, M. Ouchrif, M. Panter,G. Pelletier, S. Pita, G. Pühlhofer, M. Punch, B. C. Raubenheimer, M. Raue, S. M. Rayner,A. Reimer, O. Reimer, J. Ripken, L. Rob, L. Rolland, G. Rowell, V. Sahakian, L. Saugé,S. Schlenker, R. Schlickeiser, U. Schwanke, H. Sol, D. Spangler, F. Spanier, R. Steenkamp,
– 31 –

C. Stegmann, G. Superina, J.-P. Tavernet, R. Terrier, C. G. Théoret, M. Tluczykont, C. vanEldik, G. Vasileiadis, C. Venter, P. Vincent, H. J. Völk, S. J. Wagner, and M. Ward, Firstdetection of a VHE gamma-ray spectral maximum from a cosmic source: HESS discovery ofthe Vela X nebula, A&A 448 (Mar., 2006) L43–L47, [astro-ph/0601575].
[166] A. M. Atoyan and F. A. Aharonian, On the mechanisms of gamma radiation in the crabnebula, MNRAS 278 (1996), no. 2 525–541,[http://mnras.oxfordjournals.org/content/278/2/525.full.pdf+html].
[167] Fermi-LAT Collaboration, A. Abdo et al., The Second Fermi Large Area Telescope Catalogof Gamma-ray Pulsars, ApJS 208 (2013) 17, [arXiv:1305.4385].
[168] P. Blasi and E. Amato, Positrons from pulsar winds, arXiv:1007.4745.
[169] H. Haino and the Ams-02 Collaboration, Precision measurement of the proton flux with AMS,Talk at the 33rd ICRC Conference (2013).
[170] V. Choutko and the Ams-02 Collaboration, Precision measurement of the helium flux withAMS, Talk at the 33rd ICRC Conference (2013).
[171] T. Kamae, N. Karlsson, T. Mizuno, T. Abe, and T. Koi, Parameterization of γ, e+/−, andNeutrino Spectra Produced by p-p Interaction in Astronomical Environments, ApJ 647 (Aug.,2006) 692–708, [astro-ph/0605581].
[172] C. D. Dermer, J. D. Finke, R. J. Murphy, A. W. Strong, F. Loparco, M. N. Mazziotta,E. Orlando, T. Kamae, L. Tibaldo, J. Cohen-Tanugi, M. Ackermann, T. Mizuno, and F. W.Stecker, On the Physics Connecting Cosmic Rays and Gamma Rays: Towards Determiningthe Interstellar Cosmic Ray Spectrum, ArXiv e-prints (Mar., 2013) [arXiv:1303.6482].
[173] C. D. Dermer, A. W. Strong, E. Orlando, L. Tibaldo, and for the Fermi Collaboration,Determining the Spectrum of Cosmic Rays in Interstellar Space from the Diffuse GalacticGamma-Ray Emissivity, ArXiv e-prints (July, 2013) [arXiv:1307.0497].
[174] D. Maurin, F. Donato, R. Taillet, and P. Salati, Cosmic Rays below Z=30 in a DiffusionModel: New Constraints on Propagation Parameters, ApJ 555 (July, 2001) 585–596,[astro-ph/0101231].
[175] F. Donato, N. Fornengo, D. Maurin, P. Salati, and R. Taillet, Antiprotons in cosmic rays fromneutralino annihilation, Phy. Rev. D 69 (Mar., 2004) 063501, [astro-ph/0306207].
[176] L. A. Fisk, Solar modulation of galactic cosmic rays, 2, JGR 76 (1971) 221.
[177] J. S. Perko, Solar modulation of galactic antiprotons, A&A 184 (Oct., 1987) 119–121.
[178] L. Maccione, Low energy cosmic ray positron fraction explained by charge-sign dependent solarmodulation, Phys.Rev.Lett. 110 (2013), no. 8 081101, [arXiv:1211.6905].
[179] S. Della Torre, P. Bobik, M. J. Boschini, C. Consolandi, M. Gervasi, et al., Effects of solarmodulation on the cosmic ray positron fraction, Adv.Space Res. 49 (2012) 1587–1592.
[180] A. W. Strong, E. Orlando, and T. R. Jaffe, The interstellar cosmic-ray electron spectrum fromsynchrotron radiation and direct measurements, A&A 534 (Oct., 2011) A54,[arXiv:1108.4822].
[181] E. Orlando and A. Strong, Galactic synchrotron emission with cosmic ray propagation models,MNRAS 436 (Dec., 2013) 2127–2142, [arXiv:1309.2947].
[182] J. J. Beatty, A. Bhattacharyya, C. Bower, S. Coutu, et al., New Measurement of theCosmic-Ray Positron Fraction from 5 to 15GeV, Phys.Rev.Lett. 93 (Dec., 2004) 241102,[astro-ph/0412230].
[183] S. W. Barwick, J. J. Beatty, C. R. Bower, et al., The Energy Spectra and Relative Abundancesof Electrons and Positrons in the Galactic Cosmic Radiation, ApJ 498 (May, 1998) 779,[astro-ph/9712324].
– 32 –
[184] S. W. Barwick, J. J. Beatty, A. Bhattacharyya, and HEAT Collaboration, Measurements ofthe Cosmic-Ray Positron Fraction from 1 to 50 GeV, ApJL 482 (June, 1997) L191,[astro-ph/9703192].
[185] M. A. DuVernois, S. W. Barwick, et al., Cosmic-Ray Electrons and Positrons from 1 to 100GeV: Measurements with HEAT and Their Interpretation, ApJ 559 (Sept., 2001) 296–303.
[186] M. Boezio, P. Carlson, T. Francke, et al., The Cosmic-Ray Electron and Positron SpectraMeasured at 1 AU during Solar Minimum Activity, ApJ 532 (Mar., 2000) 653–669.
[187] M. Boezio, G. Barbiellini, et al., Measurements of cosmic-ray electrons and positrons by theWizard/CAPRICE collaboration, Advances in Space Research 27 (2001) 669–674.
[188] K. Yoshida, S. Torii, T. Yamagami, et al., Cosmic-ray electron spectrum above 100 GeV fromPPB-BETS experiment in Antarctica, Advances in Space Research 42 (Nov., 2008) 1670–1675.
[189] S. Torii, T. Tamura, N. Tateyama, et al., The Energy Spectrum of Cosmic-Ray Electrons from10 to 100 GeV Observed with a Highly Granulated Imaging Calorimeter, ApJ 559 (Oct.,2001) 973–984.
[190] F. Aharonian, A. G. Akhperjanian, et al., Probing the ATIC peak in the cosmic-ray electronspectrum with H.E.S.S., A&A 508 (Dec., 2009) 561–564, [arXiv:0905.0105].
[191] I. G. Usoskin, K. Alanko-Huotari, G. A. Kovaltsov, and K. Mursula, Heliospheric modulationof cosmic rays: Monthly reconstruction for 1951-2004, Journal of Geophysical Research (SpacePhysics) 110 (Dec., 2005) 12108.
[192] I. G. Usoskin, G. A. Bazilevskaya, and G. A. Kovaltsov, Solar modulation parameter forcosmic rays since 1936 reconstructed from ground-based neutron monitors and ionizationchambers, Journal of Geophysical Research (Space Physics) 116 (Feb., 2011) 2104.
[193] H. Yuksel, M. D. Kistler, and T. Stanev, TeV Gamma Rays from Geminga and the Origin ofthe GeV Positron Excess, Phys.Rev.Lett. 103 (2009) 051101, [arXiv:0810.2784].
[194] I. Cholis and D. Hooper, Dark Matter and Pulsar Origins of the Rising Cosmic Ray PositronFraction in Light of New Data From AMS, Phys.Rev. D88 (2013) 023013, [arXiv:1304.1840].
– 33 –