International Migration and Economic Development Robert E.B. Lucas Boston University.
24
International Migration and Economic Development Robert E.B. Lucas Boston University
-
Upload
agnes-robertson -
Category
Documents
-
view
215 -
download
1
Transcript of International Migration and Economic Development Robert E.B. Lucas Boston University.

International Migration and Economic Development
Robert E.B. Lucas
Boston University

Adult Migrants In EU-15 By region of origin (2000)
Data Source: OECD Database on Expatriates and Immigrants, 2004
W Europe
E Europe
Former SovietN & C America
S America
S Asia
E Asia
Middle E
N Africa
SS Africa

Given widening income and demographic gaps
migration pressures will continue to grow

Medium Population Growth ProjectionsAnnual Growth 2005-2050: Ages 15-29
<-1%
<0%
<1%
<2%
>2%

Pressures to emigrate often reflect
– failure to create jobs– failure to maintain security
Emigration option is a critical safety valve

Average Unemployment RatesSelect Countries of Origin: 1990-2004 (approx).
RomaniaTurkey
MoroccoAlgeria
TunisiaSuriname
0
5
10
15
20
25
30

Refugees Originating Per Thousand Population (2003)
<0.1
<1
<10
>10

Despite growing economic gaps,migration has grown less quickly
than trade and financial flows

1960 1970 1980 1990 20000
1
2
3
4
5
6
7E
xpor
ts (
Trill
ion
US
200
0$)
0
1
2
3
4
5
6
7
Mig
rant
s (1
00 M
illio
n)
Global volume of exports
Global stock of migrants

Migration is not a substitute for development
Some risk of long-term
dependence on migration

Migrants are the big winnersDespite commercialization of migration
These gains to migrants
are a form of development

But migration can have important impacts on development at home
Not all impacts are positive
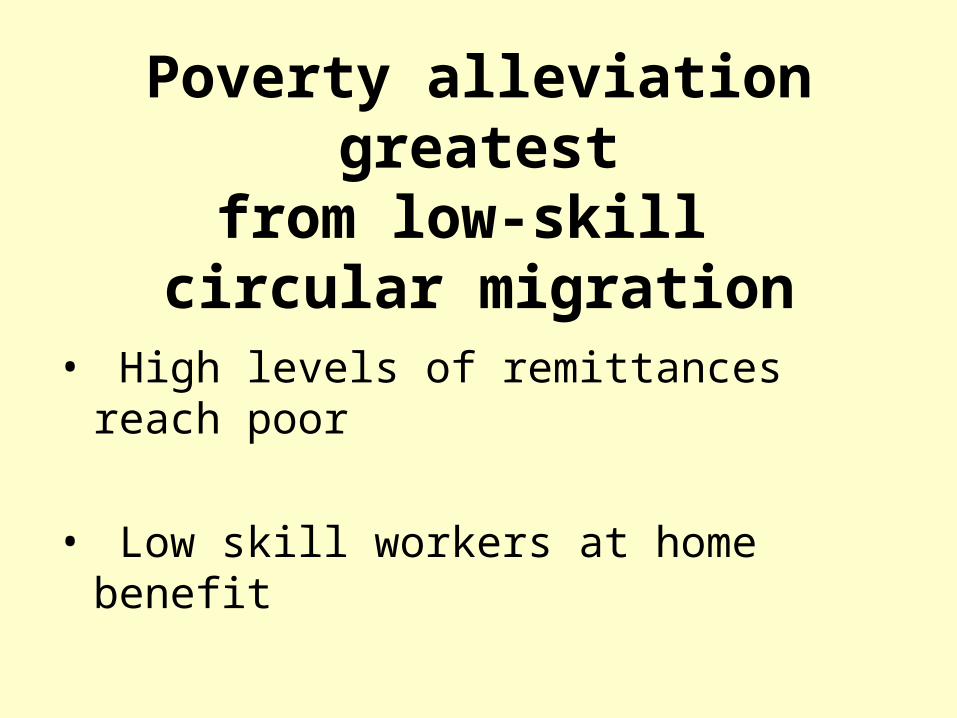
Poverty alleviation greatestfrom low-skill
circular migration
• High levels of remittances reach poor
• Low skill workers at home benefit

Reported Remittances Sent per Migrant (2000)
Source: IMF Balance of Payments Statistics and UN Trends in Migrant Stock
0
500
1000
1500
2000
2500
3000
US
$

But migration of low skilled workers to OECD
is largely from neighboring countries

Low-Skill Migration Rates to OECD
<1%<2%<3%<5%<10%>10%
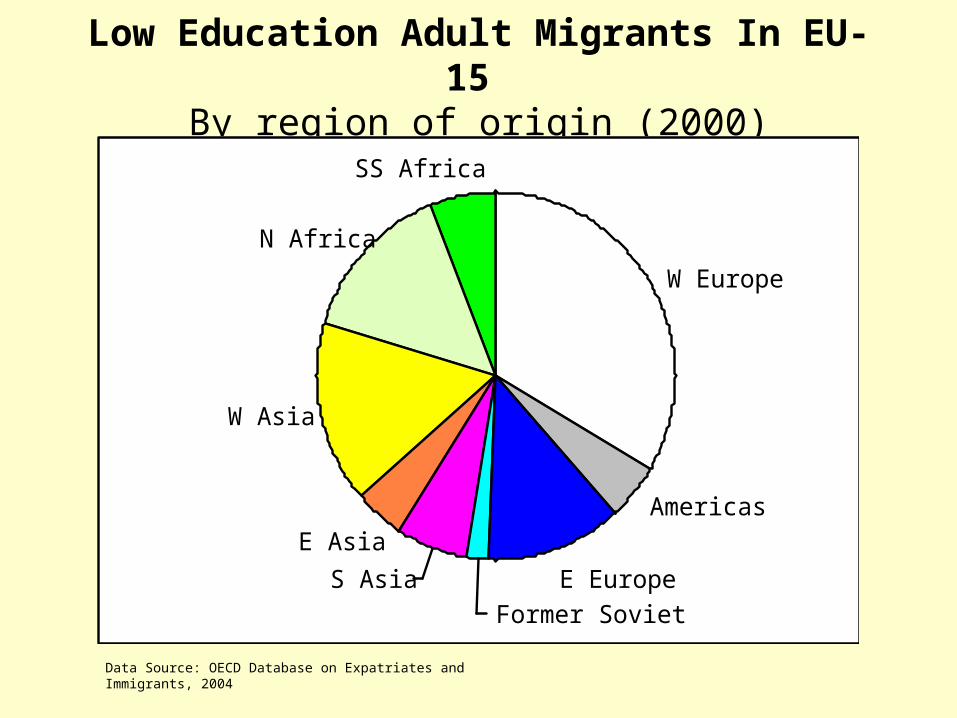
Low Education Adult Migrants In EU-15 By region of origin (2000)
W Europe
Americas
E EuropeFormer Soviet
S Asia
E Asia
W Asia
N Africa
SS Africa
Data Source: OECD Database on Expatriates and Immigrants, 2004

South-South Migration Dominates
For Low Skill Workers From Low Income Countries
Most is irregular
Calls for bilateral/regional agreements

High Skill Migration to OECD Growing RapidlyPercent of tertiary educated population abroad in OECD: 2000
<2%<5%<10%<20%>20%
Source: Mapped from Docquier and Marfouk (2005)

Tertiary Educated, Non-OECD Adults In EU-15 By region of origin (2000)
Data Source: OECD Database on Expatriates and Immigrants, 2004
Europe
Former Soviet
C America
S America
S AsiaE Asia
Middle E
N Africa
SS Africa
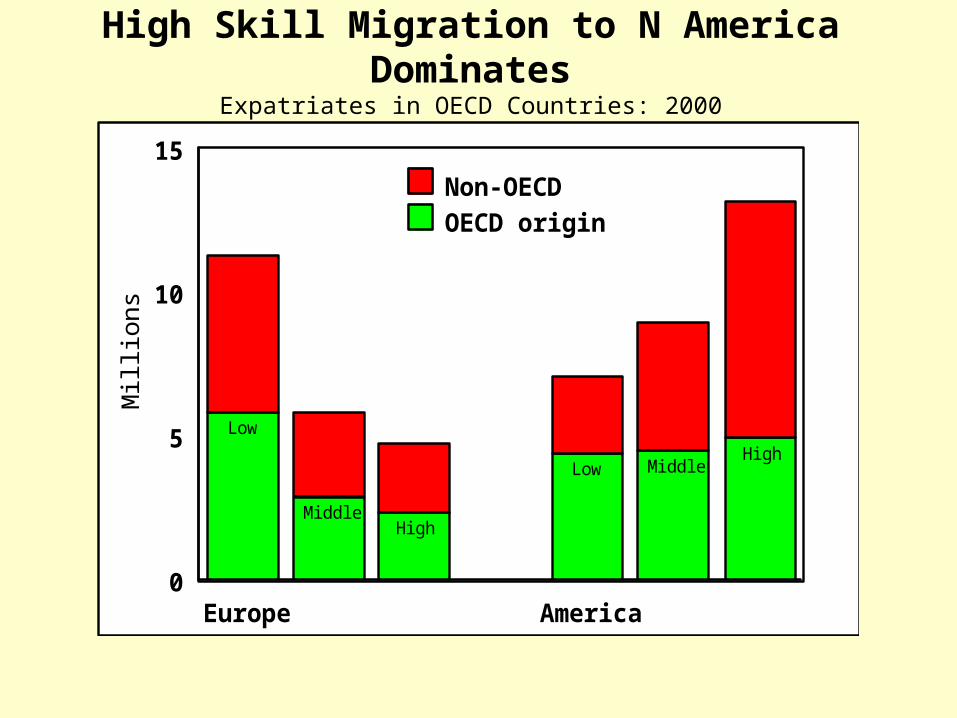
Low
MiddleHigh
Low MiddleHigh
Europe America0
5
10
15M
illio
ns
Non-OECD
OECD origin
High Skill Migration to N America DominatesExpatriates in OECD Countries: 2000

Distribution of Tertiary Educated Population From E Europe in OECD: 2000
RussiaLatvia
MoldovaUkraine
HungaryPoland
RomaniaBelarusCroatia
Czech RepublicLithuania
AlbaniaSlovenia
EstoniaBosnia and Herzegovi
BulgariaSlovakia
Serbia and MontenegrMacedonia
0 20 40 60 80 100
Percent
Other EuropeEU15 N America

Migration policies of high income countries
• Not part of coherent development strategy
• Competition to attract highly skilled (students)
• Yet protect low skill sectors (agriculture)

Low-Skill Temporary Migration Schemes Present a Dilemma
• Integration and rights of migrants
Family separation & social effects
• Managing returnTransferable pension schemes
Mode 4 and contracting
Cost of re-entry (irregulars)


![Observations on mr. [E.B.] Elliott's Horæ Apocalypticæpreteris/Books/... · Title: Observations on mr. [E.B.] Elliott's Horæ Apocalypticæ Author: Thomas Lumisden Strange,](https://static.fdocuments.us/doc/165x107/5e697d074000d87ea92727b3/observations-on-mr-eb-elliotts-horf-apocalypticf-preterisbooks.jpg)