
Jeffrey A. Hutchings and Megan E.B. Jones
26
Life history variation and growth rate thresholds for maturity in Atlantic salmon, Salmo salar Jeffrey A. Hutchings and Megan E.B. Jones Abstract: Based upon published and unpublished data compiled for 275 populations, we describe large-scale spatial and temporal patterns in Atlantic salmon, Salmo salar , life history and model these data to evaluate how changes to life history influence optimal growth rate thresholds for sea age at maturity. Population means (ranges in parentheses) describe the following for salmon throughout its range: smolt length = 14.8 cm (10.5–21.5 cm); smolt age = 2.91 years (1.04–5.85 years); egg-to-smolt survival = 1.5% (0.2–3.2%); grilse length = 56.8 cm (48.5–70.0 cm); sea age at maturity = 1.60 years (1.00–2.64 years); smolt-to-grilse survival = 7.4% (1.3–17.5%). Growth rate thresholds specify the length increase between the smolt and grilse stages above which reproduction after one winter at sea is favoured over later maturity. Our simulations indicated that increased growth generally favours earlier, but never delayed, maturity. Optimal growth rate thresholds for sea age at maturity are highly sensitive to survival but only moderately sensitive to fecundity, smolt size, and smolt age. Depending on an individual’s growth rate at sea, early maturity is favoured by decreased smolt age or by increased smolt length, fecundity, or survival (freshwater or marine). We suggest that future Atlantic salmon life history research focus upon reaction norms and growth rate thresholds for age at maturity, demographic and genetic consequences of male parr maturation, and the origin and maintenance of coexisting anadromous and nonanadromous life history polymorphisms. Résumé : À partir de données publiées et non publiées relatives à 275 populations, nous décrivons des profils spatiaux et temporels à grande échelle du cycle vital du saumon de l’Atlantique, Salmo salar , et modélisons ces données pour évaluer comment les changements dans le cycle vital influent sur les seuils de taux de croissance optimaux relatifs à la durée du séjour en mer avant la maturité. Les moyennes (fourchettes entre parenthèses) de divers paramètres des populations du saumon dans l’ensemble de son aire de répartition sont les suivantes : longueur des smolts = 14,8 cm (10,5-21,5 cm); âge des smolts = 2,91 ans (1,04–5,85 ans); taux de survie de l’oeuf au stade de smolt = 1,5 % (0,2– 3,2 %); longueur des grilses = 56,8 m (48,5–70,0 cm); durée du séjour en mer avant la maturité = 1,60 an (1,00–2,64 an); taux de survie du smolt au grilse = 7,4 % (1,3–17,5 %). Les seuils de taux de croissance indiquent l’accroissement de longueur du stade de smolt au stade de grils au-delà duquel la reproduction après un hiver en mer est favorisée par rapport à une maturité plus tardive. Nos simluations ont indiqué qu’une croissance accrue donne généralement lieu à une maturité hâtive, et jamais à une maturité retardée. Les seuils de croissance optimaux relatifs à la durée du séjour en mer avant la maturité sont hautement sensibles à la survie, mais seulement modérément sensibles à la fécondité, à la taille des smolts et à l’âge des smolts. Selon le taux de croissance individuel en mer, la maturité sera atteinte plus rapidement plus l’âge des smolts est bas et plus la longueur, la fécondité et le taux de survie (eau douce ou eau salée) de ces derniers sont élevés. Nous proposons de concentrer les recherches futures concernant le cycle vital du saumon atlantique sur les normes de réaction et les seuils de taux de croissance relatifs à la durée du séjour en mer avant la maturité, sur la démographie et les conséquences génétiques de la maturation des tacons mâles, et sur l’origine et le maintien des polymorphismes coexistants dans les cycles vitaux anadromes et non anadromes. [Traduit par la Rédaction] Hutchings and Jones 47 Life history variation in Atlantic salmon, Salmo salar , is matched by few vertebrates. Age at maturity ranges one or- der of magnitude from 1 year for male parr in France (Baglinière and Maisse 1985) to 10 years for some anadro- mous salmon in northern Québec (Power 1969; Robitaille et al. 1986). Size at maturity varies 14-fold from less than 7 cm for males in Newfoundland rivers (Hutchings 1986; Gibson et al. 1996) to more than 100 cm for females in Nor- way’s River Vosso (Huitfeldt-Kaas 1946). Fecundity can vary 500-fold from fewer than 40 eggs per female in wholly freshwater populations (Gibson et al. 1996) to 18 000 eggs per female in anadromous populations (e.g., Margaree River, Nova Scotia; Canadian Department of Fisheries and Oceans (DFO) unpublished data). Offspring size, measured as egg volume, varies more than three-fold from 48 mm 3 for land- locked salmon, or ouananiche, (4.5 mm egg diameter; Gib- son et al. 1996) to 171 mm 3 in anadromous individuals (6.9 mm diameter for salmon in Restigouche River, New Brunswick/Québec; DFO unpublished data). Since the early experimental (e.g., Shaw 1836) and de- scriptive work on Atlantic salmon life histories in Europe (e.g., Brown 1862; Miescher-Rusch 1883; Calderwood 1906; Dahl 1910) and in North America (Atkins 1884; Can. J. Fish. Aquat. Sci. 55(Suppl. 1): 22–47 (1998) © 1998 NRC Canada 22 Received November 11, 1997. Accepted September 17, 1998. J14294 J.A. Hutchings and M.E.B. Jones. Department of Biology, Dalhousie University, Halifax, NS B3H 4J1, Canada.
Transcript of Jeffrey A. Hutchings and Megan E.B. Jones

Life history variation and growth rate thresholdsfor maturity in Atlantic salmon, Salmo salar
Jeffrey A. Hutchings and Megan E.B. Jones
Abstract: Based upon published and unpublished data compiled for 275 populations, we describe large-scale spatialand temporal patterns in Atlantic salmon,Salmo salar, life history and model these data to evaluate how changes tolife history influence optimal growth rate thresholds for sea age at maturity. Population means (ranges in parentheses)describe the following for salmon throughout its range: smolt length = 14.8 cm (10.5–21.5 cm); smolt age = 2.91 years(1.04–5.85 years); egg-to-smolt survival = 1.5% (0.2–3.2%); grilse length = 56.8 cm (48.5–70.0 cm); sea age atmaturity = 1.60 years (1.00–2.64 years); smolt-to-grilse survival = 7.4% (1.3–17.5%). Growth rate thresholds specifythe length increase between the smolt and grilse stages above which reproduction after one winter at sea is favouredover later maturity. Our simulations indicated that increased growth generally favours earlier, but never delayed,maturity. Optimal growth rate thresholds for sea age at maturity are highly sensitive to survival but only moderatelysensitive to fecundity, smolt size, and smolt age. Depending on an individual’s growth rate at sea, early maturity isfavoured by decreased smolt age or by increased smolt length, fecundity, or survival (freshwater or marine). Wesuggest that future Atlantic salmon life history research focus upon reaction norms and growth rate thresholds for ageat maturity, demographic and genetic consequences of male parr maturation, and the origin and maintenance ofcoexisting anadromous and nonanadromous life history polymorphisms.
Résumé: À partir de données publiées et non publiées relatives à 275 populations, nous décrivons des profils spatiauxet temporels à grande échelle du cycle vital du saumon de l’Atlantique,Salmo salar, et modélisons ces données pourévaluer comment les changements dans le cycle vital influent sur les seuils de taux de croissance optimaux relatifs à ladurée du séjour en mer avant la maturité. Les moyennes (fourchettes entre parenthèses) de divers paramètres despopulations du saumon dans l’ensemble de son aire de répartition sont les suivantes : longueur des smolts = 14,8 cm(10,5-21,5 cm); âge des smolts = 2,91 ans (1,04–5,85 ans); taux de survie de l’oeuf au stade de smolt = 1,5 % (0,2–3,2 %); longueur des grilses = 56,8 m (48,5–70,0 cm); durée du séjour en mer avant la maturité = 1,60 an (1,00–2,64an); taux de survie du smolt au grilse = 7,4 % (1,3–17,5 %). Les seuils de taux de croissance indiquentl’accroissement de longueur du stade de smolt au stade de grils au-delà duquel la reproduction après un hiver en merest favorisée par rapport à une maturité plus tardive. Nos simluations ont indiqué qu’une croissance accrue donnegénéralement lieu à une maturité hâtive, et jamais à une maturité retardée. Les seuils de croissance optimaux relatifs àla durée du séjour en mer avant la maturité sont hautement sensibles à la survie, mais seulement modérément sensiblesà la fécondité, à la taille des smolts et à l’âge des smolts. Selon le taux de croissance individuel en mer, la maturitésera atteinte plus rapidement plus l’âge des smolts est bas et plus la longueur, la fécondité et le taux de survie (eaudouce ou eau salée) de ces derniers sont élevés. Nous proposons de concentrer les recherches futures concernant lecycle vital du saumon atlantique sur les normes de réaction et les seuils de taux de croissance relatifs à la durée duséjour en mer avant la maturité, sur la démographie et les conséquences génétiques de la maturation des tacons mâles,et sur l’origine et le maintien des polymorphismes coexistants dans les cycles vitaux anadromes et non anadromes.
[Traduit par la Rédaction] Hutchings and Jones 47
Life history variation in Atlantic salmon,Salmo salar, ismatched by few vertebrates. Age at maturity ranges one or-der of magnitude from 1 year for male parr in France(Baglinière and Maisse 1985) to 10 years for some anadro-mous salmon in northern Québec (Power 1969; Robitaille etal. 1986). Size at maturity varies 14-fold from less than7 cm for males in Newfoundland rivers (Hutchings 1986;Gibson et al. 1996) to more than 100 cm for females in Nor-
way’s River Vosso (Huitfeldt-Kaas 1946). Fecundity canvary 500-fold from fewer than 40 eggs per female in whollyfreshwater populations (Gibson et al. 1996) to 18 000 eggsper female in anadromous populations (e.g., Margaree River,Nova Scotia; Canadian Department of Fisheries and Oceans(DFO) unpublished data). Offspring size, measured as eggvolume, varies more than three-fold from 48 mm3 for land-locked salmon, or ouananiche, (4.5 mm egg diameter; Gib-son et al. 1996) to 171 mm3 in anadromous individuals(6.9 mm diameter for salmon in Restigouche River, NewBrunswick/Québec; DFO unpublished data).
Since the early experimental (e.g., Shaw 1836) and de-scriptive work on Atlantic salmon life histories in Europe(e.g., Brown 1862; Miescher-Rusch 1883; Calderwood1906; Dahl 1910) and in North America (Atkins 1884;
Can. J. Fish. Aquat. Sci.55(Suppl. 1): 22–47 (1998) © 1998 NRC Canada
22
Received November 11, 1997. Accepted September 17, 1998.J14294
J.A. Hutchings and M.E.B. Jones.Department of Biology,Dalhousie University, Halifax, NS B3H 4J1, Canada.
I:\Salmon Sup\D98-004.vpWednesday, February 10, 1999 9:35:58 AM
Color profile: DisabledComposite Default screen

Chambers 1896; Huntsman 1931), considerable research hasbeen directed to identifying the causal basis for populationdifferences in the ages at which salmon migrate to and re-turn from the sea (e.g., Schaffer and Elson 1975; Power1981; Myers and Hutchings 1987; Metcalfe and Thorpe1990; see also the review by Gardner (1976) and the paperscontained in Meerburg (1986)), and for population differ-ences in the incidence of early maturity among males (e.g.,Jones 1959; Thorpe 1975; Thorpe et al. 1983; Myers 1984;Myers et al. 1986; Hutchings and Myers 1988, 1994; see re-view by Fleming 1996). Within this research milieu, our ob-jectives were to describe spatial and temporal life historyvariation throughout the geographical range of Atlanticsalmon and, using the life history trait associations thatemerged, to predict optimal responses in sea age at maturityeffected by changes to growth rate and survival.
Naturally reproducing Atlantic salmon exist throughoutthe North Atlantic coasts from Maine to northern Labradorin North America, throughout Iceland, Ireland, and GreatBritain, and in mainland Europe from northern Spain to theKara River, Russia (Berg 1948; Nielson 1961; Scott andCrossman 1973). Anadromous individuals typically spend20–50% of their life at sea; nonanadromous populationsspend their entire life in fresh water. Females bury fertilizedeggs in the substrate of freshwater rivers and streams in au-tumn. After hatching, the young obtain nourishment from ayolk sac before emerging from the substrate in spring. Afterperiods of usually 1 to 5 years in fresh water as parr, anadro-mous individuals emigrate as smolts and generally spend 1or 2 (rarely 3 or 4) years at sea before returning to fresh wa-ter to spawn. In populations for which migration to sea isnot prevented by physical barriers, females are usually ana-dromous, although there are numerous exceptions in New-foundland (Hutchings 1986) and some elsewhere (Baglinièreand Masse 1985; also see Fleming 1996). In contrast, malesoften reproduce after 1 to 4 years in fresh water, after whichthey may or may not migrate to sea. Estimates of post-reproductive, overwinter survival for mature male parr rangefrom less than 15% (calculated from Hutchings 1985, 1986)to 40% (Myers 1984; Hutchings and Myers 1994); those foranadromous males and females are often less than 15%(Bley and Moring 1988).
There are several means by which one can practically as-sess the adaptive significance of life history variation in fish,each with its limitations and advantages. These include field(e.g., Reznick et al. 1990; Fleming and Gross 1993) or labo-ratory manipulation experiments (e.g., Metcalfe et al. 1989;Hutchings 1991), within- (e.g., Riddell and Leggett 1981;Sandlund et al. 1992) and among-population comparisons inthe field (e.g., Leggett and Carscadden 1978; Hutchings1993; Fox 1994), and analyses of data from the literature onlife history differences within and among species (e.g.,Beverton and Holt 1959; Schaffer and Elson 1975; Roff1984; Hutchings and Morris 1985). We adopt the last ofthese to describe and analyse Atlantic salmon life historyvariation throughout the species’ geographical range.
An extensive among-population study allows one to ex-amine life history differences throughout the entire range ofvariation expressed by a species, thus encompassing theboundaries or potential limits of phenotypic variation. As a
consequence, among-population correlations between lifehistory traits can delineate phenotypic patterns to which anygeneral life history model of Atlantic salmon should ascribe(Marschall et al. 1998). Limitations to analyzing data fromthe literature include practical issues such as (1) an inabilityto quantify measurement errors, (2) unknown sample sizes,and (3) varying numbers of years and time periods overwhich population means are estimated. There is also the the-oretical caveat that associations between life history traits atthe population level need not reflect natural selection. Thisis why we supplemented our analyses with empiricallybased simulations to predict optimal life history responseswithin populations.
Published and unpublished data were compiled for 13 lifehistory-related variables for 275 Atlantic salmon populations(Table 1; Appendices 1–2) and grouped by region: U.S.A.,Québec, Newfoundland, Canadian Maritimes, Iceland, Ire-land, Great Britain, mainland Europe, Norway, Sweden,Russia. Naturally, there are a number of means by whichpopulations could be classified. One could argue, for exam-ple, that latitudinal groupings might be appropriate. How-ever, given the extraordinary life history variation insalmonids that can exist within narrow ranges of latitude,e.g., incidence of male parr maturity in Atlantic salmon(Myers et al. 1986), survival and egg size in brook trout,Salvelinus fontinalis(Hutchings 1991, 1993), and age andsize at maturity in Arctic char,S. alpinus,(Skúlason et al.1998), even traditional latitudinal classifications can beproblematic. The geographical categories in which we havegrouped salmon populations approximate those used by na-tional (e.g., Canada’s DFO) and international (e.g., ICES)management agencies.
Rather than depicting the current status of specific popu-lations, the data presented in Appendix 1 are intended to re-flect the range of natural variation in Atlantic salmon lifehistory. For many populations, data have been obtained fromcomparatively recent statistics (e.g., Newfoundland popula-tions, 1950s to 1990s), for others they have not (e.g.,England, 1920s to 1950s). With few exceptions (e.g., theAmerican populations), data were collated for populationsthat are maintained by naturally reproducing salmon. Ourdata compilation should not be considered exhaustive; thereare assuredly data in the secondary literature that we haveoverlooked. It might be advantageous to use the present ini-tiative as a basis for constructing a web site devoted to At-lantic salmon population data worldwide.
Box-and-whisker plots were used to illustrate geograph-ical differences in life history. These plots are particularlyuseful for such a comparison because they allow for simplevisual inspection of medians (indicated by a bar in each box;Figs. 1–6), data composition (the lower and upper ends ofeach box represent the 25% and 75% quartiles, respec-tively), skewness (the position of the median relative to theends of each box), and data range (the “whiskers” representlines extending from the top and bottom of each box to adja-cent data no more than 1.5 times the inter-quartile range;values beyond this range are indicated by solid circles).
Can. J. Fish. Aquat. Sci.55(Suppl. 1): 23–47 (1998) © 1998 NRC Canada
23
I:\Salmon Sup\D98-004.vpWednesday, February 10, 1999 9:36:01 AM
Color profile: DisabledComposite Default screen

One-way analysis of variance was used to assess the signifi-cance of regional differences in life history trait means, cal-culated as the average of population means within a givenregion (Table 2). The regions included in each analysis de-pended upon data availability. Statistical significance wasbased upon 1000 randomizations of the data (Manly 1991).
Smolt-to-grilse survival estimates were modified to reflectpopulation differences in sea age at maturity. Unless a popu-lation is composed entirely of grilse (i.e., 1SW salmon), sur-vival estimates based upon the numbers of returning grilserelative to the number of smolts that emigrated the previousyear will underestimate smolt-to-grilse survival. This is be-cause some proportion of smolts are “pre-determined” to re-turn as multi-sea-winter fish. To account for this bias, wedivided reported smolt-to-grilse survival estimates by thepercentage of grilse in the population. It should be noted,however, that our estimates of percent grilse (i.e., (n grilse) /(n grilse +n multi-sea-winter salmon)) will be overestimatedwith the degree of overestimation declining with the truepercentage of grilse in a population. The reason for thisoverestimation is the absence of data on the number ofmulti-sea-winter salmon that died prior to returning to theirnatal river. In addition to these caveats, survival estimatesfor salmon at sea include natural and fishing mortality. Thus,the smolt-to-grilse survival data used here probably underes-timate true survival at sea.
To examine how various life history traits and growth rateat sea combine to influence optimal sea age at maturity, weestimated fitness,r, from the discrete-time version of theEuler-Lotka equation,
(1) 1 ==
=−∑ l m ex
x
x
xrx
α
ω
where, for agesx between maturityα and deathω, lx repre-sents the survival probability from birth to the beginning of
the spawning season at agex, andmx represents the numberof zygotes produced by an individual spawning at agex.Given the paucity of fecundity and survival data for thesame population, we examined how changes to single lifehistory traits influence optimal sea age at maturity by hold-ing the remaining traits constant at values equal to the grandmeans across all populations. These grand means, and theirrespective population minima and maxima, are given in Ta-ble 3.
Age-specific fecundities,mx, were calculated using thefecundity–length relationship intermediate among thosereported in Fleming’s (1996) review, i.e., the relationship be-tween fecundity (F) and length (L, cm) reported for Scot-land’s River Dee:F = 0.4667 (L 2.2018). The length of fishremaining two winters at sea was assumed to be 20 cmlonger than the length of grilse (20 cm being the average dif-ference in length between grilse and 2SW fish among allpopulations in the present data set). To generate differencesin fecundity in our simulations, we held the exponent of thefecundity–length regression model constant at 2.2 and variedthe intercept (there was no appreciable difference in the re-sults when holding the intercept constant and varying the ex-ponent).
In our model, survival of 2SW salmon from the smoltstage was set at 55% the survival from the smolt to the grilsestages (55% being the average survival difference reportedfor a tributary of the Miramichi River; Cunjak and Therrien1998). Optimal associations between growth rate at sea (ap-proximated by the difference between smolt and grilselengths) and sea age at maturity were calculated for the min-imum (0.013), average (0.074), and maximum (0.175)smolt-to-grilse survival probabilities reported in Appendix 1.The sensitivity of our simulations to our parameter estimatesis evident from the model’s graphical results.
To normalize the data and to remove any effect of themean on the variance, we transformed original data before
© 1998 NRC Canada
24 Can. J. Fish. Aquat. Sci. Vol. 55(Suppl. 1), 1998
RegionNumber ofpopulations Subregion
Number ofpopulations bysubregion
Iceland 78Newfoundland (Canada) 51 Newfoundland 47
Labrador 4Norway 37Québec (Canada) 36Maritimes (Canada) 19 Nova Scotia 10
New Brunswick 9Great Britain 18 Scotland 13
England and Wales 5Europe 15 France 11
Spain 4United States 8Ireland 6Sweden 5Russia 2Finland 1Total 275
Table 1. Geographical areas and number of populations included in the among-population lifehistory analyses.
I:\Salmon Sup\D98-004.vpWednesday, February 10, 1999 9:36:04 AM
Color profile: DisabledComposite Default screen
estimating temporal variation in life history traits (Sokal andRohlf 1981; Appendix 2). The variances of proportional data(i.e., survival, percentage grilse, grilse sex ratio) were calcu-lated from original proportions, p, transformed asarcsin(p½); variances of non-proportional data were calcu-lated from loge-transformations of the original data.
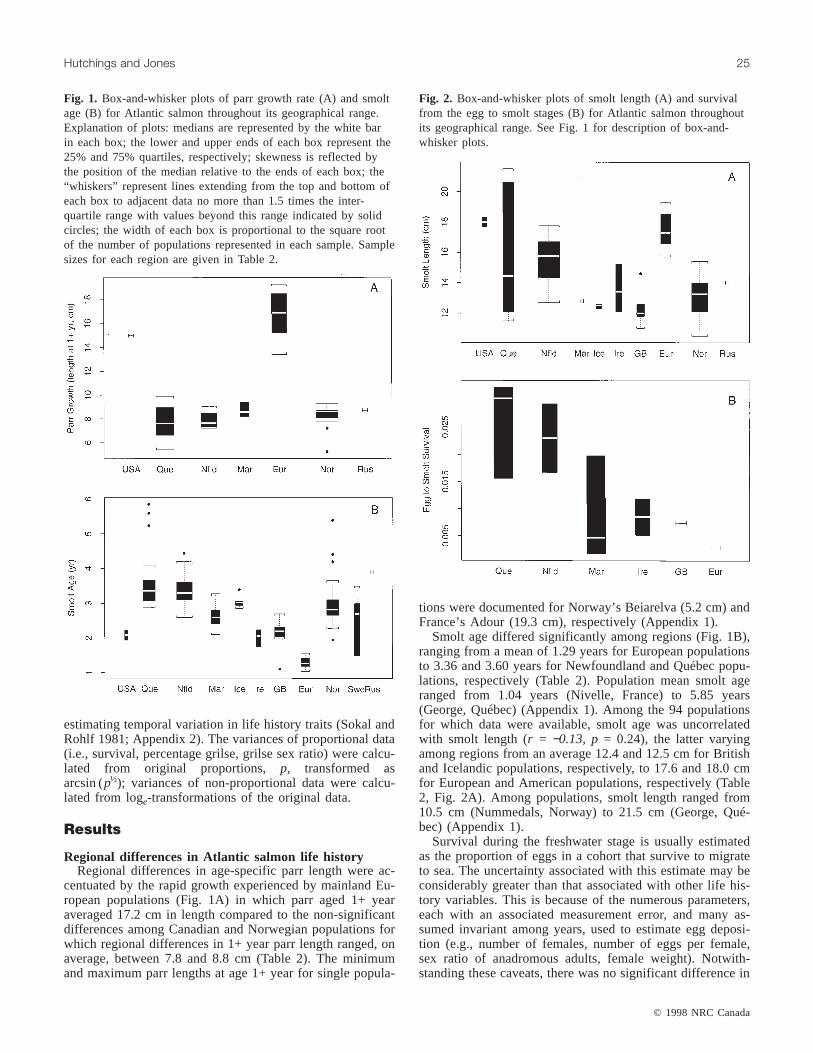
Regional differences in Atlantic salmon life historyRegional differences in age-specific parr length were ac-
centuated by the rapid growth experienced by mainland Eu-ropean populations (Fig. 1A) in which parr aged 1+ yearaveraged 17.2 cm in length compared to the non-significantdifferences among Canadian and Norwegian populations forwhich regional differences in 1+ year parr length ranged, onaverage, between 7.8 and 8.8 cm (Table 2). The minimumand maximum parr lengths at age 1+ year for single popula-
tions were documented for Norway’s Beiarelva (5.2 cm) andFrance’s Adour (19.3 cm), respectively (Appendix 1).
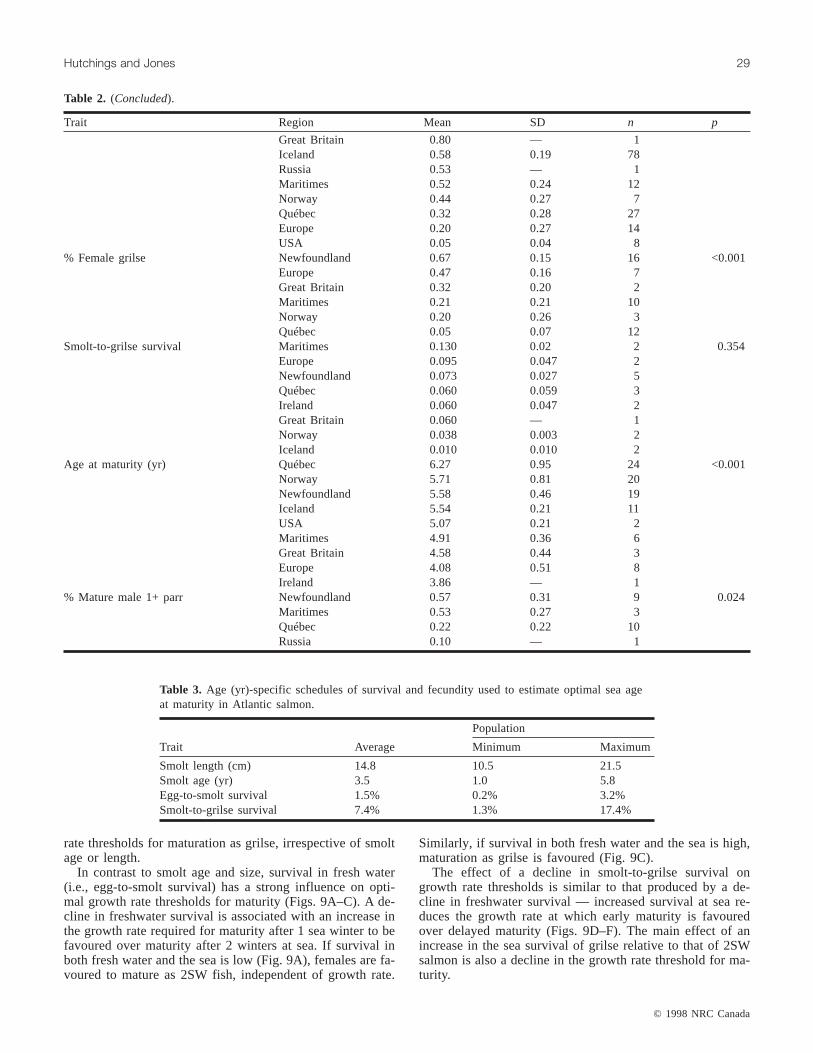
Smolt age differed significantly among regions (Fig. 1B),ranging from a mean of 1.29 years for European populationsto 3.36 and 3.60 years for Newfoundland and Québec popu-lations, respectively (Table 2). Population mean smolt ageranged from 1.04 years (Nivelle, France) to 5.85 years(George, Québec) (Appendix 1). Among the 94 populationsfor which data were available, smolt age was uncorrelatedwith smolt length (r = −0.13, p = 0.24), the latter varyingamong regions from an average 12.4 and 12.5 cm for Britishand Icelandic populations, respectively, to 17.6 and 18.0 cmfor European and American populations, respectively (Table2, Fig. 2A). Among populations, smolt length ranged from10.5 cm (Nummedals, Norway) to 21.5 cm (George, Qué-bec) (Appendix 1).
Survival during the freshwater stage is usually estimatedas the proportion of eggs in a cohort that survive to migrateto sea. The uncertainty associated with this estimate may beconsiderably greater than that associated with other life his-tory variables. This is because of the numerous parameters,each with an associated measurement error, and many as-sumed invariant among years, used to estimate egg deposi-tion (e.g., number of females, number of eggs per female,sex ratio of anadromous adults, female weight). Notwith-standing these caveats, there was no significant difference in
© 1998 NRC Canada
Hutchings and Jones 25
Fig. 2. Box-and-whisker plots of smolt length (A) and survivalfrom the egg to smolt stages (B) for Atlantic salmon throughoutits geographical range. See Fig. 1 for description of box-and-whisker plots.
Fig. 1. Box-and-whisker plots of parr growth rate (A) and smoltage (B) for Atlantic salmon throughout its geographical range.Explanation of plots: medians are represented by the white barin each box; the lower and upper ends of each box represent the25% and 75% quartiles, respectively; skewness is reflected bythe position of the median relative to the ends of each box; the“whiskers” represent lines extending from the top and bottom ofeach box to adjacent data no more than 1.5 times the inter-quartile range with values beyond this range indicated by solidcircles; the width of each box is proportional to the square rootof the number of populations represented in each sample. Samplesizes for each region are given in Table 2.
I:\Salmon Sup\D98-004.vpWednesday, February 10, 1999 9:36:13 AM
Color profile: DisabledComposite Default screen

egg-to-smolt survival among regions (Table 2, Fig. 2B). Al-though sample sizes were small and the range in estimateswithin regions large, data indicate that mean freshwater sur-vival is highest in Newfoundland and Québec (0.023 and0.026, respectively) and lowest among Northeast Atlanticpopulations, ranging from 0.003 to 0.009. Accounting forregional differences in mean smolt age, annual survivalprobabilities in fresh water ranged from 0.01 in Europe to0.33 in Newfoundland and Québec (other estimates include0.15 (Maritimes), 0.10 (Great Britain), and 0.09 (Ireland)).
Growth rate at sea can be approximated as the differencebetween the lengths of smolts and grilse. The latter differedby 20% among regions (Fig. 3A, Table 2) being lowest inthe western North Atlantic (regional averages of 53.2, 54.3,and 54.7 cm for Newfoundland, Maritime, and Québec pop-ulations, respectively) and highest in the eastern North At-lantic (e.g., 62.0 and 64.1 cm for British and Europeanpopulations, respectively). On average, the smallest grilsewere those in Québec’s Jupiter (48.5 cm) with the largest be-ing those in Spain’s Narcea (70.0 cm) (Appendix 1). Aver-age length gained at sea between the smolt and grilse stagesdiffered significantly among Newfoundland (37.4 cm), Qué-bec (38.8 cm), Maritimes (40.9 cm), Norway (45.9 cm), andEurope (49.2 cm) (Fig. 3B).
Mean sea age at maturity differed significantly among re-gions (Fig. 4A). Comparing the extremes (Table 2), Ameri-
can (1.96 years), Norwegian (1.83 years), and mainland Eu-ropean (1.81 years) salmon spend 60 to 70% more time atsea than those in Newfoundland (1.15 years) and Ireland(1.13 years). Among populations, the youngest average seaages were those for Newfoundland’s Wings Brook(1.00 year) and Western Arm Brook (1.01 years) and theoldest for Norway’s Vosso (2.58 years) and Årøelva(2.64 years) (Appendix 1). Among regions, the average inci-dence of grilse ranged from 5% for American populations to86 and 91% for Newfoundland and Ireland populations,respectively (Table 2, Fig. 4B). The female sex ratio of re-turning grilse, varying from 5% (Québec) to 67% (New-foundland), also differed significantly among regions (Fig.5A, Table 2). Average smolt-to-grilse survival, highest inthe Maritimes (0.130) and lowest in Iceland (0.010), did notdiffer significantly among regions, although sample sizeswere low and the range in population estimates within re-gions high (Table 2, Fig. 5B).
Salmon age at maturity (smolt age plus sea age plus1 year, to ensure that total age represented absolute time be-tween an individual’s fertilization and spawning) differedsignificantly among regions (p < 0.001) (Table 2, Fig. 6).The oldest average ages at maturity were found in Québec(6.27 years; species’ population maximum of 8.80 yearsin George), Norway (5.71 years), and Newfoundland(5.58 years) with the youngest observed in Great Britain(4.58 years), mainland Europe (4.08 years; species’ popula-
© 1998 NRC Canada
26 Can. J. Fish. Aquat. Sci. Vol. 55(Suppl. 1), 1998
Fig. 3. Box-and-whisker plots of length of 1SW salmon (A) andgrowth rate at sea (the differences between lengths of smolts and1SW salmon) (B) for Atlantic salmon throughout itsgeographical range. See Fig. 1 for description of box-and-whisker plots.
Fig. 4. Box-and-whisker plots of sea age at maturity (A) andpercentage of grilse (B) for Atlantic salmon throughout itsgeographical range. See Fig. 1 for description of box-and-whisker plots.
I:\Salmon Sup\D98-004.vpWednesday, February 10, 1999 9:36:22 AM
Color profile: DisabledComposite Default screen

tion minimum of 3.21 years in Nivelle), and Ireland(3.86 years).
The freshwater residence period of anadromous salmondeclined with increasing parr growth at the population level(r = −0.79,p < 0.001; Fig. 7A). In addition to being the pri-mary determinant of smolt age, previous work suggests thatparr growth rate is also positively associated with the inci-
dence of male parr maturity (Myers et al. 1986; Thorpe1986) which differs significantly among Canadian popula-tions, ranging from an average of 22% for Québec popula-tions to 57% in Newfoundland (Appendix 1, Table 2).
Time spent at sea, a major component of age at maturityfor anadromous salmon, was positively associated withgrowth rate at sea among populations (r = 0.47,p = 0.002;Fig 7B). Sea age at maturity was not correlated with post-smolt survival at the population level (r = −0.17,p = 0.254).
Predicted optimal associations among growth rate,survival, and sea age at maturity
Empirically based model simulations provide one meansof identifying optimal associations among growth rate, sur-vival, and sea age at maturity. A primary feature of the re-sults of these analyses (Figs. 8–10) is the characterization ofgrowth rate thresholds for sea age at maturity, i.e., the 1-yearincrease in length between the smolt and grilse stages thatfavours reproduction after one rather than two winters at sea.
Age and length at smoltification appear to have compara-tively small influence on optimal growth rate thresholds forsea age at maturity (Fig. 8A–F). The primary effects of in-creases in smolt age and smolt length are increases and de-clines in growth rate thresholds, respectively, overcomparatively small ranges of 5 to 10 cm·year−1. Increased1SW survival (i.e., smolt-to-grilse survival) reduces growth
© 1998 NRC Canada
Hutchings and Jones 27
Fig. 5. Box-and-whisker plots of the percentage of grilse that arefemales (A) and adjusted survival between the smolt and grilsestages (B) for Atlantic salmon throughout its geographical range.See Fig. 1 for description of box-and-whisker plots.
Fig. 6. Box-and-whisker plot of age at maturity (smolt age plussea age plus 1, see text for further details) for Atlantic salmonthroughout its geographical range. See Fig. 1 for description ofbox-and-whisker plots.
Fig. 7. Scatterplots between smolt age and parr growth (length atage 1+ year) (A) and between sea age at maturity and growthrate at sea (B) for Atlantic salmon populations throughout thespecies’ range.
I:\Salmon Sup\D98-004.vpWednesday, February 10, 1999 9:36:33 AM
Color profile: DisabledComposite Default screen

© 1998 NRC Canada
28 Can. J. Fish. Aquat. Sci. Vol. 55(Suppl. 1), 1998
Trait Region Mean SD n p
Parr length at 1+ year (cm) Europe 16.7 2.1 8 <0.001U.S.A. 15.0 — 1Maritimes 8.8 0.6 3Russia 8.7 — 1Norway 8.3 0.9 17Newfoundland 7.9 0.7 9Québec 7.8 1.4 11
Smolt age (years) Russia 3.90 — 1 <0.001Québec 3.60 0.79 27Newfoundland 3.36 0.45 45Iceland 3.03 0.13 11Norway 3.01 0.74 25Finland 2.70 — 1Maritimes 2.59 0.33 13Sweden 2.44 0.90 5Great Britain 2.18 0.35 17U.S.A. 2.08 0.20 2Ireland 2.02 0.25 3Europe 1.29 0.15 13
Smolt length (cm) U.S.A. 18.0 0.4 2 <0.001Europe 17.6 1.4 6Newfoundland 15.5 1.4 38Québec 15.5 3.9 10Russia 14.0 — 1Ireland 13.6 1.6 3Maritimes 13.4 0.8 2Norway 13.1 1.2 22Iceland 12.5 0.2 3Great Britain 12.4 1.4 5
Egg-to-smolt survival Québec 0.026 0.010 3 0.25Newfoundland 0.023 0.009 2Maritimes 0.009 0.010 3Ireland 0.009 0.005 2Great Britain 0.007 — 1Europe 0.003 — 1
Grilse length (cm) Europe 64.1 3.4 10 <0.001Great Britain 62.0 2.1 2Ireland 61.8 2.6 2Norway 59.5 4.3 25U.S.A. 57.5 3.5 2Québec 54.7 3.5 22Maritimes 54.3 1.5 12Newfoundland 53.2 1.6 22
Sea age (years) U.S.A. 1.96 0.50 8 <0.001Norway 1.83 0.51 24Europe 1.81 0.44 8Québec 1.72 0.33 33Russia 1.56 — 1Iceland 1.50 0.12 11Maritimes 1.43 0.33 11Great Britain 1.43 0.40 3Newfoundland 1.15 0.17 23Ireland 1.13 0.03 2
% Grilse Ireland 0.91 0.04 3 <0.001Newfoundland 0.86 0.15 20
Table 2. Regional means of Atlantic salmon life history traits and associated ANOVA results. Means represent averages amongpopulations (n) within regions; standard deviations are those for the regional means; population averages represent means across yearsof available data.
I:\Salmon Sup\D98-004.vpWednesday, February 10, 1999 9:36:36 AM
Color profile: DisabledComposite Default screen
rate thresholds for maturation as grilse, irrespective of smoltage or length.
In contrast to smolt age and size, survival in fresh water(i.e., egg-to-smolt survival) has a strong influence on opti-mal growth rate thresholds for maturity (Figs. 9A–C). A de-cline in freshwater survival is associated with an increase inthe growth rate required for maturity after 1 sea winter to befavoured over maturity after 2 winters at sea. If survival inboth fresh water and the sea is low (Fig. 9A), females are fa-voured to mature as 2SW fish, independent of growth rate.
Similarly, if survival in both fresh water and the sea is high,maturation as grilse is favoured (Fig. 9C).
The effect of a decline in smolt-to-grilse survival ongrowth rate thresholds is similar to that produced by a de-cline in freshwater survival — increased survival at sea re-duces the growth rate at which early maturity is favouredover delayed maturity (Figs. 9D–F). The main effect of anincrease in the sea survival of grilse relative to that of 2SWsalmon is also a decline in the growth rate threshold for ma-turity.
© 1998 NRC Canada
Hutchings and Jones 29
Trait Region Mean SD n p
Great Britain 0.80 — 1Iceland 0.58 0.19 78Russia 0.53 — 1Maritimes 0.52 0.24 12Norway 0.44 0.27 7Québec 0.32 0.28 27Europe 0.20 0.27 14USA 0.05 0.04 8
% Female grilse Newfoundland 0.67 0.15 16 <0.001Europe 0.47 0.16 7Great Britain 0.32 0.20 2Maritimes 0.21 0.21 10Norway 0.20 0.26 3Québec 0.05 0.07 12
Smolt-to-grilse survival Maritimes 0.130 0.02 2 0.354Europe 0.095 0.047 2Newfoundland 0.073 0.027 5Québec 0.060 0.059 3Ireland 0.060 0.047 2Great Britain 0.060 — 1Norway 0.038 0.003 2Iceland 0.010 0.010 2
Age at maturity (yr) Québec 6.27 0.95 24 <0.001Norway 5.71 0.81 20Newfoundland 5.58 0.46 19Iceland 5.54 0.21 11USA 5.07 0.21 2Maritimes 4.91 0.36 6Great Britain 4.58 0.44 3Europe 4.08 0.51 8Ireland 3.86 — 1
% Mature male 1+ parr Newfoundland 0.57 0.31 9 0.024Maritimes 0.53 0.27 3Québec 0.22 0.22 10Russia 0.10 — 1
Table 2. (Concluded).
Population
Trait Average Minimum Maximum
Smolt length (cm) 14.8 10.5 21.5Smolt age (yr) 3.5 1.0 5.8Egg-to-smolt survival 1.5% 0.2% 3.2%Smolt-to-grilse survival 7.4% 1.3% 17.4%
Table 3. Age (yr)-specific schedules of survival and fecundity used to estimate optimal sea ageat maturity in Atlantic salmon.
I:\Salmon Sup\D98-004.vpWednesday, February 10, 1999 9:36:39 AM
Color profile: DisabledComposite Default screen

Within the two-fold range of 1500 to 3000 eggs per 50-cmfemale, as calculated for Atlantic salmon from the regres-sions given by Fleming (1996), fecundity appears to havecomparably little effect on growth rate thresholds for sea ageat maturity, being of import within growth rates of10 cm yr−1 or less (Fig. 10). Again, an increase in 1SW sur-vival is predicted to favour earlier maturity, the reduction ingrowth rate threshold being largely independent of fecun-dity.
Temporal variation in life historyTo illustrate temporal variation in salmon life history
characters, we plotted time series of seven traits in popula-tions for which the loge- or arcsin-transformed variancesrepresented the among-population means, minima, and max-ima (Fig. 11; Appendix 2).
The longest continuous time series of estimates of percentgrilse (24 years; Western Arm Brook; Fig. 11A) exhibits re-markably low variation with estimates ranging between 95and 100% although annual fluctuations of 20 to 30% appearto be not uncommon in other populations. Smolt-to-grilsesurvival, adjusted for grilse percentage as described previ-ously, ranged from 2.1 to 12.2% for Western Arm Brook, thepopulation for which interannual variance in survival repre-sented the among-population average (Fig. 11B). Annualfluctuations in grilse sex ratio ranged from a low of 5% (NEPlacentia River) to as much as 50% (Lomond River) with 10to 20% being typical (Fig. 11C). For the only time series offecundity extending more than 3 years, annual changes of500 to 1000 eggs per female appear to be not uncommon(Fig. 11D).
Smolt age fluctuated comparatively little within popula-tions, varying by less than 0.5 year annually within popula-tions (Fig. 11E). Annual changes in grilse length of 2 to3 cm appear to be typical (e.g., Western Arm Brook;
© 1998 NRC Canada
30 Can. J. Fish. Aquat. Sci. Vol. 55(Suppl. 1), 1998
Fig. 8. Effect of smolt age (A–C) and smolt length (D–F) ongrowth rate thresholds for sea age at maturity in female Atlanticsalmon at low (0.0135), average (0.0740), and high (0.1740)rates of smolt-to-grilse survival. Growth rate thresholds,identified by continuous lines in each bivariate plot, identify thegrowth rate at sea, approximated here as the difference in lengthbetween smolts and grilse, that must be exceeded for maturityafter one winter at sea (1SW) to be favoured (i.e., have a higherfitness,r) over the strategy of maturing after two winters at sea(2SW). Thus, combinations of smolt age or smolt length andgrowth at sea that lie to the right of each line are those thatfavour maturity after one winter at sea; those to the left of eachline favour maturity after two winters at sea.
Fig. 9. Effect of survival in fresh water and at sea on growthrate thresholds for sea age at maturity in female Atlantic salmon.Figures A–C illustrate changes in thresholds effected by changesin egg-to-smolt survival at low (0.0135), average (0.0740), andhigh (0.1740) rates of smolt-to-grilse survival. Figures D–Eillustrate changes in thresholds effected by changes in smolt-to-grilse survival at low (0.25), average (0.55), and high (0.75)ratios of survival between the sea survival of 1SW versus 2SWsalmon. Growth rate thresholds are defined further in the captionfor Fig. 8.
I:\Salmon Sup\D98-004.vpWednesday, February 10, 1999 9:36:49 AM
Color profile: DisabledComposite Default screen

Fig. 11F) although for some populations (e.g., Conne River)this variable is remarkably constant. Annual fluctuations insmolt length are typically less than 1 cm, as indicated bysalmon from Norway’s River Alta (Fig. 11G).
Temporal variation in life history characters was generallyuncorrelated with life history trait means of other characters.A notable exception was a negative association between seaage at maturity and temporal variance in survival at sea for15 populations throughout the species’ geographical range(r = −0.51, p = 0.025).
Our initial postulate that life history variation in Atlanticsalmon is matched by few vertebrates seems an appropriatecharacterization of the life history data available for this spe-cies. There are sufficient data on Atlantic salmon to con-struct an empirical framework against which life historyresponses to changes in growth rate and mortality can bepredicted. What cannot as yet be predicted with confidenceis the rate at which such changes might occur. This is aquestion of quantitative genetics and phenotypic plasticity,and the answer(s) depend upon the amount of heritable vari-ation in life history traits, the sign and magnitude of genetic
correlations among traits, the existence of reaction norms,and temporal variation in the environment (Charlesworth1990; Roff 1997). Based on previous research (see alsoFleming 1998; Marschall et al. 1998; Metcalfe 1998), thespatial and temporal data presented here, and our optimalitymodelling of sea age at maturity, there are sufficient datafrom which some general conclusions regarding the effectsof growth and survival on Atlantic life history can be drawn.Following a discussion of these below, we suggest areas ofresearch, for which there is comparatively little information,upon which future work on Atlantic salmon life historymight focus.
Influence of growth rate on seaward migration andmaturity as parr
The negative association between parr growth rate andsmolt age (Fig. 7A) is consistent with individual and popula-tion studies in the wild and in the laboratory. The hypothesisthat increased growth rate in fresh water leads to decreasedage at smoltification was first proposed by Dahl (1910). Hepostulated that the reduction in length of growing seasonwas responsible for the increase in smolt age with latitude inNorwegian populations. Power (1981) also found smolt agein Québec, Newfoundland, and Labrador populations to benegatively associated with length of growing season.Metcalfe and Thorpe (1990) have shown that this negativeassociation persists throughout the geographical range of At-lantic salmon and that more than 82% of the among-population variation in smolt age can be explained by atemperature- and photoperiod-based metric of growth rate infreshwater. At the individual level, Menzies (1927) observedthat the oldest smolts in two Scottish populations tended tobe those having the slowest growth rates as parr. This nega-tive association between parr growth rate and smolt age, fur-ther noted by Jones (1959) and Shearer (1972), has beendocumented repeatedly in the laboratory (e.g., Thorpe 1977;Thorpe and Morgan 1980; Saunders et al. 1982; see Thorpe1986 and Saunders 1986).
How might increased growth rate be related to the fitnessbenefits of early maturity? Rapid growth during pre-reproductive ages reduces the time required to attain a sizeat which reproduction is possible. By shortening this periodof time, an individual increases its probability of survivingto reproduce. For anadromous salmon, the sooner an indi-vidual migrates to sea, the sooner it reaches a size at whichit can reproduce. This provides one explanation for the nega-tive association between parr growth rate and smolt ageamong Atlantic salmon populations. Similarly, increased in-cidence of maturity with increased growth rate can be inter-preted as an adaptive response by male parr (Hutchings andMyers 1994; Thorpe et al. 1997; Metcalfe 1998). Such amaturation response appears not to be adaptive for femaleparr, presumably because the fitness benefit of increasedpre-reproductive survival does not outweigh the fitness costof the low fecundity effected by small body size.
Fitness trade-offs between early and delayed maturityat sea
Previous support for the hypothesis that growth rate at seainfluences sea age at maturity has been equivocal. In his re-view, Gardner (1976) found evidence of both positive and
© 1998 NRC Canada
Hutchings and Jones 31
Fig. 10. Effect of fecundity on growth rate thresholds for seaage at maturity in female Atlantic salmon at low (0.0135),average (0.0740), and high (0.1740) rates of smolt-to-grilsesurvival (A–C). Growth rate thresholds are defined further in thecaption for Fig. 8.
I:\Salmon Sup\D98-004.vpWednesday, February 10, 1999 9:36:54 AM
Color profile: DisabledComposite Default screen

negative associations between growth at sea and time spentat sea, concluding that, “it is certain there is no causal oruniversal relationship between growth rate … in the sea, andthe age at eventual return to fresh water” (Gardner1976:320). Similar to our pattern (Fig. 7B), Schaffer and
Elson (1975) previously documented a positive associationbetween growth at sea and age at maturity for 14 NorthAmerican populations, although their observation was sup-ported neither by a re-analysis of the same data nor by ananalysis of an expanded population data set (Myers andHutchings 1987).
Our modelling of growth rate thresholds provides an em-pirical framework against which changes in sea age at matu-rity effected by changes in growth rate at sea can bepredicted. For a given age-specific schedule of survival andfecundity, i.e., within a single population, optimal sea age atmaturity is predicted to either decline or remain constantwith increases in growth rate at sea (Figs. 8–10); delayedmaturity appears not to be favoured by increased growthrate, all else being equal. The conclusion that earlier age atmaturity is an adaptive response to increased growth rate atsea is consistent with theory (Roff 1992; Stearns 1992;Hutchings 1993, 1996) and with life history patterns ob-served in Atlantic salmon (e.g., Friedland and Haas 1996)and other salmonids (e.g., Hutchings 1996, 1997).
For a given growth rate at sea, our modelling suggeststhat uncorrelated changes to single life history characterswill often have no effect on sea age at maturity. However,when an individual’s growth at sea is encompassed by therange of growth rates within which changes to sea age atmaturity are predicted to be favoured by selection, uncorre-lated changes to single traits influence optimal age at matu-rity. Early maturity (i.e., maturation as a 1SW rather than a2SW salmon) is favoured by increases in smolt length, fe-cundity, survival in fresh water or at sea, and survival ofgrilse relative to that of 2SW salmon (Figs. 8–10). Delayedmaturity is favoured by reductions in smolt size, fecundity,and survival, but by increases in smolt age.
The fitness simulations may provide some insight into thecausal basis for regional differences in Atlantic salmon lifehistory. For example, compared to Newfoundland popula-tions, European salmon grow rapidly at sea but spend almosttwice as much time in the marine environment beforespawning. According to the life history simulations, such anassociation between growth rate and sea age at maturity isadaptive only when smolt-to-grilse survival at sea, and sec-ondarily egg-to-smolt survival, is low. At the other extreme,the observed associations among smolt age, smolt length,growth at sea, and sea age at maturity for Newfoundlandpopulations suggest that survival at sea, and secondarily sur-vival in freshwater, is comparatively high.
Does age at maturity covary with temporal variation insurvival?
We documented a negative association between sea age atmaturity and temporal variance in smolt-to-grilse survival atsea. One implicit assumption of our analysis was that varia-
© 1998 NRC Canada
32 Can. J. Fish. Aquat. Sci. Vol. 55(Suppl. 1), 1998
Fig. 11. Temporal variation in Atlantic salmon life historycharacters. The variances of proportional data (i.e., survival,percentage grilse, grilse sex ratio) have been calculated fromoriginal proportions,p, transformed as arcsin(p1/2). Variances ofnon-proportional data have been calculated from loge-transformations of the original data. Plotted time series are thosethat approximate the among-population means (m—m), minima(j – – – j), and maxima (d - - - d).
I:\Salmon Sup\D98-004.vpWednesday, February 10, 1999 9:37:03 AM
Color profile: DisabledComposite Default screen

tion in survival from the smolt to the grilse stages accuratelyreflected variation in survival after the grilse stage. This as-sumption appears reasonable, given the significantly positivecorrelation that exists between the variances in smolt-to-grilse and smolt-to-2SW survival probabilities for salmon inthe Rivers Vesturdalsa, Bush, Imsa, and North Esk (r = 0.99,p = 0.003; ICES 1994a).
Although life history theory provides no clear predictionof how variation in survival at potentially reproductive agesshould influence age at maturity (Charlesworth 1994), wesuggest that as variation in smolt-to-grilse survival in-creases, so does the uncertainty associated with the probabil-ity of surviving two or more winters at sea. In environmentswhere this uncertainty is high, selection may act against ge-notypes that delay maturity by prolonging the time spent atsea. This might account for the negative association betweensea age at maturity and variance in smolt-to-grilse survivalobserved here.
Future researchAlthough addressed indirectly by the fitness simulations,
we did not examine genotype-by-environment interactions inAtlantic salmon life history. Adaptive phenotypic plasticity,via selection for norms of reaction, provides one means bywhich genetically based life history responses to environ-mental change can be effected (Bradshaw 1965; Via andLande 1985; Stearns and Koella 1986; Hutchings 1996; Roff1998). Herein lies one of the gaps in Atlantic salmon re-search. There is a need for studies that focus on the underly-ing basis for life history change in Atlantic salmon. Arepopulation changes in life history, e.g., sea age at maturity,or incidence of male parr maturity, generally effected bychanges in gene frequencies, a comparatively slow processoccurring across generations, or by phenotypic alterationalong norms of reaction, a comparatively rapid response oc-curring within a single generation? Questions that future re-search might address include: Do reaction norms, such asthe predicted growth rate thresholds for male parr maturityand female sea age at maturity, exist in Atlantic salmon? Ifso, how do the shapes of the reaction norms differ amongpopulations and at different spatial scales? How much addi-tive genetic variance, and thus potential for selection, existsfor the shapes of such norms of reaction? Answers to thesequestions would provide guidance in predicting the rate anddirection of life history responses to environmental influ-ences on growth rate and survival.
A second deficiency in our knowledge of Atlantic salmonlife history concerns male age at maturity, specifically thedemographic and genetic consequences of male parr repro-duction. Despite the considerable laboratory (see Metcalfe1998) and theoretical (Leonardsson and Lundberg 1986;Myers 1986; Hutchings and Myers 1994) interest in proxi-mate and evolutionary mechanisms of male parr maturity,the demographic consequences of early male reproductionhas received remarkably little attention, being limited toMyers’ (1994) estimate that the increased mortality and de-layed age at smoltification experienced by post-reproductivemale parr may be responsible for the loss of 60% of the ana-dromous male salmon production in some populations. Howdo changes in survival and growth rate at sea influence theincidence of male parr maturity (see also Marschall et al.
1998)? What are the consequences of male parr maturity toestimates of spawning requirements in Atlantic salmon pop-ulations? And, to address an issue that has received no atten-tion in the literature, what are the genetic and ecologicalconsequences of male parr maturity to estimates of effectiveand minimum viable population sizes?
A third area of life history research that merits study con-cerns the ecological and evolutionary mechanisms permit-ting the maintenance of anadromous and nonanadromouspopulations of Atlantic salmon in systems in which physicalbarriers to seaward migration are absent. Although it has re-ceived comparatively little attention (e.g., Hutchings 1986),the study of coexisting life history polymorphisms in Atlan-tic salmon seems likely to bear the informative fruits borneby research on resource-based polymorphisms in threespinesticklebacks,Gasterosteus aculeatus, (Schluter 1996) andArctic char (Skúlason et al. 1998).
Thus, be it from an ecological, evolutionary, conservation,or harvesting perspective, we anticipate significant contribu-tions to science from Atlantic salmon life history researchthat focuses upon reaction norms for age at maturity, demo-graphic and genetic consequences of male parr maturation,and the evolutionary and ecological mechanisms that permitcoexistence of anadromous and nonanadromous life historypolymorphisms.
We are extremely grateful to all the individuals who gavegenerously of their time to direct us to unpublished and pub-lished life history data on Atlantic salmon populations.These include Peter Amiro, Mike Chadwick, Gérald Chaput,Rick Cunjak, Kevin Davidson, Brian Dempson, Gil Farmer,Leonard Forsyth, John Gibson, and Mike O’Connell forinformation on Canadian populations, Ian Fleming for Nor-wegian populations, and Neil Metcalfe for information onScottish salmon. We also thank Derek Roff, Neil Metcalfe,Tom Quinn, Dick Saunders, and Kevin Friedland for discus-sion of the ideas presented herein. Financial support fortravel to the workshop in Braemar, Scotland, that stimulatedthis research was facilitated by Richard Degraaf, RobertLewis, and Keith Jensen, Northeastern Forest ExperimentalStation, USDA Forest Service. Financial support was alsoprovided by a NSERC Research Grant (Canada) to JAH.
Amiro, P.G., Jefferson, E.M., and Harvie, C.J. 1996. Status of At-lantic salmon in Salmon Fishing Area 21, in 1995, with empha-sis on the upper LaHave River, Lunenburg Co., Nova Scotia.DFO Atl. Fish. Res. Doc. 96/126.
Amiro, P.G., Harvie, C.J., O’Neil, S.F., and Marshall, L. 1998.Analyses of trends in returns of Atlantic salmon (Salmo salar)to rivers in Nova Scotia and Bay of Fundy, New Brunswick, andstatus of 1997 returns relative to forecasts. Can. Stock Assess.Sec. Res Doc. 98/46.
Atkins, C.G. 1884. Notes on landlocked salmon. Trans. Am. Fish.Soc. for 1884: 40–56.
Atkinson, G., and Hooper, W. 1995. Status of Atlantic salmon inthe Tabusintac River in 1994. DFO Atl. Fish. Res. Doc. 95/12.
© 1998 NRC Canada
Hutchings and Jones 33
I:\Salmon Sup\D98-004.vpWednesday, February 10, 1999 9:37:07 AM
Color profile: DisabledComposite Default screen

Atkinson, G., Hooper, W., LeBlance, J., and Cormier, G. 1995. Sta-tus of Atlantic salmon in the Richibucto River in 1994. DFOAtl. Fish. Res. Doc. 95/13.
Atkinson, G., and Chaput, G. 1996. Status of Atlantic salmon inthe Bouctouche River in 1995. DFO Atl. Fish. Res. Doc. 96/43.
Baglinière, J.L., and Maisse, G. 1985. Precocious maturation andsmoltification in wild Atlantic salmon in the Armorican Massif,France. Aquaculture,45: 249–263.
Baglinière, J.-L., and Champigneulle, A. 1986. Population esti-mates of juvenile Atlantic salmon,Salmo salar, as indices ofsmolt production in the R. Scorff, Brittany. J. Fish Biol.29:467–482.
Baglinière, J.-L., Prouzet, P., Porcher, J.-P., Nihouarn, A., andMaisse, G. 1987. Caractéristiques générales des populations desaumon atlantique (Salmo salarL.) des rivières du Massif armo-ricain. In La restauration des rivières à saumon.Edited byM.Thibault and R. Billard. Hydrobiologie et aquaculture, INRA,Paris. pp. 23–37.
Baglinière, J.-L., Maisse, G., and Nihouarn, A. 1993. Comparisonof two methods of estimating Atlantic salmon (Salmo salar)wild smolt production. In Production of juvenile Atlanticsalmon,Salmo salar, in natural waters.Edited byR.J. Gibsonand R.E. Cutting. Can. Spec. Publ. Fish. Aquat. Sci. 118.pp. 189–201.
Baglinière, J.-L., Prévost, E., and Maisse, G. 1994. Comparison ofpopulation dynamics of Atlantic salmon (Salmo salar) andbrown trout (Salmo trutta) in a small tributary of the RiverScorff (Brittany, France). Ecol. Freshwater Fish,3: 25–34.
Baum, E. 1997. Maine Atlantic salmon: a national treasure. Atlan-tic Salmon Unlimited, Hermon, Maine, U.S.A.
Berg, L.S. 1948. Freshwater fishes of the U.S.S.R., and adjacentcountries. Akad. Nauk SSSR Zool. Inst., vol. 1, 4th ed. (Transl.by Israel Program for Scientific Translations, 1962.)
Beverton, R.J.H., and Holt, S.J. 1959. A review of the lifespansand mortality rates of fish in nature, and their relation to growthand other physiological characteristics.In CIBA FoundationColoquia on Ageing 5.Edited byG.E.W. Wolstenholme and M.O’Connor. Little and Brown, Boston, Mass. pp. 142–174.
Bielak, A.T., and Power, G. 1986. Independence of sea age andriver age in Atlantic salmon (Salmo salar) from Quebec northshore rivers. In Salmonid age at maturity.Edited byD. Meerburg. Can. Spec. Publ. Fish. Aquat. Sci. 89. pp. 70–78.
Bley, P.W., and Moring, J.R. 1988. Freshwater and ocean survivalof Atlantic salmon and steelhead: a synopsis. U.S. Fish Wildl.Serv. Biol. Rep.91: 88–109.
Bourgeois, C.E., Murray, J., and Mercer, V. 1996. Status of the Ex-ploits River stock of Atlantic salmon (Salmo salarL.) in 1995.DFO Atl. Fish. Res. Doc. 96/89.
Bousquet, B., and Marty. 1987. Le point sur les connaissances despopulations naturelles de saumons dans le bassin de l’Adour.InLa restauration des rivières à saumon.Edited byM. Thibaultand R. Billard. Hydrobiologie et aquaculture, INRA, Paris.pp. 65–76.
Bradshaw, A.D. 1965. Evolutionary significance of phenotypicplasticity in plants. Adv. Genet.13: 115–155.
Brown, J. 1988. The use of Leslie matrices to assess the salmonpopulation of the River Corrib.In Atlantic salmon: planning forthe future.Edited by D. Mills and D. Piggins. Croom Helm,London. pp. 275–300.
Brown, W. 1862. The natural history of the salmon. ThomasMurray, Glasgow.
Buck, R.J.G., and Hay, D.W. 1984. The relation between stock sizeand progeny of Atlantic salmon (Salmo salarL.) in a Scottishstream. J. Fish Biol.24: 1–11.
Calderwood, W.L. 1906. Autumn migration of salmon smolts inScotland. Rep. Fish. Board Scot. 1905(11): 70–74.
Caron, F. 1992. Relation entre le nombre d’oeufs déposés et la pro-duction de saumonneaux dans les revières de la Trinité et Bec-Scie. CAFSAC Res. Doc. 92/125.
Caron, F. 1996. Sea survival trends in three natural salmon popula-tions. DFO Atl. Fish. Res. Doc. Working Paper.
Caron, F., et Bolduc, F. 1991. Caractéristiques de trois populationsde saumon atlantique (Salmo salar) du golfe du Saint-Laurent etleurs impacts sur la gestion des stocks.In Le Golfe du Saint-Laurent: petit océan ou grand estuaire?Editerd by J.C. Ther-riault. Publ. spéc. can. sci. halieut. aquat. 113. pp. 303–311.
Caron, F., and Fontaine, P.-M. 1998. Smolt survival and stockcharacteristics of the Trinité and Saint-Jean River, Québec.CSAS Working Paper.
Chadwick, E.M.P. 1988. Relationship between Atlantic salmonsmolts and adults in Canadian rivers.In Atlantic salmon: plan-ning for the future.Edited byD. Mills and D. Piggins, CroomHelm, London. pp. 301–324.
Chadwick, E.M.P., Randall, R.G., and Léger, C. 1986. Ovarian de-velopment of Atlantic salmon (Salmo salar) smolts and age atfirst maturity. In Salmonid age at maturity.Edited byD. Meerburg. Can. Spec. Publ. Fish. Aquat. Sci. 89. pp. 15–23.
Chambers, E.T.D. 1896. The ouananiche and its Canadian environ-ment. Harper and Bros., New York.
Chaput, G., Biron, M., Moore, D., Dube, B., Ginnish, C.,Hambrook, M., Paul, T., and Scott, B. 1996. Stock status of At-lantic salmon (Salmo salar) in the Miramichi River, 1995. DFOAtl. Fish. Res. Doc. 96/124.
Chaput, G., Moore, D., Hayward, J., Ginnish, C., and Dube, B.1998. Stock status of Atlantic salmon (Salmo salar) in the Mira-michi River. Can. Stock Assess. Secr. Res. Doc. 98/34.
Charlesworth, B. 1990. Optimization models, quantitative genetics,and mutation. Evolution44: 520–538.
Charlesworth, B. 1994. Evolution in age-structured populations.Cambridge Univ. Press. Cambridge, U.K.
Claytor, R.R., Jones, R., LeBlanc, P., and Chaput, G. 1995a. Main-land Gulf Nova Scotia Atlantic salmon (Salmo salar) stock sta-tus, 1994. DFO Atl. Fish. Res. Doc. 95/15.
Claytor, R.R., Jones, R., LeBlanc, P., Forsyth, L., and Chaput, G.1995b. Assessment of the Atlantic salmon (Salmo salar) stockof the Margaree River, Nova Scotia, 1994. DFO Atl. Fish. Res.Doc. 95/63.
Côté, Y., and Beaulieu, N. 1987. Restauration et mise en valeur dupotentiel salmonique de la rivière Mitis.In La restauration desrivières à saumon.Edited byM. Thibault and R. Billard. Hydro-biologie et aquaculture, INRA, Paris. pp. 167–174.
Cunjak, R., and Therrien, J. 1998. Inter-stage survival of wild ju-venile Atlantic salmon,Salmo salarL. Fish. Mgmt. Ecol.5:209–223.
Cutting, R.E., and Jefferson, E.M. 1986. Status of the Atlanticsalmon of the LaHave River, Nova Scotia, in 1985 and forecastof returns in 1986. CAFSAC Res Doc. 86/17.
Dahl, K. 1910. The age and growth of salmon and trout in Norwayas shown by their scales. Salmon and Trout Assoc. Fish-monger’s Hall.
Dahl, K. 1937. Parr life of salmon. Salmon Trout Mag.86: 10–13.Dempson, J.B., and Furey, G. 1996. Stock status of Atlantic
salmon from Conne River, SFA 11, Newfoundland, 1995. DFOAtl. Fish. Res. Doc. 96/48.
Dempson, J.B., Reddin, D.G., O’Connell, M.F., Helbig, J., Bour-geois, C.E., Mullins, C., Porter, T.R., Lilly, G., Carscadden, J.,Stenson, G.B., Kulka, D., and Knoechel, R. 1998a. Spatial andtemporal variation in Atlantic salmon abundance in the
© 1998 NRC Canada
34 Can. J. Fish. Aquat. Sci. Vol. 55(Suppl. 1), 1998
I:\Salmon Sup\D98-004.vpWednesday, February 10, 1999 9:37:11 AM
Color profile: DisabledComposite Default screen

Newfoundland-Labrador region with emphasis on factors thatmay have contributed to low returns in 1997. CSAS Res.Doc. 98/114.
Dempson, J.B., Furey, G., and Bloom, M. 1998b. Status of Atlanticsalmon in Conne River, SFA 11, Newfoundland, 1997. CSASRes. Doc. 98/28.
Dumas, J. 1979. Les saumons (Salmo salarL.) adultes de la Ni-velle (Pyrénées-Atlantiques) en 1977. Début de restaurationavec des smolts d’élevage d’origine écossaise. Ann. Limnol.15:233–238.
Egglishaw, H.J., and P.E. Shackley. 1977. Growth, survival andproduction of juvenile salmon and trout in a Scottish stream,1966–75. J. Fish Biol.11: 647–672.
Elson, P.F. 1975. Atlantic salmon rivers, smolt production and opti-mal spawning: an overview of natural production. World Wild-life Fund Spec. Publ. Ser. No. 6, pp. 96–119.
Fleming, I.A. 1996. Reproductive strategies of Atlantic salmon:ecology and evolution. Rev. Fish Biol. Fish.6: 379–416.
Fleming, I.A. 1998. Pattern and variability in the breeding systemof Atlantic salmon (Salmo salar), with comparisons to othersalmonids . Can. J. Fish. Aquat. Sci.55(Suppl. 1): 59–76.
Fleming, I.A., and Gross, M.R. 1993. Breeding success of hatcheryand wild coho salmon (Oncorhynchus kisutch) in competition.Ecol. Appl. 3: 230–245.
Fournel, F., Euzenat, G., and Fagard, J.-L. 1987. Rivières à truitesde mer et à saumons de Haute-Normandie. Réalités et perspec-tives. Le cas de la Bresle.In La restauration des rivières àsaumon.Edited byM. Thibault and R. Billard. Hydrobiologie etaquaculture, INRA, Paris. pp. 315–325.
Fox, M.G. 1994. Growth, density, and interspecific influences onpumpkinseed sunfish life histories. Ecology,75: 1157–1171.
Friedland, K.D., and Haas, R.E. 1996. Marine post-smolt growthand age at maturity of Atlantic salmon. J. Fish Biol.48: 1–15.
Friedland, K.D., Haas, R.E., and Sheehan, T.F. 1996. Post-smoltgrowth, maturation, and survival of two stocks of Atlanticsalmon. Fish. Bull.94: 654–663.
Gardner, M.J.G. 1976. A review of factors which may influencethe sea-age and maturation of Atlantic salmon,Salmo salarL. J.Fish Biol. 9: 289–327.
Gibson, R.J. 1978. Recent changes in the population of juvenileAtlantic salmon in the Matamek River, Québec, Canada. J.Cons. Int. Explor. Mer.38: 201–207.
Gibson, R.J., Williams, D.D., McGowan, C., and Davidson, W.S.1996. The ecology of dwarf fluvial Atlantic salmon,Salmosalar L., cohabiting with brook trout,Salvelinus fontinalis(Mit-chill), in southeastern Newfoundland, Canada. Pol. Arch. Hy-drobiol. 43: 145–166.
Gudjónsson, T. 1978. The Atlantic salmon in Iceland. J. Agric.Res. Icel.10: 11–39.
Harris, G.S. 1973. Rearing smolts in mountain lakes to supplementsalmon stocks. Int. Atl. Salmon Found.4: 237–252.
Huitfeldt-Kaas, H. 1946. Tribes of salmon in Norway. Nytt Mag.Naturvidensk.B85: 115–159.
Huntsman, A.G. 1931. The maritime salmon of Canada. Biol.Board Can. Bull.21: 1–99.
Hutchings, J.A. 1985. Lakeward migrations by juvenile Atlanticsalmon,Salmo salarL. M.Sc. Thesis, Memorial University ofNewfoundland, St. John’s, Nfld.
Hutchings, J.A. 1986. Lakeward migrations by juvenile Atlanticsalmon,Salmo salar. Can. J. Fish. Aquat. Sci.43: 732–741.
Hutchings, J.A. 1991. Fitness consequences of variation in egg sizeand food abundance in brook trout,Salvelinus fontinalis. Evolu-tion, 45: 1162–1168.
Hutchings, J.A. 1993. Adaptive life histories effected by age-specific survival and growth rate. Ecology,74: 673–684.
Hutchings, J.A. 1996. Adaptive phenotypic plasticity in brooktrout, Salvelinus fontinalis,life histories. Ecoscience,3: 25–32.
Hutchings, J.A. 1997. Life history responses to environmental vari-ability in early life. In Early life history and recruitment in fishpopulations.Edited byR.C. Chambers and E.A. Trippel. Chap-man and Hall, London, pp. 179–226.
Hutchings, J.A., and Morris, D.W. 1985. The influence of phylog-eny, size and behaviour on patterns of covariation in salmonidlife histories. Oikos,45: 118–124.
Hutchings, J.A., and Myers, R.A. 1988. Mating success of alterna-tive maturation phenotypes in male Atlantic salmon,Salmosalar. Oecologia,75: 169–174.
Hutchings, J.A., and Myers, R.A. 1994. The evolution of alterna-tive mating strategies in variable environments. Evol. Ecol.8:256–268.
ICES. 1994a. Report of the North Atlantic salmon working group.ICES CM 1994/Assess:16 Ref.:M.
ICES. 1994b. Report on the workshop on salmon spawning targetstock targets in the North-East Atlantic. ICES CM 1994/M:6.
Jensen, A.J., and Johnsen, B.O. 1985. Growth and smolt age of At-lantic salmon (Salmo salarL.) in the glacier River Beiarelva,northern Norway. Rep. Inst. Freshwater Res. Drottningholm,62:86–90.
Jensen, A.J. 1995. Overvåking av anadrome laksefisk i utvalgtereferansevassdrag Årsrapport 1994. NONA Oppdragsmelding,362: 1–54.
Jessop, B.M. 1986. Atlantic salmon (Salmo salar) of the BigSalmon River, New Brunswick. Can. Tech. Rep. Fish. Aquat.Sci. No. 1415.
Jones, J.W. 1959. The salmon. Collins, London.Jonsson, N., Hansen, L.P., and Jonsson, B. 1991. Variation in age,
size and repeat spawning of adult Atlantic salmon in relation toriver dishcarge. J. Anim. Ecol.60: 937–947.
Jonsson, N., Jonsson, B., and Hansen, L.P. 1998. Long-term studyof the ecology of wild Atlantic salmon smolts in a small Norwe-gian river. J. Fish Biol.52: 638–650.
Karlström, O. 1977. Habitat selection and population densities ofsalmon (Salmo salarL.) and trout (Salmo trutta L.) parr inSwedish rivers with some reference to human activities. ActaUniv. Ups. 404: 1–12.
Kennedy, G.J.A., and Crozier, W.W. 1993. Juvenile Atlanticsalmon — production and prediction.In Production of juvenileAtlantic salmon,Salmo salar, in natural waters.Edited byR.J.Gibson and R.E. Cutting. Can. Spec. Publ. Fish. Aquat. Sci.118. pp. 179–187.
Kristoffersen, K., and Staldvik, F. 1996. Fiskeribiologiske under-søkelser i Målselvvassdraget med hovedvekt på oppvandring ifisketrappa. Fylkesmannen i Troms Rapport nr. 67.
Lee, R.L.G., and Power, G. 1976. Atlantic salmon (Salmo salar) ofthe Leaf River, Ungava Bay. J. Fish. Res. Board Can.33: 2616–2621.
Leggett, W.C., and Carscadden, J.E. 1978. Latitudinal variation inreproductive characteristics of American shad (Alosa sapidis-sima): evidence for population specific life history strategies infish. J. Fish. Res. Board Can.35: 1469–1478.
Leonardsson, K., and Lundberg, P. 1986. The choice of reproduc-tive tactics as a mixed evolutionarily stable strategy: the case ofmale Atlantic salmon (Salmo salarL.). Rep. Inst. FreshwaterRes. Drottningholm,63: 69–76.
Lindroth, A. 1977. The smolt migration in the river Mörrumsån(Sweden) 1963–1966. ICES CM 1977/M:8.
© 1998 NRC Canada
Hutchings and Jones 35
I:\Salmon Sup\D98-004.vpWednesday, February 10, 1999 9:37:14 AM
Color profile: DisabledComposite Default screen

Locke, A., and Mowbray, F. 1996. Status of Atlantic salmon in theNepisiguit River, New Brunswick, 1995. DFO Atl. Fish. Res.Doc. 96/129.
Locke, A., Pickard, R., Mowbray, F., Landry, G., Madden, A., andD’Amours, P. 1996. Status of Atlantic salmon in the Resti-gouche River in 1995. DFO Atl. Fish. Res. Doc. 96/122.
Lowe, S.L., and Mullins, C.C. 1996. Status of the Atlantic salmonstock of Forteau River, Labrador, 1995. DFO Atl. Fish. Res.Doc. 96/87.
Lund, R.A., Økland, F., and Heggberget, T.G. 1989. Utviklingen ilaksebestandene i Norge før og etter reguleringene av laksefisketi 1989. NINA Forskningsrapport 054, pp. 1–46.
Manly, B.F.J. 1991. Randomization and Monte Carlo methods inbiology. Chapman and Hall, New York.
Marschall, E.A., Quinn, T.P., Roff, D.A., Hutchings, J.A., Met-calfe, N.B., Bakke, T.A., Saunders, R.L., and Poff, N.L. 1998. Aframework for understanding Atlantic salmon (Salmo salar) lifehistory. Can. J. Fish. Aquat. Sci.55(Suppl. 1): 48–58.
Marshall, T.L., and Jones, R. 1996. Status of Atlantic salmonstocks of the Saint John River and southwest New Brunswick,1995. DFO Atl. Fish. Res. Doc. 96/40.
Martynov, V., Chaput, G., Whoriskey, F., and Anderson, J. 1994.Fishes of the shallow rapids and riffles of the Pizhma River,Pechora River Basin, Russia. Can. Tech. Rep. Fish. Aquat. Sci.No. 2000.
Meerburg, D. [ed.] 1986. Salmonid age at maturity. Can. Spec.Publ. Fish. Aquat. Sci. 89.
Menzies, W.J.M. 1927. Some aspects of the growth of salmon inriver and sea as observed from scale examination of Dee (Aber-deen) and Spey salmon, 1921 to 1923 inclusive. Fisheries Scot-land, Salmon Fish. 1927, I.
Metcalfe, N.B. 1998. The interaction between behaviour and phys-iology in determining life history patterns in Atlantic salmon(Salmo salar). Can. J. Fish. Aquat. Sci.55(Suppl. 1): 93–103.
Metcalfe, N.B., Huntingford, F.A., Graham, W.D., and Thorpe, J.E.1989. Early social status and the development of life-historystrategies in Atlantic salmon. Proc. R. Soc. Lond. B,236: 7–19.
Metcalfe, N.B., and Thorpe, J.E. 1990. Determinants of geograph-ical variation in the age of seaward-migrating salmon,Salmosalar. J. Anim. Ecol.59: 135–145.
Miescher-Rusch, F. 1883. Contributions to the biology of theRhine salmon. Rept. U.S. Fish. Comm.8: 427–474.
Mills, D.H. 1989. Ecology and management of Atlantic salmon.Chapman and Hall, London.
Moore, D.S., Chaput, G.J., and Pickard, P.R. 1995. The effect offisheries on the biological characteristics and survival of matureAtlantic salmon (Salmo salar) from the Miramichi River.In Wa-ter, science, and the public: the Miramichi ecosystem.Edited byE.M.P. Chadwick. Can. Spec. Publ. Fish. Aquat. Sci. 123.pp. 229–247.
Mullins, C.C,, and Reddin, D.G. 1996. The status of the Atlanticsalmon stock of the Humber River, Newfoundland, 1995. DFOAtl. Fish. Res. Doc. 96/139.
Mullins, C.C., Caines, D., Downer, D.F., and Lowe, S.L. 1996. Thestatus of the Atlantic salmon stock on Harry’s River/PinchgutBrook, Newfoundland, 1995. DFO Atl. Fish. Res. Doc. 96/68.
Murray, A.R. 1968. Smolt survival and adult utilization of LittleCodroy River, Newfoundland, Atlantic salmon. J. Fish. Res.Board Can.25: 2165–2218.
Myers, R.A. 1984. Demographic consequences of precocious mat-uration of Atlantic salmon (Salmo salar). Can. J. Fish. Aquat.Sci. 41: 1349–1353.
Myers, R.A. 1986. Game theory and the evolution of Atlanticsalmon (Salmo salar) age at maturation.In Salmonid age at ma-turity. Edited by D. Meerburg. Can. Spec. Publ. Fish. Aquat.Sci. 89. pp. 53–61.
Myers, R.A., and Hutchings, J.A. 1986. Selection against parr mat-uration in Atlantic salmon. Aquaculture,53: 313–320.
Myers, R.A., Hutchings, J.A., and R.J. Gibson. 1986. Variation inmale parr maturation within and among populations of Atlanticsalmon,Salmo salar. Can. J. Fish. Aquat. Sci.43: 1242–1248.
Myers, R.A., and Hutchings, J.A. 1987. A spurious correlation inan interpopulation comparison of Atlantic salmon life histories.Ecology,68: 1839–1843.
Nicieza, A.G., Braña, F., and Toledo, M.M. 1991. Development oflength-bimodality and smolting in wild stocks of Atlantic slmon,Salmo salarL., under different growth conditions. J. Fish Biol.38: 509–523.
Nicieza, A.G., and Braña, F. 1993a. Relationships among smoltsize, marine growth, and sea age at maturity of Atlantic salmon(Salmo salar) in northern Spain. Can. J. Fish. Aquat. Sci.50:1632–1640.
Nicieza, A.G., and Braña, F. 1993bc. Compensatory growth andoptimum size in one-year-old smolts of Atlantic salmon (Salmosalar). In Production of juvenile Atlantic salmon,Salmo salar,in natural waters.Edited byR.J. Gibson and R.E. Cutting. Can.Spec. Publ. Fish. Aquat. Sci. 118. pp. 225–237.
Nielson, J. 1961. Contributions to the biology of the salmonidae inGreenland. I–IV. Medd. Gronl.159: 1–76.
Nott, F.J. 1973. Production of salmon smolts under natural condi-tions in Devon rivers. Int. Atl. Salmon Found.4: 157–168.
O’Connell, M.F., and Ash, E.G.M. 1993. Smolt size in relation toage at first maturity of Atlantic salmon (Salmo salar): the roleof lacustrine habitat. J. Fish Biol.42: 551–569.
O’Connell, M.F., Reddin, D.G., and Mullins, C.C. 1996a. Status ofAtlantic salmon (Salmo salarL.) in eight rivers in the New-foundland Region, 1995. DFO Atl. Fish. Res. Doc. 96/106.
O’Connell, M.F., Reddin, D.G., and Ash, E.G.M. 1996b. Status ofAtlantic salmon (Salmo salarL.) in Gander River, Notre DameBay (SFA 4), Newfoundland, 1995. DFO. Atl. Fish. Res. Doc.96/107.
Økland, F., Jonsson, B., Jensen, A.J., and Hansen, L.P. 1993. Isthere a threshold size regulating seaward migration of browntrout and Atlantic salmon? J. Fish Biol.42: 541–550.
Orciari, R.D., Leonard, G.H., Mysling, D.J., and Schluntz, E.C.1994. Survival, growth, and smolt production of Atlantic salmonstocked as fry in a southern New England stream. N. Am. J.Fish. Manage.14: 588–606.
Osterdahl, L. 1964. Smolt investigations in the river Ricklean.Swed. Salmon Res. Inst. Rep. LFI/Medd 8/1964.
Power, G. 1969. The salmon of Ungava Bay. Arctic Inst. N. Am.Tech. Pap. 22: 72 p.
Power, G. 1981. Stock characteristics and catches of Atlanticsalmon (Salmo salar) in Quebec, and Newfoundland and Labra-dor in relation to environmental variables. Can. J. Fish. Aquat.Sci. 38: 1601–1611.
Prévost, E., and Porcher, J.-P. 1996. Méthodologie d’élaboration detotaux autorisés de captures (TAC) pour le saumon atlantique(Salmo salar L.) dans le Massif Armoricain. Groupementd’interet scientifique “amphihalins” (GRISAM), Doc. scient.technique no. 1 (Janvier 1996).
Prouzet, P., and Gaignon, J.-L. 1982. Fécondité des Saumons atlan-tique adultes capturés sur le bassin versant de l’Elorn (Rivièrede Bretagne Nord) et caractéristiques de leurs pontes. Bull. Fr.Piscic.285: 233–243.
© 1998 NRC Canada
36 Can. J. Fish. Aquat. Sci. Vol. 55(Suppl. 1), 1998
I:\Salmon Sup\D98-004.vpWednesday, February 10, 1999 9:37:18 AM
Color profile: DisabledComposite Default screen

© 1998 NRC Canada
Hutchings and Jones 37
Prouzet, P., and Gaignon, J.-L. 1985. Caractéristiques du stock desaumon atlantique d’un hiver de mer (Salmo salarL.) capturésur l’Elorn de 1974 à 1984. Rev. Trav. Inst. Pêches Marit.47:167–178.
Randall, R.G., and Power, G. 1979. Atlantic salmon (Salmo salar)of the Pigou and Bouleau Rivers, Quebec. Environ. Biol. Fish.4: 179–184.
Reddin, D.G., Short, P.B., O’Connell, M.F., and Walsh, A.D. 1996.Atlantic salmon stock status for Sandhill River, Labrador, 1995.DFO Atl. Fish. Res. Doc. 96/82.
Reznick, D.N., Bryga, H., and Endler, J.A. 1990. Experimentally-induced life history evolution in a natural population. Nature,346: 357–359.
Riddell, B.E., and Leggett, W.C. 1981. Evidence of an adaptive ba-sis for geographic variation in body morphology and time ofdownstream migration of juvenile Atlantic salmon (Salmosalar). Can. J. Fish. Aquat. Sci.38: 308–320.
Riley, S.C., Bielak, A.T., and Power, G. 1984. The Atlantic salmonstock of the Grand Watshishou River (Québec) — a historicalperspective. Nat. Can.111: 219–228.
Ritter, J.A. 1974. Relationships of smolt size and age with age atfirst maturity in Atlantic salmon. ICES CM 1974/M:25.
Robitaille, J.A., Côté, Y., Hayeur, G., and Shooner, G. 1984. Parti-cularités de la reproduction du saumon atlantique (Salmo salar)dans une partie du réseau Koksoak, en Ungava. Rapp. tech. can.sci. halieut. aquat. 1313.
Robitaille, J.A., Côté, Y., Shooner, G., and Hayeur, G. 1986.Growth and maturation patterns of Atlantic salmon,Salmo salar,in the Koksoak River, Ungava, Quebec.In Salmonid age at ma-turity. Edited by D. Meerburg. Can. Spec. Publ. Fish. Aquat.Sci. 89. pp. 62–69.
Roff, D.A. 1984. The evolution of life-history parameters in tele-osts. Can. J. Fish. Aquat. Sci.41: 989–1000.
Roff, D.A. 1992. The evolution of life histories. Chapman andHall, New York.
Roff, D.A. 1997. Quantitative evolutionary genetics. Chapman andHall, New York.
Roff, D.A. 1998. The maintenance of phenotypic and genetic vari-ation in threshold traits by frequency-dependent selection. J.Evol. Biol. 11: 513–529.
Saksgård, L.M., Heggberget, T.G., Jensen, A.J., and Hvidsten,N.A. 1992. Utbygging av Altaelva — virkninger på laksebestan-den. NINA Forskningsrapport,34: 1–98.
Sandlund, O.T., Gunnarsson, K.G., Jonasson, P.M., Jonsson, B.,Lindem, T., Magnússon, K.P., Malmquist, H.J., Sigurjónsdóttir,H., Skúlason, S., and Snorrason, S.S. 1992. The arctic charrSalvelinus alpinusin Thingvallavatn. Oikos,64: 305–351.
Saunders, R.L. 1986. The scientific and management implicationsof age and size at sexual maturity in Atlantic salmon (Salmosalar). In Salmonid age at maturity.Edited by D. Meerburg.Can. Spec. Publ. Fish. Aquat. Sci. 89. pp. 3–6.
Saunders, R.L., Henderson, E.B., and Glebe, B.D. 1982. Preco-cious sexual maturation and smoltification in male Atlanticsalmon (Salmo salar). Aquaculture,28: 211–229.
Scarnecchia, D.L. 1983. Age at sexual maturity in Icelandic stocksof Atlantic salmon (Salmo salar). Can. J. Fish. Aquat. Sci.40:1456–1468.
Schaffer, W.M., and Elson, P.F. 1975. The adaptive significance ofvariations in life history among local populations of Atlanticsalmon in North America. Ecology,56: 577–590.
Schluter, D. 1996. Ecological speciation in postglacial fishes. Phil.Trans. R. Soc. Lond.351: 807–814.
Scott, W.B., and Crossman, E.J. 1973. Freshwater fishes of Can-ada. Fish. Res. Board Can. Bull. 184.
Sharov, A.F., Zubchenko, A.V., and Kuzmin, O.G. 1990. Atlanticsalmon of the River Tuloma as the index salmon stock of BarentSea Basin. ICES CM 1990/M:8.
Shaw, J. 1836. An account of some experiments and observationson the parr, and on the ova of the salmon, proving the parr to bethe young of salmon. Edinburgh New Philos. J.21: 99–110.
Shearer, W.M. 1972. A study of the Atlantic salmon populations ofthe North Esk, 1961–1970. M.Sc. Thesis, University of Edin-burgh.
Shearer, W.M. 1992. The Atlantic salmon: natural history, exploita-tion and future management. Fishing News Books, London.
Skúlason, S., Snorrason, S.S., and Jónsson, B. 1998. Sympatricmorphs, populations and speciation in freshwater fish with em-phasis on Arctic charr.In Evolution of biological diversity.Edited byA.E. Magurran and R. May. Oxford Univ. Press.
Sokal, R.R., and Rohlf, F.J. 1981. Biometry. Freeman, San Fran-cisco, Calif.
Stearns, S.C. 1992. The evolution of life histories. Oxford Univ.Press, Oxford.
Stearns, S.C., and Koella, J.C. 1986. The evolution of phenotypicplasticity in life-history traits: predictions of reaction norms forage and size at maturity. Evolution,40: 893–913.
Thorpe, J.E. 1975. Early maturity in male Atlantic salmon. Scot.Fish Bull. 42: 15–17.
Thorpe, J.E. 1977. Bimodal distribution of length of juvenile At-lantic salmon (Salmo salarL.) under artificial rearing condi-tions. J. Fish Biol.11: 175–184.
Thorpe, J.E. 1986. Age at first maturity in Atlantic salmon,Salmosalar: freshwater period influences and conflicts with smolting.In Salmonid age at maturity.Edited byD. Meerburg. Can. Spec.Publ. Fish. Aquat. Sci. 89. pp. 7–14.
Thorpe, J.E., and R.I.G. Morgan. 1980. Growth-rate and smolting-rate of progeny of male Atlantic salmon parr,Salmo salarL. J.Fish Biol. 17: 451–459.
Thorpe, J.E., Morgan, R.I.G., Talbot, C., and Miles, M.S. 1983. In-heritance of developmental rates in Atlantic salmon,Salmosalar L. Aquaculture,33: 119–128.
Thorpe, J.E., Miles, M.S., and Keay, D.S. 1984. Developmentalrate, fecundity and egg size in Atlantic salmon,Salmo salarL.Aquaculture,43: 289–305.
Thorpe, J.E., Mangel, M., Metcalfe, N.B., and Huntingford, F.A.1998. Modeling the proximate basis of salmonid life historyvariation, with application to Atlantic salmon,Salmo salarL.Evol. Ecol. 12: 581–599.
Toivonen, J., and Jutila, E. 1982. Report on parr population densi-ties, tagging experiments and river catches of the salmon stockof the river Simojoki in 1972–1980. ICES C.M.1982/M:40.
Ventura, J.A.M. 1987. Le saumon atlantique dans les rivières de laprovince des Asturies (Espagne).In La restauration des rivièresà saumon.Edited byM. Thibault and R. Billard. Hydrobiologieet aquaculture, INRA, Paris. pp. 139–144.
Via, S., and Lande, R. 1985. Genotype-environment interactionand the evolution of phenotypic plasticity. Evolution,39: 505–522.
Went, A.E.J., and Twomey, E. 1971. Fluctuations in the character-istics in Irish salmon. Irish Fish. Invest., Ser. A, No. 7.
I:\Salmon Sup\D98-004.vpWednesday, February 10, 1999 9:37:21 AM
Color profile: DisabledComposite Default screen

©1
99
8N
RC
Ca
na
da
38C
an.J.
Fish.A
quat.S
ci.Vol.
55(Suppl.
1),1998
Country/Region River
Smoltlength(cm)
Smoltage(yr)
Seaage(yr)
Grilselength(cm)
2SWlength(cm)
3SWlength(cm)
%Grilse
% femgrilse
Egg–smoltsurvival
Smolt–grilsesurvival
% 1+Male parrmaturity
1+Parrlength(mm) References
England Avon 11.8 1.11 Harris (1973)England Dart 2.04 Nott (1973)England Tees 14.6 2.07 Harris (1973)England Wye 2.01 Harris (1973)Finland Simojoki 2.7 Toivonen and Jutila (1982)France Adour 19.3 1.42 1.51 65.6 79.9 94.2 0.063 193 Bousquet and Marty (1987)France Aulne 1.45 57 77 0.015 Baglinière et al. (1987)France Blavet 63 75 0.174 0.42 Baglinière et al. (1987); Prévost and Porcher
(1996)France Bresle 16.2 1.23 1.21 0.8 0.1287 162 Fournel et al. (1987); ICES (1994b)
France Ellé 1.42 65 75.7 0.091 0.42 Prévost and Porcher (1996); Baglinière et al.(1987)
France Elorn 1.57 64 75 0.087 0.466 Prévost and Porcher (1996); Prouzet andGaignon (1982, 1985); Baglinière et al.(1987)
France Léguer 1.27 63.4 78.7 0.032 187 Baglinière et al. (1987)France Nivelle 18.7 1.04 1.17 67.7 0.84 0.54 0.0617 146.6 Bousquet and Marty (1987); Dumas (1979);
ICES (1994a)France Oir 0.32 0.00292 Baglinière et al. (1993); ICES (1994a,b);
Prévost and Porcher (1996)France Scorff 1.31 62.8 77.4 0.166 0.422 0.65 Baglinière and Champigneulle (1986);
Baglinière et al. (1987, 1994); Prévost andPorcher (1996)
France Selune 1.22 63 76.4 0.263 0.28 Baglinière et al. (1987, 1993)Iceland Álftá 0.74 Scarnecchia (1983)Iceland Andakílsá 0.84 Scarnecchia (1983)Iceland Austurá 0.39 Scarnecchia (1983)Iceland Bakkaá 0.465 Scarnecchia (1983)Iceland Blanda 0.255 Scarnecchia (1983)Iceland Breiddalsá 0.81 Scarnecchia (1983)Iceland Bruará 0.375 Scarnecchia (1983)Iceland Brynjudalsá 0.88 Scarnecchia (1983)Iceland Bugda 0.81 Scarnecchia (1983)Iceland Deildará 0.425 Scarnecchia (1983)Iceland Eldvatn 0.875 Scarnecchia (1983)Iceland Ellidaár 12.5 3.05 1.39 0.61 0.1754 Scarnecchia (1983); Gudjónsson (1978); ICES
(1994a)Iceland Fáskrúd 0.705 Scarnecchia (1983)Iceland Fljótaá 0.54 Scarnecchia (1983)Iceland Flekkudalsá 0.785 Scarnecchia (1983)Iceland Flókadalsá 0.895 Scarnecchia (1983)Iceland Fnjóská 0.35 Scarnecchia (1983)Iceland Fossá í Laxárdal 0.455 Scarnecchia (1983)
Table A1. Atlantic salmon life history data from unpublished and published sources used in the present study.
I:\Salmon Sup\D98-004.vp
Wednesday, February 10, 1999 9:37:27 AM
Color profile: Disabled
Composite Default screen

©1
99
8N
RC
Ca
na
da
Hutchings
andJones
39
Country/Region River
Smoltlength(cm)
Smoltage(yr)
Seaage(yr)
Grilselength(cm)
2SWlength(cm)
3SWlength(cm)
%Grilse
% femgrilse
Egg–smoltsurvival
Smolt–grilsesurvival
% 1+Male parrmaturity
1+Parrlength(mm) References
Iceland Fródá 0.72 Scarnecchia (1983)Iceland Geirlandsá 0.71 Scarnecchia (1983)Iceland Gljúfurá 0.945 Scarnecchia (1983)Iceland Grímsá 2.94 1.5 0.5 Scarnecchia (1983); Gudjónsson (1978)Iceland Hafralónsá 0.285 Scarnecchia (1983)Iceland Haffjardará 0.63 Scarnecchia (1983)Iceland Haukadalsá 0.645 Scarnecchia (1983)Iceland Hítará 0.67 Scarnecchia (1983)Iceland Hofsá í Vesturdal 0.43 Scarnecchia (1983)Iceland Hölkná 0.38 Scarnecchia (1983)Iceland Hördudalsá 0.745 Scarnecchia (1983)Iceland Hrófá 0.515 Scarnecchia (1983)Iceland Hrútafjardará/Siká 0.44 Scarnecchia (1983)Iceland Húseyjarkvísl 0.835 Scarnecchia (1983)Iceland Hvannadalsá 0.515 Scarnecchia (1983)Iceland Hvítá í Borgarf 3.03 1.62 0.41 Scarnecchia (1983); Gudjónsson (1978)Iceland Hvolsá/Stadarh 0.79 Scarnecchia (1983)Iceland Ísafjardadá 0.625 Scarnecchia (1983)Iceland Krossá á Skardsst 0.795 Scarnecchia (1983)Iceland Langá 0.84 Scarnecchia (1983)Iceland Langadalsá 0.415 Scarnecchia (1983)Iceland Laugardalsá 0.645 Scarnecchia (1983)Iceland Laxá á Ásum 0.705 Scarnecchia (1983)Iceland Laxá á Skögst 0.71 Scarnecchia (1983)Iceland Laxá á Hrútafirdi 0.51 Scarnecchia (1983)Iceland Laxá í Adaldal 0.29 Scarnecchia (1983)Iceland Laxá í Adaldalur 3.05 1.64 0.368 Gudjónsson (1978)Iceland Laxá í Kjós 2.99 1.68 0.319 Scarnecchia (1983); Gudjónsson (1978)Iceland Laxá í Lsveit 0.745 Scarnecchia (1983)Iceland Laxá-Ytri 0.58 Scarnecchia (1983)Iceland Leirá 0.93 Scarnecchia (1983)Iceland Leirvogsá 0.855 Scarnecchia (1983)Iceland Midá í Dölum 0.715 Scarnecchia (1983)Iceland Midfjardará 3.39 1.64 0.356 Scarnecchia (1983); Gudjónsson (1978)Iceland Midfjardará/Kverká 0.43 Scarnecchia (1983)Iceland Nordurá 3 1.41 0.594 Scarnecchia (1983); Gudjónsson (1978)Iceland Núpsá 0.48 Scarnecchia (1983)Iceland Olfusá 12.3 2.95 1.35 0.653 Gudjónsson (1978)Iceland Ormarsá 0.4 Scarnecchia (1983)Iceland Reykjadalsá 0.77 Scarnecchia (1983)Iceland Sæmundará 0.33 Scarnecchia (1983)Iceland Sandá 0.38 Scarnecchia (1983)Iceland Selá. Stfirdi 0.595 Scarnecchia (1983)Iceland Selá í Vopnafirdi 0.5 Scarnecchia (1983)Iceland Skjálfandafljót 0.44 Scarnecchia (1983)
Table A1. (Continued).
I:\Salmon Sup\D98-004.vp
Wednesday, February 10, 1999 9:37:34 AM
Color profile: Disabled
Composite Default screen

©1
99
8N
RC
Ca
na
da
40C
an.J.
Fish.A
quat.S
ci.Vol.
55(Suppl.
1),1998
Table A1. (Continued).
Country/Region River
Smoltlength(cm)
Smoltage(yr)
Seaage(yr)
Grilselength(cm)
2SWlength(cm)
3SWlength(cm)
%Grilse
% femgrilse
Egg–smoltsurvival
Smolt–grilsesurvival
% 1+Male parrmaturity
1+Parrlength(mm) References
Iceland Sog 2.86 1.44 0.591 Gudjónsson (1978)Iceland Sogid 0.66 Scarnecchia (1983)Iceland Stóra-Laxá 0.385 Scarnecchia (1983)Iceland Straumfjardará 0.585 Scarnecchia (1983)Iceland Svalbardsá 0.365 Scarnecchia (1983)Iceland Svartá 0.41 Scarnecchia (1983)Iceland Thjórsá 0.34 Scarnecchia (1983)Iceland Thverá 3.06 1.4 0.597 Scarnecchia (1983); Gudjónsson (1978)Iceland Úlfarsá 12.6 0.93 Scarnecchia (1983); Gudjónsson (1978)Iceland Vatnsdalsá 0.445 Scarnecchia (1983)Iceland Vesturá 0.49 Scarnecchia (1983)Iceland Vesturdalsá 0.555 0.0342 Scarnecchia (1983); ICES !994a)Iceland Vídidalsá 3.04 1.48 0.518 Scarnecchia (1983); Gudjónsson (1978)Iceland Vididalsá/Fitjaá 0.345 Scarnecchia (1983)Iceland Vikurá 0.375 Scarnecchia (1983)Ireland Burrishoole 12.1 2.24 0.0052 0.0724 ICES (1994a,b); Harris (1973); Kennedy and
Crozier (1993)Ireland Bush 15.2 1.15 0.88 0.0119 0.0932 ICES (1994a,b); Kennedy and Crozier (1993)Ireland Corrib 13.4 1.75 1.11 0.89 0.0266 Brown (1988)Ireland Foyle 63.7 Went and Twomey (1971)Ireland Moy 60 Went and Twomey (1971)Ireland Owenduff 2.06 Harris (1973)Labrador Forteau 4.09 1.03 54.2 72.9 0.97 0.645 Lowe and Mullins (1996); Myers and
Hutchings (1987)Labrador Pinware 4.2 1.16 53.2 74.3 0.84 0.372 Myers and Hutchings (1987)Labrador Eagle 1.03 54.4 74.7 0.97 Myers and Hutchings (1987)Labrador Sandhill 16 4.44 1.2 53.9 73.4 79.2 0.89 0.0815 Myers and Hutchings (1987); Power (1981);
Reddin et al. (1996); Chadwick (1988)Maritimes Big Salmon 13.9 2.6 1.1 53.2 70.8 0.445 0.654 0.0017 0.1461 Jessop (1986); Ritter (1989)Maritimes Bouctouche 2.69 0.12 Atkinson and Chaput (1996)Maritimes East (Pictou) 55.6 0.27 0.05 Claytor et al. (1995a)Maritimes LaHave 2.17 1.29 53.6 72.5 0.71 Amiro et al. (1996, 1998); Cutting and Jeffer-
son (1986); Myers and Hutchings (1987)Maritimes Liscomb 1.08 52.3 72.4 91.7 0.92 Myers and Hutchings (1987)Maritimes Margaree 2.42 1.36 53.5 71.1 81.7 0.59 0.11 0.75 85.8 Claytor et al. (1995b); Myers et al. (1986);
Myers and Hutchings (1987)Maritimes Medway 2.58 1.24 Ritter (1974)Maritimes Miramichi 12.8 2.8 1.29 55.3 73.4 86.9 0.75 0.24 0.0047 0.1410 0.605 93.9 Chaput et al. (1996, 1998); Cunjak and
Therrien (1998); Moore et al. (1995); Myerset al. (1986)
Maritimes Nepisiguit 2.15 0.178 Locke and Mowbray (1996)Maritimes North 3.28 1.95 54.6 72.3 0.05 Myers and Hutchings (1987); Ritter (1974)Maritimes Philip 2.05 56.6 74.4 86.7 0.39 Claytor et al. (1995a); Myers and Hutchings
(1987)
I:\Salmon Sup\D98-004.vp
Wednesday, February 10, 1999 9:37:41 AM
Color profile: Disabled
Composite Default screen

©1
99
8N
RC
Ca
na
da
Hutchings
andJones
41Table A1. (Continued).
Country/Region River
Smoltlength(cm)
Smoltage(yr)
Seaage(yr)
Grilselength(cm)
2SWlength(cm)
3SWlength(cm)
%Grilse
% femgrilse
Egg–smoltsurvival
Smolt–grilsesurvival
% 1+Male parrmaturity
1+Parrlength(mm) References
Maritimes Pollett 2.1 0.0198 Elson (1975)Maritimes Restigouche 2.82 1.67 52 76 92 0.39 0.02 0.22 82 Locke et al. (1996); Myers et al. (1986);
Myers and Hutchings (1987)Maritimes Richibucto 2.74 Atkinson et al. (1995)Maritimes Saint John 2.54 1.42 56.3 78 0.55 0.144 Marshall and Jones (1996); Myers and
Hutchings (1987)Maritimes South (Antig) 54.4 0.03 Claytor et al. (1995a)Maritimes St. Marys 1.24 54 74.9 91.1 0.76 Myers and Hutchings (1987)Maritimes Tabusintac 2.8 Atkinson and Hooper (1995)Maritimes West (Antig) 0.38 Claytor et al. (1995)Newfoundland Bay de l’Eau 0.724 73.1 Myers et al. (1986)Newfoundland Beaver 13.2 3 O’Connell and Ash (1993)Newfoundland Biscay Bay 3.1 1.05 52.9 0.75 O’Connell et al. (1996a)Newfoundland Branch 15.8 3.1 Chadwick et al. (1986)Newfoundland Burlington 15.1 3.6 Chadwick et al. (1986)Newfoundland Cambellton 17.7 3.5 1.05 52.5 0.95 0.763 Dempson et al. (1998a); O’Connell et al.
(1996a)Newfoundland Champney’s 15.5 3.4 Chadwick et al. (1986)Newfoundland Come-By-Chance 0.786 72.2 Myers et al. (1986)Newfoundland Conne 14.8 3.28 1.06 50.7 68.3 0.94 0.78 0.0578 Dempson et al. (1998a,b)Newfoundland East 13.6 4 Chadwick et al. (1986)Newfoundland Exploits 1.1 52 75.6 0.9 Bourgeois et al. (1996); Myers and Hutchings
(1987)Newfoundland Farmers 16.6 3.1 Chadwick et al. (1986)Newfoundland Fischells 14 2.6 0.587 O’Connell and Ash (1993)Newfoundland Gambo 16.7 3 Chadwick et al. (1986)Newfoundland Gander 15.7 3.7 1.09 53.7 0.9 0.76 Dempson et al. (1998a); O’Connell et al.
(1996b)Newfoundland Garia 15.7 2.9 Chadwick et al. (1986)Newfoundland Harry’s 3.4 1.02 50.4 71.4 0.98 0.621 Mullins et al. (1996)Newfoundland Highlands 13.1 2.9 1.36 53.3 73.4 0.36 0.55 82.7 Myers et al. (1986); Myers and Hutchings
(1987); O’Connell et al. (1996a)Newfoundland Humber 3.8 1.13 55 73.5 86.5 0.92 Mullins and Reddin (1996); Myers and
Hutchings (1987); Power (1981)Newfoundland Hunt 1.75 57.8 76.6 Myers and Hutchings (1987)Newfoundland Indian Bay 16.7 3.3 O’Connell and Ash (1993)Newfoundland Little Bk Pds 17.4 3.1 Chadwick et al. (1986)Newfoundland Little Codroy 15 2.66 1.48 54.1 75.1 89.6 0.6 0.411 0.0293 0.0135 0.715 85.9 Murray (1968); Myers et al. (1986); Myers
and Hutchings (1987)Newfoundland Lomond 2.86 1.14 52.4 70.7 0.86 0.55 0.486 72.7 Myers et al. (1986); Myers and Hutchings
(1987); O’Connell et al. (1996a)Newfoundland Middle Bk 17.1 3.47 1.03 53.1 0.97 0.79 Dempson et al. (1998a); O’Connell and Ash
(1993); O’Connell et al. (1996a)Newfoundland NE Placentia 13.9 2.88 1.08 52.9 0.92 0.91 Dempson et al. (1998a); O’Connell and Ash
1993); O’Connell et al. (1996a)
I:\Salmon Sup\D98-004.vp
Wednesday, February 10, 1999 9:37:47 AM
Color profile: Disabled
Composite Default screen

©1
99
8N
RC
Ca
na
da
42C
an.J.
Fish.A
quat.S
ci.Vol.
55(Suppl.
1),1998
Country/Region River
Smoltlength(cm)
Smoltage(yr)
Seaage(yr)
Grilselength(cm)
2SWlength(cm)
3SWlength(cm)
%Grilse
% femgrilse
Egg–smoltsurvival
Smolt–grilsesurvival
% 1+Male parrmaturity
1+Parrlength(mm) References
Newfoundland NE Trepassey 15.4 3.67 1.18 0.82 0.0622 Dempson et al. (1998a)Newfoundland North Hr 15.1 3.2 1.22 55.1 76.3 0.78 0.118 84.3 Myers et al. (1986); Myers and Hutchings
(1987); O’Connell and Ash (1993)Newfoundland Northwest 17.2 4 0.952 90.5 Chadwick et al. (1986); Myers et al. (1986)Newfoundland Pipers Hole 16.4 3.4 Chadwick et al. (1986)Newfoundland Ragged Hr 17.6 3.5 O’Connell and Ash (1993)Newfoundland Red Harbour 14.7 3.2 Chadwick et al. (1986)Newfoundland Renews 17.8 2.7 Chadwick et al. (1986)Newfoundland River of Pds 16.2 3.3 O’Connell and Ash (1993)Newfoundland Riverhead 16 3.4 Chadwick et al. (1986)Newfoundland Robinsons 13.5 2.9 0.551 Mullins et al. (1996); O’Connell and Ash
(1993)Newfoundland Salmonier 16 3.1 Chadwick et al. (1986)Newfoundland Sops Arm 13 4.1 Chadwick et al. (1986)Newfoundland Southwest 13.4 3 Chadwick et al. (1986)Newfoundland St. Geneviev 17 4.2 Chadwick et al. (1986)Newfoundland Taylor Bay 17.5 3.3 Chadwick et al. (1986)Newfoundland Terra Nova 14.9 3.44 1.21 52.3 0.79 0.74 Dempson et al. (1998a); O’Connell et al.
(1996a);Newfoundland Terrenceville 13.9 3.3 Chadwick et al. (1986)Newfoundland Torrent 3.17 1.07 52.7 0.93 0.647 O’Connell et al. (1996a)Newfoundland Trouty 16.7 3.2 Chadwick et al. (1986)Newfoundland Wst Arm Bk 16.8 3.68 1.01 52.9 0.99 0.778 0.0167 0.0489 0.039 75.4 Myers et al. (1986); O’Connell et al. (1996a)Newfoundland Wings Bk 16.4 4 1 51 0.793 76.3 Hutchings (1985, 1986); Myers et al. (1986)Norway Altaelva 13.5 4.2 2.15 0.423 0.056 Lund et al. (1989); Saksgård et al. (1992)Norway Årøelva 14.8 3.1 2.64 89.3 104.8 86.3 Huitfeldt-Kaas (1946)Norway Beiarelva 13.6 5.4 52.4 Jensen and Johnsen (1985); Økland et al.
(1993)Norway Blomo 3.16 1.69 Dahl (1937)Norway Bondalselv 57.54 80.25 Jonsson et al. (1991)Norway Drammenselv 66.27 90.32 Jonnson et al. (1991)Norway Eira 12.1 2.88 2.53 83.2 104.1 81 Huitfeldt-Kaas (1946)Norway Etneelv 62.36 77.83 Jonsson et al. (1991)Norway Figgenelva 11.7 2.28 1.47 58.3 77.1 84 Huitfeldt-Kaas (1946)Norway Figgjo 59.31 75.95 0.0399 Jonsson et al. (1991); Friedland et al. (unpub-
lished data)Norway Håelva 12.5 2.47 1.32 60.2 80 89 Huitfeldt-Kaas (1946); Jonsson et al. (1991)Norway Imsa 15.4 1.95 1.19 61.29 82.36 90.6 0.83 0.0357 ICES (1994a); Jonsson et al. (1991, 1998)Norway Kristiansand 2.96 1.63 Dahl (1937)Norway Lærdalselva 11.9 2.82 2.03 67.96 89.26 98.7 0.12 82 Huitfeldt-Kaas (1946); Jonsson et al. (1991);
Lund et al. (1989); Økland et al. (1993)Norway Loneelv 55.41 Jonsson et al. (1991)Norway Målselva 14.5 3.66 1.72 62.5 0.47 0.039 Kristoffersen and Staldvik (1996)Norway Mandalselva 13.3 2.82 1.13 54 79.3 85 Huitfeldt-Kaas (1946)Norway Moltuen 3.66 1.72 Dahl (1937)
Table A1. (Continued).
I:\Salmon Sup\D98-004.vp
Wednesday, February 10, 1999 9:37:54 AM
Color profile: Disabled
Composite Default screen

©1
99
8N
RC
Ca
na
da
Hutchings
andJones
43
Country/Region River
Smoltlength(cm)
Smoltage(yr)
Seaage(yr)
Grilselength(cm)
2SWlength(cm)
3SWlength(cm)
%Grilse
% femgrilse
Egg–smoltsurvival
Smolt–grilsesurvival
% 1+Male parrmaturity
1+Parrlength(mm) References
Norway Namsen 11.9 2.67 2.13 58.49 86.75 100.24 0.27 0.497 80 Huitfeldt-Kaas (1946); Jonsson et al. (1991);Lund et al. (1989)
Norway Nummedals 10.5 2.47 1.91 65.4 84.5 101.7 72 Huitfeldt-Kaas (1946); Jonsson et al. (1991)Norway Ogna 13.2 2.65 1.24 54.6 78.6 88 Huitfeldt-Kaas (1946)Norway Opo 59.04 81.69 99.12 Jonsson et al. (1991)Norway Orkla 11.4 2.82 2.16 56.8 81.6 98.7 78 Huitfeldt-Kaas (1946)Norway Ørstaelv 56.92 Jonsson et al. (1991)Norway Otra 12.8 2.63 2.09 60.1 86.8 107.8 86 Huitfeldt-Kaas (1946)Norway Ranaelv 60.85 80.04 Jonsson et al. (1991)Norway Repparfjord 1.32 0.77 Lund et al. (1989)Norway Sandvikselv 64.21 83.49 Jonsson et al. (1991); Økland et al. (1993)Norway Saltdalselva 14.3 4.42 Jensen (1995); Økland et al. (1993)Norway Stjørdalselv 63.24 86.15 Jonsson et al. (1991)Norway Stryneelva 13.7 2.77 2.48 0.2 Jensen (1995); Lund et al. (1989)Norway Tana 13.3 3.11 2.53 78.7 94.5 87 Huitfeldt-Kaas (1946)Norway Tengselva 14.1 2.92 1.7 60.8 75.8 93 Huitfeldt-Kaas (1946)Norway Tovdalselva 13 2.72 1.32 52.8 76.1 87 Huitfeldt-Kaas (1946)Norway Varhaugelva 12.1 2.73 1 49.3 86 Huitfeldt-Kaas (1946)Norway Vefsna 59.34 85.48 94.31 Jonsson et al. (1991)Norway Vosso 14 2.88 2.54 107.3 90 Huitfeldt-Kaas (1946)Québec Bec-Scie 2.97 1.52 0.0156 0.0283 Caron (1992, 1996); Caron and Bolduc (1991)Québec Bouleau 13.1 3.14 1.57 50.6 74.6 0.43 0.13 83.6 Randall and Power (1979)Québec Cap-Chat 2.16 56.3 78.9 93.4 0.13 Myers and Hutchings (1987)Québec Cascapédia 13.9 3.30 77.7 Power (1981)Québec Corneille 3.02 1.71 53.3 70.0 0.13 0 0.383 98.9 Bielak and Power (1986). Myers et al. (1986);
Myers and Hutchings (1987); Power (1981)Québec Etamamiou 3.66 1.23 Bielak and Power (1986)Québec George 21.5 5.85 1.95 56.1 78.7 0.05 0.20 Power (1969)Québec Godbout 3.36 1.67 0.82 0.02 Bielak and Power (1986)Québec Grande Rivière 1.97 54.9 74.4 90.9 0.12 Myers and Hutchings (1987)Québec Grand Trinite 3.07 1.1 Bielak and Power (1986)Québec Gros Mecatina 3.43 1.08 Bielak and Power (1986)Québec Jupiter 4.10 48.5 70.2 Power (1981)Québec Koksoak 20.6 5.60 1.53 62.3 80.3 0.47 0 70.0 Power (1969); Robitaille et al. (1984, 1986)Québec Laval 2.88 1.77 Bielak and Power (1986)Québec Leaf 1.88 62.4 79.7 0.12 Lee and Power (1976)Québec Madeleine 1.79 51.5 75.2 92.1 0.31 Myers and Hutchings (1987)Québec Matamek 15 3.11 1.31 52.9 72.9 0.68 0.06 0.626 85.9 Bielak and Power (1986); Gibson (1978);
Myers et al. (1986); Myers and Hutchings(1987)
Québec Matane 1.67 54.8 71.9 90.3 0.48 Myers and Hutchings (1987)Québec Matapédia 2.17 56.8 80 94.6 0.11 Myers and Hutchings (1987)Québec Mingan 3.48 1.64 0.07 0 Bielak and Power (1986)Québec Mistassini 3.28 1.69 0.64 0.14 0.097 76.1 Bielak and Power (1986); Myers et al. (1986)Québec Mitis 1.74 0.38 Côté and Beaulieu (1987)
Table A1. (Continued).
I:\Salmon Sup\D98-004.vp
Wednesday, February 10, 1999 9:38:02 AM
Color profile: Disabled
Composite Default screen

©1
99
8N
RC
Ca
na
da
44C
an.J.
Fish.A
quat.S
ci.Vol.
55(Suppl.
1),1998
Country/Region River
Smoltlength(cm)
Smoltage(yr)
Seaage(yr)
Grilselength(cm)
2SWlength(cm)
3SWlength(cm)
%Grilse
% femgrilse
Egg–smoltsurvival
Smolt–grilsesurvival
% 1+Male parrmaturity
1+Parrlength(mm) References
Québec Moisie 12 3.57 2.6 48.7 74.6 90.7 0.05 0 0 63.1 Bielak and Power (1986); Myers et al. (1986);Power (1981)
Québec Nabisipi 4.07 1.98 54.5 77.4 87.6 0.05 Bielak and Power (1986); Myers andHutchings (1987)
Québec Natashquan 3.95 1.33 Bielak and Power (1986)Québec Olomane 3.62 1.93 Bielak and Power (1986)Québec Pigou 15.1 2.93 1.58 53.1 72.7 0.375 96.2 Randall and Power (1979); Myers et al. (1986)Québec Pt. Saguenay 1.67 56.7 79.1 92.3 0.6 Myers and Hutchings (1987)Québec Puyjalon 0 71.3 Myers et al. (1986)Québec Romaine 3.1 2.08 0.02 0 Bielak and Power (1986)Québec Ste. Anne 2.12 56.1 80.8 95.8 0.12 Myers and Hutchings (1987)Québec Ste. Marguerite 3.32 1.86 52.8 75.2 90.1 0.07 0 0.167 66.3 Bielak and Power (1986); Myers et al. (1986);
Myers and Hutchings (1987)Québec Saint-Jean 11.5 3.52 1.89 54.4 73.3 90.7 0.23 0.02 0.303 0.1282 0 54.2 Caron (1996); Caron and Bolduc (1991);
Caron and Fontaine (1998); Myers et al.(1986); Myers and Hutchings (1987)
Québec Trinité 12.1 3.00 1.29 54.2 74.7 0.59 0.08 0.0324 0.0237 80.6 Caron (1992, 1996); Caron and Bolduc(1991);Caron and Fontaine (1998); Myersand Hutchings (1987)
Québec Grand Watchichou 3.66 1.56 53.3 70.4 0.43 0.408 89.3 Bielak and Power (1986); Myers andHutchings (1986); Riley et al. (1984)
Québec Whale 20.6 5.24 1.84 58.7 77.4 0.16 0.11 Power (1969)Russia Pizhma 14 3.9 0.1 87 Martynov et al. (1994)Russia Tuloma 0.53 Sharov et al. (1990)Scotland Almond 63.5 81.9 Thorpe et al. (1984)Scotland Bran 11.0 2.43 Harris (1973)Scotland Conon 2.62 Harris (1973)Scotland Dee 2.23 1.85 0.15 0.174 0.0074 Buck and Hay (1984); Harris (1973)Scotland Ewe 2.53 Harris (1973)Scotland Grimersta 2.71 Harris (1973)Scotland Nith 2.03 Harris (1973)Scotland North Esk 12.6 2.33 1.39 60.5 74.2 88.1 0.8 0.46 0.0601 ICES (1994a); Shearer (1992)Scotland Shelligan Burn 2.2 1.05 Egglishaw and Shackley (1977)Scotland Spey 2.30 Harris (1973)Scotland Tay 2.19 Harris (1973)Scotland Thurso 12.0 2.04 Harris (1973)Scotland Tweed 2.20 Mills (1989)Spain Cares 18.3 1.15 2.18 0.05 183 Nicieza and Braña (1993a,b); Nicieza et al.
(1991); Ventura (1987)Spain Esva 15.7 1.18 2.06 0.06 157 Nicieza and Braña (1993a,b); Nicieza et al.
(1991); Ventura (1987)Spain Narcea 17.6 1.2 2.22 70 0.05 176 Nicieza and Braña (1993a,b); Nicieza et al.
(1991); Ventura (1987)Spain Sella 1.36 2.12 0.04 Ventura (1987)Sweden Eman 1.5 Karlström (1977)
Table A1. (Continued).
I:\Salmon Sup\D98-004.vp
Wednesday, February 10, 1999 9:38:09 AM
Color profile: Disabled
Composite Default screen

©1
99
8N
RC
Ca
na
da
Hutchings
andJones
45
Country/Region River
Smoltlength(cm)
Smoltage(yr)
Seaage(yr)
Grilselength(cm)
2SWlength(cm)
3SWlength(cm)
%Grilse
% femgrilse
Egg–smoltsurvival
Smolt–grilsesurvival
% 1+Male parrmaturity
1+Parrlength(mm) References
Sweden Kalix Alv 3 Karlström (1977)Sweden Mörrumsån 1.5 Lindroth (1977)Sweden Ricklean 2.7 Osterdahl (1964)Sweden Torne Alv 3.5 Karlström (1977)U.S.A. Connecticut 18.3 1.94 1.98 0.02 150 Friedland et al. (1996); Orciari et al. (1994)U.S.A. Dennys 2.01 0.01 Baum (1997)U.S.A. East Machias 1.96 0.05 Baum (1997)U.S.A. Machias 1.97 0.04 Baum (1997)U.S.A. Penobscot 1.84 55.0 72.5 87.0 0.11 Baum (1997); Friedland et al. (1996)U.S.A. Pleasant 1.97 0.07 Baum (1997)U.S.A. Narraguagus 17.7 2.22 2.00 60.0 76.0 89.0 0.02 Baum (1997)U.S.A. Sheepscot 1.94 0.09 Baum (1997)U.S.A. Dee 1.98 Harris (1973)
Table A1. (Concluded).
I:\Salmon Sup\D98-004.vp
Wednesday, February 10, 1999 9:38:12 AM
Color profile: Disabled
Composite Default screen

© 1998 NRC Canada
46 Can. J. Fish. Aquat. Sci. Vol. 55(Suppl. 1), 1998
Trait Region RiverNumberof years Years Variance
Smolt-to-grilse survival Québec St. Jean 6 89–94 0.0026Trinité 11 84–94 0.0020Bec-Scie 7 88–94 0.0004
Newfoundland Sandhill 4 69–72 0.0056NE Trepassey 8 86–93 0.0020Conne 8 87–94 0.0031Western Arm Brook 24 71–95 0.0033Little Codroy 7 54–61 0.0004
Canadian Maritimes Miramichi 4 90–93 0.0051Big Salmon 5 66–71 0.0204
Iceland Elidaar 7 75–92 0.0103Vesturdalsa 5 83–92 0.0036
Ireland Burrishoole 14 79–92 0.0030Bush 12 81–92 0.0066
Scotland North Esk 8 81–91 0.0008Europe Nivelle 5 86–90 0.0122
Bresle 4 83–86 0.0042Norway Imsa 12 81–92 0.0045
Percent grilse Québec Trinité 13 80–92 0.0187Bec-Scie 9 84–92 0.0222
Newfoundland NE Trepassey 8 86–93 0.0052Conne 9 87–95 0.0012Western Arm Brook 24 71–95 0.0001Exploits 26 60–94 0.0250Salmon Brook 25 57–94 0.0412Gander 6 89–94 0.0061Middle Brook 17 72–94 0.0042Terra Nova 34 56–94 0.0306Biscay Bay 12 83–94 0.0037NE Placentia 21 71–94 0.0137Highlands 5 80–94 0.0156Humber 5 90–94 0.0066Lomond 19 72–94 0.0369Torrent 24 71–94 0.0085
Labrador Sandhill 5 69–94 0.0154Canadian Maritimes Miramichi 25 71–95 0.0310
Liscomb 15 80–94 0.0114Saint John 29 67–95 0.0222Magaguadavic 8 83–95 0.0119St. Croix 13 82–95 0.0502
Norway Strynelva 6 89–94 0.0534Percent female grilse Newfoundland Western Arm Brook 10 85–94 0.0092
Gander 3 92–94 0.0046Middle Brook 5 83–87 0.0388Terra Nova 5 83–87 0.0028NE Placentia 9 78–86 0.0017Lomond 6 84–94 0.0524Torrent 11 83–94 0.0090
Labrador Forteau 9 75–94 0.0204Pinware 8 74–93 0.0164
Canadian Maritimes Nepisiquit 8 83–90 0.0014Big Salmon 5 68–73 0.0026
Table A2. Temporal variation in Atlantic salmon life history characters. The variances of proportional data (i.e., survival, percentagegrilse, grilse sex ratio) have been calculated from original proportions,p, transformed as arcsin(p1/2). Variances of non-proportionaldata have been calculated from loge- transformations of the original data.
I:\Salmon Sup\D98-004.vpWednesday, February 10, 1999 9:38:17 AM
Color profile: DisabledComposite Default screen

© 1998 NRC Canada
Hutchings and Jones 47
Trait Region RiverNumberof years Years Variance
Fecundity Newfoundland Terra Nova 3 84–86 0.0006Middle Brook 3 84–86 0.0006
Canadian Maritimes Margaree 6 87–93 0.0086Scotland Girnock Burn 11 66–76 0.0022
Smolt age Québec Bec-Scie 9 84–92 0.0018Trinité 9 84–92 0.0005
Newfoundland Middle Brook 5 83–87 0.0014Terra Nova 5 83–87 0.0004NE Placentia 9 78–86 0.0056Lomond 13 78–95 0.0046Torrent 15 75–95 0.0017Western Arm Brook 25 71–95 0.0032Conne 10 86–95 0.0004
Labrador Forteau 8 78–94 0.0009Scotland North Esk 26 63–88 0.0019Europe Adour 6 69–78 0.0100Norway Stryneelva 6 89–94 0.0018
Saltdalselva 5 90–94 0.0010Altaelva 11 81–91 0.0010
Grilse length Newfoundland Terra Nova 5 83–87 0.0003NE Placentia 8 78–86 0.0003Torrent 11 83–94 0.0002Western Arm Brook 10 85–94 0.0005Conne 10 86–95 0.0001
Labrador Forteau 9 79–94 0.0002Canadian Maritimes Big Salmon 10 64–73 0.0022
LaHave 13 85–97 0.0003Miramichi 27 71–97 0.0009
Smolt length Québec St-Jean 10 88–97 0.0006Trinité 10 88–97 0.0005
Newfoundland Conne 10 86–95 0.0005Europe Adour 9 69–82 0.0040Norway Altaelva 11 81–91 0.0013
Table A2. (Concluded).
I:\Salmon Sup\D98-004.vpWednesday, February 10, 1999 9:38:19 AM
Color profile: DisabledComposite Default screen


![Observations on mr. [E.B.] Elliott's Horæ Apocalypticæpreteristarchive.com/Books/pdf/1852_strange_answering-elliott.pdfTitle: Observations on mr. [E.B.] Elliott's Horæ Apocalypticæ](https://static.fdocuments.us/doc/165x107/5e697daec40bd542907694e2/observations-on-mr-eb-elliotts-horf-apocalypticf-title-observations.jpg)
