INTERNATIONAL CONTAINER TERMINAL SERVICES, …€¦ · · 2017-05-18Results of Operations ... of...
62
ICTSI Form 17-Q Q1 2016 1 4 7 2 1 2 SEC Registration Number I N T E R N A T I O N A L C O N T A I N E R T E R M I N A L S E R V I C E S , I N C . A N D S U B S I D I A R I E S (Company’s Full Name) I C T S I A d m i n i s t r a t i o n B u i l d i n g , M I C T S o u t h A c c e s s R o a d , M a n i l a I A (Business Address: No. Street City/Town/Province) Jose Joel M. Sebastian 245-4101 (Contact Person) (Company Telephone Number) 1 2 3 1 S E C 17 Q 0 4 Every 3 rd Thursday Month Day (Form Type) Month Day (Fiscal Year) (Annual Meeting) N/A (Secondary License Type, If Applicable) None Dept. Requiring this Doc. Amended Articles Number/Section Total Amount of Borrowings 1,454 as of March 31, 2016 US$23.0M US$1,194.8M Total No. of Stockholders Domestic Foreign To be accomplished by SEC Personnel concerned File Number LCU Document ID Cashier S T A M P S Remarks: Please use BLACK ink for scanning purposes. COVER SHEET
Transcript of INTERNATIONAL CONTAINER TERMINAL SERVICES, …€¦ · · 2017-05-18Results of Operations ... of...

ICTSI Form 17-Q Q1 2016
1 4 7 2 1 2
SEC Registration Number
I N T E R N A T I O N A L C O N T A I N E R T E R M I N A L
S E R V I C E S , I N C . A N D S U B S I D I A R I E S
(Company’s Full Name)
I C T S I A d m i n i s t r a t i o n B u i l d i n g , M I
C T S o u t h A c c e s s R o a d , M a n i l a
I
A
(Business Address: No. Street City/Town/Province)
Jose Joel M. Sebastian 245-4101 (Contact Person) (Company Telephone Number)
1 2 3 1 S E C 17 Q 0 4 Every 3rd
Thursday
Month Day (Form Type) Month Day (Fiscal Year) (Annual Meeting)
N/A
(Secondary License Type, If Applicable)
None
Dept. Requiring this Doc. Amended Articles Number/Section
Total Amount of Borrowings
1,454
as of March 31, 2016
US$23.0M
US$1,194.8M
Total No. of Stockholders Domestic Foreign
To be accomplished by SEC Personnel concerned
File Number LCU
Document ID Cashier
S T A M P S
Remarks: Please use BLACK ink for scanning purposes.
COVER SHEET
ICTSI Form 17-Q Q1 2016
SECURITIES AND EXCHANGE COMMISSION
SEC FORM 17-Q
QUARTERLY REPORT PURSUANT TO SECTION 17 OF THE
SECURITIES REGULATION CODE AND SRC RULE 17(2)(b) THEREUNDER
1. For the quarterly period ended March 31, 2016
2. Commission identification number: 147212
3. BIR Tax Identification No. 000-323-228
4. Exact name of issuer as specified in its charter:
INTERNATIONAL CONTAINER TERMINAL SERVICES, INC.
5. Province, Country or other jurisdiction of incorporation or organization: Philippines
6. Industry Classification Code: ___________________ (SEC Use Only)
7. Address of issuer’s principal office: ICTSI Administration Building, MICT South Access Road,
Manila Postal Code: 1012 8. Registrant's telephone number, including area code: (632) 245-4101
9. Former name, former address, and former fiscal year: Not applicable
10. Securities registered pursuant to Sections 8 and 12 of the Code, or Sections 4 and 8 of the RSA.
Title of Each Class Number of shares outstanding
as of March 31, 2016
Common
2,034,110,390 Shares
11. Are any or all of the Securities listed on a Stock Exchange?
Yes [x] No [ ]
If yes, state the name of such Stock Exchange and the class/es of securities listed therein:
Philippine Stock Exchange Common shares
12. Indicate by check mark whether the issuer:
a) has filed all reports required to be filed by Section 17 of the Code and SRC Rule 17 thereunder or
Sections 11 of the RSA and RSA Rule 11(a)-1 thereunder, and Sections 26 and 141 of The Corporation
Code of the Philippines during the preceding 12 months (or for such shorter period that the registrant
was required to file such reports).
Yes [x] No [ ]
(b) has been subject to such filing for the past 90 days. Yes [x] No [ ]

ICTSI Form 17-Q Q1 2016
TABLE OF CONTENTS
PART 1 – FINANCIAL INFORMATION ........................................................................................ 1
Item 1. Financial Statements ............................................................................................... 1
Audited Consolidated Balance Sheet as at December 31, 2015 and
Interim Consolidated Balance Sheet as at March 31, 2016 ..................................... 3
Interim Consolidated Statements of Income for the
Three Months Ended March 31, 2015 and 2016 ..................................................... 4
Interim Consolidated Statements of Comprehensive Income for the
Three Months Ended March 31, 2015 and 2016 ..................................................... 5
Interim Consolidated Statements of Changes in Equity for the
Three Months Ended March 31, 2015 and 2016 ..................................................... 6
Interim Consolidated Statements of Cash Flows for the
Three Months Ended March 31, 2015 and 2016 ..................................................... 7
Notes to Unaudited Interim Condensed Consolidated Financial Statements ....................... 8
Item 2. Management’s Discussion and Analysis of Financial Condition and
Results of Operations. ............................................................................................ 30
PART II – OTHER INFORMATION ............................................................................................. 49
ANNEX 1 – Schedule of Aging of Receivables .............................................................................. 50
ANNEX 2 – Financial Soundness Indicators .................................................................................. 51
ANNEX 3 – List of Effective PFRS Standards and Interpretations ................................................ 52
ANNEX 4 – Map of Subsidiaries .................................................................................................... 58
SIGNATURES ................................................................................................................................ 59

ICTSI Form 17-Q Q1 2016 1
PART 1 – FINANCIAL INFORMATION
Item 1. Financial Statements
The audited consolidated balance sheet as at December 31, 2015 and the unaudited interim condensed
consolidated financial statements as at March 31, 2016 and for the three months ended March 31,
2015 and 2016 and the related notes to unaudited interim condensed consolidated financial statements
of International Container Terminal Services, Inc. and Subsidiaries (collectively referred to as “the
Group”) are filed as part of this Form 17-Q on pages 2 to 29.
Operating segments are also reported in the notes to unaudited interim condensed consolidated
financial statements.
There are no other material events subsequent to the end of this interim period that have not been
reflected in the unaudited interim condensed consolidated financial statements filed as part of this
report.

ICTSI Form 17-Q Q1 2016 2
International Container Terminal Services, Inc.
and Subsidiaries
Unaudited Interim Condensed Consolidated Financial Statements As at March 31, 2016
(with Comparative Audited Figures as of December 31, 2015)
and for the Three Months Ended March 31, 2015 and 2016

ICTSI Form 17-Q Q1 2016 3
INTERNATIONAL CONTAINER TERMINAL SERVICES, INC.
AND SUBSIDIARIES
INTERIM CONSOLIDATED BALANCE SHEETS As at March 31, 2016
(With Comparative Audited Figures as at December 31, 2015) (In Thousands)
December 31,
2015
(Audited)
March 31,
2016
(Unaudited)
ASSETS
Noncurrent Assets
Intangibles (Notes 1 and 5) US$1,715,582 US$1,716,577
Property and equipment (Notes1 and 6) 1,148,856 1,223,967
Investment properties 6,841 6,850
Investments in and advances to a joint venture and an associate
(Notes 7 and 16) 231,916 254,690
Deferred tax assets - net 87,006 84,710
Other noncurrent assets (Note 8) 137,514 160,322
Total Noncurrent Assets 3,327,715 3,447,116
Current Assets
Cash and cash equivalents (Note 9) 354,482 311,180
Receivables (Note 10) 87,200 90,410
Spare parts and supplies 27,596 28,945
Prepaid expenses and other current assets (Notes 1 and 11) 44,108 47,872
Derivative assets 331 –
Total Current Assets 513,717 478,407
US$3,841,432 US$3,925,523
EQUITY AND LIABILITIES
Equity Attributable to Equity Holders of the Parent
Capital stock:
Preferred stock US$236 US$236
Common stock 67,330 67,330
Additional paid-in capital (Note 15) 534,808 535,408
Cost of shares held by subsidiaries (Note 15) (74,261) (74,261)
Treasury shares (7,548) (10,094)
Excess of acquisition cost over the carrying value
of non-controlling interests (Notes 1 and 15) (142,555) (142,555)
Retained earnings (Note 15) 723,159 757,711
Perpetual capital securities (Note 15) 831,910 726,669
Other comprehensive loss - net (Note 15) (258,636) (240,057)
Total equity attributable to equity holders of the parent 1,674,443 1,620,387
Equity Attributable to Non-controlling Interests (Notes 1 and 15) 151,605 155,251
Total Equity 1,826,048 1,775,638
Noncurrent Liabilities
Long-term debt - net of current portion (Note 12) 1,026,578 1,042,925
Concession rights payable - net of current portion (Note 5) 503,208 501,398
Deferred tax liabilities 77,493 75,080
Other noncurrent liabilities (Note 13) 119,354 47,997
Total Noncurrent Liabilities 1,726,633 1,667,400
Current Liabilities
Loans payable (Note 12) 2,027 4,009
Perpetual capital securities (Notes 12 and 15) – 112,865
Accounts payable and other current liabilities (Notes 1, 14 and 16) 200,870 263,159
Current portion of long-term debt (Note 12) 54,465 57,990
Current portion of concession rights payable (Note 5) 8,830 9,478
Income tax payable 22,005 34,322
Derivative liabilities - net 554 662
Total Current Liabilities 288,751 482,485
US$3,841,432 US$3,925,523
See accompanying Notes to Unaudited Consolidated Financial Statements.

ICTSI Form 17-Q Q1 2016 4
INTERNATIONAL CONTAINER TERMINAL SERVICES, INC.
AND SUBSIDIARIES
INTERIM CONSOLIDATED STATEMENTS OF INCOME (In Thousands, Except Per Share Data)
For the Three Months Ended March 31
2015
(Unaudited) 2016
(Unaudited)
INCOME
Gross revenues from port operations US$296,062 US$266,469
Foreign exchange gain - net (Note 3) 965 3,007
Interest income 2,618 4,116
Other income (Note 13) 660 2,173
300,305 275,765
EXPENSES
Port authorities’ share in gross revenues (Note 16) 48,793 43,020
Manpower costs (Note 16) 50,153 47,697
Equipment and facilities-related expenses (Note 16) 39,422 27,852
Depreciation and amortization 30,970 36,352
Administrative and other operating expenses (Note 16) 30,161 25,963
Interest expense and financing charges on borrowings (Notes 5, 6 and 12) 14,210 18,346
Interest expense on concession rights payable (Note 5) 9,345 9,103
Foreign exchange loss - net (Note 3) 1,789 1,275
Equity in net loss of a joint venture (Note 7) 606 2,074
Other expenses 2,424 2,598
227,873 214,280
CONSTRUCTION REVENUE (EXPENSE)
Construction revenue 15,702 13,127
Construction expense (15,702) (13,127)
– –
INCOME BEFORE INCOME TAX 72,432 61,485
PROVISION FOR INCOME TAX
Current 13,280 16,447
Deferred 2,350 (16)
15,630 16,431
NET INCOME US$56,802 US$45,054
ATTRIBUTABLE TO:
Equity holders of the parent US$54,001 US$42,176
Non-controlling interests 2,801 2,878
US$56,802 US$45,054
Earnings Per Share (Note 17)
Basic US$0.023 US$0.014
Diluted 0.023 0.014
See accompanying Notes to Unaudited Consolidated Financial Statements.

ICTSI Form 17-Q Q1 2016 5
INTERNATIONAL CONTAINER TERMINAL SERVICES, INC.
AND SUBSIDIARIES
INTERIM CONSOLIDATED STATEMENTS OF COMPREHENSIVE INCOME (In Thousands)
For the Three Months Ended March 31
2015
(Unaudited) 2016
(Unaudited)
NET INCOME FOR THE PERIOD US$56,802 US$45,054
OTHER COMPREHENSIVE INCOME (LOSS)
Items to be reclassified to profit or loss in subsequent periods
Exchange differences on translation of foreign operations’
financial statements (Note 3) (39,609) 21,127
Net unrealized loss on derivatives removed from equity and capitalized as
construction in-progress 1,855 –
Net change in unrealized mark-to-market values of derivatives (297) (108)
Income tax relating to components of other comprehensive income 179 6
Net unrealized mark-to-market gain (loss) on available-for-sale investments 4 (456)
(37,868) 20,569
Items not to be reclassified to profit or loss in subsequent periods
Actuarial gains on defined benefit plans - net of tax (Note 15) – 4
(37,868) 20,573
TOTAL COMPREHENSIVE INCOME FOR THE PERIOD US$18,934 US$65,627
ATTRIBUTABLE TO:
Equity holders of the parent US$18,422 US$60,755
Non-controlling interests 512 4,872
US$18,934 US$65,627
See accompanying Notes to Unaudited Consolidated Financial Statements.

SEC Form 17-Q Q1 2016 6
INTERNATIONAL CONTAINER TERMINAL SERVICES, INC.
AND SUBSIDIARIES
INTERIM CONSOLIDATED STATEMENTS OF CHANGES IN EQUITY FOR THE THREE MONTHS ENDED MARCH 31, 2015 AND 2016
(In Thousands)
Attributable to Equity Holders of the Parent
Preferred
Stock
Common
Stock
Additional
Paid-in
Capital
(Note 15)
Preferred
Shares Held
by a
Subsidiary
(Note 15)
Common
Shares Held
by a
Subsidiary
(Note 15) Treasury
Shares
Excess of
Acquisition
Cost over the
Carrying
Value of
Non-
controlling
Interests
(Note 15)
Retained
Earnings
(Note 15)
Perpetual
Capital
Securities
(Note 15)
Other
Compre-
hensive
Income
(Note 15) Total
Non-
controlling
Interests
(Note 15) Total
Equity
Balance at December 31, 2014 US$236 US$67,330 US$530,678 (US$72,492) US$– (US$1,177) (US$135,448) US$763,315 US$337,032 (US$173,433) US$1,316,041 US$157,523 US$1,473,564
Total comprehensive income for
the period – – – – – – – 54,001 – (35,579) 18,422 512 18,934
Share-based payments (Note 15) – – (765) – – – – – – – (765) – (765) Issuance of treasury shares – – (198) – – 198 – – – – – – –
Acquisition of ICTSI common
shares (Note 15) – – – – (1,086) – – – – – (1,086) – (1,086)
Cash dividends (Note 15) – – – – – – – – – – – (1,818) (1,818)
Issuance and exchange of perpetual
capital securities (Note 15) – – – – – – – (23,234) 69,920 – 46,686 – 46,686
Distributions of perpetual capital securities – – – – – – – (4,494) – – (4,494) – (4,494)
Changes in non-controlling interest
(Notes 1 and 15) – – – – – – (6,541) – – – (6,541) 481 (6,060)
Balance at March 31, 2015 US$236 US$67,330 US$529,715 (US$72,492) (US$1,086) (US$979) (US$141,989) US$789,588 US$406,952 (US$209,012) US$1,368,263 US$156,698 US$1,524,961
Balance at December 31, 2015 US$236 US$67,330 US$534,808 (US$72,492) (US$1,769) (US$7,548) (US$142,555) US$723,159 US$831,910 (US$258,636) US$1,674,443 US$151,605 US$1,826,048
Total comprehensive income for
the period – – – – – – – 42,176 – 18,579 60,755 4,872 65,627 Share-based payments (Note 15) – – 716 – – – – – – – 716 – 716
Issuance of treasury shares – – (116) – – 116 – – – – – – –
Purchase of treasury shares – – – – – (2,662) – – – – (2,662) – (2,662)
Cash dividends (Note 15) – – – – – – – – – – – (1,226) (1,226)
Redemption of perpetual capital
securities – – – – – – – (7,624) (105,241) – (112,865) – (112,865)
Balance at March 31, 2016 US$236 US$67,330 US$535,408 (US$72,492) (US$1,769) (US$10,094) (US$142,555) US$757,711 US$726,669 (US$240,057) US$1,620,387 US$155,251 US$1,775,638
See accompanying Notes to Unaudited Consolidated Financial Statements.

ICTSI Form 17-Q Q1 2016 7
INTERNATIONAL CONTAINER TERMINAL SERVICES, INC.
AND SUBSIDIARIES
INTERIM CONSOLIDATED STATEMENTS OF CASH FLOWS (In Thousands)
For the Three Months Ended March 31
2015
(Unaudited)
2016
(Unaudited)
CASH FLOWS FROM OPERATING ACTIVITIES
Income before income tax US$72,432 US$61,485
Adjustments for:
Depreciation and amortization 30,970 36,352
Interest expense on:
Borrowings (Notes 5, 6 and 12) 14,210 18,346
Concession rights payable (Note 5) 9,345 9,103
Interest income (2,618) (4,116)
Unrealized foreign exchange loss (gain) 1,199 (1,227)
Share-based payments (Note 15) 831 742
Equity in net loss of a joint venture (Note 7) 606 2,074
Loss (gain) on sale of property and equipment 64 (116)
Operating income before changes in working capital 127,039 122,643
Decrease (increase) in:
Receivables (Note 10) 1,806 (1,777)
Spare parts and supplies (1,228) (559)
Prepaid expenses and other current assets (Note 11) (4,248) (6,991)
Increase (decrease) in:
Accounts payable and other current liabilities 17,159 (6,424)
Pension liabilities 39 160
Cash generated from operations 140,567 107,052
Income taxes paid (4,952) (5,886)
Net cash provided by operating activities 135,615 101,166
CASH FLOWS FROM INVESTING ACTIVITIES
Acquisitions of property and equipment (Note 6) (36,487) (54,755)
Acquisitions of intangible assets (Note 5) (27,759) (23,968)
Increase in investment in and advances to a joint venture
(Notes 1, 7 and 16) (15,993) (20,013)
Increase in other noncurrent assets (4,935) (25,941)
Interest received 2,579 3,891
Payments for concession rights (Note 5) (2,351) (2,693)
Proceeds from sale of property and equipment 307 1,217
Net cash used in investing activities (84,639) (122,262)
CASH FLOWS FROM FINANCING ACTIVITIES
Net proceeds from:
Long-term borrowings (Note 12) 58,240 23,396
Short-term borrowings (Note 12) – 3,500
Payments of:
Interest on borrowings and concession rights payable (Notes 5 and 12) (35,915) (38,708)
Short-term borrowings (4,143) (1,518)
Long-term borrowings (Note 12) (3,989) (5,131)
Dividends (3,386) (1,231)
Distribution on perpetual capital securities (Note 15) (4,494) –
Purchase of treasury shares – (2,662)
Increase (decrease) in other noncurrent liabilities 2,056 (1,025)
Acquisition of ICTSI common shares by a subsidiary (Note 15) (1,086) –
Changes in non-controlling interest (Notes 15) 567 –
Net cash provided by (used in) financing activities 7,850 (23,379)
EFFECT OF EXCHANGE RATE CHANGES ON CASH AND CASH
EQUIVALENTS (3,932) 1,173
NET INCREASE (DECREASE) IN CASH AND CASH EQUIVALENTS 54,894 (43,302)
CASH AND CASH EQUIVALENTS AT BEGINNING OF PERIOD 194,298 354,482
CASH AND CASH EQUIVALENTS AT END OF PERIOD
(Note 9) US$249,192 US$311,180
See accompanying Notes to Unaudited Consolidated Financial Statements.

SEC Form 17-Q Q1 2016 8 8
INTERNATIONAL CONTAINER TERMINAL SERVICES, INC.
AND SUBSIDIARIES
NOTES TO INTERIM CONDENSED CONSOLIDATED FINANCIAL
STATEMENTS
1. Corporate Information
1.1 General
International Container Terminal Services, Inc. (ICTSI or the Parent Company) was incorporated
in the Philippines and registered with the Philippine Securities and Exchange Commission (SEC)
on December 24, 1987. The registered office address of the Company is ICTSI Administration
Building, MICT South Access Road, Manila. ICTSI’s common shares were listed with the
Philippine Stock Exchange (PSE) on March 23, 1992 at an offer price of P=6.70. ICTSI has
2,034,110,390 common shares outstanding held by 1,454 shareholders on record as of
March 31, 2016.
1.2 Port Operations
ICTSI and subsidiaries (collectively referred to as “the Group”) entered into various concessions
of port operations which include development, management, and operation of container terminals
and related facilities around the world. As of May 5, 2016, the Group is involved in 30 terminal
concessions and port development projects in 20 countries worldwide. These are 25 operating
terminals in eight key ports and an inland container terminal in the Philippines, two in Indonesia
and one each in Brunei, China, the United States of America (U.S.A.), Ecuador, Brazil, Poland,
Georgia, Madagascar, Croatia, Pakistan, Mexico, Honduras, Iraq and Argentina; three ongoing
port development projects in Colombia, DR Congo and Australia; a sub-concession agreement to
develop, manage and operate a port in Nigeria; and a recent acquisition of an existing concession
to construct and operate a port in Tuxpan, Mexico. The expected start of commercial operations
of the ongoing projects are third quarter of 2016 for Colombia and DR Congo and first quarter of
2017 for Australia. The construction of the terminal in Nigeria is expected to start in 2016 and is
scheduled to commence initial operations in middle of 2019. As at May 5, 2016, the terminal in
Argentina is ready to operate.
Concessions for port operations and port development projects entered into, renewed, acquired
and terminated by ICTSI and subsidiaries for the last two years are summarized below:
River Port, Matadi, Democratic Republic of Congo. On January 23, 2014, ICTSI, through its
subsidiary ICTSI Cooperatief U.A. (ICTSI Cooperatief), forged a business partnership with La
Societe de Gestion Immobiliere Lengo (SIMOBILE) for the establishment and formation of a
joint venture company, ICTSI DR Congo S.A. (IDRC). IDRC, which is initially 60 percent-
owned by ICTSI Cooperatief, will build a new terminal along the river bank of the Congo River
in Matadi and manage, develop and operate the same as a container terminal, as well as provide
exclusive container handling services and general cargo services therein. On May 19, 2015,
ICTSI, through its subsidiary, ICTSI Cooperatief, and its joint venture partner, SIMOBILE,
transferred their respective 8% and 2% ownership interest in IDRC to Societe Commerciale Des
Transports Et Des Ports S.A. (SCTP SA). SIMOBILE transferred to its subsidiary, La Societe
d’Investissement et de Placement (SIP) Sprl, its 10% ownership in IDRC. Thereafter, IDRC is
owned 52% by ICTSI, 28% by SIMOBILE, 10% by SIP Sprl and 10% by SCTP SA.
The facility to be constructed in Phase 1 will consist of two berths that will be able to handle
120,000 TEUs and 350,000 metric tons. The capacity and berth length can, subject to demand, be
doubled in Phase 2. Phase 1 is expected to be completed within 18 to 24 months from the start of

SEC Form 17-Q Q1 2016 9 9
construction. The construction of the terminal commenced in January 2015 and is expected to
start its initial operations in the third quarter of 2016.
Umm Qasr, Iraq. ICTSI, through its wholly owned subsidiary ICTSI (M.E.) DMCC [formerly
ICTSI (M.E.) JLT] (ICTSI Dubai), and General Company for Ports of Iraq (GCPI) signed on
April 8, 2014 the Contract for the Construction and Operation of Three New Quays and
Management and Operation of Quay No. 20 (“Contract”) in the Port of Umm Qasr (“Port”) in
Iraq. The Contract grants ICTSI the rights to: (a) manage and operate the existing container
facility at Berth 20 of the Port for a period of 10 years, (b) build, under a build-operate-transfer
(BOT) scheme, a new container and general cargo terminal in the Port for a concession period of
26 years, and (c) provide container and general cargo terminal services in both components.
ICTSI commenced trial operations at Berth 20 in September 2014 and full-fledged commercial
operations in November 2014.
Phase 1 of the expansion project under the BOT scheme will have 250 meters of berth with an
estimated capacity of 300,000 TEUs. When fully developed, the facility will have 600 meters of
quay with an estimated capacity of 900,000 TEUs. Phase 1 is expected to be completed by the
third quarter of 2016.
Port of Melbourne, Australia. On May 2, 2014, ICTSI, through its subsidiary in Australia,
Victoria International Container Terminal Ltd. (VICT), signed a contract in Melbourne with Port
of Melbourne Corporation (“POMC”) for the design, construction, commissioning, operation,
maintaining and financing of the Webb Dock Container Terminal (Terminal) and Empty
Container Park (ECP) at Webb Dock East (WDE) in the Port of Melbourne. Initially, VICT was
90% owned by ICTSI through ICTSI Far East Pte. Ltd. (IFEL), a wholly owned subsidiary, and
10% by Anglo Ports Pty Limited (“Anglo Ports”). On February 4, 2015, IFEL acquired the 10%
non-controlling interest from Anglo Ports and became 100% owner of VICT. The Contract grants
VICT the rights to: (a) design, build and commission the new Terminal at berths WDE 4 and
WDE 5, (b) design, build and commission the new ECP at WDE, and (c) operate the Terminal
and ECP until June 30, 2040.
Phase 1 construction of the Terminal with a capacity of 350,000 TEUs and ECP with a capacity of
250,000 TEUs commenced and expected to be ready for operation by first quarter of 2017.
Phase 2 construction of the Terminal with a capacity of more than 1,000,000 TEUs and ECP with
a capacity of 250,000 TEUs is expected to be completed by end of 2017. Port of Kattupalli, India. On June 30, 2014, ICTSI, through its subsidiaries ICTSI Ltd. and
International Container Terminal Services (India) Private Limited (ICTSI India), and L&T
Shipbuilding Ltd. (LTSB) signed a termination agreement cancelling ICTSI’s container port
agreement for the management and operation of the Kattupalli Container Terminal in Tamil,
Nadu, India. In accordance with the termination agreement, LTSB agreed to pay ICTSI India
approximately US$15.9 million (INR957.5 million) as reimbursement of the license fee the latter
paid to operate the terminal plus management fees and other amounts due to the latter. Yantai, China. On July 1, 2014, ICTSI, through its subsidiary ICTSI (Hongkong) Limited
(IHKL), acquired 51 percent of the total equity interest of Yantai International Container
Terminals, Limited (YICT). On the same date, ICTSI sold its 60 percent ownership interest in
Yantai Rising Dragon International Container Terminal, Ltd. (YRDICTL). The objective of these
transactions is to consolidate and optimize the overall port operations within the Zhifu Bay Port
Area. YICT became the only foreign container terminal and YRDICTL is dedicated to handling
local container cargo within the Zhifu Bay Port Area. Laguna Gateway Inland Container Terminal, Philippines. On March 2, 2015, Laguna Gateway
Inland Container Terminal, Inc. (LGICT) started operating the first one-stop ICT located in

SEC Form 17-Q Q1 2016 10 10
Barangays Banlic and San Cristobal, Calamba City, Laguna. LGICT is 60%-owned by IW Cargo
and the remaining 40% is owned by Nippon Container Terminals Co. Ltd., Transnational
Diversified Corporation and NYK- Fil-Japan Shipping Corp. The ICT primarily operates as an
extension of the seaport operations of the MICT. In particular, the said ICT is intended to
function as a regional logistics hub, which will service and support the operations of exporters and
importers, both within and outside the economic zones in the LABARZON area. Only fifty eight
(58) kilometers from Metro Manila, the ICT is situated on a twenty one (21)-hectare property,
strategically located near various economic export zones with an already existing adjacent
railroad. Of the said twenty one (21) hectares, four (4) hectares have already been previously
developed and available for immediate operations. Envisioned to be the first of its kind in
magnitude and operations, the ICT will be developed as a 24/7 state of the art facility with cutting
edge terminal systems and equipment.
Tuxpan, Mexico. On May 27, 2015, ICTSI, through its subsidiary, ICTSI Tuxpan B.V., acquired
from Grupo TMM S.A.B and Immobiliaria TMM S.A. de C.V 100 percent of the capital stock of
Terminal Maritima de Tuxpan, S.A de C.V (TMT) for US$54.5 million. TMT is a company duly
incorporated in accordance with the laws of Mexico with a concession to construct and operate a
maritime container terminal in the Port of Tuxpan, Mexico and is the owner of the real estate
where the maritime container terminal will be constructed. The concession agreement is valid
until May 25, 2021, subject to extension for another 20 years. The concession covers an area of
29,109.68 square meters, which is adjacent to the 43 hectares of land owned by TMT. Under the
concession agreement, TMT is liable and committed to: (1) pay fixed fee of MXN23.24 plus
value added tax (VAT), per square meter of assigned area and (2) pay variable fee starting year
2018. As of May 5, 2016, management is currently working on a development plan on TMT.
Brunei, Darussalam. On May 21, 2009, ICTSI, through New Muara Container Terminal
Services Sdn Bhd (NMCTS), entered into an Agreement with the Government for the operation
and maintenance of the Muara Container Terminal in Brunei Darussalam. The Agreement is valid
for a period of four years from commencement date of May 22, 2009. The term may be extended
for a period of one year at a time, for a maximum of two years subject to the mutual agreement of
the parties. In 2012, NMCTS got an extension for one year or until May 22, 2014. On April 3,
2014, NMCTS got another extension for one year or until May 20, 2015. In 2015, NMCTS got
another extension for one year or until May 20, 2016 as an interim operator pending the result of
the tender process, which NMCTS participated in. The said one year contract can be
pre-terminated by the Brunei Government with a 30-day notice to NMCTS.
Subsidiaries and Joint Venture
The subsidiaries include: Percentage of Ownership
Place of Nature of Functional December 31, 2015 March 31, 2016
Incorporation Business Currency Direct Indirect Direct Indirect
Asia
International Container Terminal Holdings,
Inc. (ICTHI) and Subsidiaries
Cayman Islands Holding Company US Dollar
100.00 – 100.00 –
Container Terminal Systems Solutions, Inc.
(CTSSI) (h)
Mauritius Software Developer US Dollar
– 100.00 – 100.00
ICTSI Ltd. Bermuda Holding Company US Dollar – 100.00 – 100.00
ICTSI Mauritius Mauritius Holding Company US Dollar – 100.00 – 100.00
Aeolina International Limited (AIL) British Virgin
Island
Holding Company US Dollar
– 100.00 – 100.00
Pakistan International Container Terminal
(PICT)
Pakistan Port Management Pakistani Rupee
– 64.53 – 64.53
IFEL Singapore Holding Company US Dollar – 100.00 – 100.00
New Muara Container Terminal Services
Sdn Bhd (NMCTS)
Brunei Port Management Brunei Dollar
– 100.00 – 100.00
PT ICTSI Jasa Prima Tbk (JASA) and
Subsidiaries
Indonesia Maritime
Infrastructure and
Logistics
US Dollar
– 80.16 – 80.16
PT PBM Olah Jasa Andal (OJA) Indonesia Port Management US Dollar – 80.16 – 80.16
PT Makassar Terminal Services, Inc. (MTS) Indonesia Port Management Indonesian Rupiah – 95.00 – 95.00
PT Container Terminal Systems Solutions
Indonesia (PT CTSSI)
Indonesia Software Developer US Dollar
– 100.00 – 100.00
IHKL Hong Kong Holding Company US Dollar – 100.00 – 100.00
YICT (e) China Port Management Renminbi – 51.00 – 51.00

SEC Form 17-Q Q1 2016 11 11
Percentage of Ownership
Place of Nature of Functional December 31, 2015 March 31, 2016
Incorporation Business Currency Direct Indirect Direct Indirect
Pentland International Holdings, Ltd.
(PIHL)
British Virgin
Island
Holding Company US Dollar
– 100.00 – 100.00
ICTSI Georgia Corp. (IGC) Cayman Island Holding Company US Dollar – 100.00 – 100.00
Global Procurement Ltd. (GPL, formerly
ICTSI Poland)
Bermuda Holding Company US Dollar
– 100.00 – 100.00
ICTSI Honduras Ltd. (formerly ICTSI
Brazil)
Bermuda Holding Company US Dollar
– 100.00 – 100.00
ICTSI Ltd. Regional Headquarters Philippines Regional
Headquarters
Philippine Peso
– 100.00 – 100.00
ICTSI India India Port Management Indian Rupee – 100.00 – 100.00
Container Terminal de Venezuela Conterven
CA (CTVCC)
Venezuela Holding Company US Dollar
– 95.00 – 95.00
ICTSI Africa (Pty) Ltd. South Africa Business
Development
Office (BDO)
South African Rand
– 100.00 – 100.00
Australian International Container
Terminals Limited (AICTL)(a)
Australia Port Management Australian Dollar
– 70.00 – 70.00
Mindanao International Container Terminal
Services, Inc. (MICTSI)
Philippines Port Management Philippine Peso
100.00 − 100.00 −
Abbotsford Holdings, Inc. (AHI) Philippines Holding Company Philippine Peso 100.00 – 100.00 –
Hijo International Port Services, Inc. (HIPS) Philippines Port Management Philippine Peso – 65.00 – 65.00
Davao Integrated Port and Stevedoring
Services Corporation (DIPSSCOR)
Philippines Port Management Philippine Peso
– 96.95 – 96.95
ICTSI Warehousing, Inc. (IWI) Philippines Warehousing Philippine Peso 100.00 – 100.00 –
IW Cargo Handlers, Inc. (IW Cargo) Philippines Port Equipment
Rental
US Dollar
– 100.00 – 100.00
Container Terminal Systems Solutions
Philippines, Inc. (CTSSI Phils.)
Philippines Software Developer US Dollar
– 100.00 – 100.00
Bauan International Ports, Inc. (BIPI) Philippines Port Management Philippine Peso – 60.00 – 60.00
Prime Staffing and Selection Bureau, Inc.
(PSSBI)(a)
Philippines Manpower
Recruitment
Philippine Peso
100.00 – 100.00 –
ICTSI Subic, Inc. (ICTSI Subic) Philippines Port Management US Dollar 100.00 – 100.00 –
Subic Bay International Terminal Holdings,
Inc. (SBITHI)
Philippines Holding Company US Dollar
83.33 – 83.33 –
Subic Bay International Terminal
Corporation (SBITC)
Philippines Port Management US Dollar
– 83.33 – 83.33
Cordilla Properties Holdings Inc. (Cordilla) Philippines Holding Company Philippine Peso 100.00 − 100.00 −
South Cotabato Integrated Port Services,
Inc. (SCIPSI)
Philippines Port Management Philippine Peso
35.70 14.38 35.70 14.38
ICTSI Dubai United Arab
Emirates
BDO US Dollar
100.00 − 100.00 −
ICTSI Capital B.V. (ICBV) The Netherlands Holding Company US Dollar – 100.00 – 100.00
Icon Logistiek B.V. The Netherlands Holding Company US Dollar – 100.00 – 100.00
Royal Capital B.V. (RCBV) The Netherlands Holding Company US Dollar – 75.00 – 75.00
ICTSI Cooperatief The Netherlands Holding Company US Dollar 1.00 99.00 1.00 99.00
Global Container Capital, B.V. The Netherlands Holding Company US Dollar – 100.00 – 100.00
ICTSI Treasury B.V. (ITBV or ICTSI
Treasury)
The Netherlands Holding Company
US Dollar – 75.00 – 75.00
ICTSI Americas, B.V. The Netherlands Holding Company US Dollar – 100.00 – 100.00
ICTSI Africa, B.V. The Netherlands Holding Company US Dollar – 100.00 – 100.00
ICTSI Cameroon B.V. (formerly Global
Procurement, B.V.)
The Netherlands Holding Company US Dollar
– 100.00 – 100.00
CMSA, B.V. The Netherlands Holding Company US Dollar – 100.00 – 100.00
Tecplata, B.V. The Netherlands Holding Company US Dollar – 100.00 – 100.00
SPIA Colombia, B.V. The Netherlands Holding Company US Dollar – 100.00 – 100.00
TSSA, B.V. The Netherlands Holding Company US Dollar – 100.00 – 100.00
CGSA, B.V. The Netherlands Holding Company US Dollar – 100.00 – 100.00
SPIA Spain SL Spain Holding Company US Dollar – 100.00 – 100.00
CGSA Transportadora SL Spain Holding Company US Dollar – 100.00 – 100.00
Crixus Limited British Virgin
Island
Holding Company US Dollar
– 100.00 – 100.00
VICT(a) Australia Port Management Australian Dollar – 90.00 – 100.00
Asia Pacific Port Holdings Private Ltd.
(APPH) (d)
Singapore Holding Company US Dollar
– 50.50 – 50.50
ICTSI Global Finance B.V. (IGFBV) (c) The Netherlands Holding Company US Dollar – 75.00 – 75.00
ICTSI Oceania B.V.(c) The Netherlands Holding Company US Dollar – 100.00 – 100.00
ICTSI Tuxpan B.V.(c) The Netherlands Holding Company US Dollar – 100.00 – 100.00
ICTSI Asia Pacific Business Services, Inc. (b) Philippines Business Process
Outsourcing
US Dollar
– 100.00 – 100.00
ICTSI Ltd. Regional Operating
Headquarters (b)
Philippines Regional Operating
Headquarters
Philippine Peso
– 100.00 – 100.00
ICTSI Project Delivery Services Co. Pte.
Ltd. (IPDS) (b)
Singapore Port Equipment
Sale and Rental
US Dollar
– 100.00 – 100.00
ICTSI Qatar LLC(b) Qatar Holding Company US Dollar – 100.00 – 100.00
ICTSI South Asia Pte. Ltd. (b) Singapore Holding Company US Dollar – 100.00 – 100.00
LGICT(b) Philippines Port Management Philippine Peso – 60.00 – 60.00
ICTSI Middle East DMCC (b) United Arab
Emirates
Holding Company US Dollar
– 100.00 – 100.00
ICTSI Global Cooperatief U.A. (b) The Netherlands Holding Company US Dollar – 100.00 – 100.00
Europe, Middle East and Africa (EMEA)
Tartous International Container Terminal
(TICT)
Syria Port Management US Dollar
100.00 – 100.00 –
Madagascar International Container
Terminal Services, Ltd. (MICTSL)
Madagascar Port Management
Euro – 100.00 – 100.00

SEC Form 17-Q Q1 2016 12 12
Percentage of Ownership
Place of Nature of Functional December 31, 2015 March 31, 2016
Incorporation Business Currency Direct Indirect Direct Indirect
Baltic Container Terminal Ltd. (BCT) Poland Port Management US Dollar – 100.00 – 100.00
AGCT (g) Croatia Port Management Euro – 51.00 – 51.00
Batumi International Container Terminal
LLC (BICTL)
Georgia Port Management US Dollar
– 100.00 – 100.00
LICTSLE(a) Nigeria Port Management US Dollar – 100.00 – 100.00
IDRC(a, c) Congo Port Management US Dollar – 52.00 – 52.00
ICTSI (M.E.) DMCC Iraq Branch (ICTSI
Iraq) (c)
Iraq Port Management US Dollar
– 100.00 – 100.00
Americas
Contecon Guayaquil, S.A. (CGSA) Ecuador Port Management US Dollar 99.99 0.01 99.99 0.01
Contecon Manzanillo S.A. (CMSA) Mexico Port Management Mexican Peso 1.00 99.00 1.00 99.00
Tecon Suape, S.A. (TSSA) Brazil Port Management Brazilian Real – 100.00 – 100.00
ICTSI Oregon, Inc. (ICTSI Oregon) U.S.A. Port Management US Dollar − 100.00 − 100.00
C. Ultramar, S.A. (CUSA) Panama Holding Company US Dollar – 100.00 – 100.00
Future Water, S.A. (FWSA) Panama Holding Company US Dollar – 100.00 – 100.00
Kinston Enterprise Corporation (KEC) Panama Holding Company US Dollar – 100.00 – 100.00
International Ports of South America and
Logistics SA (IPSAL)
Uruguay Holding Company US Dollar
− 100.00 − 100.00
Tecplata S.A (Tecplata)(a) Argentina Port Management US Dollar − 100.00 − 100.00
Nuevos Puertos S.A. (NPSA) Argentina Holding Company US Dollar 4.00 96.00 4.00 96.00
OPC Honduras Port Management US Dollar 30.00 70.00 30.00 70.00
TMT(i) Mexico Port Management Mexican Peso – 100.00 – 100.00
Sociedad Puerto Industrial Aguadulce SA
(SPIA) (a, f)
Colombia Port Management US Dollar
– 46.30 – 46.30
(a)
Not yet started commercial operations as at May 5, 2016 (b)
Established in 2015 (c)
Established in 2014 (d)
Acquired in March 2014 for US$89.1 thousand. This was not accounted for as a business combination due to the immateriality of amount involved. (e)
Acquired in 2014 (f)
Changed its functional currency from Colombian Peso to US Dollar in 2014 (g)
Changed its functional currency from Croatian Kuna to Euro in 2014 (h)
Dissolved on January 5, 2015 (i)
Acquired in 2015
On February 4, 2015, IFEL acquired the 10% non-controlling interest from Anglo Ports and
became 100% owner of VICT for US$5.8 million. This resulted in the reduction of
non-controlling interests account and the difference between the purchase price and carrying
value of the non-controlling interest of US$6.2 million was recognized under “Excess of
acquisition cost over the carrying value of non-controlling interests” account in the 2015
consolidated balance sheet.
On April 27, 2015, NICTI purchased ICTSI’s 60 percent ownership interest in NICTI for
JPY107.0 million (approximately US$0.9 million) as part of its treasury shares. The 10-year
lease agreement of NICTI will expire at year-end and negotiations for its renewal will soon
commence and ICTSI is no longer interested in participating in the said negotiations.
On May 19, 2015, ICTSI, through its subsidiary, ICTSI Cooperatief, and its joint venture partner,
SIMOBILE, transferred their respective 8% and 2% ownership interest in IDRC to Societe
Commerciale Des Transports Et Des Ports S.A. (SCTP SA) in exchange for the latter’s
contribution of technical knowledge, skills and substantial experience in the port and port system
in DRC and operation of railroad system and undertaking to facilitate the activities of IDRC and
to assist in its relations with the public authorities. SIMOBILE transferred to its subsidiary, SIP
Sprl, its 10% ownership in IDRC. Thereafter, IDRC is owned 52% by ICTSI, 28% by
SIMOBILE, 10% by SIP Sprl and 10% by SCTP SA.
On May 27, 2015, ICTSI, through its subsidiary, ICTSI Tuxpan B.V., acquired from Grupo TMM
S.A.B and Immobiliaria TMM S.A. de C.V 100 percent of the capital stock of TMT for US$54.5
million. The acquisition did not qualify as an acquisition of a business in accordance with PFRS
3, Business Combination, and was therefore accounted for as acquisition of assets, mainly
composed of land and concession rights.

SEC Form 17-Q Q1 2016 13 13
The fair values of the identifiable assets and liabilities of TMT at the date of acquisition were:
Fair Value
Recognized on
Acquisition
Assets
Property and equipment - land US$51,411
Intangibles - concession rights 3,247
Prepaid expenses and other current assets 163
54,821
Liabilities
Accounts payable and other current liabilities 321
Purchase consideration transferred and satisfied by cash US$54,500
2. Basis of Preparation
2.1 Basis of Preparation
The interim condensed consolidated financial statements as at March 31, 2016 and for the three
months ended March 31, 2015 and 2016 have been prepared on a historical cost basis, except for
available-for-sale (AFS) investments and derivative financial instruments which have been
measured at fair value. The interim condensed consolidated financial statements are presented in
United States dollar (US dollar, USD or US$), the Parent Company’s functional and presentation
currency. All values are rounded to the nearest thousand US dollar unit, except when otherwise
indicated. Any discrepancies in the tables between the listed amounts and the totals thereof are
due to rounding. Accordingly, figures shown as totals may not be an arithmetic aggregation of
the figures that precede them.
2.2 Statement of Compliance
The interim condensed consolidated financial statements have been prepared in accordance with
Philippine Accounting Standard (PAS) 34, Interim Financial Reporting. Accordingly, the interim
condensed consolidated financial statements do not include all the information and disclosures
required in the annual audited consolidated financial statements, and should be read in
conjunction with the Group’s audited annual consolidated financial statements as at and for the
year ended December 31, 2015.
3. Summary of Significant Accounting Policies
3.1 Basis of Consolidation
The consolidated financial statements of the Group include the accounts of ICTSI and its
subsidiaries where the Parent Company has control. Control is achieved when the Group is
exposed, or has rights, to variable returns from its involvement with the investee and has the
ability to affect those returns through its power over the investee.
Specifically, the Group controls an investee if and only if the Group has:
Power over the investee (i.e. existing rights that give it the current ability to direct the relevant
activities of the investee)
Exposure, or rights, to variable returns from its involvement with the investee, and
The ability to use its power over the investee to affect its returns

SEC Form 17-Q Q1 2016 14 14
When the Group has less than a majority of the voting or similar rights of an investee, the Group
considers all relevant facts and circumstances in assessing whether it has power over an investee,
including:
The contractual arrangement with the other vote holders of the investee
Rights arising from other contractual arrangements
The Group’s voting rights and potential voting rights
The Group re-assesses whether or not it controls an investee if facts and circumstances indicate
that there are changes to one or more of the three elements of control.
Subsidiaries. Subsidiaries are entities controlled by the Parent Company. Subsidiaries are
consolidated from the date of acquisition or incorporation, being the date on which the Group
obtains control, and continue to be consolidated until the date such control ceases.
Non-controlling Interests. Non-controlling interests represent the portion of profit or loss and net
assets in PICT, MTS, AICTL, CTVCC, SBITC, SBITHI, BIPI, NICTI (until April 2015),
DIPSSCOR, YICT, SCIPSI, RCBV, AGCT, JASA, OJA, ITBV, HIPS, VICT (until
February 4, 2015), APPH, IGFBV, IDRC and LGICT, not held by the Group and are presented
separately in the consolidated statement of income, consolidated statement of comprehensive
income, and consolidated balance sheet separate from equity attributable to equity holders of the
parent.
An acquisition, transfer or sale of a non-controlling interest is accounted for as an equity
transaction. No gain or loss is recognized in an acquisition of a non-controlling interest. The
difference between the fair value of the consideration and book value of the share in the net assets
acquired is presented under “Excess of acquisition cost over the carrying value of non-controlling
interests” account within the equity section of the consolidated balance sheet. If the Group loses
control over a subsidiary, it: (i) derecognizes the assets (including goodwill) and liabilities of the
subsidiary, the carrying amount of any non-controlling interest and the cumulative translation
differences recorded in equity; (ii) recognizes the fair value of the consideration received, the fair
value of any investment retained and any surplus or deficit in the consolidated statement of
income; and (iii) reclassifies the Parent Company’s share of components previously recognized in
other comprehensive income to the consolidated statement of income or retained earnings, as
appropriate.
Transactions Eliminated on Consolidation. All intragroup transactions and balances including
income and expenses, and unrealized gains and losses are eliminated in full.
Accounting Policies of Subsidiaries. The financial statements of subsidiaries are prepared for the
same reporting period or year using uniform accounting policies as those of the Parent Company.
Functional and Presentation Currency. The unaudited consolidated financial statements are
presented in US dollar, which is ICTSI’s functional and presentation currency. Each entity in the
Group determines its own functional currency, which is the currency that best reflects the
economic substance of the underlying events and circumstances relevant to that entity, and items
included in the financial statements of each entity are measured using that functional currency.
When there is a change in those underlying transactions, events and conditions, the entity
reassesses its functional currency.
At the reporting date, the assets and liabilities of subsidiaries whose functional currency is not the
US dollar are translated into the presentation currency of ICTSI using the Bloomberg closing rate
at balance sheet date and, their unaudited statements of income are translated at the Bloomberg
weighted average daily exchange rates for the period. The exchange differences arising from the
translation are taken directly to the interim consolidated statement of comprehensive income.
Upon disposal of the foreign entity, the deferred cumulative translation amount recognized in the

SEC Form 17-Q Q1 2016 15 15
interim consolidated statement of comprehensive income relating to that particular foreign
operation is recognized in the interim consolidated statement of income.
The following rates of exchange have been adopted by the Group in translating foreign currency
income statement and balance sheet items as at and for the three months ended March 31:
2015 2016
Closing Average Closing Average
Foreign currency to 1 unit of US dollar:
Argentine peso (ARS) 8.82 8.69 14.70 14.48
Australian Dollar (AUD) 1.31 1.27 1.31 1.38
Brazilian Reais (BRL or R$) 3.20 2.87 3.59 3.90
Brunei Dollar (BND) 1.37 1.36 1.35 1.40
Chinese Renminbi (RMB) 6.20 6.24 6.45 6.54
Colombian Peso (COP) 2,599.62 2,474.26 3,002.20 3,251.70
Croatian Kuna (HRK) 7.12 6.82 6.61 6.90
Euro (EUR or €) 0.93 0.89 0.88 0.91
Georgian Lari (GEL) 2.24 2.09 2.30 2.43
Honduran Lempira (HNL) 21.92 21.66 22.64 22.56
Hong Kong Dollar (HKD) 7.75 7.76 7.76 7.77
Indian Rupee (INR) 62.5 62.26 66.25 67.49
Indonesian Rupiah (IDR) 13,074.00 12,810.00 13,239.00 13,520.00
Iraqi Dinar (IQD) 1,205.03 1,200.32 1,191.59 1,191.35
Japanese Yen (JPY) 120.13 119.17 112.57 115.23
Malagasy Ariary (MGA) 2,960.00 2,818.71 3,210.95 3,202.88
Mexican Peso (MXN) 15.26 14.95 17.28 18.03
Pakistani Rupee (PKR or Rs.) 101.93 101.41 104.71 104.74
Philippine peso (PHP or P=) 44.70 44.42 46.07 47.25
Polish zloty (PLN) 3.80 3.72 3.73 3.95
Singaporean dollar (SGD) 1.37 1.36 1.35 1.40
South African Rand (ZAR) 12.13 11.75 14.77 15.81
3.2 Changes in Accounting Policies
3.2.1 New and Amended Standards Adopted in 2016
The accounting policies adopted for the interim condensed consolidated financial statements are
consistent with those followed in the preparation of the Group’s annual consolidated financial
statements as of and for the year ended December 31, 2015 except that the Group has adopted the
following new and amended standards starting January 1, 2016:
New Pronouncements
Impact on the Interim
Condensed
Consolidated Financial
Statements
PFRS 10, Consolidated Financial Statements, and PAS 28, Investments in
Associates and Joint Ventures – Investment Entities: Applying the Consolidation
Exception (Amendments)
These amendments clarify that the exemption in PFRS 10 from presenting
consolidated financial statements applies to a parent entity that is a subsidiary of
an investment entity that measures all of its subsidiaries at fair value and that only
a subsidiary of an investment entity that is not an investment entity itself and that
provides support services to the investment entity parent is consolidated. The
amendments also allow an investor (that is not an investment entity and has an
investment entity associate or joint venture), when applying the equity method, to
retain the fair value measurement applied by the investment entity associate or
joint venture to its interests in subsidiaries.
These amendments are not
applicable to the Group since
none of the entities within the
Group is an investment entity
nor does the Group have
investment entity associates or
joint venture.
PAS 27, Separate Financial Statements - Equity Method in Separate Financial
Statements (Amendments)
The amendments will allow entities to use the equity method to account for
investments in subsidiaries, joint ventures and associates in their separate
financial statements. Entities already applying PFRS and electing to change to the
equity method in its separate financial statements will have to apply that change
The adoption of these
amendments has no impact on
the interim condensed
consolidated financial
statements as these
amendments apply to separate
financial statements. The

SEC Form 17-Q Q1 2016 16 16
New Pronouncements
Impact on the Interim
Condensed
Consolidated Financial
Statements
retrospectively. Group will not elect to change
the method of accounting
from cost to equity in the
respective separate financial
statements of the parent
company and its subsidiaries
that are issuing separate
financial statements.
PFRS 11, Joint Arrangements - Accounting for Acquisitions of Interests
(Amendments)
The amendments to PFRS 11 require a joint operator that is accounting for the
acquisition of an interest in a joint operation, in which the activity of the joint
operation constitutes a business (as defined by PFRS 3), to apply the relevant
PFRS 3 principles for business combinations accounting. The amendments also
clarify that a previously held interest in a joint operation is not remeasured on the
acquisition of an additional interest in the same joint operation while joint control
is retained. In addition, a scope exclusion has been added to PFRS 11 to specify
that the amendments do not apply when the parties sharing joint control, including
the reporting entity, are under common control of the same ultimate controlling
party. The amendments apply to both the acquisition of the initial interest in a
joint operation and the acquisition of any additional interests in the same joint
operation.
The adoption of these
amendments has no impact on
the interim condensed
consolidated financial
statements as the Group does
not have interest in joint
arrangements that is
accounted for under PFRS11.
PAS 1, Presentation of Financial Statements – Disclosure Initiative
(Amendments)
The amendments are intended to assist entities in applying judgment when
meeting the presentation and disclosure requirements in PFRS. They clarify the
following:
That entities shall not reduce the understandability of their financial
statements by either obscuring material information with immaterial
information; or aggregating material items that have different natures or
functions
That specific line items in the statement of income and other comprehensive
income and the statement of financial position may be disaggregated
That entities have flexibility as to the order in which they present the notes
to financial statements
That the share of other comprehensive income of associates and joint
ventures accounted for using the equity method must be presented in
aggregate as a single line item, and classified between those items that will
or will not be subsequently reclassified to profit or loss.
Early application is permitted and entities do not need to disclose that fact as the
amendments are considered to be clarifications that do not affect an entity’s
accounting policies or accounting estimates.
The adoption of these
amendments has no
significant impact on the
interim condensed
consolidated financial
statements.
PFRS 14, Regulatory Deferral Accounts
PFRS 14 is an optional standard that allows an entity, whose activities are subject
to rate regulation, to continue applying most of its existing accounting policies for
regulatory deferral account balances upon its first-time adoption of PFRS. Entities
that adopt PFRS 14 must present the regulatory deferral accounts as separate line
items on the statement of financial position and present movements in these
account balances as separate line items in the statement of income and other
comprehensive income. The standard requires disclosures on the nature of, and
risks associated with, the entity’s rate regulation and the effects of that rate-
regulation on its financial statements.
Since the Group is an existing
PFRS preparer, this standard
is not applicable.
PAS 16, Property, Plant and Equipment, and PAS 41, Agriculture - Bearer Plants
The amendments change the accounting requirements for biological assets that
The adoption of these
amendments has no impact on

SEC Form 17-Q Q1 2016 17 17
New Pronouncements
Impact on the Interim
Condensed
Consolidated Financial
Statements
meet the definition of bearer plants. Under the amendments, biological assets that
meet the definition of bearer plants will no longer be within the scope of PAS 41.
Instead, PAS 16 will apply. After initial recognition, bearer plants will be
measured under PAS 16 at accumulated cost (before maturity) and using either the
cost model or revaluation model (after maturity). The amendments also require
that produce that grows on bearer plants will remain in the scope of PAS 41
measured at fair value less costs to sell. For government grants related to bearer
plants, PAS 20, Accounting for Government Grants and Disclosure of
Government Assistance will apply.
the interim condensed
consolidated financial
statements since the Group
does not have any bearer
plants.
PAS 16, Property, Plant and Equipment, and PAS 38, Intangible Assets -
Clarification of Acceptable Methods of Depreciation and Amortization
(Amendments)
The amendments clarify the principle in PAS 16 and PAS 38 that revenue reflects
a pattern of economic benefits that are generated from operating a business (of
which the asset is part) rather than the economic benefits that are consumed
through use of the asset. As a result, a revenue-based method cannot be used to
depreciate property, plant and equipment and may only be used in very limited
circumstances to amortize intangible assets.
The adoption of these
amendments has no impact on
the interim condensed
consolidated financial
statements given that the
Group has not used a
revenue-based method to
depreciate its noncurrent
assets.
3.2.2 Annual Improvements to PFRSs (2012-2014 Cycle)
The Annual Improvements to PFRSs (2012-2014 cycle) are effective for annual periods beginning
on or after January 1, 2016 and are not expected to have a material impact on the Group. They
include:
PFRS 5, Non-current Assets Held for Sale and Discontinued Operations – Changes in
Methods of Disposal
The amendment is applied prospectively and clarifies that changing from a disposal through
sale to a disposal through distribution to owners and vice-versa should not be considered to be
a new plan of disposal, rather it is a continuation of the original plan. There is, therefore, no
interruption of the application of the requirements in PFRS 5. The amendment also clarifies
that changing the disposal method does not change the date of classification.
PFRS 7, Financial Instruments: Disclosures – Servicing Contracts
PFRS 7 requires an entity to provide disclosures for any continuing involvement in a
transferred asset that is derecognized in its entirety. The amendment clarifies that a servicing
contract that includes a fee can constitute continuing involvement in a financial asset. An
entity must assess the nature of the fee and arrangement against the guidance for continuing
involvement in PFRS 7 in order to assess whether the disclosures are required. The
amendment is to be applied such that the assessment of which servicing contracts constitute
continuing involvement will need to be done retrospectively. However, comparative
disclosures are not required to be provided for any period beginning before the annual period
in which the entity first applies the amendments.
PFRS 7- Applicability of the Amendments to PFRS 7 to Condensed Interim Financial
Statements
This amendment is applied retrospectively and clarifies that the disclosures on offsetting of
financial assets and financial liabilities are not required in the condensed interim financial
report unless they provide a significant update to the information reported in the most recent
annual report.
SEC Form 17-Q Q1 2016 18 18
PAS 19, Employee Benefits – regional market issue regarding discount rate
This amendment is applied prospectively and clarifies that market depth of high quality
corporate bonds is assessed based on the currency in which the obligation is denominated,
rather than the country where the obligation is located. When there is no deep market for high
quality corporate bonds in that currency, government bond rates must be used.
PAS 34, Interim Financial Reporting – disclosure of information ‘elsewhere in the interim
financial report’
The amendment is applied retrospectively and clarifies that the required interim disclosures
must either be in the interim financial statements or incorporated by cross-reference between
the interim financial statements and wherever they are included within the greater interim
financial report (e.g., in the management commentary or risk report).
The Group has not early adopted any standard, interpretation or amendment that has been issued but is
not yet effective.
4. Segment Information
A segment is a distinguishable component of the Group that is engaged either in providing types
of services (business segment) or in providing the services within a particular economic
environment (geographic segment).
The Group operates principally in one industry segment, which is cargo handling and related
services. ICTSI has organized its business into three geographical segments:
Asia - includes MICT, BIPI, DIPSSCOR, SCIPSI, SBITC, ICTSI Subic, HIPS, MICTSI and
LGICT in the Philippines; YICT in China, OJA, JASA and MTS in Indonesia; NICTI in
Japan (until April 27, 2015); NMCTS in Brunei; ICTSI India in India; PICT in Pakistan;
VICT in Australia; AICTSL, ICTHI, ICTSI Ltd. and other holding companies and those
companies incorporated in The Netherlands for the purpose of supporting the funding
requirements of the Group;
EMEA - includes BCT in Poland, BICTL in Georgia, AGCT in Croatia, MICTSL in
Madagascar, LICTSLE in Nigeria, IDRC in Congo, and ICTSI Iraq in Iraq; and
Americas - includes TSSA in Brazil, CGSA in Ecuador, SPIA in Colombia, Tecplata in
Argentina, CMSA and TMT in Mexico, ICTSI Oregon, Inc. in Oregon, U.S.A and OPC in
Honduras.
Management monitors the operating results of its operating unit separately for making decisions
about resource allocation and performance assessment. The Group evaluates segment
performance based on contributions to gross revenues, which is measured consistently with gross
revenues from port operations in the interim consolidated statement of income.
Financing is managed on a group basis and centralized at the Parent Company level or at the
entities created solely for the purpose of obtaining funds for the Group. Funding requirements
that are secured through debt are recognized as liabilities of the Parent Company or of the entity
issuing the debt instrument, classified under the geographical region of Asia and are not allocated
to other geographical segments where funds are eventually transferred and used.

SEC Form 17-Q Q1 2016 19 19
The table below presents financial information on geographical segments as of December 31,
2015 (audited) and as of March 31, 2016 (unaudited) and for the three months ended ended
March 31, 2015 and 2016 (unaudited):
2015 2016 (Unaudited)
Asia EMEA Americas Consolidated Asia EMEA Americas Consolidated
Volume(a)
1,004,915 245,887 731,971 1,982,773 1,062,720 258,382 732,537 2,053,639
(In thousands)
Gross revenues
US$161,458
US$26,918
US$107,686
US$296,062
US$139,015
US$32,673
US$94,781
US$266,469
Capital expenditures(b)
15,348 27,040 21,858 64,246 62,691 18,462 17,073 98,226
Other information:
Segment assets(c)
2,029,186 332,851 1,392,389 3,754,426 2,123,363 363,459 1,438,700 3,925,522
Segment liabilities(d)
1,549,562 76,150 290,174 1,915,886 1,716,401 88,702 344,780 2,149,883
(a) Measured in TEUs.
(b) Capital expenditures include amount disbursed for the acquisition of port facilities and equipment classified as intangibles under IFRIC 12 and property
and equipment as shown in the interim consolidated cash flows.
(c) Segment assets do not include deferred tax assets amounting to US$87.0 million and US$84.7 million as of December 31, 2015 (audited) and March 31,
2016 (unaudited), respectively.
(d) Segment liabilities do not include income tax payable amounting to US$22.0 million and US$34.3 million and deferred tax liabilities amounting to
US$77.5 million and US$75.1 million as of December 31, 2015 (audited) and March 31, 2016 (unaudited), respectively.
Moreover, management monitors the Group’s earnings before interest, taxes, depreciation and
amortization (EBITDA) on a consolidated basis for decision-making purposes. The following
table shows the computation of EBITDA as derived from the unaudited consolidated net income
attributable to equity holders of the parent for the three months ended March 31:
2015
(Unaudited) 2016
(Unaudited)
Net income attributable to equity
holders of the parent US$54,001 US$42,176
Non-controlling interests 2,801 2,878
Provision for income tax 15,630 16,431
Income before income tax 72,432 61,485
Add (deduct):
Depreciation and amortization 30,970 36,352
Interest and other expenses(a)
28,374 33,396
Interest and other income(b)
(4,243) (9,296)
EBITDA(c)
US$127,533 US$121,937
(a) Interest and other expenses include the following as shown in the unaudited interim consolidated statement of
income: foreign exchange loss; interest on concession rights payable; interest expense and financing charges
on borrowings; equity in net loss of a joint venture; and other expenses. (b)
Interest and other income include the following as shown in the unaudited interim consolidated statement of
income: gain on sale of a subsidiary; foreign exchange gain; interest income; and other income. (c)
EBITDA is not a uniform or legally defined financial measure. EBITDA is presented because the Group
believes it is an important measure of its performance and liquidity. EBITDA is also frequently used by
securities analysts, investors and other interested parties in the evaluation of companies in the industry.
The Group EBITDA figures are not; however, readily comparable with other companies’ EBITDA figures as
they are calculated differently thus, must be read in conjunction with related additional explanations. EBITDA
has limitations as an analytical tool and should not be considered in isolation or as a substitute for analysis of
the Group’s results as reported under PFRS. Some of the limitations concerning EBITDA are:
EBITDA does not reflect cash expenditures or future requirements for capital expenditures or contractual
commitments;
EBITDA does not reflect changes in, or cash requirements for working capital needs;
EBITDA does not reflect the interest expense, or cash requirements necessary to service interest or principal
debt payments;
Although depreciation and amortization are non-cash charges, the assets being depreciated or amortized will
often have to be replaced in the future, and EBITDA does not reflect any cash requirements for such
replacements; and
Other companies in the industry may calculate EBITDA differently, which may limit its usefulness as a
comparative measure.
Because of these limitations, EBITDA should not be considered as a measure of discretionary cash available to
the Group to invest in the growth of the business. The Group compensates for these limitations by relying
primarily on PFRS results and uses EBITDA only as supplementary information.

SEC Form 17-Q Q1 2016 20 20
All segment revenues are from external customers. Gross revenues from port operations of ICTSI
and other Philippine-based subsidiaries comprised 43.9 percent and 39.7 percent of the unaudited
interim consolidated gross revenues from port operations for the three months ended March 31,
2015 and 2016, respectively. Gross revenues from port operations outside the Republic of the
Philippines comprised 56.1 percent and 60.3 percent of the unaudited interim consolidated gross
revenues from port operations for the three months ended March 31, 2015 and 2016, respectively.
5. Concession Rights and Concession Rights Payable
5.1 Concession Rights
Concession rights are presented as part of intangibles in the interim consolidated balance sheet.
Concession rights include upfront fee payments recognized on the concession contracts, cost of
port infrastructure constructed and port equipment purchased, and present value of future fixed
fee considerations in exchange for the license or right to operate ports. Concession rights are
amortized over the term of the concession agreements.
In 2015, additions to concession rights under port infrastructure mainly pertain to construction of
various civil works in ICTSI Iraq.
Borrowing costs capitalized amounted to US$6.5 million as at March 31, 2015 with capitalization
rate of 6.58 percent and US$0.6 million as at March 31, 2016 with capitalization rate of
6.80 percent (see Note 12.5).
5.2 Concession Rights Payable
Upon recognition of the fair value of fixed fee on concession contracts, the Group also recognized
the corresponding concession rights payable. Maturities of concession rights payable arising from
the capitalization of fixed portion of port fees as at March 31, 2016 are as follows (amount in
thousands):
Amount
2016(1)
US$5,747
2017 13,396
2018 15,257
2019 16,572
2020 onwards 459,904
Total US$510,876 (1) April 1, 2016 through December 31, 2016.
Total fixed portion of port fees paid by the Group for the three months ended March 31, 2015 and
2016 amounted to US$11.7 million and US$11.8 million, respectively. These port fees are
allocated to payments of interest and reduction to or payments of concession rights payable.
Interest expense on concession rights payable amounted to US$9.3 million and US$9.1 million
for the three months ended March 31, 2015 and 2016, respectively. The annualized weighted
average interest rate was 7.13 percent for the three months ended March 31, 2015 and 2016,
respectively.
Reduction to concession rights payable, shown as payments to concession rights in the unaudited
interim consolidated statement of cash flows for the three months ended March 31, 2015 and 2016
amounted to US$2.4 million and US$2.7 million, respectively.

SEC Form 17-Q Q1 2016 21 21
6. Property and Equipment
Property and equipment increased due to construction of various civil works and acquisitions of
terminal equipment in various ports, mainly in VICT, IDRC and CMSA. There were no major
disposals or write-downs of property and equipment for the three months ended March 31, 2016.
Borrowing costs capitalized amounted to US$0.8 million as at March 31, 2015 with capitalization
rate of 6.58 percent and US$3.8 million as at March 31, 2016 with capitalization rate of
6.80 percent (see Note 12.5). Borrowing costs capitalized in 2016 mainly pertains to VICT and
IDRC which started construction in November 2014 and January 2015, respectively.
7. Investments in and Advances to a Joint Venture and an Associate
This account mainly pertains to ICTSI’s investment in and advances to SPIA. This account
increased in 2016 mainly due to additional interest-bearing loans extended to SPIA
(see Note 16.1). The loans were used by SPIA to finance its ongoing construction of the terminal
in Colombia.
8. Other Noncurrent Assets
This account includes noncurrent portion of input tax, advances to suppliers and contractors,
restricted cash, advanced rent and deposits, AFS investments, pension assets and others. This
account increased in 2016 mainly because of increase in deposits and advances to suppliers and
contractors associated with the ongoing purchase and construction of terminal facilities and
equipment in various ports.
9. Cash and Cash Equivalents
For the purpose of unaudited interim consolidated statements of cash flows, balances of cash and
cash equivalents as of March 31 were as follows:
2015
(Unaudited) 2016
(Unaudited)
Cash on hand and in banks US$112,916 US$219,852
Cash equivalents 136,276 91,328
US$249,192 US$311,180
Cash in banks earns interest at the prevailing bank deposit rates. Cash equivalents are short-term
investments, which are made for varying periods of up to three months depending on the
immediate cash requirements of the Group and earn interest at the prevailing short-term
investment rates.

SEC Form 17-Q Q1 2016 22 22
10. Receivables
This account consists of:
December 31,
2015
(Audited)
March 31,
2016
(Unaudited)
Trade US$81,757 US$82,170
Advances and nontrade 10,992 14,511
92,749 96,681
Less allowance for doubtful accounts 5,549 6,271
US$87,200 US$90,410
Trade receivables are noninterest-bearing and are generally on 30-60 days’ credit terms.
Advances and nontrade receivables mainly include noninterest-bearing advances to suppliers and
vendors that may be applied against payable or collectible within 12 months.
11. Prepaid Expenses and Other Current Assets
This account includes input tax, tax credit certificates, creditable withholding taxes, and prepaid
port fees, insurance, bonds and other expenses.
12. Long-term Debt and Loans Payable
12.1 Maturities of Long-term Debt
Maturities of long-term debt, net of unamortized debt issue costs of US$56.3 million, as at
March 31, 2016 are as follows (amount in thousands):
Amount
2016(1)
US$54,378
2017 13,124
2018 6,488
2019 6,900
2020 and onwards 1,020,025
Total US$1,100,915 (1) April 1, 2016 through December 31, 2016.
12.2 US Dollar-denominated Notes
In January 2015, a total of US$117.5 million 5.875 percent Senior Unsecured Notes due 2025
from the MTN Programme were issued at a price of 102.625 and US$102.6 million of which was
used to exchange with holders of US$91.8 million 7.375 percent Senior Notes due 2020. The
2025 Notes were issued by ITBV under its US$1.0 billion MTN programme, and are
unconditionally and irrevocably guaranteed by ICTSI. These new Notes were consolidated and
formed a single series with the US$282.5 million 5.875 percent guaranteed Notes due 2025 issued
on September 17, 2013 and April 30, 2014.
12.3 US Dollar-denominated Loans
In February 2016, CGSA obtained short-term unsecured US$ loans with a total of US$3.5 million
from Banco Guayaquil S.A., Citibank and Banco Bolivariano at annual fixed interest rates
ranging from 8.89% to 9.12%.

SEC Form 17-Q Q1 2016 23 23
In January and February 2016, CGSA obtained two-year fixed-term US$ loans with a total of
US$0.6 million from Banco del Pacifico at an interest rate of 8.75% per annum.
On March 29, 2016, CGSA (as “Borrower”), Metropolitan Bank and Trust Company (as
“Lender”) and ICTSI (as “Surety”) signed a loan agreement which consists of two tranches of
loans amounting to US$32.5 million (Tranche I) and US$7.5 million (Tranche II) with floating
interest rates. Tranche I has a final maturity in March 2021 while Tranche II in May 2017. On
March 30, 2016, CGSA availed of loans amounting to US$15.5 million under Tranche I and
US$7.5 million under Tranche II. Portion of the proceeds of these loans was used to refinance the
unsecured US$ term-loan of CGSA amounting to US$9.0 million on April 5, 2016. On April 20,
2016, CGSA availed of additional loan amounting to US$4.0 million under Tranche I.
12.4 Perpetual Capital Securities
On March 10, 2016, the remaining US$108.3 million of the US$350-million Subordinated
Guaranteed Perpetual Capital Securities was called in for redemption on May 5, 2016 (see Note
15.5). Upon notification of redemption, the redemption price of the securities of US$108.3
million was reclassified to and accrued distributions of US$4.5 million were recognized as
financial liabilities. As at March 31, 2016, these financial liabilities were presented as “Perpetual
Capital Securities” under current liabilities in the interim consolidated balance sheet. Initially, the
securities were recognized as equity.
12.5 Loan Covenants and Capitalized Borrowing Costs
The loans from local and foreign banks impose certain restrictions with respect to corporate
reorganization, disposition of all or a substantial portion of ICTSI’s and subsidiaries’ assets,
acquisitions of futures or stocks, and extending loans to others, except in the ordinary course of
business. ICTSI is also required to maintain specified financial ratios relating to their debt to
equity and cash flow and earnings level relative to current debt service obligations. As of
March 31, 2016, ICTSI and subsidiaries are in compliance with their loan covenants.
Interest expense, net of amount capitalized as intangible assets and property and equipment
(see Notes 5 and 6), amounted to US$14.2 million and US$18.3 million for the three months
ended March 31, 2015 and 2016, respectively. Interest expense includes amortization of debt
issue costs amounting to US$0.9 million and US$1.3 million for the three months ended
March 31, 2015 and 2016, respectively.
There was no material change in the covenants related to the Group’s long-term debts. As at
March 31, 2016, the Group has complied with its loan covenants.
There were no other significant transactions pertaining to the Group’s long-term debt as of
March 31, 2016, except as discussed above.
13. Other Noncurrent Liabilities
This account consists of:
December 31,
2015 March 31,
2016
Accrued rental (Note 14) US$92,856 US$22,463
Government grant 17,636 17,020
Pension liabilities 6,509 6,699
Finance lease payable 906 638
Others 1,447 1,177
US$119,354 US$47,997

SEC Form 17-Q Q1 2016 24 24
Accrued Rental
The accrued rental of VICT amounted to US$92.9 million (AUD 127.4 million) as at
December 31, 2015 and US$22.5 million (AUD 29.3 million) as at March 31, 2016, calculated
using the straight-line method from the inception of the contract in June 2014. In accordance with
VICT’s contract, VICT is required to start paying the lease upon start of the commercial
operations in year 2017. As at March 31, 2016, accrued rental to be settled for the next 12 months
amounting to US$90.3 million (AUD 117.9 million) was reclassified to other current liabilities
under “Accounts payable and other current liabilities” (see Note 14).
Government Grant
On March 29, 2012, BCT and Centrum Unijnych Projektow Transportowych (CUPT), a Polish
grant authority, signed a grant agreement (the “EU Grant”) whereby CUPT would grant BCT a
subsidy amounting to US$17.3 million (53.9 million Polish zloty). The confirmation of the
availability of the EU Grant is a condition precedent to any borrowing under the facility
agreement of BCT. In July 2014, BCT finalized capital expenditure projects supported by the
European Union grants with an estimated total of US$20.0 million. In 2016, BCT did not avail of
any additional grant. As at March 31, 2016, BCT has availed a total of US$18.9 million of the
grant. The grant is treated as deferred income and is amortized over the duration of the existing
concession agreement ending on May 31, 2023. The unamortized deferred income from
government grant amounted to US$17.6 million and US$17.0 million as at December 31, 2015
and March 31, 2016, respectively. Amortization of deferred income included under “Other
income” account of the unaudited interim consolidated statement of income amounted to US$0.1
million and US$0.6 million for the three months ended March 31, 2015 and 2016, respectively.
14. Accounts Payable and Other Current Liabilities
This account includes trade payables, output and other taxes payables, accruals for interest,
salaries and benefits and others, customers’ deposits and other current liabilities. This account
increased in 2016 mainly due to the reclassification of accrued lease expense at VICTL (see Note
13), tapered by payments of accrued interest and other trade payables.
15. Equity
15.1 Stock Incentive Plan
On March 7, 2016, the BOD approved for the extension of the existing Stock Incentive Plan (SIP)
for a further 10 years until March 2027 and the amendment of vesting period of the SIP. The
vesting period of the SIP was amended from two years where 50% is to vest on the first
anniversary date of the award and the other 50% to vest on the second anniversary date of the
award, to three years where 25% is to vest on the first anniversary date of the award, 25% to vest
on the second anniversary date of the award, and 50% to vest on the third anniversary date of the
award.
On March 14, 2016, the Stock Incentive Committee granted 2,567,763 shares of stock awards to
officers and employees of ICTSI and ICTSI Ltd., 25% of which will vest on March 14, 2017,
another 25% will vest on March 14, 2018 and the remaining 50% will vest on March 14, 2019.
The fair value of the shares was US$1.39 (P=65.00) at the date of grant. The fair value per share
was determined based on the market price of stock at the date of grant.
Total number of shares granted under the SIP aggregated 38,601,138 shares as at March 31, 2016.
Also, on March 21, 2016, 1,469,874 shares vested under the SIP.

SEC Form 17-Q Q1 2016 25 25
Total compensation expense recognized on the vesting of the fair value of stock awards amounted
to US$0.8 million and US$0.7 million for the three months ended March 31, 2015 and 2016,
respectively.
15.2 Dividends Declared but not yet Paid
On April 21, 2016, the Board of Directors (the Board) of ICTSI declared a US$0.020 (P=0.91) cash
dividend per share to stockholders of record dated May 5, 2016 to be paid on May 18, 2016.
15.3 Cost of Shares Held by Subsidiares
As at December 31, 2015 and March 31, 2016, ICTHI held 3,800,000 of ICTSI’s preferred A
shares while IWI held 734,970 common shares of ICTSI.
15.4 Other Comprehensive Income (Loss)
This account consists of:
Cumulative
Translation
Adjustments
Revaluation
Increment
Unrealized
Mark-to-
Market
Gain on
Available-for-
Sale
Investments
Actuarial Gains
on Defined
Benefit Plans
Total
Comprehensive
(Losses)
Balance at January 1, 2015 (US$174,717) US$610 US$1,054 (US$380) (US$173,433)
Translation differences arising from translation of foreign
operations’ financial
statements (37,320) – – – (37,320)
Net change in unrealized mark-to-
market values of derivatives 1,558 – – – 1,558
Net change in unrealized mark-to-
market values of AFS
investments – – 4 – 4 Income tax relating to components
of other comprehensive
income 179 – – – 179
Balance at March 31, 2015 (US$210,300) US$610 US$1,058 (US$380) (US$209,012)
Balance at January 1, 2016 (US$261,353) US$610 US$1,126 US$981 (US$258,636)
Translation differences arising from
translation of foreign
operations’ financial
statements 19,133 – – – 19,133
Net change in unrealized mark-to-
market values of derivatives (108) – – – (108) Net change in unrealized mark-to-
market values of AFS
investments – – (456) – (456)
Net change in actuarial gains – – – 4 4
Income tax relating to components
of other comprehensive
income 6 – – – 6
Balance at March 31, 2016 (US$242,322) US$610 US$670 US$985 (US$240,057)
15.5 Perpetual Capital Securities
On January 29, 2015, RCBV issued US$300.0 million 6.25 percent Senior Guaranteed Perpetual
Capital Securities unconditionally and irrevocably guaranteed by ICTSI at a price of
99.551 percent or US$298.7 million. The new issue was partly used to finance the tendered
US$230.0 million 8.375 percent Subordinated Guaranteed Perpetual Capital Securities (“Original
Securities) at a tender price of 107.625 or US$247.5 million. The cash proceeds received by
RCBV amounted to US$51.1 million. A reduction of US$23.2 million, representing the exchange
premium and unamortized debt issue cost of the Original Securities, was recognized directly in
the retained earnings as a result of the transaction. The transaction did not have an impact in the
2015 consolidated statement of income of the Company and was treated as an equity transaction

SEC Form 17-Q Q1 2016 26 26
since the perpetual capital securities are treated as part of equity in the consolidated balance
sheets.
RCBV paid distributions totaling US$4.5 million to the holders of the Securities on January 29,
2015. The related interest expense accrued by the Issuer or RCBV amounting to US$7.2 million
and US$14.0 million for the three months ended March 31, 2015 and 2016, respectively, was not
recognized in the unaudited interim consolidated statement of income since the Securities are
presented as equity attributable to equity holders of the parent.
On March 10, 2016, RCBV (the “Issuer”) and ICTSI (the “Guarantor”) sent a notice to The Hong
Kong and Shanghai Banking Corporation Limited (HSBC, as “Trustee” and “Agent”) for the
redemption of the remaining US$108.3 million of the US$350-million Subordinated Guaranteed
Perpetual Capital Securities (“Original Securities” and “Further Securities” collectively referred
to as “Securities”) and payment of accrued distributions on May 5, 2016. The proceeds from the
issuance of Securities were initially recognized as part of equity in the consolidated balance sheet.
Upon notification of redemption, the redemption price of Securities of US$108.3 million was
reclassified to and accrued distributions of US$4.5 million were recognized as financial liabilities.
As at March 31, 2016, these financial liabilities were presented as “Perpetual Capital Securities”
under current liabilities in the interim consolidated balance sheet. The difference amounting to
US$7.6 million between the total amount recognized as financial liabilities of US$112.8 and the
carrying amount of the Securities of US$105.2 million recorded under equity was treated as a
direct reduction in retained earnings.
15.6 Non-controlling Interests
On February 4, 2015, IFEL acquired the 10% non-controlling interest from Anglo Ports and
became 100% owner of VICT for US$5.8 million. This resulted in the reduction of
non-controlling interests account and the difference between the purchase price and carrying
value of the non-controlling interest of US$6.2 million was recognized under “Excess of
acquisition cost over the carrying value of non-controlling interests” account in the 2015
consolidated balance sheet.
On March 2, 2015, LGICT started operating the first one-stop ICT located in Barangays Banlic
and San Cristobal, Calamba City, Laguna. LGICT is 60%-owned by IW Cargo and the
remaining 40% is owned by Nippon Container Terminals Co. Ltd., Transnational Diversified
Corporation and NYK- Fil-Japan Shipping Corp. The non-controlling shareholders contributed
US$1.2 million to LGICT.
In March 2015, PICT declared dividends amounting to US$0.03 per share (PKR3.5 per share).
Dividends distributed to non-controlling shareholders amounted to US$1.3 million
(PKR135.5 million).
In March 2016, BIPI declared dividends amounting to US$2.1 million (P=100.0 million).
Dividends distributed to non-controlling shareholders totaled US$0.8 million (P=40.0 million).
In March 2015 and 2016, SCIPSI declared dividends amounting to US$97.53 per share
(P=4,359.58 per share) and US$68.13 per share (P=3,130.90 per share), respectively. Dividends
distributed to non-controlling shareholders in 2015 and 2016 totaled US$0.6 million
(P=24.9 million) and US$0.4 million (P=17.9 million), respectively.

SEC Form 17-Q Q1 2016 27 27
16. Related Party Transactions
16.1 Transactions with the Shareholders and Affiliates
2015 2016
Related Party Relationship Nature of Transaction
Transaction
Amount for
Three Months
Ended
March 31
Outstanding
Receivable
(Payable)
Balance as of
December 31
Transaction
Amount for
the Three
Months
Ended
March 31
Outstanding
Receivable
(Payable)
Balance as of
March 31
(In Millions)
ICBV
SPIA Joint venture Interest-bearing loans and interests (see
Note 7) US$15.7 US$209.9 US$20.23 US$230.13
Parent Company
YICT
Yantai Port Group Common shareholder Port fees(i) – (0.29) – –
Trade transaction(ii) 0.04 (0.32) 0.07 (0.04)
Yantai Port
Holdings
Non-controlling
shareholder
Port fees 1.10 – 0.87 (0.35)
Trade transaction(ii) 0.35 (0.01) 0.43 (0.02)
Management fees(iii) 0.06 – 0.06 –
DP World Non-controlling
shareholder
Management fees(iii)
0.05 – 0.04 (0.23)
SCIPSI
Asian Terminals,
Inc.
Non-controlling
shareholder
Management fees 0.04 (0.02) 0.04 –
AGCT
Luka Rijeka Non-controlling
shareholder
Provision of services(iv) 0.07 (0.03) 0.09 –
PICT
Premier
Mercantile
Services
(Private)
Limited Common Shareholder Stevedoring and storage charges(v) 0.92 (0.52) 1.30 (0.49)
Marine Services
(Private)
Limited,
Portlink
International
(Private)
Limited, and
AMI Pakistan
(Private)
Limited Common shareholder Container handling revenue(vi) 0.16 0.04 0.17 0.03
Premier Software
(Private)
Limited Common shareholder Software maintenance charges – – – (0.01)
LGICT
NCT
Transnational
Corp.
Non-controlling
shareholder Management fees(vii) – (0.16) 0.11 (0.11)
Maintenance and repairs – (0.04) – –
(i) YICT is authorized under the Joint Venture Agreement to collect port charges levied on cargoes; port construction fees and facility security fee in
accordance with government regulations. Port fees remitted by YICT for YPH are presented as part of “Port authorities’ share in gross revenues”
in the consolidated statement of income. Outstanding payable to YPH related to these port charges presented under “Accounts payable and other
current liabilities” account in the consolidated balance sheets.
(ii) Trade transactions include utilities, rental and other transactions paid by YICT to YPG and YPH.
(iii) The BOD of YICT approved a management fee of RMB6.8 million in 2015 allocated among the shareholders namely: ICTSI, DP World and YPG.
(iv) AGCT has entered into agreements with Luka Rijeka, a non-controlling shareholder, for the latter’s provision of services such as equipment
maintenance, power and fuel and supply of manpower, among others. Total expenses incurred by AGCT in relation to these agreements were
recognized and presented in the consolidated income statement as part of Manpower costs, Equipment and facilities - related expenses and
Administrative and other operating expenses.
(v) PICT has entered into an agreement with Premier Mercantile Services (Private) Limited for the latter to render stevedoring and other services,
which are settled on a monthly basis.
(vi) Marine Services, Portlink and AMI are customers of PICT.
(vii) PICT has entered into an agreement with Premier Mercantile Services (Private) Limited for the latter to render stevedoring and other services,which
are settled on a monthly basis.
The outstanding balances arising from these related party transactions are current and payable
without the need for demand.

SEC Form 17-Q Q1 2016 28 28
16.2 Compensation of Key Management Personnel
Compensation of key management personnel consists of the following for the three months ended
March 31 (amount in thousands):
2015 2016
Short-term employee benefits US$288 US$298
Post-employment benefits 53 8
Share-based payments 2,866 1,419
Total compensation to key management personnel US$3,207 US$1,725
17. Earnings Per Share Computation
The table below shows the computation of basic and diluted earnings per share for the three
months ended March 31 (amounts are in thousands, except number of shares and per share data):
2015
(Unaudited) 2016
(Unaudited)
Net income attributable to equity holders of the parent, as
presented in the unaudited statement of income US$54,001 US$42,176
Adjustment for the effect of cumulative distribution on
perpetual capital securities (see Note 15.5) (7,241) (14,025)
Net income attributable to equity holders of the parent, as
adjusted (a) US$46,760 US$28,151
Common shares outstanding at beginning of year 2,045,177,671 2,045,177,671
Weighted treasury shares (7,514,686) (11,160,416)
Weighted shares held by a subsidiary (323,198) (734,970)
Weighted average shares outstanding (b) 2,037,339,787 2,033,282,285
Effect of dilutive stock awards 6,981,311 7,579,437
Weighted average shares outstanding adjusted for potential
common shares (c) 2,044,321,098 2,040,861,722
Basic earnings per share (a/b) US$0.023 US$0.014
Diluted earnings per share (a/c) US$0.023 US$0.014
18. Contingencies
Due to the nature of the Group’s business, it is involved in various legal proceedings, both as
plaintiff and defendant, from time to time. Management and its legal counsels believe that the
Group has substantial legal and factual bases for its position and is of the opinion that losses
arising from the existing legal actions and proceedings, if any, will not have a material adverse
impact on the Group’s unaudited interim condensed consolidated financial position and results of
operations.
19. Trends, Events or Uncertanties Affecting Recurring Revenues and Profit
The Group is exposed to a number of trends, events and uncertainties which can affect its
recurring revenues and profits. These include levels of general economic activity and
containerized trade volume in countries where it operates, as well as certain cost items, such as
labor, fuel and power. In addition, the Group operates in a number of jurisdictions other than the
Philippines and collects revenues in various currencies. Continued appreciation of the US dollar
relative to other major currencies, particularly the Philippine peso, Brazilian Reals, Mexican peso
and the Euro, may have a negative impact on the Group’s reported levels of revenues and profits.

SEC Form 17-Q Q1 2016 29 29
20. Subsequent Events and Other Matters
AGCT
On April 6, 2015, AGCT signed a Croatian Kuna indexed to Euro term loan amounting to
EUR0.95 million with final maturity on October 31, 2017 at an interest rate of 3.9% per annum.
The loan was fully availed in April 2016.
IGFBV
On April 28, 2016, IGFBV availed of US$150.0 million from the US$350.0 million five year
revolving credit facility bearing interest of 2.3877% per annum.
DIPSSCOR
On April 21, 2006, the PPA granted DIPSSCOR a ten-year contract for cargo handling services at
Sasa Wharf, Port of Davao in the Philippines that expired on April 20, 2016. The tender process
for the Davao Sasa Port Modernization project has started and ICTSI is one of the short-listed
bidders.
On April 15 2016, the local office of the Philippine Ports Authority in Davao City granted
DIPSSCOR a hold-over authority for a period of six months until October 20, 2016 over the cargo
handling services at Sasa Wharf, Port of Davao.

SEC Form 17-Q Q1 2016 30 30
Item 2. Management’s Discussion and Analysis or Plan of Operations
The following discussion and analysis relate to the consolidated financial position and results of
operations of ICTSI and its wholly and majority-owned subsidiaries (collectively known as “ICTSI
Group”) and should be read in conjunction with the accompanying unaudited interim consolidated
financial statements and related notes. References to “ICTSI”, “the Company”, and “Parent
Company” pertain to ICTSI Parent Company, while references to “the Group” pertain to ICTSI and
its subsidiaries.
2.1 Overview
The Group is an international operator of common user container terminals serving the global
container shipping industry. Its business is the acquisition, development, operation and management
of container terminals focusing on facilities with total annual throughputs ranging from 50,000 to
2,500,000 twenty-foot equivalent units (TEUs). It also handles break bulk cargoes (BBC) and
provides a number of ancillary services such as storage, container packing and unpacking, inspection,
weighing, and services for refrigerated containers or reefers. As of report date, the Group is involved
in 30 terminal concessions and port development projects in 20 countries worldwide. There are 25
operating terminals in eight key ports and an inland container terminal in the Philippines, two in
Indonesia and one each in Brunei, China, the United States of America (U.S.A.), Ecuador, Brazil,
Poland, Georgia, Madagascar, Croatia, Pakistan, Honduras, Mexico, Iraq and Argentina; three
ongoing port development projects in Colombia, DR Congo and Australia; a sub-concession
agreement to develop, manage and operate a port in Nigeria; and a recent acquisition of an existing
concession to construct and operate a port in Tuxpan, Mexico. The expected start of commercial
operations of the ongoing projects are third quarter of 2016 for Colombia and DR Congo and first
quarter of 2017 for Australia. The construction of the terminal in Nigeria is expected to start in 2016
and is scheduled to commence initial operations in middle of 2019. As of report date, Tecplata is
ready to operate.
ICTSI was established in 1987 in connection with the privatization of Manila International Container
Terminal (MICT) in the Port of Manila, and has built upon the experience gained in rehabilitating,
developing and operating MICT to establish an extensive international network concentrated in
emerging market economies. International acquisitions principally in Asia, Europe, Middle East and
Africa (EMEA) and Americas substantially contributed to the growth in volume, revenues and net
income. ICTSI’s business strategy is to continue to develop its existing portfolio of terminals and
proactively seek acquisition opportunities that meet its investment criteria.
The Group operates principally in one industry segment which is cargo handling and related services.
ICTSI has organized its business into three geographical segments:
Asia
o Manila - Manila International Container Terminal, Port of Manila, Philippines (MICT)
o Zambales - New Container Terminal (NCT) 1 and 2, Subic Bay Freeport Zone, Olongapo
City, Philippines (SBITC/ICTSI Subic)
o Batangas - Bauan Terminal, Bauan, Philippines (BIPI)
o Laguna - Laguna Gateway Inland Container Terminal, Calamba City, Laguna, Philippines
(LGICT)
o Davao - Sasa Wharf, Port of Davao (DIPSSCOR) and Hijo International Port, Davao del
Norte, Philippines (HIPS)
o General Santos - Makar Wharf, Port of General Santos, Philippines (SCIPSI)
o Misamis Oriental - Phividec Industrial Estate, Tagaloan, Philippines (MICTSI)
o Indonesia - Makassar Port Container Terminal, Makassar, South Sulawesi, Indonesia (MTS)
and Port of Tanjung Priok, Jakarta, Indonesia (OJA)

SEC Form 17-Q Q1 2016 31 31
o China - Yantai International Container Terminal, Port of Yantai, Shandong Province, China
(YICT)
o Brunei - Muara Container Terminal, Brunei Darussalam (NMCTS)
o Pakistan - Port of Karachi, Karachi, Pakistan (PICT)
o Australia - Webb Dock Container Terminal and ECP at Webb Dock East, Port of Melbourne,
Australia (VICT)
EMEA
o Poland - Baltic Container Terminal, Gdynia, Poland (BCT)
o Georgia - Port of Batumi, Batumi, Georgia (BICT)
o Croatia - Brajdica Container Terminal, Rijeka, Croatia (AGCT)
o Madagascar - Port of Toamasina, Toamasina, Madagascar (MICTSL)
o Nigeria - Deep Water Port, Ibeju-Lekki, Lagos State, Federal Republic of Nigeria (LICTSLE)
o DR Congo - River Port, Mbengu, Matadi, Democratic Republic of Congo (IDRC)
o Iraq - Port of Umm Qasr, Iraq (ICTSI Iraq)
Americas
o Brazil - Suape Container Terminal, Suape, Brazil (TSSA)
o Ecuador - Port of Guayaquil, Guayaquil, Ecuador (CGSA)
o Argentina - Port of La Plata, Buenos Aires Province, Argentina (TECPLATA)
o Oregon, USA - Port of Portland, Oregon, USA (ICTSI Oregon)
o Mexico - Port of Manzanillo, Manzanillo, Mexico (CMSA) and Port of Tuxpan, Mexico
(TMT)
o Colombia - Port of Buenaventura, Buenaventura, Colombia (SPIA)
o Honduras - Puerto Cortés, Republic of Honduras (OPC)
Concessions for port operations entered into, acquired and terminated by ICTSI and subsidiaries for
the last two years are summarized below:
River Port, Matadi, Democratic Republic of Congo. On January 23, 2014, the Company, through its
subsidiary, ICTSI Cooperatief U.A. (ICTSI Cooperatief), forged a business partnership with La
Societe de Gestion Immobiliere Lengo (SIMOBILE) for the establishment and formation of a joint
venture company, ICTSI DR Congo (IDRC). ICTSI Cooperatief and SIMOBILE initially owned
60.0 percent and 40.0 percent of IDRC, respectively. On May 19, 2015, ICTSI Cooperatief and
SIMOBILE transferred their respective 8.0 percent and 2.0 percent ownership interest in IDRC to
Societe Commerciale Des Transports Et Des Ports S.A. (SCTP SA) in exchange for the latter’s
contribution of technical knowledge, skills and substantial experience in the port and port system in
DRC and operation of railroad system and undertaking to facilitate the activities of IDRC and to assist
in its relations with the public authorities. SIMOBILE transferred to its subsidiary, La Societe
d’Investissement et de Placement Sprl (SIP Sprl), its 10% ownership in IDRC. Thereafter, IDRC is
owned 52.0 percent by ICTSI, 28.0 percent by SIMOBILE, 10.0 percent by SIP Sprl and 10.0 percent
by SCTP SA. IDRC will build, manage, develop and operate the same as a new container terminal in
phases, as well as provide exclusive container handling services and general cargo services therein.
Phase 1 is expected to be completed within 18 to 24 months from the start of construction. The
construction of the terminal commenced in January 2015 and is expected to commence initial
operations in the third quarter of 2016.
Port of Umm Qasr, Iraq. On April 8, 2014, ICTSI, through its wholly owned subsidiary ICTSI
(M.E.) JLT, and General Company for Ports of Iraq signed the Contract for the Construction and
Operation of Three New Quays and Management and Operation of Quay No. 20 (“Contract”) in the
Port of Umm Qasr (“Port”) in Iraq. The Contract grants ICTSI the rights to: (a) manage and operate
the existing container facility at Berth 20 of the Port for a period of 10 years, (b) build, under a build-
operate-transfer (BOT) scheme, a new container and general cargo terminal in the Port for a
concession period of 26 years, and (c) provide container and general cargo terminal services in both
components. ICTSI took over Berth 20 in September 2014 and started commercial operations in

SEC Form 17-Q Q1 2016 32 32
November 2014, while Phase 1 of the expansion project is expected to be completed and be
operational by the third quarter of 2016.
Webb Dock Container Terminal and ECP at Webb Dock East, Port of Melbourne, Australia. On
May 2, 2014, ICTSI, through its subsidiary in Australia, Victoria International Container Terminal
Ltd. (VICT), signed a contract with Port of Melbourne Corporation (POMC) for the design,
construction, commissioning, operation, maintaining and financing of the Webb Dock Container
Terminal (“Terminal”) and Empty Container Park (ECP) at Webb Dock East (WDE) in the Port of
Melbourne. The contract grants VICT the rights to: (a) design, build and commission the new
Terminal at berths WDE 4 and WDE 5, (b) design, build and commission the new ECP at WDE, and
(c) operate the Terminal and ECP until June 30, 2040. Phase 1 construction of the Terminal and ECP
commenced in the fourth quarter of 2014 and expected to start operations in the first quarter of 2017.
Phase 2 is expected to start operations by the first quarter of 2018.
Port of Yantai, Shandong Province, China. On July 1, 2014, the Company, through its subsidiary,
ICTSI (Hong Kong) Limited (IHKL), acquired 51.0 percent of the total equity interest of Yantai
International Container Terminals Limited (YICT) for a total cash consideration of US$137.3 million
(RMB854.2 million). On the same date, the Company sold its 60.0 percent ownership interest in
YRDICTL to Yantai Port Holdings (YPH) for a total cash consideration of US$94.8 million
(RMB588.1 million). The objective of these transactions is to consolidate and optimize the overall
port operations within the Zhifu Bay Port area in Yantai. After the consolidation, YICT became the
only foreign container terminal within the Zhifu Bay Port area. ICTSI took control over the operations
of YICT on the same date.
Laguna Gateway Inland Container Terminal, Philippines. On March 2, 2015, Laguna Gateway
Inland Container Terminal, Inc. (LGICT) started operating the first one-stop inland container terminal
(ICT) located in Barangays Banlic and San Cristobal, Calamba City, Laguna. LGICT is
60.0 percent-owned by IW Cargo and the remaining 40.0 percent is owned by Nippon Container
Terminals Co. Ltd., Transnational Diversified Corporation and NYK- Fil-Japan Shipping Corp. The
ICT primarily operates as an extension of the seaport operations of the MICT. In particular, the said
ICT is intended to function as a regional logistics hub, which will service and support the operations
of exporters and importers, both within and outside the economic zones in the LABARZON
area. Only 58 kilometers from Metro Manila, the ICT is situated on a 21-hectare property,
strategically located near various economic export zones with an already existing adjacent railroad.
Port of Tuxpan, Mexico. On May 27, 2015, ICTSI acquired 100.0 percent of the capital stock of
Terminal Maritima de Tuxpan, S.A. de C.V. (TMT) for a total cash consideration of US$54.5 million
from Grupo TMM, S.A.B. and its subsidiary Inmobiliaria TMM, S.A. de C.V. TMT has a concession
to construct and operate a maritime container terminal in the Port of Tuxpan, Mexico and is the owner
of the real estate where the maritime container terminal will be constructed. The concession
agreement is valid until May 25, 2021, subject to extension for another 20 years. As of report date,
management is currently working on a development plan on TMT.
On June 30, 2014, ICTSI, through its subsidiaries, ICTSI Ltd. and International Container Terminal
Services (India) Private Limited (ICTSI India), and L&T Shipbuilding Ltd. (LTSB) signed a
termination agreement cancelling ICTSI’s container port agreement for the management of the
Kattupalli Container Terminal in Tamil, Nadu. In accordance with the termination agreement, LTSB
agreed to pay ICTSI India approximately US$15.9 million (INR957.5 million) as reimbursement of
the license fee the latter paid to operate the terminal plus management fees and other amounts due to
ICTSI India.
On April 27, 2015, ICTSI sold its 60.0 percent ownership interest in Naha International Container
Terminal Inc. (NICTI) back to NICTI. The 10-year lease agreement of NICTI granted by Naha Port
Authority was to expire by end of 2015. NICTI contributed less than 1.0 percent to the Group’s
revenue and net income in 2014.

SEC Form 17-Q Q1 2016 33 33
2.2 Results of Operations and Key Performance Indicators
2.2.1 Results of Operations
The following table shows a summary of the results of operations for the first quarters of 2015 and
2016 as derived from the accompanying unaudited interim consolidated financial statements.
Table 2.1 Unaudited Consolidated Statements of Income
For the Three Months Ended March 31
(In thousands, except % change data) 2015 2016 % Change
Gross revenues from port operations US$296,062 US$266,469 (10.0)
Revenues from port operations,
net of port authorities’ share 247,269 223,449 ( 9.6)
Total income (net revenues, interest and other income) 251,512 232,745 ( 7.5)
Total expenses (operating, financing and other expenses) 179,080 171,260 ( 4.4)
EBITDA1 127,533 121,937 ( 4.4)
EBIT2 96,563 85,585 (11.4)
Net income attributable to equity holders of the parent 54,001 42,176 (21.9)
Earnings per share
Basic US$0.023 US$0.014 (39.1)
Diluted 0.023 0.014 (39.1)
__________________ 1 EBITDA is not a uniform or legally defined financial measure. It generally represents earnings before interest, taxes, depreciation
and amortization. EBITDA is presented because the Group believes it is an important measure of its performance and liquidity. EBITDA is also frequently used by securities analysts, investors and other interested parties in the evaluation of companies in the
industry.
The Group’s EBITDA figures are not; however, readily comparable with other companies’ EBITDA figures as they are calculated
differently and thus, must be read in conjunction with related additional explanations. EBITDA has limitations as an analytical tool
and should not be considered in isolation or as a substitute for analysis of the Group’s results as reported under PFRS. Some of the limitations concerning EBITDA are:
EBITDA does not reflect cash expenditures or future requirements for capital expenditures or contractual commitments;
EBITDA does not reflect changes in, or cash requirements for working capital needs;
EBITDA does not reflect the interest expense, or the cash requirements necessary to service interest or principal debt payments;
Although depreciation and amortization are non-cash charges, the assets being depreciated or amortized will often have
to be replaced in the future, and EBITDA does not reflect any cash requirements for such replacements; and Other companies in the industry may calculate EBITDA differently, which may limit its usefulness as a comparative
measure.
Because of these limitations, EBITDA should not be considered as a measure of discretionary cash available to the Group to invest
in the growth of the business. The Group compensates for these limitations by relying primarily on the PFRS results and uses
EBITDA only as supplementary information.
2 EBIT, or Earnings Before Interest and Taxes, is calculated by taking net revenues from port operations and deducting cash operating
expenses and depreciation and amortization.
__________________

SEC Form 17-Q Q1 2016 34 34
The following table presents the computation of EBITDA as derived from the Group’s
unaudited interim consolidated net income attributable to equity holders of the parent for the
first quarters of 2015 and 2016:
Table 2.2 EBITDA Computation
For the Three Months Ended March 31
In thousands, except % change data 2015 2016 % Change
Net income attributable to equity holders of the parent US$54,001 US$42,176 (21.9)
Non-controlling interests 2,801 2,878 2.7
Provision for income tax 15,630 16,431 5.1
Income before income tax 72,432 61,485 (15.1)
Add (deduct):
Depreciation and amortization 30,970 36,352 17.4
Interest and other expenses 28,374 33,396 17.7
Interest and other income (4,243) (9,296) 119.1
EBITDA US$127,533 US$121,937 ( 4.4)
2.2.2 Key Performance Indicators
The five (5) key performance indicators (KPIs) include gross moves per hour per crane, crane
availability and berth utilization, which indirectly affect the operations of the Group, and TEU volume
growth and gross revenue growth, which are both financial in nature. These KPIs are discussed in
detail in the succeeding paragraphs.
2016 Compared with 2015
Gross moves per hour per crane ranged from 15.5 to 28.7 moves per hour in 2015 to 18.1 to
32.7 moves per hour in 2016. Crane availability ranged from 88.7 percent to 99.9 percent in 2015 to
87.0 percent to 99.5 percent in 2016. Berth utilization was at 21.0 percent to 79.4 percent in 2015 and
16.2 percent to 89.2 percent in 2016.
2015 Compared with 2014
Gross moves per hour per crane ranged from 15.1 to 31.9 moves per hour in 2014 to 15.5 to
28.7 moves per hour in 2015. Crane availability ranged from 92.0 percent to 99.9 percent in 2014 to
88.7 percent to 99.9 percent in 2015. Berth utilization was at 24.0 percent to 78.0 percent in 2014 and
21.0 percent to 79.4 percent in 2015.
The gross moves per hour per crane is a measure of crane productivity while working on vessels
during discharging or loading operations. The crane availability relates to the efficiency of the
maintenance of the crane. While berth utilization is a measure of how long the berth is utilized for a
given period and this indicator measures the efficiency of the operations and the productivity on the
vessel.
2.3 Comparison of Operating Results for the First Quarters Ended March 31, 2016 and 2015
2.3.1 TEU Volume
The below table presents the volume (in TEU) handled by the Group for the first quarters ended
March 31, 2015 and 2016:
Table 2.3 Volume
For the Three Months Ended March 31
2015 2016 % Change
Asia 1,004,915 1,062,720 5.8
Americas 731,971 732,537 0.1
EMEA 245,887 258,382 5.1
1,982,773 2,053,639 3.6

SEC Form 17-Q Q1 2016 35 35
For the first quarter of 2016, the Group handled consolidated volume of 2,053,639 TEUs, a
3.6 percent increase from the 1,982,773 TEUs handled for the same period in 2015 mainly due to new
shipping lines and services; and continuous growth and ramp-up at ICTSI Iraq.
Volume from the Asia operations, comprised of terminals in the Philippines, China, Indonesia and
Pakistan, grew by 5.8 percent from 1,004,915 TEUs for the first quarter of 2015 to 1,062,720 TEUs
for the same period in 2016 mainly due to new shipping lines and services at PICT and improvement
in trade activities at most of the Philippine terminals and Jakarta, Indonesia. The Asia operations
accounted for 50.7 percent and 51.7 percent of the consolidated volume for the first quarters ended
March 31, 2015 and 2016, respectively.
Volume from the Americas segment, composed of terminals in Brazil, Ecuador, Honduras, Mexico
and The United States of America, increased marginally by 0.1 percent to 732,537 TEUs for the first
quarter of 2016 from 731,971 TEUs for the same period in 2015 as a result of new shipping lines and
services at CGSA and CMSA. The growth in the segment’s volume, however, was tempered by lower
imports at TSSA as a result of weak Brazilian economy and significant depreciation of the Brazilian
Reais against the US dollar; and discontinued vessel calls from two major shipping lines, Hanjin
Shipping Co. (Hanjin) and Hapag Lloyd, at ICTSI Oregon in March 2015 due to continuing effect of
labor disruptions and conflicts. Hanjin has discontinued vessel service several times in the past but
eventually came back. The Americas operations accounted for 36.9 percent and 35.7 percent of the
consolidated volume for the first quarters ended March 31, 2015 and 2016, respectively.
Meanwhile, the EMEA operations, consisting of terminals in Poland, Georgia, Madagascar and
Croatia, reported a 5.1 percent growth from 245,887 TEUs for the first quarter of 2015 to 258,382
TEUs for the same period in 2016 primarily due to continuous growth and ramp-up at ICTSI Iraq.
Growth was partially offset by reduced vessel calls and trade volume at BCT. The EMEA operations
accounted for 12.4 percent and 12.6 percent of the Group’s consolidated volume for the first quarters
ended March 31, 2015 and 2016, respectively.
2.3.2 Total Income
Total income consists of: (1) Revenues from port operations, net of port authorities’ share in gross
revenues; (2) Interest income; (3) Foreign exchange gain; and (4) Other income.
The table below illustrates the consolidated total income for the first quarters ended March 31, 2015
and 2016:
Table 2.4 Total Income
For the Three Months Ended March 31
(In thousands, except % change data) 2015 2016 % Change
Gross revenues from port operations US$296,062 US$266,469 (10.0)
Port authorities’ share in gross revenues 48,793 43,020 (11.8)
Net revenues 247,269 223,449 ( 9.6)
Interest income 2,618 4,116 57.2
Foreign exchange gain 965 3,007 211.6
Other income 660 2,173 229.2
Total income US$251,512 US$232,745 ( 7.5)
For the first quarter of 2016, net revenues stood at 96.0 percent of the total consolidated income while
interest income, foreign exchange gain and other income accounted for 1.8 percent, 1.3 percent and
0.9 percent, respectively. For the same period in 2015, net revenues stood at 98.3 percent of the total
consolidated income while interest income, foreign exchange gain and other income accounted for
1.0 percent, 0.4 percent and 0.3 percent, respectively.
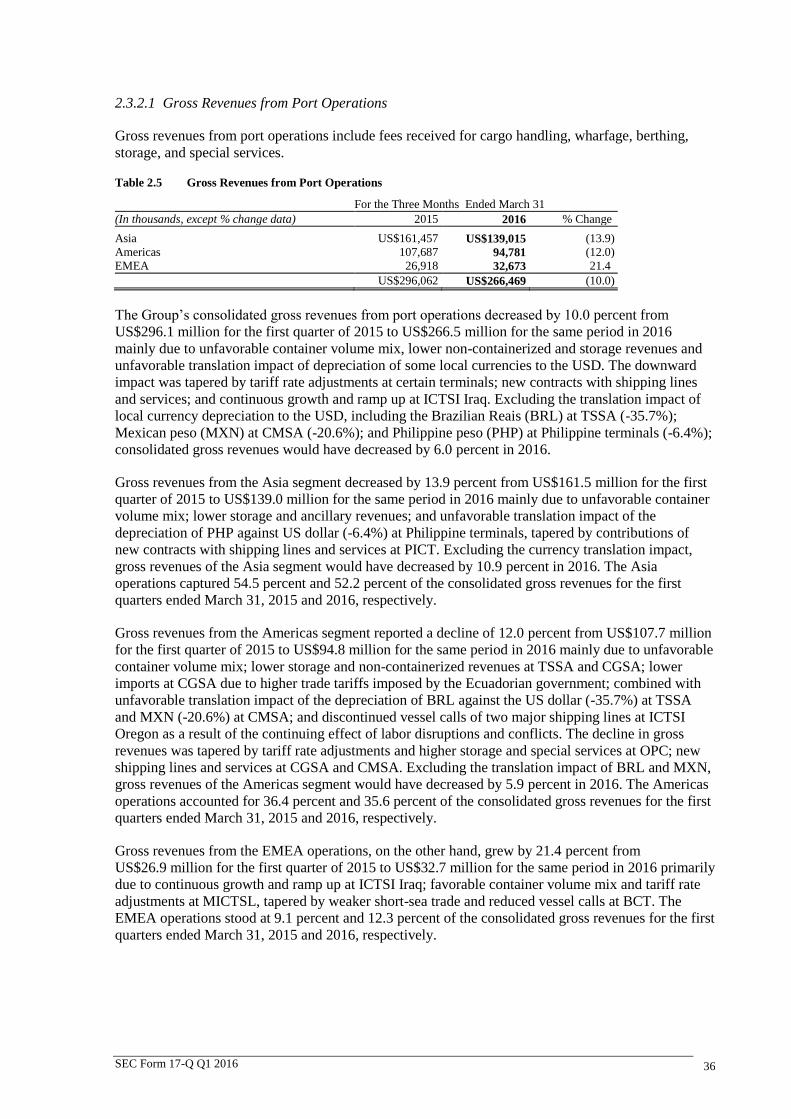
SEC Form 17-Q Q1 2016 36 36
2.3.2.1 Gross Revenues from Port Operations
Gross revenues from port operations include fees received for cargo handling, wharfage, berthing,
storage, and special services.
Table 2.5 Gross Revenues from Port Operations
For the Three Months Ended March 31
(In thousands, except % change data) 2015 2016 % Change
Asia US$161,457 US$139,015 (13.9)
Americas 107,687 94,781 (12.0)
EMEA 26,918 32,673 21.4
US$296,062 US$266,469 (10.0)
The Group’s consolidated gross revenues from port operations decreased by 10.0 percent from
US$296.1 million for the first quarter of 2015 to US$266.5 million for the same period in 2016
mainly due to unfavorable container volume mix, lower non-containerized and storage revenues and
unfavorable translation impact of depreciation of some local currencies to the USD. The downward
impact was tapered by tariff rate adjustments at certain terminals; new contracts with shipping lines
and services; and continuous growth and ramp up at ICTSI Iraq. Excluding the translation impact of
local currency depreciation to the USD, including the Brazilian Reais (BRL) at TSSA (-35.7%);
Mexican peso (MXN) at CMSA (-20.6%); and Philippine peso (PHP) at Philippine terminals (-6.4%);
consolidated gross revenues would have decreased by 6.0 percent in 2016.
Gross revenues from the Asia segment decreased by 13.9 percent from US$161.5 million for the first
quarter of 2015 to US$139.0 million for the same period in 2016 mainly due to unfavorable container
volume mix; lower storage and ancillary revenues; and unfavorable translation impact of the
depreciation of PHP against US dollar (-6.4%) at Philippine terminals, tapered by contributions of
new contracts with shipping lines and services at PICT. Excluding the currency translation impact,
gross revenues of the Asia segment would have decreased by 10.9 percent in 2016. The Asia
operations captured 54.5 percent and 52.2 percent of the consolidated gross revenues for the first
quarters ended March 31, 2015 and 2016, respectively.
Gross revenues from the Americas segment reported a decline of 12.0 percent from US$107.7 million
for the first quarter of 2015 to US$94.8 million for the same period in 2016 mainly due to unfavorable
container volume mix; lower storage and non-containerized revenues at TSSA and CGSA; lower
imports at CGSA due to higher trade tariffs imposed by the Ecuadorian government; combined with
unfavorable translation impact of the depreciation of BRL against the US dollar (-35.7%) at TSSA
and MXN (-20.6%) at CMSA; and discontinued vessel calls of two major shipping lines at ICTSI
Oregon as a result of the continuing effect of labor disruptions and conflicts. The decline in gross
revenues was tapered by tariff rate adjustments and higher storage and special services at OPC; new
shipping lines and services at CGSA and CMSA. Excluding the translation impact of BRL and MXN,
gross revenues of the Americas segment would have decreased by 5.9 percent in 2016. The Americas
operations accounted for 36.4 percent and 35.6 percent of the consolidated gross revenues for the first
quarters ended March 31, 2015 and 2016, respectively.
Gross revenues from the EMEA operations, on the other hand, grew by 21.4 percent from
US$26.9 million for the first quarter of 2015 to US$32.7 million for the same period in 2016 primarily
due to continuous growth and ramp up at ICTSI Iraq; favorable container volume mix and tariff rate
adjustments at MICTSL, tapered by weaker short-sea trade and reduced vessel calls at BCT. The
EMEA operations stood at 9.1 percent and 12.3 percent of the consolidated gross revenues for the first
quarters ended March 31, 2015 and 2016, respectively.
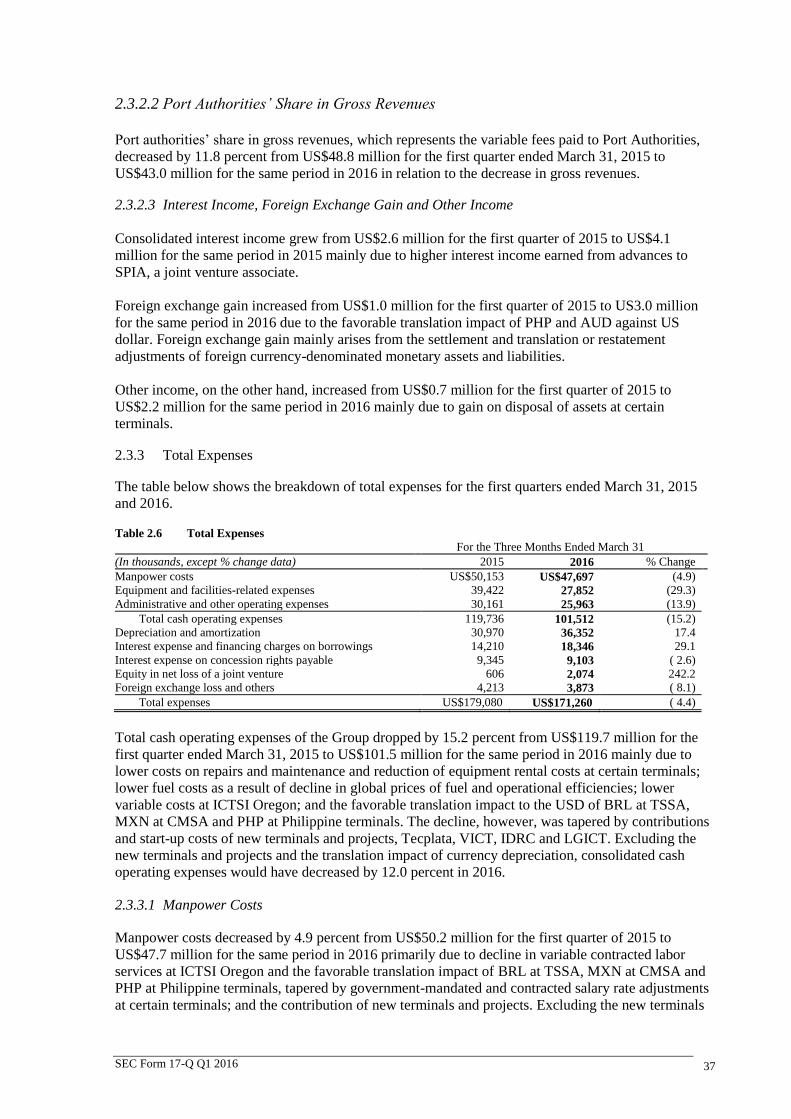
SEC Form 17-Q Q1 2016 37 37
2.3.2.2 Port Authorities’ Share in Gross Revenues
Port authorities’ share in gross revenues, which represents the variable fees paid to Port Authorities,
decreased by 11.8 percent from US$48.8 million for the first quarter ended March 31, 2015 to
US$43.0 million for the same period in 2016 in relation to the decrease in gross revenues.
2.3.2.3 Interest Income, Foreign Exchange Gain and Other Income
Consolidated interest income grew from US$2.6 million for the first quarter of 2015 to US$4.1
million for the same period in 2015 mainly due to higher interest income earned from advances to
SPIA, a joint venture associate.
Foreign exchange gain increased from US$1.0 million for the first quarter of 2015 to US3.0 million
for the same period in 2016 due to the favorable translation impact of PHP and AUD against US
dollar. Foreign exchange gain mainly arises from the settlement and translation or restatement
adjustments of foreign currency-denominated monetary assets and liabilities.
Other income, on the other hand, increased from US$0.7 million for the first quarter of 2015 to
US$2.2 million for the same period in 2016 mainly due to gain on disposal of assets at certain
terminals.
2.3.3 Total Expenses
The table below shows the breakdown of total expenses for the first quarters ended March 31, 2015
and 2016.
Table 2.6 Total Expenses
For the Three Months Ended March 31
(In thousands, except % change data) 2015 2016 % Change
Manpower costs US$50,153 US$47,697 (4.9)
Equipment and facilities-related expenses 39,422 27,852 (29.3)
Administrative and other operating expenses 30,161 25,963 (13.9)
Total cash operating expenses 119,736 101,512 (15.2)
Depreciation and amortization 30,970 36,352 17.4
Interest expense and financing charges on borrowings 14,210 18,346 29.1
Interest expense on concession rights payable 9,345 9,103 ( 2.6)
Equity in net loss of a joint venture 606 2,074 242.2
Foreign exchange loss and others 4,213 3,873 ( 8.1)
Total expenses US$179,080 US$171,260 ( 4.4)
Total cash operating expenses of the Group dropped by 15.2 percent from US$119.7 million for the
first quarter ended March 31, 2015 to US$101.5 million for the same period in 2016 mainly due to
lower costs on repairs and maintenance and reduction of equipment rental costs at certain terminals;
lower fuel costs as a result of decline in global prices of fuel and operational efficiencies; lower
variable costs at ICTSI Oregon; and the favorable translation impact to the USD of BRL at TSSA,
MXN at CMSA and PHP at Philippine terminals. The decline, however, was tapered by contributions
and start-up costs of new terminals and projects, Tecplata, VICT, IDRC and LGICT. Excluding the
new terminals and projects and the translation impact of currency depreciation, consolidated cash
operating expenses would have decreased by 12.0 percent in 2016.
2.3.3.1 Manpower Costs
Manpower costs decreased by 4.9 percent from US$50.2 million for the first quarter of 2015 to
US$47.7 million for the same period in 2016 primarily due to decline in variable contracted labor
services at ICTSI Oregon and the favorable translation impact of BRL at TSSA, MXN at CMSA and
PHP at Philippine terminals, tapered by government-mandated and contracted salary rate adjustments
at certain terminals; and the contribution of new terminals and projects. Excluding the new terminals

SEC Form 17-Q Q1 2016 38 38
and projects and the translation impact of currency depreciation, consolidated manpower costs would
have decreased by 1.2 percent in 2016.
Manpower costs accounted for 41.9 percent and 47.0 percent of consolidated cash operating expenses
for the first quarters ended March 31, 2015 and 2016, respectively.
2.3.3.2 Equipment and Facilities-Related Expenses
Equipment and facilities-related expenses consist mainly of repairs and maintenance costs of port
equipment and facilities, fixed port fees, power and light, technical and systems development and
maintenance expenses, tools expenses, equipment rentals, and fuel, oil and lubricants.
Equipment and facilities-related expenses dropped by 29.3 percent from US$39.4 million for the first
quarter of 2015 to US$27.9 million for the same period in 2016 mainly due to lower costs of repairs
and maintenance and reduction of equipment rental costs at certain terminals; decline in global prices
of fuel and operational efficiencies; lower variable cost at ICTSI Oregon; and the favorable translation
impact to the USD of the BRL at TSSA, MXN at CMSA and PHP at Philippine terminals. Excluding
the new terminals and projects and translation impact of currency depreciation, consolidated
equipment and facilities-related expenses would have decreased by 25.5 percent in 2016.
Equipment and facilities-related expenses represented 32.9 percent and 27.4 percent of consolidated
cash operating expenses for the first quarters ended March 31, 2015 and 2016, respectively.
2.3.3.3 Administrative and Other Operating Expenses
Administrative and other operating expenses declined by 13.9 percent from US$30.2 million for the
first quarter of 2015 to US$26.0 million for the same period in 2016 mainly due to cost optimization
measures implemented; decrease in taxes and licenses at certain terminals driven by decline in
revenues; and favorable foreign exchange translation impact to the USD of the BRL at TSSA, the
MXN at CMSA and the PHP at Philippine terminals. The decrease was slightly tapered by higher
insurance costs arising from increased risk coverage on the Group’s assets and higher IT costs.
Excluding the new terminals and projects and translation impact of currency depreciation,
consolidated administrative expenses and other operating expenses would have decreased by
12.0 percent in 2016.
Administrative and other operating expenses stood at 25.2 percent and 25.6 percent of consolidated
cash operating expenses for the first quarters ended March 31, 2015 and 2016, respectively.
2.3.3.4 Depreciation and Amortization
Depreciation and amortization expense increased by 17.4 percent from US$31.0 million for the first
quarter of 2015 to US$36.4 million for the same period in 2016 mainly from depreciation of
Tecplata’s port facilities starting January 1, 2016; and higher depreciation arising acquisition of port
facilities and equipment at MICT, YICT and OPC.
2.3.3.5 Interest and Financing Charges on Borrowings
Interest and financing charges on borrowings increased by 29.1 percent from US$14.2 million for the
first quarter of 2015 to US$18.3 million for the same period in 2016 primarily due to higher average
loan balance and lower capitalized borrowing costs. Capitalized borrowing costs on qualifying assets
amounted to US$7.3 million in 2015 and US$4.5 million in 2016. Capitalization rate increased from
6.6 percent in 2015 to 6.8 percent in 2016.

SEC Form 17-Q Q1 2016 39 39
2.3.3.6 Interest Expense on Concession Rights Payable
Interest on concession rights payable decreased by 2.6 percent from US$9.3 million for the first
quarter of 2015 to US$9.1 million for the same period in 2016 mainly due to the declining principal
balances of the Group’s concession rights payable as of March 31, 2016.
2.3.3.7 Equity in Net Loss of A Joint Venture
Equity in net loss of a joint venture surged to US$2.1 million in the first quarter of 2016 from US$0.7
million for the same period in 2015 due to the increase in the Company’s share in net loss at SPIA as
a result of deferred income tax provision.
2.3.3.8 Foreign Exchange Loss and Others
Foreign exchange loss and others decreased by 8.0 percent from US$4.2 million for the first quarter
of 2015 to US$3.9 million for the same period in 2016 mainly due to the favorable translation impact
of PHP and AUD against US dollar in 2016. Foreign exchange loss mainly results from the translation
or restatement as well as from the settlement of foreign currency-denominated monetary assets and
liabilities.
Other expense is composed of the Group’s bank charges, management fee, loss on sale of equipment
and other sundry expense accounts of ICTSI and subsidiaries.
2.3.4 EBITDA and EBIT
Consolidated EBITDA decreased by 4.4 percent from US$127.5 million for the first quarter of 2015
to US$121.9 million for the same period in 2016 primarily due to unfavorable container mix; lower
storage, BBC and ancillary services at TSSA, CGSA and other terminals; and unfavorable translation
impact from significant depreciation of some local currencies to the USD, partially tapered by
significantly lower operating expenses and positive contribution of ICTSI Iraq. Excluding the new
terminals and projects and translation impact of currency depreciation, consolidated EBITDA would
have decreased by 2.6 percent in 2016. Consequently, EBITDA margin went up to 45.8 percent in
2016 from 43.1 percent in 2015.
Meanwhile, consolidated EBIT decreased by 11.4 percent from US$96.6 million for the first quarter
of 2015 to US$85.6 million for the same period in 2016 mainly due to higher depreciation and
amortization expense. As a result, EBIT margin also decreased to 32.1 percent in 2016 from
32.6 percent in 2015.
2.3.5 Income Before Income Tax and Provision for Income Tax
Consolidated income before income tax declined by 15.1 percent from US$72.4 million for the first
quarter of 2015 to US$61.5 million for the same period in 2016 primarily due to higher interest and
financing charges arising from lower capitalized borrowing costs; and higher depreciation charges.
Excluding new terminals and projects, consolidated income before income tax would have decreased
by 14.9 percent in 2016. The ratio of income before income tax to consolidated gross revenues stood
at 24.5 percent and 23.1 percent in 2015 and 2016, respectively.
Consolidated provision for current and deferred income taxes increased by 5.1 percent to
US$16.4 million for the first quarter of 2016 from US$15.6 million for the same period in 2015
mainly due to higher taxable income at MICTSL, PICT, OPC and ICTSI Iraq. Effective income tax
rate in 2015 and 2016 stood at 21.6 percent and 26.7 percent, respectively.

SEC Form 17-Q Q1 2016 40 40
2.3.6 Net Income
Consolidated net income declined by 20.7 percent from US$56.8 million for the quarter ended
March 31, 2015 to US$45.1 million for the same period in 2016. The ratio of consolidated net income
to gross revenues stood at 19.2 percent and 16.9 percent in 2015 and 2016, respectively.
Consolidated net income attributable to equity holders decreased by 21.9 percent from
US$54.0 million for the quarter ended March 31, 2015 to US$42.2 million for the same period in
2016. Excluding new terminals and projects, consolidated net income attributable to equity holders
would have decreased by 4.9 percent in 2016.
Basic and diluted earnings per share decreased from US$0.023 in 2015 to US$0.014 in 2016.
2.4 Trends, Events or Uncertainties Affecting Revenues and Profits
The Group is exposed to a number of trends, events and uncertainties which can affect its recurring
revenues and profits. These include levels of general economic activity and containerized trade
volume in countries where it operates, as well as certain cost items, such as labor, fuel and power. In
addition, the Group operates in a number of jurisdictions other than the Philippines and collects
revenues in various currencies. Continued appreciation of the US dollar relative to other major
currencies, particularly the Philippine peso, Brazilian Reais, Mexican peso and the Euro, may have a
negative impact on the Group’s reported levels of revenues and profits.
2.5 Financial Position
Table 2.7 Consolidated Condensed Balance Sheets
(In thousands, except % change data) December 31, 2015 March 31, 2015 % Change
Total assets US$3,841,432 US$3,925,523 2.2
Current assets 513,717 478,407 (6.9)
Total equity 1,826,048 1,775,638 (2.8)
Total equity attributable to equity holders of the parent 1,674,443 1,620,387 (3.2)
Total interest-bearing debt 1,083,070 1,217,789 12.4
Current liabilities 288,751 482,485 67.1
Total liabilities 2,015,384 2,149,885 6.7
Current assets/total assets 13.4% 12.2%
Current ratio 1.78 0.99
Debt-equity ratio1 0.59 0.69
1 Debt includes interest-bearing debt. Equity means Total Equity as shown in the consolidated balance sheets.
Total assets increased by 2.2 percent to US$3.9 billion as of March 31, 2016 from US$3.8 billion as
of December 31, 2015 mainly due to investments in capital expenditures, which include the ongoing
construction of port facilities at VICT and IDRC and expansion projects at ICTSI Iraq and CMSA;
and advances extended to SPIA to fund the Group’s share on the ongoing construction and
development at the Port of Buenaventura. These investments were funded mainly by cash generated
from the Group’s operations, and net proceeds from the issuances of perpetual capital securities in
2015. Non-current assets stood at 86.6 percent and 87.8 percent of the total consolidated assets as of
December 31, 2015 and March 31, 2016, respectively.
Current assets decreased by 6.9 percent from US$513.7 million as of December 31, 2015 to
US$478.4 million as of March 31, 2016 primarily due to continuous deployment of cash to fund
capital expenditures. Current assets accounted for 13.4 percent and 12.2 percent of the total
consolidated assets of the Group as of December 31, 2015 and March 31, 2016, respectively. Current
ratio stood at 1.78 as of December 31, 2015 and 0.99 as of March 31, 2016.
Total equity decreased by 2.8 percent to US$1.8 billion as of March 31, 2016 primarily due to
reclassification of subordinated perpetual capital securities aggregating to US$105.2 million to current

SEC Form 17-Q Q1 2016 41 41
liabilities, tapered by net income generated for the period; and decrease in other comprehensive loss
as a result of net favorable exchange differences on translation of foreign operations’ financial
statements.
Total liabilities increased by 6.7 percent as of March 31, 2016 mainly due to loan availment at CGSA;
and net liability arising from the accrual of lease expense at VICT. Financial leverage, the ratio of
total interest-bearing debt to total assets, stood at 28.2 percent and 31.0 percent as of
December 31, 2015 and March 31, 2016, respectively.
Meanwhile, current liabilities surged by 67.1 percent to US$482.5 million as of March 31, 2016 from
US$288.8 million as of December 31, 2015 mainly due to reclassification of subordinated perpetual
capital securities; reclassification of the current portion of the accrued lease expense at VICT; and
higher income tax payable as a result of higher taxable income at certain terminals.
2.5.1 Material Variances Affecting the Balance Sheet
Balance sheet accounts as of March 31, 2016 with variances of plus or minus 5.0 percent against
December 31, 2015 balances are discussed, as follows:
Noncurrent Assets
1. Property and equipment increased by 6.5 percent to US$1.3 billion as of March 31, 2016 due to
increase in capital expenditures arising from ongoing construction of port facilities, expansion
projects and port equipment acquisitions at VICT, IDRC and CMSA.
2. Investment in and advances to a joint venture and associate increased by 9.8 percent to US$254.7
million as of March 31, 2016 due to continuous funding extended to SPIA for the Group’s share
on the ongoing construction and development at the Port of Buenaventura.
3. Other noncurrent assets increased by 16.6 percent to US$160.3 million mainly due to increase in
advances to suppliers and contractors on port equipment acquisitions at IDRC and VICT.
Current Assets
4. Cash and cash equivalents decreased by 12.2 percent to US$311.2 million as of March 31, 2016
arising from continuous deployment of cash to fund capital expenditures, tapered by cash inflows
generated from operations and loan availment at CGSA during the period.
5. Prepaid expenses and other current assets increased by 7.8 percent to US$47.5 million as of
March 31, 2016 mainly due to timing of utilization of prepaid taxes, particularly at the Parent
Company
Equity
6. Treasury shares grew by 33.7 percent to US$10.1 million as of March 31, 2016 mainly as a result
of acquisition of 2,068,000 treasury shares totaling US$2.7 million in January and March 2016.
7. Perpetual capital securities decreased by 12.7 percent to US$726.7 million as of
March 31, 2016 primarily due to reclassification of subordinated perpetual capital securities
aggregating to US$105.2 million to current liabilities upon notice of redemption in May 2016.
8. Retained earnings increased by 4.8 percent to US$723.2 million as of March 31, 2016 mainly due
to net income attributable to equity holders of the parent for the quarter amounting to
US$42.2 million.
9. Other comprehensive loss decreased by 7.2 percent to US$240.1 million as a result of net
favorable exchange differences on translation of foreign operations’ financial statements.
Noncurrent Liabilities
10. Pension and other non-current liabilities increased by 59.8 percent to US$48.0 million as of
March 31, 2016 arising mainly from the reclassification of the current portion of the accrued
1ease expense amounting to US$90.3 million at VICT to current liabilities.

SEC Form 17-Q Q1 2016 42 42
Current Liabilities
11. Loans payable surged by 97.8 percent to US$4.0 million as of March 31, 2016 mainly due to loan
availment at CGSA.
12. Accounts payable and other current liabilities grew by 31.1 percent to US$263.2 million as of
March 31, 2016 primarily due to reclassification of the current portion of accrued lease expense at
VICT.
13. Perpetual capital securities amounting to US$112.9 million was reclassified to current liabilities
as at March 31, 2016 which consist of face value of US$108.3 million and accrued distribution of
US$4.5 million.
14. Current portion of long-term debt and debt securities increased by 6.5 percent to US$58.0 million
as of March 31, 2016 due to maturing term loans of subsidiaries in 2016.
15. Current portion of concession rights payable increased by 7.3 percent to US$9.5 million as of
March 31, 2016 mainly arising from higher concession fees scheduled for payment in 2016.
16. Income tax payable increased by 56.0 percent to US$34.3 million as of March 31, 2016 mainly
due to higher taxable income particularly at OPC, PICT and CGSA.
17. Derivative liabilities increased by 19.5 percent to US$0.7 million as of March 31, 2016 due to
mark-to-market adjustments on outstanding interest rate swap transactions at AGCT.
2.6 Liquidity and Capital Resources
This section discusses the Group’s sources and uses of funds as well as its debt and equity capital
profile.
2.6.1 Liquidity
The table below shows the Group’s consolidated cash flows as of March 31, 2015 and 2016:
Table 2.8 Consolidated Cash Flows
For the Three Months Ended March 31
(In thousands, except % change data) 2015 2016 % Change
Net cash provided by operating activities US$135,615 US$101,166 (25.4)
Net cash used in investing activities (84,639) (122,262) 44.5
Net cash provided by (used in) financing
activities 7,849 (23,379) (397.9)
Effect of exchange rate changes on cash (3,931) 1,173 (129.8)
Net increase in cash and cash equivalents 54,894 (43,302) (178.9)
Cash and cash equivalents, beginning 194,298 354,482 82.4
Cash and cash equivalents, end US$249,192 US$311,180 24.9
Consolidated cash and cash equivalents grew by 24.9 percent to US$311.2 million as of March 31,
2016 mainly from higher beginning cash balance as a result of issuances of perpetual capital securities
and CMSA’s drawdown from the Project Finance Facility in the latter part of 2015, tapered by the
Group’s continuous deployment of funds to finance ongoing port development activities.
Net cash provided by operating activities decreased by 25.4 percent from US$135.6 million for the
quarter ended March 31, 2015 to US$101.2 million for the same period in 2016 due to lower results of
operations and settlement of payables.
Net cash used in investing activities increased by 44.5 percent to US$122.3 million mainly due to
increased investments in capital expenditures during the period. Capital expenditures for 2016
amounted to US$98.2 million. Excluding capitalized borrowing costs and expenses, capital
expenditures amounted to US$89.5 million. The Group finances these requirements through existing
cash, cash generated from operations, external borrowings and/or equity issuances, as necessary. The
2016 net cash used in investing activities also includes US$20.0 million advances granted to SPIA, a
joint venture, for the Group’s share on the ongoing construction of port facilities at the Port of
Buenaventura.

SEC Form 17-Q Q1 2016 43 43
Net cash used in financing activities for the first quarter ended March 31, 2016 amounted to
US$23.4 million which consist mainly of interest payments on borrowings and concession rights
payable totaling US$38.7 million; payment of dividends of US$1.2 million; and purchase of treasury
shares of US$2.7 million, tapered by US$20.8 million net proceeds from loan availment and
scheduled loan repayment at CGSA. Meanwhile, the net cash provided by financing activities for the
same period in 2015 include mainly of the US$58.2 million net proceeds from the issuances and
exchanges of debt and equity instruments in January 2015, tapered by interest payments on
borrowings and concession rights payable totaling US$35.9 million, scheduled repayments of certain
subsidiaries’ short and long-term loans aggregating US$8.1 million, payment of dividends of
US$3.4 million, and distributions to holders of perpetual capital securities amounting to
US$4.5 million.
2.6.2 Capital Resources
The table below illustrates the Group’s capital sources as of December 31, 2015 and March 31, 2016:
Table 2.9 Capital Sources
(In thousands, except % change data) December 31, 2015 March 31, 2016 % Change
Loans payable US$2,027 US$4,009 97.8
Current portion of long-term debt 54,465 57,990 6.5
Subordinated capital securities – 112,865 –
Long-term debt, net of current portion 1,026,578 1,042,925 1.6
Total short and long-term debt 1,083,070 1,217,789 12.4
Equity 1,826,048 1,775,638 (2.8)
US$2,909,118 US$2,993,427 2.9
The Group’s total debt and equity capital increased by 2.9 percent as of March 31, 2016 primarily due
to net income generated during the period and increase in debt financing at CGSA to fund expansion
projects and capital expenditures, repayment of maturing loans and other general corporate
requirements.
2.6.2.1 Debt Financing
The table below provides the breakdown of the Group’s outstanding loans as of March 31, 2016:
Table 2.10 Outstanding Loans
(In thousands) Company
Final
Maturity Interest Rate Amount
Short-Term Debt
Unsecured US Dollar Term Loan CGSA 2016 Fixed US$4,009
Long-Term Debt
Unsecured US Dollar Bond ITBV 2023 -
2025
Fixed 746,643
Unsecured US Dollar Bond Parent 2020 Fixed 179,221
Secured US Dollar Term Loan CMSA 2027 Fixed 86,133
Unsecured US Dollar Term Loan CGSA 2016 -
2021
Fixed 31,677
Secured RMB Term Loam YICT 2016 Floating 29,012
Unsecured US Dollar Securities CGSA 2016 Fixed/Floating 10,434 Secured Euro Term Loan AGCT 2023 -
2024
Floating 9,235
Secured Pakistani Rupee Term Loan PICT 2017 Floating 8,560
1,100,915
Total Debt 1,104,924
Less current portion and short-term 61,999
Long-term debt, net of current portion US$1,042,925

SEC Form 17-Q Q1 2016 44 44
As of March 31, 2016, 83.8 percent of the Group’s total debt capital is held by the Parent Company
and ITBV which includes US$179.2 million senior notes issued in 2010 and due in 2020 and
US$746.6 million MTN issued in 2013 and 2015 which are due in 2023 to 2025.
The table below is a summary of debt maturities, net of unamortized debt issuance cost, of the Group
as of March 31, 2016:
Table 2.11 Outstanding Debt Maturities
(In thousands) Amount
2016 US$54,378
2017 13,124
2018 6,488
2019 6,900
2020 and onwards 1,020,025
Total US$1,100,915
Debt Financing Transactions in 2016
MTN Programme
On January 9, 2013, ICTSI Treasury B.V. (ICTSI Treasury), a majority-owned subsidiary through
ICTSI Ltd., established the MTN Programme that would allow ICTSI Treasury from time to time to
issue medium-term notes (MTN), unconditionally and irrevocably guaranteed by ICTSI and listed on
the Singapore Stock Exchange. The aggregate nominal amount of the MTN outstanding will not at
any time exceed US$750.0 million (or its equivalent in other currencies), subject to increase as
described in the terms and conditions of the Programme Agreement. In August 2013, the maximum
aggregate nominal amount of the MTN outstanding that may be issued under the Programme was
increased to US$1.0 billion.
Pursuant to the MTN Programme, on January 9, 2013, ICTSI Treasury and ICTSI signed a
Subscription Agreement with HSBC and UBS AG, Hong Kong Branch, for the issuance of 10-year
US$300.0 million guaranteed MTN (the “Original MTN”). The Original MTN were issued on
January 16, 2013 to mature on January 16, 2023 at a fixed interest rate of 4.625 percent p.a., net of
applicable taxes, set at a price of 99.014 and payable semi-annually in arrears. Moreover, on
January 28, 2013, an additional US$100.0 million guaranteed MTN was issued to form a single series
with the original MTN.
In June 2013, ICTSI purchased a total of US$6.0 million of ICTSI Treasury’s US$400.0 million MTN
at US$5.7 million.
In September 2013, ICTSI Treasury further issued US$207.5 million notes from the MTN Programme
at a fixed interest rate of 5.875 percent p.a. payable semi-annually and will be due in 2025 (“2025
Notes”), in exchange for US$178.9 million of ICTSI’s US$450.0 million senior notes due in 2020
(“2020 Notes”). Concurrent with the exchange offer, noteholders of the 2020 Notes provided their
consent to the modifications to the terms and conditions of the 2020 Notes to conform to the terms
and conditions of all the notes issued under the MTN Programme. Moreover, on April 30, 2014, an
additional US$75.0 million notes were issued to form a single series with the 2025 Notes.
In January 2015, an additional US$117.5 million notes were issued to form a single series with the
2025 Notes. Of this new issue, US$102.6 million was used to fund the exchange for US$91.8 million
of the 2020 Notes.
As of March 31, 2016, outstanding notes under the MTN Programme amounted to US$746.6 million.

SEC Form 17-Q Q1 2016 45 45
The aggregate net proceeds of the issuances under the MTN Programme were used to fund new
projects and capital expenditures, refinance some of ICTSI’s existing debt and for other general
corporate purposes.
Revolving Credit Facility Programme
On July 24, 2014, the Board of Directors of ICTSI approved the establishment of a loan facility
programme pursuant to which a subsidiary, IGFBV, may, from time to time, enter into one or more
loan facilities under the said programme to be guaranteed by ICTSI with one or more lenders.
In connection with the establishment of the said programme, the Board of Directors also approved the
first loan facility under the programme with IGFBV as the borrower and ICTSI as the guarantor. The
loan facility is a revolving credit facility with a principal amount of US$350.0 million, and a tenor of
five years and bears interest at LIBOR plus a spread of 1.95 percent.
On April 28, 2016, IGFBV drew US$150.0 million from the facility bearing interest of 2.3877% per
annum.
US dollar and Foreign Currency-denominated Term Loans and Securities
CGSA. In September 2015, CGSA obtained two-year unsecured loans from Banco Del Pacifico
amounting to US$2.0 million at a fixed interest rate of 8.75 percent and, Banco Bolivariano
amounting to US$2.0 million at a fixed interest rate of 8.83 percent. In February 2016, AGCT
obtained short-term unsecured US$ loans with a total of US$3.5 million from Banco Guayaquil S.A.,
Citibank and Banco Bolivariano at annual fixed interest rates ranging from 8.89% to 9.12%. In
January and February 2016, CGSA obtained two-year fixed-term US$ loans with a total of US$0.6
million from Banco del Pacifico at an interest rate of 8.75% per annum. On March 29, 2016, CGSA
(as “Borrower”), Metropolitan Bank and Trust Company (as “Lender”) and ICTSI (as “Surety”)
signed a loan agreement which consists of two tranches of loans amounting to US$32.5 million
(Tranche I) and US$7.5 million (Tranche II) with floating interest rates. Tranche I has a final
maturity in March 2021 while Tranche II in May 2017. On March 30, 2016, CGSA availed of loans
amounting to US$15.5 million under Tranche I and US$7.5 million under Tranche II. Portion of the
proceeds of these loans was used to refinance the unsecured US$ term-loan of CGSA amounting to
US$9.0 million on April 5, 2016. The aggregate outstanding balance of the Term Loans with Local
Banks in Ecuador amounted to US$31.7 million as of March 31, 2016.
YICT. The Company acquired, through the consolidation of YICT, the short and long-term loans of
DP World Yantai with outstanding balances of US$4.6 million (RMB 28.0 million) and
US$39.0 million (RMB 222.2 million) as of June 30, 2014, respectively. The short-term loan bears an
interest rate of 6.15 percent per annum and will mature on April 30, 2015. On the other hand, the
long-term loan with Agricultural Bank of China, which was availed principally to finance the
development project related to the construction of the container terminal, bears an interest rate of
6.15 percent per annum and will mature on December 7, 2014. On December 8, 2014, YICT signed a
two-year loan agreement to refinance the long-term loan bearing a lower interest rate of 6.0 percent
per annum. The short-term loan has been fully repaid in March 2015. As of March 31, 2016, the
outstanding balances of the long-term loan of YICT amounted to US$29.0 million
(RMB 187.2 million).
PICT. On July 11, 2011, PICT signed a five-year Rs.2.5 billion (equivalent to US$29.1 million)
Agreement for Financing on Mark-up Basis with Faysal Bank Limited. The loan carries mark-up at
the rate of six months Karachi Interbank Offered Rate (KIBOR) plus 1.75 percent and is secured
against all present and future property and equipment and underlying port infrastructures of the
concession right. Principal is repayable in nine equal semi-annual installments commencing in July
2012. Proceeds of the loan were partially used to fully pay the loans with International Finance
Corporation and Organization of the Petroleum Exporting Countries Fund for International
Development amounting to Rs.2.4 billion (US$27.9 million) on July 22, 2011 which were originally

SEC Form 17-Q Q1 2016 46 46
maturing in January 2018. The loan with remaining balance of Rs.1.5 billion was refinanced by Habib
Bank Limited. The new loan carries a mark-up at the rate of six months KIBOR plus 0.75 percent and
is secured against all present and future property and equipment and underlying port infrastructures of
the concession right. Principal is repayable in five equal semi-annual installments commencing in
June 2015. As of March 31, 2016, outstanding principal balance of the loan amounted to
US$8.6 million (Rs.896.3 million).
CMSA. On October 21, 2015, CMSA signed a US$260.0 million Project Finance Facility with
International Finance Corporation and Inter-American Development Bank (IADB). The CMSA
Project (the Project) is for the development and operation of a Specialized Container terminal at the
Port of Manzanillo in Manzanillo, Mexico. The terminal will have a capacity of 2.2 million TEUs
when completely built. The development will be done in three phases with phase one creating
capacity of 750,000 TEUs. Phase two, which is expected to be completed by year 2020, will increase
the terminal’s capacity to 1.150 million TEUs. The financing package, which has a tenor of 12 years
and a long availability period of four years, will help CMSA finance the completion of phases one and
two of the Project. Interest is payable semi-annually based on floating interest rate computed at 6-
month LIBOR plus loan spread with a weighted average of 2.80 percent. CMSA has drawn US$95.0
million from the facility in December 2015. As of March 31, 2016, outstanding principal balance of
the loan amounted to US$86.1 million.
2.6.2.2 Loan Covenants
The loans from local and foreign banks impose certain restrictions with respect to corporate
reorganization, disposition of all or a substantial portion of ICTSI’s and subsidiaries’ assets,
acquisitions of futures or stocks, and extending loans to others, except in the ordinary course of
business. ICTSI is also required to maintain specified financial ratios relating to their debt to
EBITDA, debt to equity and earnings level relative to current debt service obligations. As of
March 31, 2016, ICTSI and subsidiaries are in compliance with their loan covenants.
There was no material change in the covenants related to the Group’s long-term debts. As at
March 31, 2016, the Group has complied with its loan covenants.
2.6.2.3 Equity Financing
Perpetual Capital Securities
On January 29, 2015, RCBV issued US$300.0 million 6.25 percent Senior Guaranteed Perpetual
Capital Securities unconditionally and irrevocably guaranteed by ICTSI at a price of 99.551 percent or
US$298.7 million. The new issue was partly used to finance the tendered US$230.0 million 8.375
percent Subordinated Guaranteed Perpetual Capital Securities (“Original Securities) at a tender price
of 107.625 or US$247.5 million. The cash proceeds received by RCBV amounted to US$46.7
million, net of debt issue cost.
On August 18, 2015, RCBV issued US$450.0 million 5.50 percent Senior Guaranteed Perpetual
Capital Securities (“New Securities”) unconditionally and irrevocably guaranteed by ICTSI. The
cash proceeds received by RCBV amounted to US$436.3 million, net of debt issue cost, will be used
for refinancing, funding capital expenditures and general corporate purposes.
On March 10, 2016, RCBV (the “Issuer”) and ICTSI (the “Guarantor”) sent a notice to The Hong
Kong and Shanghai Banking Corporation Limited (HSBC, as “Trustee” and “Agent”) for the
redemption of the remaining US$108.3 million of the US$350-million Subordinated Guaranteed
Perpetual Capital Securities (“Securities”) and payment of accrued distributions on May 5, 2016.

SEC Form 17-Q Q1 2016 47 47
2.7 Risks
ICTSI and its subsidiaries’ geographically diverse operations expose the Group to various market
risks, particularly foreign exchange risk, interest rate risk and liquidity risk, which movements may
materially impact the financial results of the Group. The importance of managing these risks has
significantly increased in light of the heightened volatility in both the Philippine and international
financial markets.
With a view to managing these risks, the Group has incorporated a financial risk management
function in its organization, particularly in the treasury operations.
2.7.1 Foreign Exchange Risk
The Group has geographically diverse operations and transacts in currencies other than its functional
currency. Consequently, the Group is exposed to the risk of fluctuation of the exchange rates between
the US dollar and other local currencies such as Philippine Peso, BRL, MXN and EUR that may
adversely affect its results of operations and financial position. The Group attempts to match its
revenues and expenses whenever possible and, from time to time, engages in hedging activities.
Changes in exchange rates affect the US dollar value of the Group’s revenues and costs that are
denominated in foreign currencies.
The Group’s non-US dollar currency-linked revenues were 51.0 percent and 45.0 percent of gross
revenues for the periods ended March 31, 2015 and 2016, respectively. Foreign currency-linked
revenues include the following: (1) arrastre charges of MICT; and (2) non-US dollar revenues of
international subsidiaries. ICTSI incurs expenses in foreign currency for the operating and start up
requirements of its international subsidiaries. Concession fees payable to port authorities in certain
countries are either denominated in or linked to the US dollar.
The table below provides the currency breakdown of the Group’s revenue for the first quarter ended
March 31, 2016:
Table 2.12 Revenue Currency Profile
Subsidiary USD/EUR Composition Local Currency
ICTSI 41 % USD 59 % PhP
SBITC/ICTSI Subic 66 % USD 34 % PhP
DIPSSCOR 100 % PhP HIPS 100 % PhP
SCIPSI 100 % PhP
BIPI 100 % PhP MICTSI 100 % PhP
LGICT 100 % PhP
BCT 73 % USD/1 % EUR 26 % PLN TSSA 100 % BRL
MICTSL 100 % EUR* PTMTS 100 % IDR
YICT 100 % RMB
AGCT 76 % EUR 24 % HRK CGSA 100 % USD
NMCTS 100% BND
ICTSI Oregon 100 % USD BICT 100 % USD
PICT 76 % USD 24 % PKR
OJA 76 % USD 24 % IDR CMSA 44 % USD 56 % MXN
OPC 100 % USD
ICTSI Iraq 95 % USD 5 % IQD Tecplata 100 % USD
*MGA pegged to the EURO

SEC Form 17-Q Q1 2016 48 48
2.7.2 Interest Rate Risk
The Group’s exposure to market risk for changes in interest rates (cash flow interest rate risk) relates
primarily to the Group’s bank loans and is addressed by a periodic review of the Group’s debt mix
with the objective of reducing interest cost and maximizing available loan terms.
Interest Rate Swap. In 2014, AGCT entered into an interest rate swap transaction to hedge the interest
rate exposure on its floating rate Euro-denominated loan maturing in 2023. A notional amount of
EUR5.1 million (US$6.2 million) in 2013 and EUR3.8 million (US$4.6 million) in 2014 out of the
total EUR10.6 million (US$12.8 million) floating rate loan was swapped to fixed rate. Under the
interest rate swap, AGCT pays fixed interest of 6.19 percent for EUR5.1 million and 5.55 percent for
EUR3.8 million and receives floating rate of one-month EURIBOR plus 4.20 bps on the notional
amount. As of March 31, 2016, the market valuation loss on the outstanding interest rate swap
amounted to EUR0.4 million (US$0.5 million).
2.7.3 Liquidity Risk
The Group manages its liquidity profile to be able to finance its working capital and capital
expenditure requirements through internally generated cash and proceeds from debt and/or equity. As
part of the liquidity risk management, the Group maintains strict control of its cash and makes sure
that excess cash held by subsidiaries are up streamed timely to the Parent Company. The Group also
monitors the receivables and payables turnover to ensure that these are at optimal levels. In addition,
it regularly evaluates its projected and actual cash flow information and continually assesses the
conditions in the financial market to pursue fund raising initiatives. These initiatives may include
accessing bank loans, project finance facilities and the debt capital markets.
ICTSI monitors and maintains a level of cash and cash equivalents and bank credit facilities deemed
adequate to finance the Group’s operations, ensure continuity of funding and to mitigate the effects of
fluctuations in cash flows.
There are no other known trends, demands, commitments, events or uncertainties that will materially
affect the company’s liquidity.

SEC Form 17-Q Q1 2016 49 49
PART II – OTHER INFORMATION
There are no other information not previously reported in SEC Form 17-C that need to be reported in
this section.

SEC Form 17-Q Q1 2016 50 50
ANNEX 1
INTERNATIONAL CONTAINER TERMINAL SERVICES, INC.
AND SUBSIDIARIES
SCHEDULE OF AGING OF RECEIVABLES
As of March 31, 2016
(Unaudited, in Thousands)
Trade Advances Total
Under six months US$74,878 US$11,416 US$86,294
Six months to one year 665 420 1,085
Over one year 767 2,264 3,031
US$76,310 US$14,100 US$90,410

SEC Form 17-Q Q1 2016 51 51
ANNEX 2
INTERNATIONAL CONTAINER TERMINAL SERVICES, INC.
AND SUBSIDIARIES
FINANCIAL SOUNDNESS INDICATORS
As of and for the Three Months Ended March 31
2015 2016
Liquidity ratios
Current ratio(a)
1.42 0.99
Interest rate coverage ratio(b)
8.97 6.65
Solvency ratios
Debt to equity ratio(c)
0.70 0.69
Asset to equity ratio(d)
2.27 2.21
Profitability ratio
EBITDA margin(e)
43.1% 45.8%
(a) Current assets over current liabilities
(b) EBITDA over interest expense and financing charges on borrowings
(c) Interest-bearing debts over total equity
(d) Total assets over total equity
(e) EBITDA over gross revenues from port operations

SEC Form 17-Q Q1 2016 52 52
ANNEX 3
INTERNATIONAL CONTAINER TERMINAL SERVICES, INC.
AND SUBSIDIARIES
LIST OF EFFECTIVE PFRS STANDARDS AND INTERPRETATIONS*
March 31, 2016
PHILIPPINE FINANCIAL REPORTING STANDARDS
AND INTERPRETATIONS
Effective as of January 1, 2016
Adopted Not Adopted Not
Applicable
Framework for the Preparation and Presentation of
Financial Statements
Conceptual Framework Phase A: Objectives and qualitative
characteristics
PFRSs Practice Statement Management Commentary
Philippine Financial Reporting Standards
PFRS 1
(Revised)
First-time Adoption of Philippine Financial
Reporting Standards
Amendments to PFRS 1 and PAS 27: Cost of an
Investment in a Subsidiary, Jointly Controlled
Entity or Associate
Amendments to PFRS 1: Additional Exemptions for
First-time Adopters
Amendment to PFRS 1: Limited Exemption from
Comparative PFRS 7 Disclosures for First-time
Adopters
Amendments to PFRS 1: Severe Hyperinflation and
Removal of Fixed Date for First-time Adopters
Amendments to PFRS 1: Government Loans
Amendments to PFRS 1: Borrowing Costs
Amendments to PFRS 1: Meaning of Effective
PFRS
PFRS 2 Share-based Payment
Amendments to PFRS 2: Vesting Conditions and
Cancellations
Amendments to PFRS 2: Group Cash-settled Share-
based Payment Transactions
Amendments to PFRS 2: Definition of Vesting
Conditions
PFRS 3
(Revised)
Business Combinations
Amendments to PFRS 3: Accounting for
Contingent Consideration in a Business
Combination
Amendments to PFRS 3: Scope Exceptions for
Joint Arrangements
PFRS 4 Insurance Contracts
Amendments to PAS 39 and PFRS 4: Financial
Guarantee Contracts
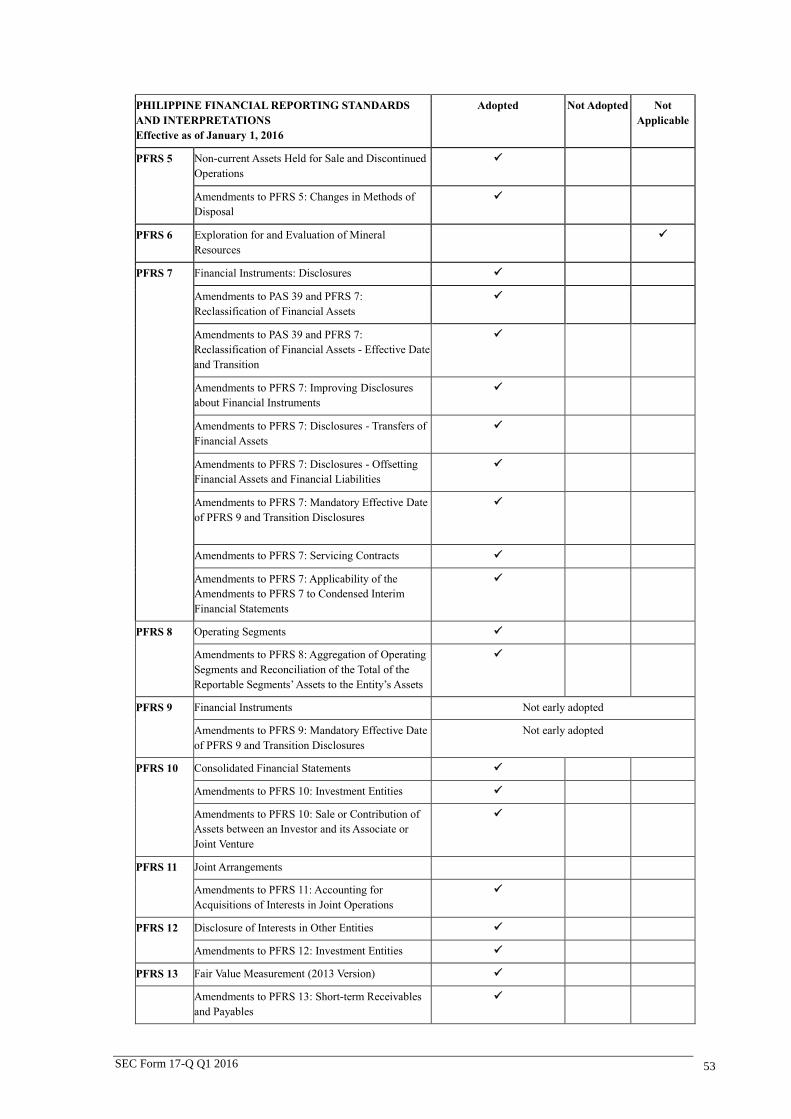
SEC Form 17-Q Q1 2016 53 53
PHILIPPINE FINANCIAL REPORTING STANDARDS
AND INTERPRETATIONS
Effective as of January 1, 2016
Adopted Not Adopted Not
Applicable
PFRS 5 Non-current Assets Held for Sale and Discontinued
Operations
Amendments to PFRS 5: Changes in Methods of
Disposal
PFRS 6 Exploration for and Evaluation of Mineral
Resources
PFRS 7 Financial Instruments: Disclosures
Amendments to PAS 39 and PFRS 7:
Reclassification of Financial Assets
Amendments to PAS 39 and PFRS 7:
Reclassification of Financial Assets - Effective Date
and Transition
Amendments to PFRS 7: Improving Disclosures
about Financial Instruments
Amendments to PFRS 7: Disclosures - Transfers of
Financial Assets
Amendments to PFRS 7: Disclosures - Offsetting
Financial Assets and Financial Liabilities
Amendments to PFRS 7: Mandatory Effective Date
of PFRS 9 and Transition Disclosures
Amendments to PFRS 7: Servicing Contracts
Amendments to PFRS 7: Applicability of the
Amendments to PFRS 7 to Condensed Interim
Financial Statements
PFRS 8 Operating Segments
Amendments to PFRS 8: Aggregation of Operating
Segments and Reconciliation of the Total of the
Reportable Segments’ Assets to the Entity’s Assets
PFRS 9 Financial Instruments Not early adopted
Amendments to PFRS 9: Mandatory Effective Date
of PFRS 9 and Transition Disclosures
Not early adopted
PFRS 10 Consolidated Financial Statements
Amendments to PFRS 10: Investment Entities
Amendments to PFRS 10: Sale or Contribution of
Assets between an Investor and its Associate or
Joint Venture
PFRS 11 Joint Arrangements
Amendments to PFRS 11: Accounting for
Acquisitions of Interests in Joint Operations
PFRS 12 Disclosure of Interests in Other Entities
Amendments to PFRS 12: Investment Entities
PFRS 13 Fair Value Measurement (2013 Version)
Amendments to PFRS 13: Short-term Receivables
and Payables

SEC Form 17-Q Q1 2016 54 54
PHILIPPINE FINANCIAL REPORTING STANDARDS
AND INTERPRETATIONS
Effective as of January 1, 2016
Adopted Not Adopted Not
Applicable
Amendments to PFRS 13: Portfolio Exception
PFRS 14 Regulatory Deferral Accounts
IFRS 15 Revenue from Contracts with Customers Not early adopted
IFRS 16 Leases Not early adopted
Philippine Accounting Standards
PAS 1
(Revised)
Presentation of Financial Statements
Amendment to PAS 1: Capital Disclosures
Amendments to PAS 32 and PAS 1: Puttable
Financial Instruments and Obligations Arising on
Liquidation
Amendments to PAS 1: Presentation of Items of
Other Comprehensive Income
Amendments to PAS 1: Clarification of the
Requirements for Comparative Presentation
Amendments to PAS 1: Disclosure Initiative
PAS 2 Inventories
PAS 7 Statement of Cash Flows
PAS 8 Accounting Policies, Changes in Accounting
Estimates and Errors
PAS 10 Events after the Reporting Period
PAS 11 Construction Contracts
PAS 12 Income Taxes
Amendment to PAS 12 - Deferred Tax: Recovery of
Underlying Assets
PAS 16 Property, Plant and Equipment
Amendment to PAS 16: Classification of Servicing
Equipment
Amendment to PAS 16: Revaluation Method -
Proportionate Restatement of Accumulated
Depreciation
Amendment to PAS 16: Clarification of Acceptable
Methods of Depreciation
Amendment to PAS 16: Bearer Plants
PAS 17 Leases
PAS 18 Revenue
PAS 19
(Amended)
Employee Benefits
Amendments to PAS 19: Defined Benefit Plans:
Employee Contributions
Amendments to PAS 19: Regional market issue
regarding discount rate
PAS 20 Accounting for Government Grants and Disclosure
of Government Assistance
PAS 21 The Effects of Changes in Foreign Exchange Rates
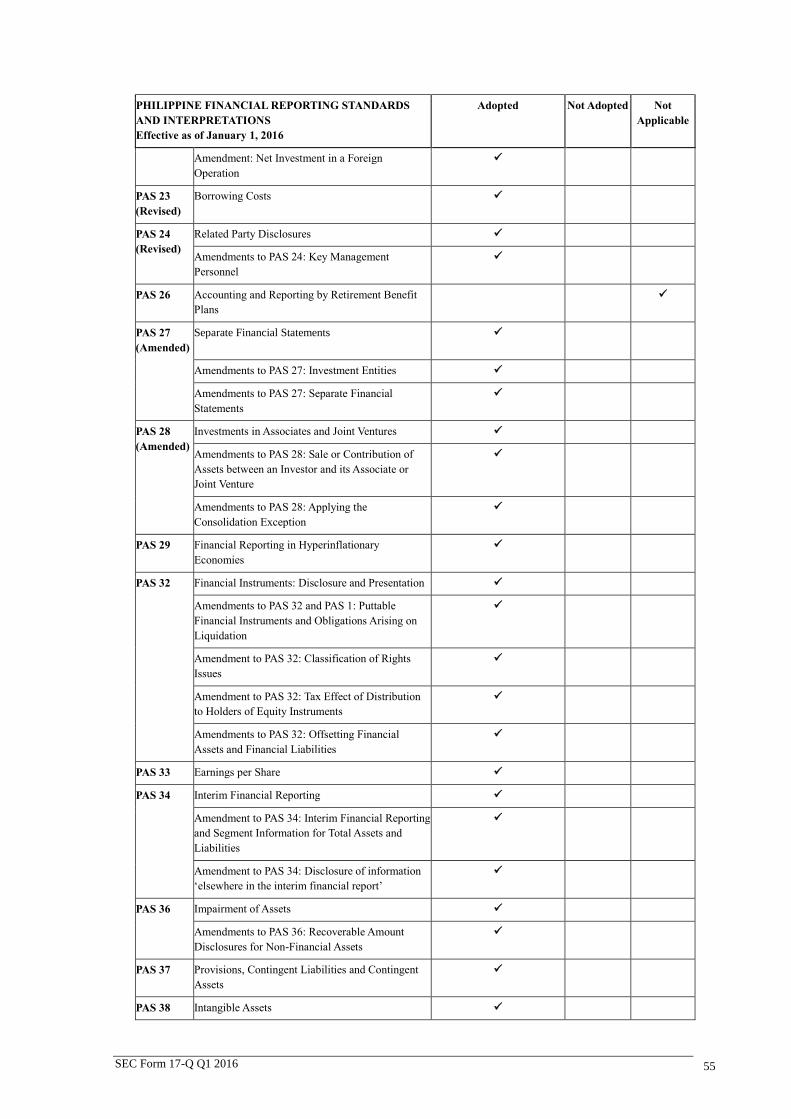
SEC Form 17-Q Q1 2016 55 55
PHILIPPINE FINANCIAL REPORTING STANDARDS
AND INTERPRETATIONS
Effective as of January 1, 2016
Adopted Not Adopted Not
Applicable
Amendment: Net Investment in a Foreign
Operation
PAS 23
(Revised)
Borrowing Costs
PAS 24
(Revised)
Related Party Disclosures
Amendments to PAS 24: Key Management
Personnel
PAS 26 Accounting and Reporting by Retirement Benefit
Plans
PAS 27
(Amended)
Separate Financial Statements
Amendments to PAS 27: Investment Entities
Amendments to PAS 27: Separate Financial
Statements
PAS 28
(Amended)
Investments in Associates and Joint Ventures
Amendments to PAS 28: Sale or Contribution of
Assets between an Investor and its Associate or
Joint Venture
Amendments to PAS 28: Applying the
Consolidation Exception
PAS 29 Financial Reporting in Hyperinflationary
Economies
PAS 32 Financial Instruments: Disclosure and Presentation
Amendments to PAS 32 and PAS 1: Puttable
Financial Instruments and Obligations Arising on
Liquidation
Amendment to PAS 32: Classification of Rights
Issues
Amendment to PAS 32: Tax Effect of Distribution
to Holders of Equity Instruments
Amendments to PAS 32: Offsetting Financial
Assets and Financial Liabilities
PAS 33 Earnings per Share
PAS 34 Interim Financial Reporting
Amendment to PAS 34: Interim Financial Reporting
and Segment Information for Total Assets and
Liabilities
Amendment to PAS 34: Disclosure of information
‘elsewhere in the interim financial report’
PAS 36 Impairment of Assets
Amendments to PAS 36: Recoverable Amount
Disclosures for Non-Financial Assets
PAS 37 Provisions, Contingent Liabilities and Contingent
Assets
PAS 38 Intangible Assets

SEC Form 17-Q Q1 2016 56 56
PHILIPPINE FINANCIAL REPORTING STANDARDS
AND INTERPRETATIONS
Effective as of January 1, 2016
Adopted Not Adopted Not
Applicable
Amendments to PAS 38: Revaluation Method -
Proportionate Restatement of Accumulated
Amortization
Amendments to PAS 38: Clarification of
Acceptable Methods of Amortization
PAS 39 Financial Instruments: Recognition and
Measurement
Amendments to PAS 39: Transition and Initial
Recognition of Financial Assets and Financial
Liabilities
Amendments to PAS 39: Cash Flow Hedge
Accounting of Forecast Intragroup Transactions
Amendments to PAS 39: The Fair Value Option
Amendments to PAS 39 and PFRS 4: Financial
Guarantee Contracts
Amendments to PAS 39 and PFRS 7:
Reclassification of Financial Assets
Amendments to PAS 39 and PFRS 7:
Reclassification of Financial Assets - Effective Date
and Transition
Amendments to Philippine Interpretation IFRIC-9
and PAS 39: Embedded Derivatives
Amendment to PAS 39: Eligible Hedged Items
Amendment to PAS 39: Novation of Derivatives
and Continuation of Hedge Accounting
PAS 40 Investment Property
Amendment to PAS 40: Investment Property
PAS 41 Agriculture
Amendment to PAS 41: Bearer Plants
Philippine Interpretations
IFRIC 1 Changes in Existing Decommissioning, Restoration
and Similar Liabilities
IFRIC 2 Members' Share in Co-operative Entities and
Similar Instruments
IFRIC 4 Determining Whether an Arrangement Contains a
Lease
IFRIC 5 Rights to Interests arising from Decommissioning,
Restoration and Environmental Rehabilitation
Funds
IFRIC 6 Liabilities arising from Participating in a Specific
Market - Waste Electrical and Electronic
Equipment
IFRIC 7 Applying the Restatement Approach under PAS 29
Financial Reporting in Hyperinflationary
Economies
IFRIC 8 Scope of PFRS 2

SEC Form 17-Q Q1 2016 57 57
PHILIPPINE FINANCIAL REPORTING STANDARDS
AND INTERPRETATIONS
Effective as of January 1, 2016
Adopted Not Adopted Not
Applicable
IFRIC 9 Reassessment of Embedded Derivatives
Amendments to Philippine Interpretation IFRIC-9
and PAS 39: Embedded Derivatives
IFRIC 10 Interim Financial Reporting and Impairment
IFRIC 11 PFRS 2- Group and Treasury Share Transactions
IFRIC 12 Service Concession Arrangements
IFRIC 13 Customer Loyalty Programmes
IFRIC 14 The Limit on a Defined Benefit Asset, Minimum
Funding Requirements and their Interaction
Amendments to Philippine Interpretations IFRIC-
14, Prepayments of a Minimum Funding
Requirement
IFRIC 15 Agreements for Construction of Real Estate
IFRIC 16 Hedges of a Net Investment in a Foreign Operation
IFRIC 17 Distributions of Non-cash Assets to Owners
IFRIC 18 Transfers of Assets from Customers
IFRIC 19 Extinguishing Financial Liabilities with Equity
Instruments
IFRIC 20 Stripping Costs in the Production Phase of a
Surface Mine
IFRIC 21 Levies
SIC-7 Introduction of the Euro
SIC-10 Government Assistance - No Specific Relation to
Operating Activities
SIC-12 Consolidation - Special Purpose Entities
Amendment to SIC - 12: Scope of SIC 12
SIC-13 Jointly Controlled Entities - Non-Monetary
Contributions by Venturers
SIC-15 Operating Leases - Incentives
SIC-25 Income Taxes - Changes in the Tax Status of an
Entity or its Shareholders
SIC-27 Evaluating the Substance of Transactions Involving
the Legal Form of a Lease
SIC-29 Service Concession Arrangements: Disclosures.
SIC-31 Revenue - Barter Transactions Involving
Advertising Services
SIC-32 Intangible Assets - Web Site Costs

INTERNATIONAL CONTAINER TERMINAL SERVICES, INC. (ICTSI)
AHI
Abbotsford
Holdings, Inc.
(Phils.)
CGSA
Contecon Guayaquil
S.A. (Ecuador)
IWI
ICTSI Warehousing,
Inc. (Phils.)
TICT
Tartous Int’l Cont.
Terminal, JSC
(Syria)
PRIME STAFFERS
Prime Staffers &
Selection Bureau,
Inc. (Phils.)
ICTHI
Int’l Cont. Terminal
Holdings, Inc.
(Cayman Islands)
MICTSI
Mindanao Int’l Container
Terminal Services, Inc.
(Phils.)
ICTSI (M.E.) DMCC
(Dubai, UAE)
SCIPSI
South Cotabato
Integrated Ports
Services, Inc. (Phils.)
CORDILLA
Cordilla Properties
Holdings (Phils.)
TMT
Terminal Maritima
de Tuxpan, S.A. de
C.V.
(Mexico)
ICTSI SUBIC INC.
New Container
Terminal (NCT) 2,
Subic Bay
ICTSI Ltd.
ICTSI Ltd.
(Bermuda)
DIPSSCOR
Davao Int’d Port &
Stevedoring
Services Corp.
(Phils.)
SBITC
Subic Bay Int’l
Terminal Corp.
(Phils.)
IW CARGO
IW Cargo Handlers,
Inc. (Phils.)
BIPI
Bauan Int’l Ports,
Inc. (Phils.)
CTSSI Phils.
Cont. Term. Sys.
Sols., Phils., Inc.
(Phils.)
PIHL
Pentland Int’l
Holdings Ltd.
(British Virgin
Isles)
ICTSI Mauritius
ICTSI Mauritius Ltd.
(Rep. of Mauritius)
MICTSL
Madagascar Int’l
Cont. Terminal
Servs, Ltd.
(Madagascar)
ICTSI Far East
ICTSI Far East PTE.
Ltd. (Singapore)
GPL
Global Procurement
Ltd.
(Bermuda)
ICTSI Africa (Pty)
Ltd.
Cape Town, South
Africa
CUSA
C. Ultramar S.A
(Panama)
FWSA
Future Water
S.A.
(Panama)
KEI
Kinston
Enterprises, Inc.
(Panama)
IHKL
ICTSI
(Hong Kong) Ltd.
(Hong Kong)
ICTSI Georgia
ICTSI Georgia Corp.
(Cayman Isles)
AICTL
Australian Cont.
Terminals, Ltd.
(Australis)
CTVCC
Container Terminal
de Venezuela
Conterven C.A.
(Venezuela)
ICTSI South Asia
Pte. Ltd.
(Singapore)
IOI
ICTSI Oregon
Inc.(Portland, USA) ICON Logistiek
B.V.
(Netherlands)
PT CTSSI
PT Container Term.
Sys. Solns. Inc.
(Indonesia)
ICTS – India
International Container
Terminal Services
Private Limited (India)
NMCTS
New Muara Container
Terminal Services SDN
BHD (Brunei)
MTS
PT Makassar Term.
Services
(Indonesia)
SPIA
Sociedad Portuario
Industrial Aguadulce
S.A. (Colombia)
YICTL
Yantai International
Container Terminals
Ltd.(China)
BICT
Batumi Int’l
Cont. Term. LLC.
(Georgia)
ICTSI QFC LLC
(Qatar)
JASA
PT ICTSI Jasa
Prima Tbk
(Indonesia)
OJA
PT PBM Olah Jasa
Andal
(Indonesia)
ICTSI Cooperatief
U.A.
(Netherlands)
GCC BV
Global Container
Capital BV
(Netherlands)
ICTSI Tuxpan B.V.
(Netherlands)
SPIA Colombia
BV
(Netherlands)
TSSA BV
(Netherlands)
ITBV
ICTSI Treasury BV
(Netherlands)
HIJO
HIJO International
Port Services, Inc.
(Phils.)
AIL
Aeolina Investments
Limited
(British Virgin Islands)
PICT
Pakistan International
Container Terminal
(Pakistan)
As of March 31, 2016
ICTSI Honduras
ICTSI Honduras
Ltd.
(Bermuda)
OPC
Operadora Portuaria
Centroamericana,
S.A. de C.V.
(Honduras)
TECPLATA B.V.
(Netherlands)
ICTSI Americas
B.V.
(Netherlands)
Crixus Limited
(British Virgin Islands)
TSSA
Tecon Suape S.A.
(Brazil)
VICTLVictoria International
Container Terminal
Limited
(Australia)
ICTSI Cameroon
B.V.
(Netherlands)
ICTSI Africa B.V.
(Netherlands)
ICTSI DR CONGO
S.A.
(Congo)
ICTSI Ltd. RHQ
(Manila)
ICTSI Global
Finance B.V.
(Netherlands)
ICBV
ICTSI Capital B.V.
(Netherlands)
CMSA BV
(Netherlands)
CGSA BV
(Netherlands)
ICTSI Oceania
B.V.
(Netherlands)
LICTSLE
Lekki International
Container Terminal
Services LFTZ
Enterprises
(Nigeria)
APPH
Asia Pacific Port
Holdings Pte. Ltd.
(Singapore)
RCBV
Royal Capital BV
(Netherlands)
SPIA Spain SL
(Spain)
AGCT
Adriatic Gate
Container
Terminal (Croatia)
BCT
Baltic Container
Terminal Ltd.
(Poland)
LGICT
Laguna Gateway Inland
Container Terminal Inc.
(Phils.)
CMSA
Contecon
Manzanillo S.A.
( Mexico)
CGSA
Transportadora SL
(Spain)
ICTSI Ltd. –
Regional
Operating
Headquarters
(Phils.)
ICTSI Project
Delivery Services
Co. Pte. Ltd.
(Singapore)
IPSAL
Int’l Ports of South
America and
Logistics S.A.
(Uruguay)
TECPLATA
Tecplata S.A.
(Argentina)
NUEVOS PUERTOS
Nuevos Puertos S.A.
(Argentina)
ICTSI APBSI
ICTSI Asia Pacific
Business Services,
Inc.
(Phils.)
SBITHI
Subic Bay Int’l
Terminal Holdings,
Inc. (Phils.)
IGC U.A.
ICTSI Global
Cooperatief U.A.
(Netherlands)
ICTSI Middle East
DMCC
(Dubai)
ICTSI (M.E.) DMCC
Iraq Branch
(Iraq)
INTERNATIONAL CONTAINER TERMINAL SERVICES, INC. AND SUBSIDIARIES
Map of Subsidiaries
March 31, 2016
ICTSI Form 17Q1 2016