Integration of highly dimensional biological data sets with multivariate analysis - Kim-Anh Lê Cao
29
mixOmics and intro Data integration Time course data Cross-platform Conclusions Integration of highly dimensional biological data sets with multivariate analysis Kim-Anh Lê Cao Queensland Facility for Advanced Bioinformatics The University of Queensland Kim-Anh Lê Cao AMATA 2013
-
Upload
australian-bioinformatics-network -
Category
Technology
-
view
617 -
download
2
description
1. It is all about mixOmics? 2. What is the common information contained in different experiments? 3. What are the correlated features across different time course experiments? 4. Can we combine similar experiments performed in different labs or/and on different platforms?
Transcript of Integration of highly dimensional biological data sets with multivariate analysis - Kim-Anh Lê Cao

mixOmics and intro Data integration Time course data Cross-platform Conclusions
Integration of highly dimensionalbiological data sets with multivariate
analysis
Kim-Anh Lê Cao
Queensland Facility for Advanced BioinformaticsThe University of Queensland
Kim-Anh Lê Cao
AMATA 2013

mixOmics and intro Data integration Time course data Cross-platform Conclusions
In God we trust, all others must bringdata.(W. Edwards Deming)
Kim-Anh Lê Cao
AMATA 2013

mixOmics and intro Data integration Time course data Cross-platform Conclusions
Outline of this talk and research questions
1 It is all about mixOmics2 What is the common information contained in different
experiments?3 What are the correlated features across different time course
experiments?4 Can we combine similar experiments performed in different
labs or/and on different platforms?
Kim-Anh Lê Cao
AMATA 2013

mixOmics and intro Data integration Time course data Cross-platform Conclusions
Philosophy
mixOmics: philosophy
is originally an R package developed for thestatistical exploration and integration of large biological data sets.
Development of statistical multivariate approachesVariable selection included in the methodologiesGraphical outputsUser-friendly use: website, R package, web interface
First R CRAN release in May 2009.
Lê Cao et al. mixOmics: an R package to unravel relationships between two omics
data sets, Bioinformatics, 25 (21).
Kim-Anh Lê Cao
AMATA 2013

mixOmics and intro Data integration Time course data Cross-platform Conclusions
Framework
Framework
One$data$set$PCA$IPCA$
PLS/DA$
MULTIVARIATE$$APPROACH$
GRAPHICAL$$OUTPUTS$
Sample$plots$
Variable$plots$
PRE$PROCESSING$
Two$matching$data$sets$
NIPALS$
mulF/group$
Smoothing$splines$
rGCCA$
ExploraF
on$
IntegraF
on$
$INPUT$DATA$
Missing$values$
Time$Course$
Comparison$across$$
plaIorms$
rCCA$
PLS$
PLS$MulFlevel$
Repeated$measurements$
More$than$two$data$sets$
Kim-Anh Lê Cao
AMATA 2013

mixOmics and intro Data integration Time course data Cross-platform Conclusions
Web interface
Web interface
http://www.qfab.org/mixomics/
Kim-Anh Lê Cao
AMATA 2013

mixOmics and intro Data integration Time course data Cross-platform Conclusions
Introduction with PCA
Principal Component Analysis: an introductionSeek the best directions in the data that account for most of thevariability
→ principal components: artificial variablesthat are linear combinations of the originalvariables:
c1 = w1x1 + w2x2 + · · ·+ wpxp −1.0 −0.5 0.0 0.5 1.0
−0.4
−0.2
0.0
0.2
0.4
x1
x2
wherec1 is the first principal component with max. variance{w1, . . . ,wp} are the weights in the linear combination{x1, . . . , xp} are the gene expression profiles.
All PCs are mutually orthogonal. (c1, c2, . . . )
Kim-Anh Lê Cao
AMATA 2013

mixOmics and intro Data integration Time course data Cross-platform Conclusions
Introduction with PCA
The new PCs form a a smaller subspaceof dimension < p
Project the data on these new axes tosummarize the information related tothe variance.
−1.0 −0.5 0.0 0.5 1.0
−0.4
−0.2
0.0
0.2
0.4
z1
z2
→ approximate representation of the data points in a lowerdimensional space
PCA should be a compulsory first step in exploratory data analysisto:
Have a first understanding of the underlying data structureIdentify bias, experimental errors, batch effects
Kim-Anh Lê Cao
AMATA 2013

mixOmics and intro Data integration Time course data Cross-platform Conclusions
Dealing with high dimensional data
Problem with PCA: interpretation can be difficult with very largenumber of (possibly) irrelevant variables.
Remember that the principal components are linear combinations ofthe original variables:
c = w1x1 + w2x2 + · · ·+ wpxp
A clearer signal could be observed if some of the variable weights{w1, . . . ,wp} could be set to 0 for the irrelevant variables:
c = 0 ∗ x1 + w2x2 + · · ·+ 0 ∗ xp
These variables weights are defined in the loading vectors.Important weights = important contribution to the PC.Similar weights = correlated variables.
Kim-Anh Lê Cao
AMATA 2013

mixOmics and intro Data integration Time course data Cross-platform Conclusions
Variable selection
sparse Principal Component Analysis: sPCA
Principal components
−1.0 −0.5 0.0 0.5 1.0
−0.4
−0.2
0.0
0.2
0.4
x1
x2
loading vectors(PCA)
0 20 40 60 80 100
0.0
00
.05
0.1
00
.15
loadin
g 1
0 20 40 60 80 100
0.0
00
.05
0.1
00
.15
loadin
g 2
sparse loading vectors(sPCA)
0 20 40 60 80 100
0.0
00
.05
0.1
00
.15
0 20 40 60 80 100
0.0
00
.05
0.1
00
.15
loadin
g 1
loadin
g 2
The principal components are linear combinations of the originalvariables, variables weights are defined in the associated loadingvectors.sparse PCA computes the sparse loading vectors to removeirrelevant variables using lasso penalizations (Shen & Huang 2008, J.
Multivariate Analysis).
Kim-Anh Lê Cao
AMATA 2013

mixOmics and intro Data integration Time course data Cross-platform Conclusions
Motivation
Integration of multiple data sets: what is the commoninformation contained in different experiments?
0"1"0"1"1"."."0"
."."."
1"2"."."."."n"
1"".".".".".".".".".".".".".".""."."p" 1""."."."."."."."."."."."."."."."."."."."."."."."."."q" 1""."."."."."."."."."r" 1"".".".".".".".".".".".".".""."s"
Statistical data integration, how to? Define the best components(linear combination of each data set variables) that are bestcorrelated with each other (RGCCA: Regularized Generalised CCA).
The same samples are measured across different experimentsSelect relevant biological entities which are correlated acrossthe different data setsEmphasis on graphical outputs to ease results interpretation
Kim-Anh Lê Cao
AMATA 2013

mixOmics and intro Data integration Time course data Cross-platform Conclusions
Example
ExampleKidney transplant study
Transcriptomics and proteomics studyof 40 patients with kidney transplant,rejecting (n1 = 20) or not (n2 = 20)the transplant, PROOF Centre, UBC.
Kim-Anh Lê Cao
AMATA 2013

mixOmics and intro Data integration Time course data Cross-platform Conclusions
Example
New developments include a sparse RGGCA (sGCCA) to selectcorrelated variables across the different platforms
Relevance networks Gonzales, Lê Caoet al. (2012), J. Data Mining
Kim-Anh Lê Cao
AMATA 2013

mixOmics and intro Data integration Time course data Cross-platform Conclusions
Motivation
Integration of time-course data: what are the correlatedfeatures across different time course experiments?
0"1"0"1"1"."."0"
1"2"."."."."n"
1""."."."."."."."."."..".".""."."p" 1""."."."."."."."."."."."."."."."."."."."."."."."."q" 1""."."."."."."."."."r" 1"".".".".".".".".".".".".".""."s"
Requires the same samples measured at several time pointVariable selection across platforms and timeHypothesize that correlated biological entities belong to thesame biological pathway
Kim-Anh Lê Cao
AMATA 2013

mixOmics and intro Data integration Time course data Cross-platform Conclusions
Modelling trajectories
Modelling trajectoriesUse cubic smoothing splinesto summarize each profile
Enables interpolation ofmissing values
There exists a theoretical link between smoothing splinesand linear mixed models (Verbyla et al. 1999).
Appropriate for correlated repeatedmeasuresNo parameters to tuneFlexibility of the modelAssesses the variability for eachfeature (technical , biologicalvariability)
●●
●
●
●
●
●
●●
●
●●
time
TP
M E
xpr
2025
3035
4045
50
d0 d6 d12 d18
Example on one CAGE cluster
● tech rep 1tech rep 2
Kim-Anh Lê Cao
AMATA 2013

mixOmics and intro Data integration Time course data Cross-platform Conclusions
Modelling trajectories
Step 1: use cubic smoothing splines to reduce one dimension(samples dimension)
Step 2: apply sGCCA on the estimated splines to identify correlatedprofiles both within and between the two data sets
→ modelisation of the trajectories→ filtering of the profiles→ integration of two types of data→ selection and clustering of the correlated time profiles
Kidney transplant study Transcriptomics and proteomics study of 40patients with kidney transplant, rejecting (n1 = 20) or not (n2 = 20) thetransplant. Follow up on 5 time points (weeks), PROOF Centre, UBC.
Kim-Anh Lê Cao
AMATA 2013

mixOmics and intro Data integration Time course data Cross-platform Conclusions
Some results
Variable representation: time profile clusters are selected
2 4 6 8 10
−1.
5−
1.0
−0.
50.
00.
51.
01.
5
time
expr
essi
on
dimension 1
2 4 6 8 10
−2
−1
01
2
time
expr
essi
on
dimension 2
2 4 6 8 10
−2
−1
01
2
time
expr
essi
on
dimension 3
The approach selects both transcripts and proteins which arepositively or negatively correlated across time
Quality of clusters decreases with the number of PLS components(dimensions) as obvious patterns cannot be extracted anymore
Kim-Anh Lê Cao
AMATA 2013

mixOmics and intro Data integration Time course data Cross-platform Conclusions
Example: sample representation
Sample representation: how the approach can extractcommon information across these different platforms
Project GrandioseLongitudinal study of cellreprogramming- 8 time points- 10 platforms: microarray,cell surface proteome, totalproteome, RNA-seq,miRNA...
See also keynote speaker Session 11 Nicole CloonanKim-Anh Lê Cao
AMATA 2013

mixOmics and intro Data integration Time course data Cross-platform Conclusions
Motivation
Cross-platform comparison: can we combine similarexperiments performed in different labs or with differentplatforms?
Not the same samples measured across different experimentsExperimental biases (batch effects)Well known fact: microarray experiments across studies bringdifferent results! “But I would very much like to compare mygene signature from my experiment to my colleagues’ genesignatures from their experiments!"
Aim: Identify genes diagnostic of the key characteristics of stemcells derived from independent studies
See contributed paper Session 9 Celena Heazlewood and Poster 46, Florian
RohartKim-Anh Lê Cao
AMATA 2013

mixOmics and intro Data integration Time course data Cross-platform Conclusions
The challenges
What is a ‘batch’ effect?
Boxplots of the samples (data normalised
per experiment)
0.6 0.8 1.0 1.2 1.4
0.6
0.8
1.0
1.2
1.4
1
1
●FibroblasthESChiPSC
BrennandJiaMaheraliNaylerZaehres
−50 0 50 100 150 200
−40
−20
020
40
PC1: 58.76 %
PC
2: 1
5.87
%
Classic PCA: Across platform 3 classes
PCA highlights a ‘lab effect’.→ Combining different experiments is a real challenge
Kim-Anh Lê Cao
AMATA 2013

mixOmics and intro Data integration Time course data Cross-platform Conclusions
The challenges
1""2"1"3"3"1"3"
1"2"."."."."n1"
1"".".".".".".".".".".""."."p"
1"2"."n2"1"2"."."."n3"1"2"."."."n4"
1""3"3"2"
1""2"1"1"2"3"
1""2"1"3"3"1"
."
."
."
X = several microarray experiments,performed in different labs but studyingthe same biological conditionsNot the same samples, but the samevariablesGroup = experiment/platform/labY = biological conditions→ Supervised problem
We propose: multi-group analysis for theselection of common biomarkers across thedata sets.
Kim-Anh Lê Cao
AMATA 2013

mixOmics and intro Data integration Time course data Cross-platform Conclusions
The challenges
Multi-group Analysis
Fig from A. Eslami
Individuals are a priori structuredinto several groupswithin group part: group structureeffect is removedbetween-group part: groupstructure effect is taken intoaccountPartial and global components andloading vectors
→ Understand and model the common stucture between thegroups and within each group→Two block multi-group analysis by the means of Partial LeastSquares regression (PLS)
Kim-Anh Lê Cao
AMATA 2013

mixOmics and intro Data integration Time course data Cross-platform Conclusions
The challenges
Multi-group PLS-DA
−50 0 50
−50
050
100
X−variate 1
X−
varia
te 2
PLS−DA, diff platforms 3 classes
●●●
●●
●●●
●●● ●●
●●
●
●●●●●
−50 0 50 100 150
−10
010
2030
comp 1
com
p 2
mg PLS−DA, Across platform 3 classes
0.6 0.8 1.0 1.2 1.4
0.6
0.8
1.0
1.2
1.4
1
1
●FibroblasthESChiPSC
BrennandJiaMaheraliNaylerZaehres
Classical PLSDA (LHS) vs multi-group PLSDA(RHS), the latter gives better (visual) results.
Kim-Anh Lê Cao
AMATA 2013
mixOmics and intro Data integration Time course data Cross-platform Conclusions
The challenges
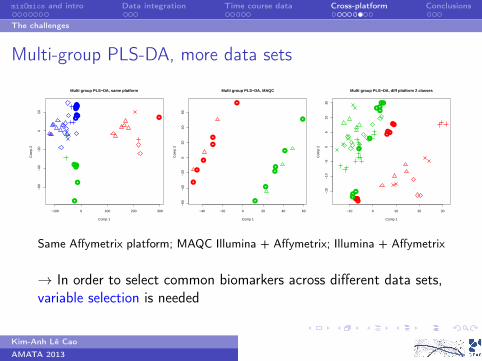
Multi-group PLS-DA, more data sets
●
●●
●
●
●●
●●●●●
●●
●●
−100 0 100 200 300
−60
−40
−20
020
Comp 1
Com
p 2
Multi group PLS−DA, same platform
●
●
●
●
●
●
●
●●
●
●
●
−40 −20 0 20 40 60
−60
−40
−20
020
4060
Comp 1
Com
p 2
Multi group PLS−DA, MAQC
●●
●●●
●●
●●●
●
●
●
●●●
●●
−10 0 10 20 30
−15
−10
−5
05
1015
Comp 1
Com
p 2
Multi group PLS−DA, diff platform 2 classes
Same Affymetrix platform; MAQC Illumina + Affymetrix; Illumina + Affymetrix
→ In order to select common biomarkers across different data sets,variable selection is needed
Kim-Anh Lê Cao
AMATA 2013

mixOmics and intro Data integration Time course data Cross-platform Conclusions
sparse multi-group PLSDA
sparse multi-group PLSDA and performance
●●●
●●
●●●
●●● ●●
●●
●
●●●●●
−50 0 50 100 150
−10
010
2030
comp 1
com
p 2
mg PLS−DA, Across platform 3 classes
●●●
●●
●●●
●●●
●●●
●●
●●●●●
−5 0 5 10 15 20
−5
05
10
comp 1
com
p 2
sparse mg PLS−DA, Across platform 3 classes
training set: circles,testing set: triangles withcolors as predicted
Table: Classif. error rate (10-fold CV)sameplatformK=3
diff.platformK=2
diff.platformK=3
#samples 53 70 82
#variables 22K 9K 9K
#groups 5 5 5
multi grp 8.9% 15.3% 16.1%
sparsemulti grp
7.7% 4.5% 10.6%
#selectedmarkers
40 30 20
Kim-Anh Lê Cao
AMATA 2013

mixOmics and intro Data integration Time course data Cross-platform Conclusions
Comparisons
Comparisons
●● ●
●●
●
●●
●●●
●●
●●
●
●●●
●
●
−0.1 0.0 0.1 0.2 0.3
−0.
10.
00.
10.
20.
30.
4
X−variate 1
X−
varia
te 2
(1)
●●●
●●
●●●
●●●
●●●
●●
●●●●●
−5 0 5 10 15 20
−5
05
10
comp 1
com
p 2
(2)
●●●
●●
●
●●
●●
●
●●
●●
●
●●●
●
●
0.0 0.1 0.2 0.3
−0.
10.
00.
10.
20.
3
comp 1
com
p 2
(3)
3 33 4 3
smgPLS sPLS
sPLS + ComBat
3 7 3
10
sPLS sPLS + ComBat
smgPLS
1 Data centered per group2 Multi group PLSDA3 ComBat Combating Batches of gene
expression microarray data (Johnson and Li,2007)
Kim-Anh Lê Cao
AMATA 2013

mixOmics and intro Data integration Time course data Cross-platform Conclusions
Conclusions
Multivariate integrative approaches are flexible and can answervarious types of questionsmixOmics implements 6 different methodologies plus theirsparse variantsData integration, variable selection, graphical outputsIncludes a web-associated interface (and soon through Galaxytoo)Help generating new hypotheses, further statistical tests
New additions! (still in development)Smoothing spline/LMM framework for the integration oftime-course dataMulti-group analysis to address a challenging current problemin molecular biology.
Kim-Anh Lê Cao
AMATA 2013

mixOmics and intro Data integration Time course data Cross-platform Conclusions
Un GRAND MERCI à ...
Data providersKidney transplant study
Oliver Günther UBCScott Tebutt UBCGrandiose project
Andras Nagy Univ. TorontoStemformatics team
Christine Wells UQ, Univ. GlasgowRowland Mosbergen UQOthmar Korn UQ
mixOmics teamSébastien Déjean Univ. TlseIgnacio González Univ. TlseXin Yi Chua QFAB
Methods developmentMultiple data integration
Arthur Tenenhaus Supelec ParisTime course
Jasmin Straube QFABKathy Ruggiero Univ. AucklandChristèle Robert INRA ToulouseCross-platform comparison
Stéphanie Bougeard ANSESAida Eslami ANSES, ONIRISFlorian Rohart AIBN UQ
Kim-Anh Lê Cao
AMATA 2013

mixOmics and intro Data integration Time course data Cross-platform Conclusions
Un GRAND MERCI à ...
Questions?
Springtime Bioinformatics TrainingWorkshops by QFAB (University ofQueensland)
RNA seq analysis, 4 Nov.Introduction to statististics forbiologists, 19-21 Nov.Variant detection, 22 Nov.Introduction to De Novo GenomeAssembly, 9 Dec.
http://www.math.univ-toulouse.fr/∼biostat/mixOmics
Kim-Anh Lê Cao
AMATA 2013


![Quôc Anh Lê To cite this version€¦ · Quôc Anh Lê. Expressive gesture model. Robotics [cs.RO]. Télécom ParisTech, 2013. English. NNT: 2013ENST0036. tel-01181000 2013-ENST-0036](https://static.fdocuments.us/doc/165x107/609f0b68bf2ec92fd852d3da/quc-anh-l-to-cite-this-version-quc-anh-l-expressive-gesture-model-robotics.jpg)