Innovation in Intro
36
Innovation in Intro Case Studies and Data Science Kari Lock Morgan Department of Statistics Penn State University Southern Stat Chat April 15 th , 2016
Transcript of Innovation in Intro

Innovation in IntroCase Studies and Data Science
Kari Lock MorganDepartment of Statistics
Penn State University
Southern Stat ChatApril 15th, 2016

OutlineRecent innovations• Introduction to Biostatistics
Future directions• Role of data science

Goal #1Introduce inference via simulation
𝑡 =𝑥$ − 𝑥&
𝑠$&𝑛$+ 𝑠&&𝑛&
Goal #2Focus on real biological questions
Topicsoftheday:
• Two-waytables• Graphicaldisplaysfortwo
categoricalvariables• Differenceinproportions• Oddsratio

Statistics:UnlockingthePowerofData Lock5
QuestionoftheDay
Doesdrinkingteaboostyourimmunesystem?

Statistics:UnlockingthePowerofData Lock5
TeaandtheImmuneSystem• L-theanine isanaminoacidfoundintea
• Blacktea:about20mgpercup• Greentea(standard):varies,aslowas5mgpercup• Greentea(shadegrown):varies,upto46mgpercup(Shadegrowngreenteaexamples:Gyokuro,Matcha)
� 𝛾 𝛿 Tcellsareimportantforhelpingtheimmunesystemfendoffinfection
� ItisthoughtthatL-theanine primestheseTcells,activatingthemtoastateofreadinessandmakingthembetterabletorespondtofutureantigens.
� Doesdrinkingteaactuallyboostyourimmunity?

Statistics:UnlockingthePowerofData Lock5
TeaandImmuneResponse
Antigensintea-BeveragePrimeHumanVγ2Vδ2TCellsinvitroandinvivoforMemoryandNon-memoryAntibacterialCytokineResponses,Kamath et.al.,ProceedingsoftheNationalAcademyofSciences,May13,2003.
• Participantswererandomizedtodrinkfiveorsixcupsofeithertea(black)orcoffeeeverydayfortwoweeks(bothdrinkshavecaffeinebutonlyteahasL-theanine)
• Aftertwoweeks,bloodsampleswereexposedtoanantigen,andproductionofinterferongamma(immunesystemresponse)wasmeasured
• Explanatoryvariable:teaorcoffee• Responsevariable:measureofinterferongamma
Statistics:UnlockingthePowerofData Lock5
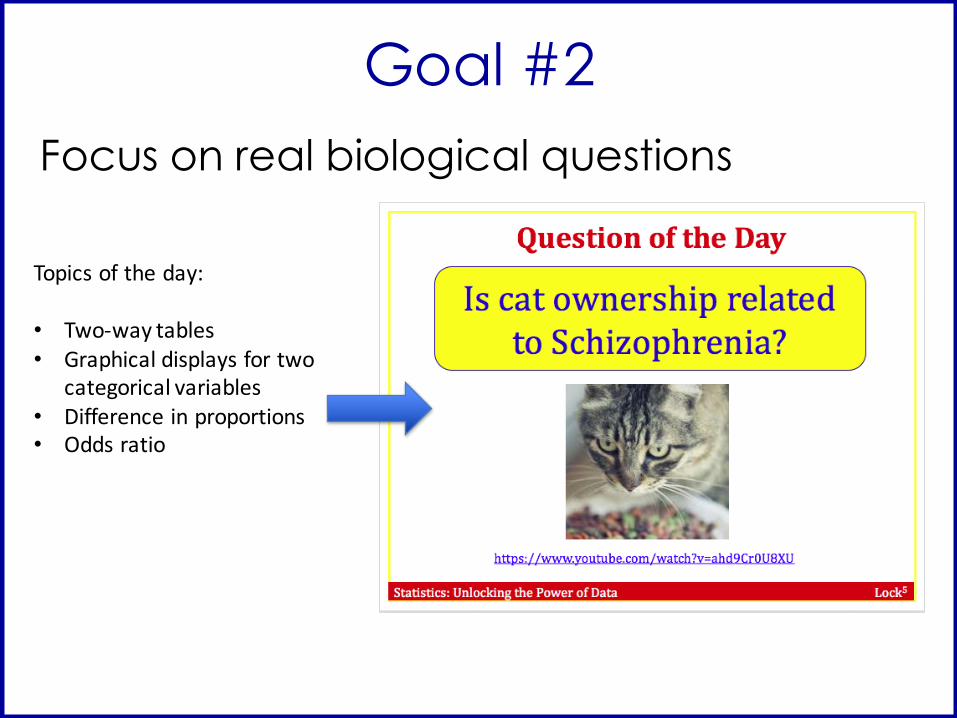
TeaandtheImmuneSystem
Instudycomparingteaandcoffeeandlevelsofinterferongamma,ifteadrinkershavesignificantlyhigherlevelsofinterferongamma,canweconcludethatdrinkingtearatherthancoffeecaused anincreaseinthisaspectoftheimmuneresponse?
a) Yesb) No
Randomized experiment allows conclusions about causality

Statistics:UnlockingthePowerofData Lock5
TeaandImmuneSystemTheexplanatoryvariableisteaorcoffee,andtheresponsevariableisimmunesystemresponsemeasuredinamountofinterferongammaproduced.Howcouldwevisualizethisdata?
a) Barchartb) Histogramc) Side-by-sideboxplotsd) Scatterplot
One categorical and one quantitative

Statistics:UnlockingthePowerofData Lock5
TeaandImmuneSystem
�̅�- − �̅�. = 34.82 − 17.70 = 17.12
Twoplausibleexplanations:
¡Teaboostsimmunity
¡Randomchance
Whatmighthappenjustbyrandomchance???

Statistics:UnlockingthePowerofData Lock5
p-value: The chance of obtaining a statistic as extreme as that observed, just by random chance, if the null hypothesis is true
Fall '14 Spring '15 Fall '15
2040
6080
100
Pos
t Tes
t Sco
re
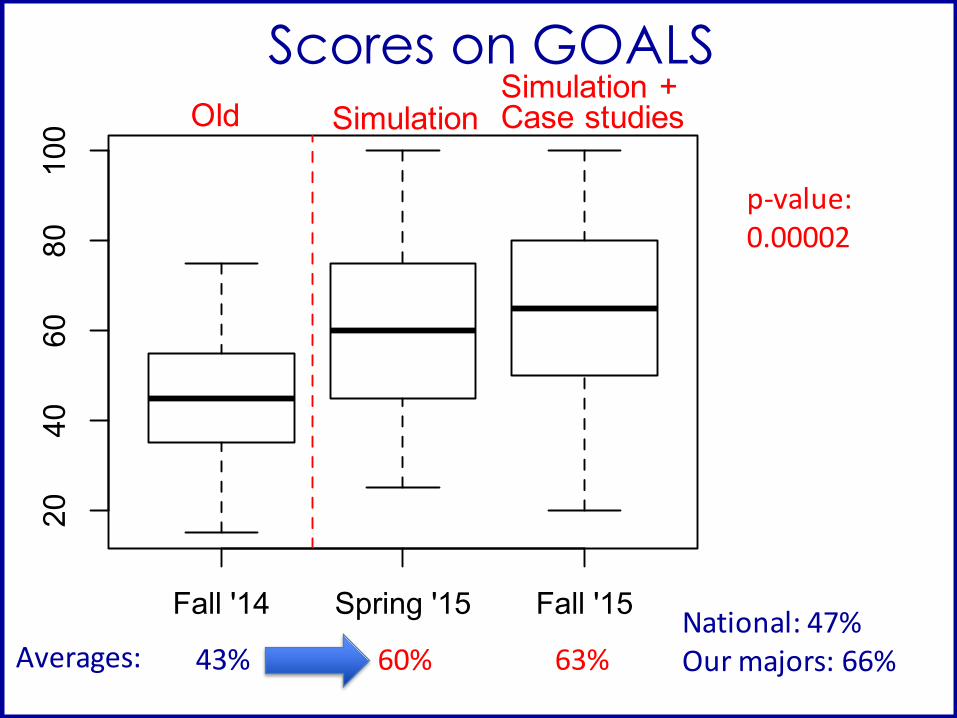
Scores on GOALS
Averages:
p-value:0.00002
43% 60% 63%National:47%Ourmajors:66%
SimulationSimulation + Case studiesOld
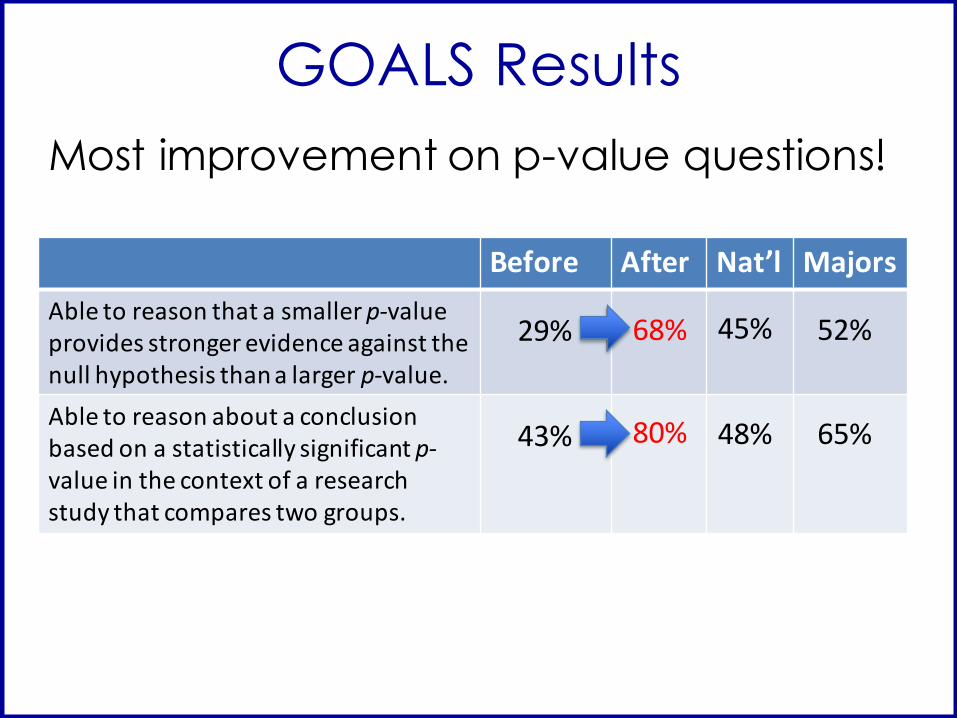
GOALS ResultsMost improvement on p-value questions!
Before After Nat’l MajorsAbletoreasonthatasmallerp-valueprovidesstrongerevidenceagainstthenullhypothesisthanalargerp-value.
29%
Abletoreasonaboutaconclusionbasedonastatisticallysignificantp-valueinthecontextofaresearchstudythatcomparestwogroups.
43%
45%
48%
52%
65%
68%
80%

Goal #2Focus on real biological questions
Topicsoftheday:
• Two-waytables• Graphicaldisplaysfortwo
categoricalvariables• Differenceinproportions• Oddsratio

Focus on Real Questions• Each class or lab opens with a (scientific)
question of interest
• The stat topics of the day are covered en route to answering this question
• More time on motivation and data
• Usually a few connected examples:– One question, multiple datasets – One dataset, multiple questions

Questions• Does exercise improve cognitive ability?• Are children diagnosed with ADHD younger
than their peers?• Which aspect(s) of sunlight help protect against
MS?
• What happens when you switch to organic?• How obese are Americans?• Is brain size associated with social network size?
• Does exposure to light at night increase body mass and/or glucose intolerance in mice?

Data from Penn State!• Are moderate or aggressive doses better for
drug resistance?
• Do lizards learn to avoid invasive fire ants? • Does choice of mate improve offspring fitness? • How does genetic diversity relate to distance
from Africa? • How do breastfed babies and mothers differ
from bottle fed?
• Do malaria parasites impact mosquito behavior to their advantage?

Course MaterialsYou choose an example!
www.personal.psu.edu/klm47/Courses/STAT250/Fall2015/schedule.htm

Teacher Shift in Perspective
Here’s a dataset to illustrate this statistical topic…
Here’s an interesting question, let’s use data to answer it!
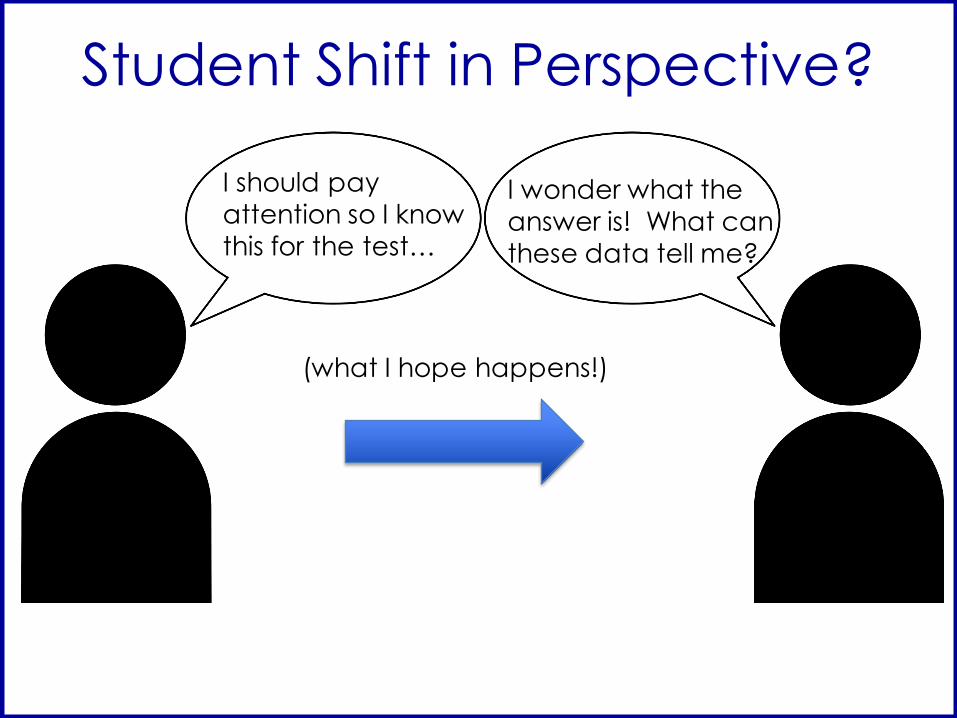
Student Shift in Perspective?
I should pay attention so I know this for the test…
I wonder what the answer is! What can these data tell me?
(what I hope happens!)

Data to answer questions• More time on each study; allows depth• More on the “science” and background• More discussion on data collection,
choices, limitations, etc.• Link to original paper, show excerpts• Teaches how to look at studies• Raises points not typically covered• Statistics is interesting, relevant, powerful!• Fun!
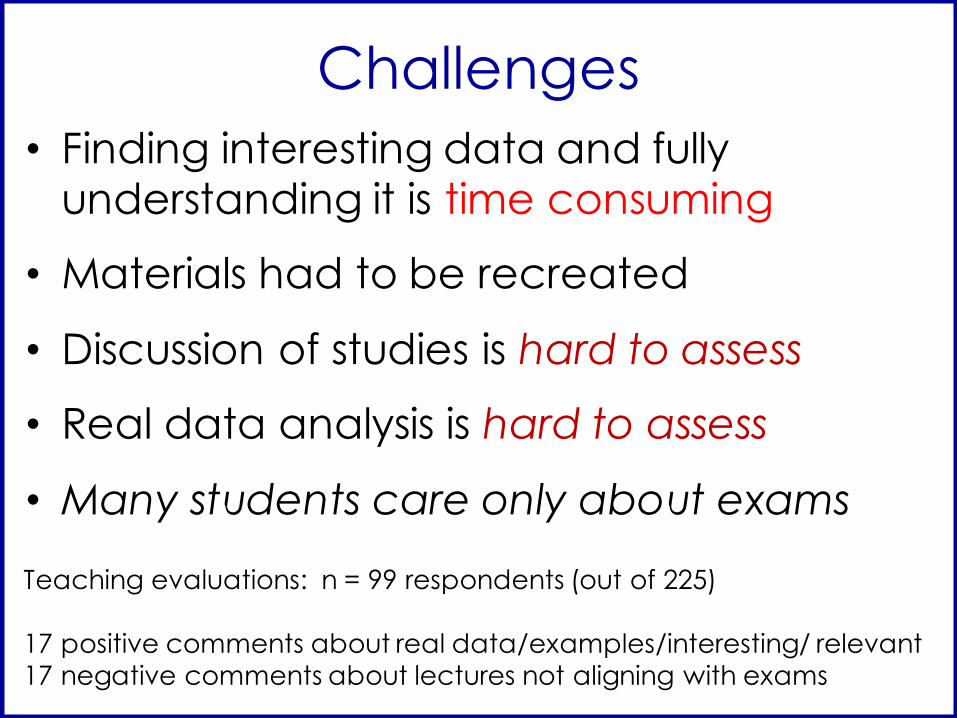
Challenges• Finding interesting data and fully
understanding it is time consuming
• Materials had to be recreated
• Discussion of studies is hard to assess
• Real data analysis is hard to assess
• Many students care only about exams
Teaching evaluations: n = 99 respondents (out of 225)
17 positive comments about real data/examples/interesting/ relevant17 negative comments about lectures not aligning with exams
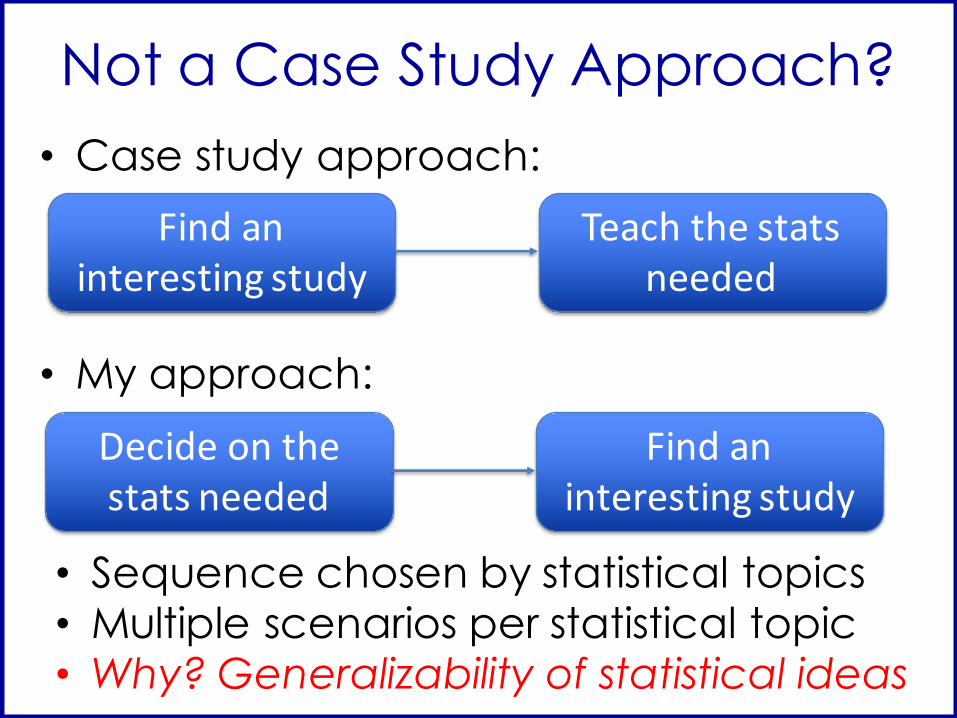
Not a Case Study Approach?• Case study approach:
• My approach:
Findaninterestingstudy
Teachthestatsneeded
Decideonthestatsneeded
Findaninterestingstudy
• Sequence chosen by statistical topics• Multiple scenarios per statistical topic• Why? Generalizability of statistical ideas
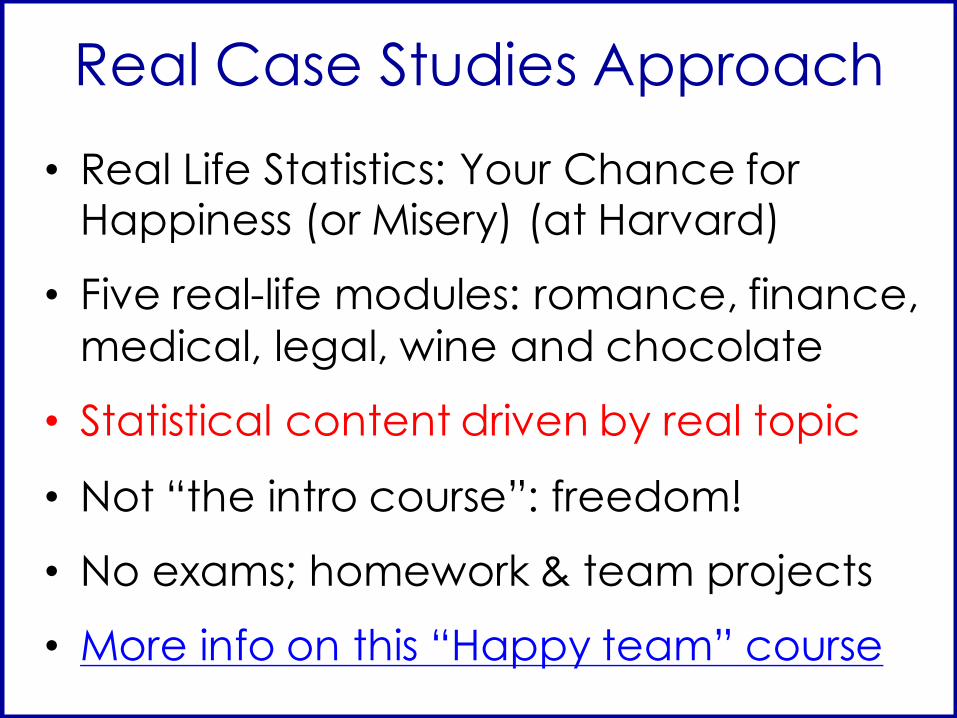
Real Case Studies Approach• Real Life Statistics: Your Chance for
Happiness (or Misery) (at Harvard)
• Five real-life modules: romance, finance, medical, legal, wine and chocolate
• Statistical content driven by real topic
• Not “the intro course”: freedom!
• No exams; homework & team projects
• More info on this “Happy team” course

Data Science in Intro• How do we adapt in an era of
abundant availability and use of data?

Data ScienceIntro Stat
Inference
Design VisualizationSummariesModeling
Scope of inference
Communication
Scraping data
Scientific method
Data wrangling
Big data
Computer science

Data Collection• Classical statistics:
• Data science:
Askaquestion Collect(small)datatoanswerit
Obtainavailable(big)data
Seewhatittellsyou
BOTH ARE IMPORTANT!!!
Inference!
Inference?
Design, randomness
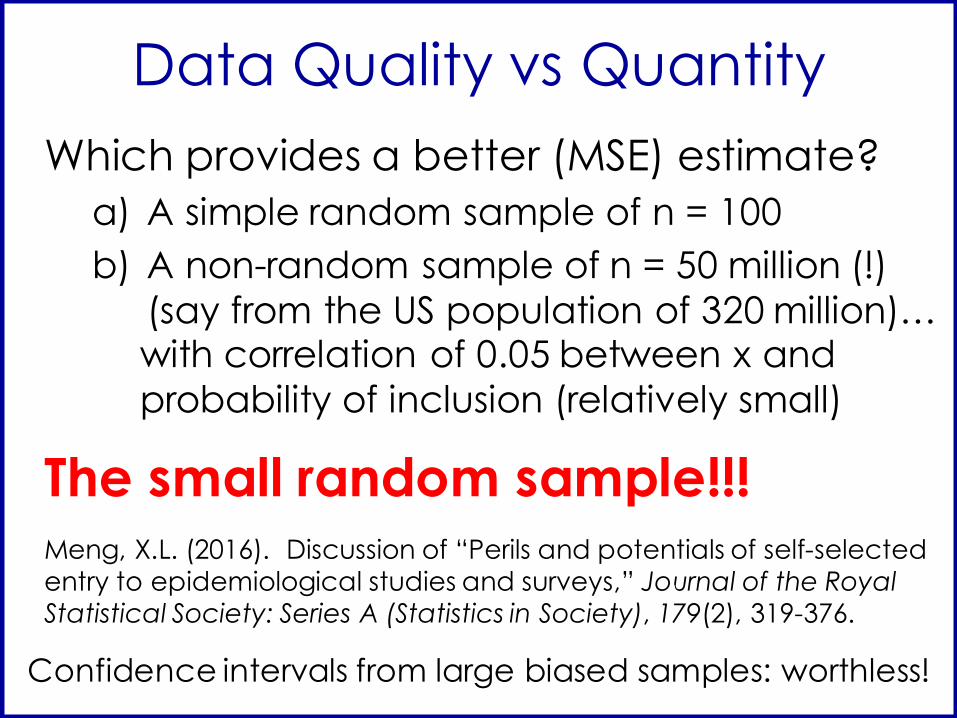
Data Quality vs QuantityWhich provides a better (MSE) estimate?
a) A simple random sample of n = 100b) A non-random sample of n = 50 million (!)
(say from the US population of 320 million)…with correlation of 0.05 between x and probability of inclusion (relatively small)
The small random sample!!!Meng, X.L. (2016). Discussion of “Perils and potentials of self-selected entry to epidemiological studies and surveys,” Journal of the Royal Statistical Society: Series A (Statistics in Society), 179(2), 319-376.
Confidence intervals from large biased samples: worthless!

Data Quality over Quantity• For population inference, small random
sample beats large biased sample
• For causality, small randomized experiment beats large observational study
• (Statistics beats data science? J)
• Design (randomness) remains important ⇒ inference remains important!
• But, LOTS of non-random data available!

p-values?A.S.S. Response to ASA“We think the ASA did not go far enough. It is time to admit that the era of p-values is over. … In place of p-values, the ASS advocates the STOP (SeaT-Of-Pants procedure). … The STOP is simple, direct, data-driven, and authoritative. To carry it out, an authority figure (an older male, by preference) reviews the data and decides whether they agree with his opinion. When he decides they do, the result is ‘significant.’”

Emphasize/Add?• Scope of inference / data limitations:
sampling bias, confounding, randomness• More on visualization• Experience with more than two variables• Choice of graph/stat/parameter/method• Interpreting and communicating results• p-value cautions: multiple testing, sample size• More examples without design or inference• More on insights from available data • Extendable technology (R) (??)

Technology• Data analysis requires technology!However:• Concepts...
– apply regardless of choice of technology– pertain to data analyzed by someone else– are needed by everyone
• Technology…– changes quickly– has lots of different forms– will not be needed by everyone
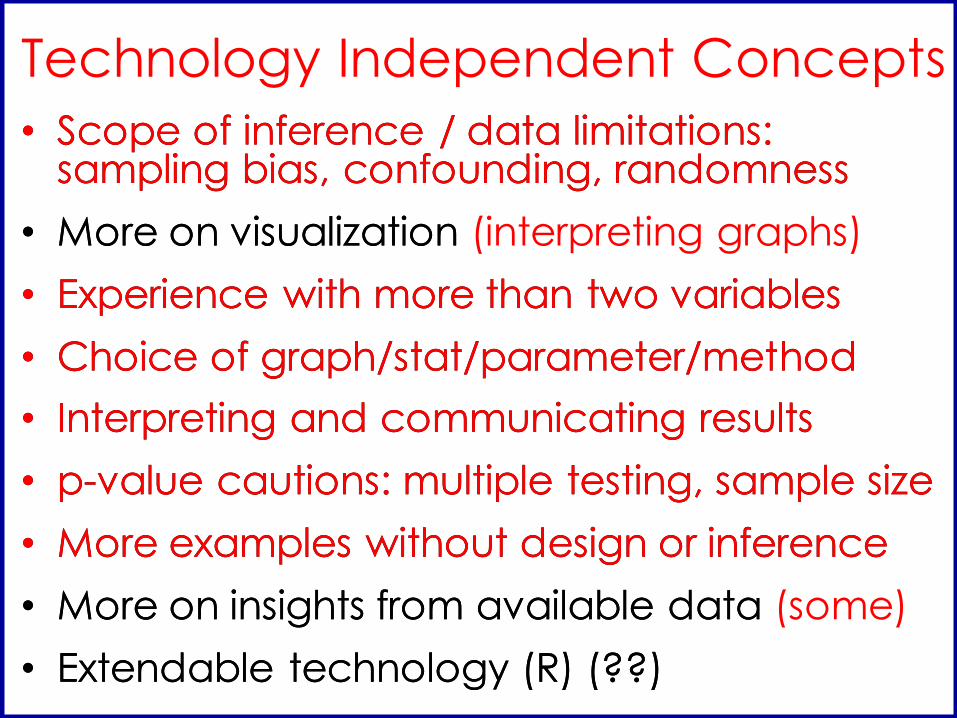
Technology Independent Concepts• Scope of inference / data limitations:
sampling bias, confounding, randomness• More on visualization• Experience with more than two variables • Choice of graph/stat/parameter/method• Interpreting and communicating results• p-value cautions: multiple testing, sample size• More examples without design or inference• More on insights from available data • Extendable technology (R) (??)
• Scope of inference / data limitations: sampling bias, confounding, randomness
• More on visualization (interpreting graphs)• Experience with more than two variables• Choice of graph/stat/parameter/method• Interpreting and communicating results• p-value cautions: multiple testing, sample size• More examples without design or inference• More on insights from available data (some)• Extendable technology (R) (??)

Not in Intro? • One intro course can not do everything!!!• Scraping data• Data wrangling• Big data• Consider eliminating…
– Anything not directly connected to data– Hand calculations not helping understanding– Basic descriptive statistics?– t-distribution? – Distribution-based inference?
DataScienceCourse
Summary: Data Science in Intro• Emphasize the overlap with data science
• Acknowledge that not all data analysis is question -> purposeful design -> inference
• Use technology, but emphasize concepts
• Eliminate material not connected to data
• Eliminate material that technology can do and that does not help understanding