INFORMATION REPORT NO 35
76
INFORMATION REPORT NO 35 Republic of Ghana Ministry of Fisheries and Aquaculture Development FISHERIES COMMISSION Fisheries Scientific Survey Division REPORT ON THE 2013 GHANA MARINE CANOE FRAME SURVEY BY SAMANTHA AKYEAMPONG, KOFI AMADOR, BAETA NKRUMAH et al July 2013
Transcript of INFORMATION REPORT NO 35

INFORMATION REPORT NO 35
Republic of Ghana
Ministry of Fisheries and Aquaculture Development
FISHERIES COMMISSION
Fisheries Scientific Survey Division
REPORT ON THE 2013
GHANA MARINE CANOE FRAME SURVEY
BY
SAMANTHA AKYEAMPONG, KOFI AMADOR, BAETA
NKRUMAH et al
July 2013
TABLE OF CONTENTS
TABLE OF CONTENTS ............................................................................................................................... 2
LIST of Table and Figures .................................................................................................................... 3
Tables............................................................................................................................................... 3
Figures ............................................................................................................................................. 3
1.0 INTRODUCTION ............................................................................................................................. 4
1.1 AIM OF SURVEY ............................................................................................................................. 5
2.0 DISTRICT PROFILES ........................................................................................................................ 6
2.1 VOLTA REGION .................................................................................................................... 6
2.2 GREATER ACCRA REGION .................................................................................................... 7
2.3 CENTRAL REGION ................................................................................................................ 9
2.4 WESTERN REGION ............................................................................................................ 12
3.0 METHODOLOGY ........................................................................................................................... 15
3.1 STUDY AREA ............................................................................................................................. 15
4.0 RESULTS ....................................................................................................................................... 17
4.1 TYPES OF CANOES .................................................................................................................... 17
4.2 NUMBER OF CANOES .................................................................. Error! Bookmark not defined.
4.3 Number and Type of Fishing Gears ......................................................................................... 19
4.4 Number and Types of Outboard Motors ................................................................................. 19
4.5 Number of Fishing Villages and Landing Beaches ................................................................... 19
4.6 Number of Fishermen ............................................................................................................. 19
4.7 Cost of Fishing Inputs .............................................................................................................. 20
4.8 Fish Sharing Systems .............................................................................................................. 20
4.9 Fishing Holidays ...................................................................................................................... 20
4.10 Migration Patterns................................................................................................................ 21
4.11 Comparison of Results with Previous Surveys ...................................................................... 21
5.0 DISCUSSIONS ............................................................................................................................... 22
6.0 SOCIO-ECONOMIC STUDIES ......................................................................................................... 24
ACKNOWLEDGEMENT ........................................................................................................................... 35
References ............................................................................................................................................. 35
Appendices ............................................................................................................................................ 36

LIST of Table and Figures
Tables
Table 1.1a -1z Results of Frame Survey showing number of fishing units by gear for all districts ...... 37
Table 2 Fishing villages and landing sites ................................................. Error! Bookmark not defined.
Table 3 Regional Summaries ................................................................................................................ 55
Table 4 Mean rangeof price/cost of Canoes, Fishing gear and Outboard motors in the Regions ....... 56
Table 5 Summary of Results of Canoe Frame Survey conducted between 1972 - 2013 ..................... 57
Table 6 Regional Summaries 1997, 2001, 2004, 2013.......................................................................... 58
Table 7 Brand and Size of Outboard Motors ........................................................................................ 59
Table 8 Mean Dimensions/Ranges of Canoes along the Coast in Ghana ............................................. 60
Table 9 Fish Sharing System within the Region .................................................................................... 61
Figures
Figure 1 Map of coastline of Ghana showing majority of districts (2011)……..……………………………….6
Figure 2 Fishing villages and landing sites ........................................................................................ 62
Figure 3 Total number of canoes 1969 - 2013 ................................................................................... 64
Figure 4 Fishermen and Motors......................................................................................................... 65
Figure 5 Comparison of Fishing villages to landing sites between 1969 - 2013 ................................ 66
Figure 6 Canoes and Fishermen in the Regions 2013 ........................................................................ 67
Figure 7 Relative importance of Fishing gear in each coastal districts .............................................. 70

1.0 INTRODUCTION
The Ministry of Fisheries and Aquaculture Development has the primary responsibility of
ensuring the availability and affordability of fish and fisheries products within the country.
Through research, it also ensures the promotion of sustainable and thriving fisheries
enterprises as well as providing extension and other support services to fishers.
Fish is the preferred source of protein and it accounts for about 60% of animal protein in most
Ghanaian diets. About 75% of the total domestic production of fish is consumed locally with
an average per capita consumption of 23.7 kg per annum (Anon; 2011).
Fishery products constitute the most important non-traditional export of Ghana, contributing
254.4 million dollars in 2011 (Ghana Export Promotion Authority). The sector contributes
about 5 percent to Agricultural Gross Domestic Product (GDP) and employs about 10% of the
nation’s economically active population.
According to FAO (1991) assessment, out of 1.9 million people who engaged in either full
time, part time and seasonal fishing, about 98% belongs to the artisanal sector. The artisanal
sector is the most important sector in the categories of the fisheries sector in Ghana. Artisanal
fishing is the main type of fishing carried out in all the twenty three coastal districts of Ghana.
The sector contributes about 70 to 80% of the total marine fish production (Anon; 2011).
Due to the diversity of fish caught and the multiplicity of gears and fishing crafts used as well
as the increasing prices of premix fuel and gears they employ in their fishing activities,
artisanal fishing is considered complex. Hence the Fisheries Scientific Survey Division
(FSSD) of the Ministry of Fisheries and Aquaculture Development also known as the
Research Division conducts frame surveys of canoes and artisanal gears and also collects
socio-economic information regularly in all canoe landing sites and the results are used as
basis for catch assessment surveys and also to determine the strength of the sector and its
needs.
A frame survey of canoes and fishing gears as well as the collection of socio-economic
information on the artisanal fisheries was conducted in May 2013 to update the existing data
on the sector. The last survey was conducted in 2004.

1.1 AIM OF SURVEY
To assess the size, structure and distribution of canoes in the marine artisanal sector
To collect the basic data and information necessary for the processing of the marine
annual artisanal fish production
To collect socio-economic information on the marine artisanal sector.
To collect other information on the canoe fleet.
The frame survey focused on detailed count and measurement of canoes and fishing gears,
number of outboard motors, number of fishing villages and landing beaches, number of
fishermen. Other parameters that were also considered included the cost of fishing inputs, fish
sharing system, migration patterns and other socio-economic information for the month of
May 2013 in all landing sites when there was less migration of canoe and fishermen between
landing centers.

2.0 DISTRICT PROFILES
There are a total of 26 coastal districts in the four regions along the coast line in Ghana; (2)
two in the Volta region, (9) nine in the Greater Accra region, (9) nine in the Central Region
and (6) six in the Western region.
Figure 1Map of coastline of Ghana showing majority of districts (2011)
2.1 VOLTA REGION
Volta region is at the eastern coast of Ghana and has two coastal districts namely Ketu South
Municipality and Keta district.
2.1. 1 KETU SOUTH MUNICIPALITY
The Ketu South Municipality has its capital at Denu and it is bordered to the North by the
Akatsi District, to the South by the Gulf of Guinea and to the East by the Republic of Togo,
and to the West by the Keta Municipality. The district shares a border with the republic of
Togo where continuous cross-border trading activities occur. The main occupation of the
people in this district is salt mining and fishing although some people engage in subsistence
agriculture. Fish production in the district over the past five years has averaged 6336 mt over
the period. The main fish species caught are; Anchovy (Engraulis encrasicolus), Burrito
(Brachydeuterus auritus), Bumper (chlroscombrus chyrsurus), Flat sardinella, (Sardinella
maderensis), Round sardinella (Sardinella aurita) and Horse Mackerel (Caranx hippos).
2.1.2 KETA DISTRICT
The district was carved out of the former Anlo District and it is located east of the Volta
estuary with Keta as its district capital. It lies within Longitudes 0.30E and 1.05E and
Latitudes 5.45N and 6.005N. It is found within a total surface area of 1,086km2, with
approximately 362km2 (about 30 per cent) covered by water bodies, the largest of which is
Keta Lagoon. Fishing and water transportation potentials exist in the district. The main
occupation of the people in this district is salt mining and fishing. Fish production in the
district over the past five years has averaged approximately 4800mt. However declining
trends have been observed in recent years. The main fish species caught are: Anchovy
(Engraulis encrasicolus), Burrito (Brachydeuterus auritus), Bumper (chlroscombrus
chyrsurus), Flat sardinella, (Sardinella maderensis), Round sardinella (Sardinella aurita) and
Horse Mackerel (Caranx hippos).
2.2 GREATER ACCRA REGION
Districts in the greater Accra region, the regional capital of Ghana include Ada West, Dangme
East, Dangme West, Kpone katamanso, tema Municipal Assembly, Ledzokuku-Krowor
Municipal, La Dadekotopon Municipal, Accra Metropolitan Assembly and Ga South.
2.2.1 ADA WEST
Ada West District is one of the new 46 districts created in 2012 under the Executive
Instrument (E.I) with Sege as its capital. It was carved from Dangme East district. Majority of
the populace engage in fish farming and agriculture as a source of income for their families.
The main occupation of the people in this district is salt mining and fishing.
2.2.2 DANGME EAST
The Dangme East District is one of the seventeen (17) districts in the Greater Accra Region of
Ghana, and covers a surface of about 909 km². It is located at the estuary where the Volta

River meets the sea with Ada Foah as the district capital. The main occupation of the local
people is fishing and others also work in the salt mining sector. The mean fish production in
the district over the past 5 years has been 54500mt one of the highest among the districts.
Anchovy (Engraulis encrasicolus), Round Sardinella (Sardinella aurita), Frigate Mackerel
(Caranx hippos) and Chub Mackerel (Scomber japonicus) are the main fish species caught in
this district.
2.5 DANGME WEST
The Dangme West District lies between latitude 5° 45’ south and 6° 05’ North and Longitude
0° 05’ East and 0° 20’ West in the South eastern part of Ghana. The District is the largest in
the Greater Accra Region with a coastline stretching over 37 kilometers and a total land area
of 1,442 square kilometers. The main occupation of the people in this district is salt mining
and fishing. Fish production in the district over the past five years has averaged approximately
1023 mt .Anchovy (Engraulis encrasicolus), Sardines (Sardinella spp) and mackerels
(Caranx spp) are the major fish species caught in this district.
2.6 KPONE-KATAMANSO
This new district was carved oit of the Tema Municipal assembly. Majority of the populace
are mainly fishermen specialising in the hook and line method of harvesting large demersals.
Others are farmers on subsistence levels.
2.7 TEMA MUNICIPAL ASSEMBLY
Tema serves as the administrative capital of the Tema Metropolitan Assembly. It is a coastal
city situated 25 kilometres east of Accra, the national capital. The Greenwich Meridian (00
Longitude) passes through the city of Tema. The metropolis shares common boundaries with
the Accra Metropolis on the west, the Ga Municipality on the North West and the Dangme
West District on the northern and eastern borders respectively.
The main occupation of inhabitants varies from commerce, tourism, hoteliers and fishing.
Within the district the Tema fishing port lands over including the artisanal canoe fishermen
producing an average of 4100mt in the past 5 years. Over 40 fish species of fish belonging to
various families such as the Anchovy (Engraulis encrasicolus), Sardinellas (Sardinella spp),
Bumper (Chlroscombrus chrysurus), Frigate Mackerel (Caranx hippos), and Chub Mackerel
(Scomber japonicus) are landed in Tema due to its major infrastructure and proximity to the
capital.
2.2.3 LEDZOKUKU-KROWOR MUNICIPAL
Nungua is the district capital with an estimated population of 261,571 people in the
Municipality. Fishing is one of the occupations of the people. Fish production in the district
over the past five years is shown below showing an average of 2,500 mt over the period. The
main fish species caught are the Round Sardinella (Sardinella aurita), Bumper
(Chlroscombrus chrysurus) and Frigate Mackerel (Caranx hippos).
2.2.4 LA DADEKOTOPON MUNICIPAL
This new district was carved out of the AMA in 2011 with a large majority of its inhabitants
into commercial ventures and tourism. Fishing is on the low ebb with a handful of canoes
2.2.5 ACCRA METROPOLITAN ASSEMBLY
AMA has a total land size of 200 square kilometres and is made up of six sub metros namely
Okaikoi, Ashiedu Keteke, Ayawaso, Kpeshie, Osu Klotey and Ablekuma. The total
population of AMA is about 1,695,136 people (2000 National Population Census).Commerce,
tourism, hoteliers and fishing are the main occupation of inhabitants in the district. The
district has quite a number of landing sites producing over 52901.52 mt in the past 5 years.
Round Sardinella (Sardinella aurita), Bumper (Chlroscombrus chrysurus), Frigate Mackerel
(Caranx hippos) and Flat Sardine (Sardinella maderensis) are the major species landed in this
district.
2.2.6 GA SOUTH
The Ga district is one of the districts in the Greater Accra Region. Fishing villages in this
district includes Bortianor, Oshie, Kokrobite, Lanma and Faanaa.
Fishing is one of the occupations of the people. Fish production in the district in the past five
years is 6627mt. Some of the most important fish species caught are Moon Fish (Selene
dorsalis), Cassava fish (Pseudotolithus senegalensis), Burrito (Brachydeuterus auritus), sea
breams (Sparus and Dentex spp) and Round Sardinella (Sardinella aurita).
2.3 CENTRAL REGION
Central region is one of the ten administrative regions in Ghana and it is sandwiched by two
coastal regions to the south, Western and Greater Accra regions. The region has nine coastal
districts out of the seventeen districts.
2.3.1 AWUTU SENYA
This is one of the major districts in the Central region with the district capital being Senya-
Beraku. The main occupation of the people in this district is agriculture and fishing. Fish

production in the district over the past five years has averaged 3500 mt over the period. Main
species caught are the Sardines (Sardinella spp), Threadfin (Galeoides decadactylus), and
Burrito (Brachydeuterus auritus) among others.
2.3.2 GOMOA EAST
This district was carved from the Gomoa West district with Afransi as its district capital in
2012. The Districts is bounded by Gomoa West to the South, to the North by Agona West
Municipal, Assikuma-Odoben-Brakwa District to the West and to the East by Awutu-Senya
East District. The population of the district is 102,449 and it is estimated to be 6.4% of the
regional population.
The main occupation of the people in this district is subsistence agriculture and fishing. The
sardinellas are the major fish species landed.
2.3.3 GOMOA WEST
Covering a land area of 1,022.0 km2 with a total population of 194,792 (i.e. 12.23% of
regional population), the Gomoa District has Apam as its administrative capital. The District
lies within latitude 5° 14 north and 5°35 north and longitude °22 west and °54 west on the
eastern part of the Central Region of Ghana.
The main occupations of the people in this district are subsistence agriculture and fishing.
Mean Fish production in the district over the past five years was 6308. A lot of fish species of
commercial importance are caught in the district with thesardinellas being the dominant
pelagic species. Others are the Threadfin (Galeoides decadactylus), and Burrito
(Brachydeuterus auritus).
2.3.4 EFFUTU MUNICIPAL
The Municipality covers an area of 417.3 km2 (163 sq miles) with Winneba as its
administrative capital. It is bordered to the north by Agona Municipal, east by Gomoa
District, on the west by the Gomoa West District and the south the Gulf of Guinea. The
municipal had a population of 169,972, which represent 10.7% of the population of the
Central region (According to Population and Housing Census of 2000) with 168 settlements.
The main occupation of the people in this district is agriculture and fishing. The small
pelagics (Sarinellas) are dominantly caught and landed but occasionally the billfishes are also
landed by the drift gill operators.
2.3.5 EKUMFI DISTRICT
This new district was carved out of the Mfantseman distinct from Otuam to Srafa with a
population of less than 50,000 people with fishing as their predominant occupation.
Sardinellas are the dominant species landed more especially during the peak fishing season.
2.3.6 MFANTSEMAN MUNICIPAL
The Municipal capital is Saltpond. It occupies a total land area of approximately 612 km2
stretching for about 21 km along the coastline and for about 13 kilometers inland. The
municipality has a total of 152,264 people (2000 population and housing census) constituting
almost 7% of the Central Region population.
The main occupation of the people in this district is subsistence agriculture and fishing. Mean
fish production in the district over the past five years averaged 10,000 mt over the period.
Major fish species caught are the Anchovy (Engraulis encrasicolus), Atlantic little tuna, and
(Euthynnus alleratus, Scad Mackerel (Caranx rhoncus), Threadfin (Galeoides decadactylus),
Chub Mackerel (Scomber japonicus) and Burrito (Brachydeuterus auritus)
2.3.7 ABURA ASEBU KWAMANKESE
Abura-Dunkwa is the administrative capital of the Abura-Asebu-Kwamankese District. It is
bordered by Cape Coast Municipality and Lower Denkyira District to the west, Assin South
District to the north, Mfantseman Municipal to the south and the east. Abura-Asebu-
Kwamankese District has a population size of 90,093 representing 5.6% share of the Regional
Population and 0.47% of the National Population figure (2000 population census). The
population density is consequently 277.2 per sq. km.
The main occupation of the people in this district is agriculture and fishing. Fish production in
the district over the past five years has been 74162 mt over the period. The main fish species
caught are: Anchovy (Engraulis encrasicolus), Atlantic little tuna (Euthynnus alleratus, Scad
Mackerel (Caranx rhoncus), Threadfin (Galeoides decadactylus), Chub Mackerel (Scomber
japonicus) and Burrito (Brachydeuterus auritus).
2.3.8 CAPE COAST MUNICIPAL
Cape Coast is the administrative capital of Cape Coast Metropolitan Assembly and also the
regional capital of the Central Region. The metropolis occupies an area of 122km2. It’s
boundary to the West is Komenda/Edina/Eguafo/Abrem District, to the East is Abura-
/Asebu/Kwamankese District and to the North the Twifo Hemang Lower Denkyira District.

The main occupation of the people in this district is fishing. Fish production in the district
over the past five years has on the average been 6160mt over the period. The main fish
species caught are the Threadfin (Galeoides decadactylus), Chub Mackerel (Scomber
japonicus) and Burrito (Brachydeuterus auritus).
2.3.9 KOMENDA-EDINA EGUAFO-ABREM
Elmina is its administrative capital. It is situated between longitude 1° 20’ West and 1° 40’
West and latitude 5° 05’ North and 5° North 15’ North. The district covers an area of
1’372.45 km2 The estimated population for the district is 112,435 people which is 7.1% of the
regional population.
The main occupation of the people in this district is subsistence agriculture and fishing. Fish
production in the district over the past five years accounted for 10571 mt annually over the
period. The main fish species caught are: Atlantic little tuna (Euthynnus alleteratus)Frigate
mackerel (Auxis thazard) and Burrito (Brachydeuterus auritus).
2.4 WESTERN REGION
Western region is located in the south western part of Ghana and has six coastal regions.
2.4.1 SHAMA
The Shama District was carved out of the former Shama Ahanta East Metropolitan Assembly.
It is bordered to the North by the Mpohor Wassa East District, to the South by the Gulf of
Guinea, Sekondi-Takoradi Metropolitan Assembly to the West (all in the Western Region)
and Komenda Edina Eguafo-Abirem District to the East in Central Region. The District
Capital is Shama. The District covers a land area of 215 km2 and has a total of sixty seven
(67) settlements with 366,579 population size. The predominant occupation of the people in
the District is mainly farming, minning, commerce and fishing. Fish production in the district
over the past five years has averaged 43488mt over the period. The main fish species caught
are the Sardinellas, Frigate Mackerel (Auxis thazard) and Long -finned Herring (Ilisha
africana).

2.4.2 SEKONDI TAKORADI METROPOLITAN
Sekondi is the administrative capital of the twin city comprising Sekondi and Takoradi. It lies
within longitudes 4.9167°N, and latitude 1.7667°W. Sekondi-Takoradi is the Western
Region's largest city and an industrial and commercial center, with a population of 445,205
people (2012). The chief industries in Sekondi-Takoradi are timber, plywood, shipbuilding
and railroad repair and recently, Sweet crude oil as well as fishing
The main fish species caught are: Sardines (Sardinella aurita and Sardinella maderensis),
frigate Mackerel, (Auxis thazard) and long-finned Herring (Ilisha africana).
2.4.3 AHANTA WEST
The Ahanta West District has a total land area of 591 km2 and according to the 2000
Population and Housing Census report it is occupied by 95,140 people. Agona Nkwanta is the
district capital. The District lies between latitude 4°.45"N and longitude 1°.58"W and it is
located at the southern most part of the country. The district is bounded on the East by the
Sekondi Takoradi Metropolitan, on the West by the Nzema East Municipal, and the North by
Mpohor Wassa East and Wassa Amenfi West Districts.
The main occupation of the people in this district includes subsistence agriculture which
employs about 60% of the total population, the remaining engage in fishing, trading and the
formal sectors. Mean annual Fish production in the district over the past five years has been is
16977mt. The main fish species caught are the Sardines (Sardinella aurita and Sardinella
maderensis).
2.4.4 NZEMA EAST
The Nzema East district is located on the southern end of the western region between
longitude 2005” and 2
035” West and latitude 4
040 and 5
020 North. The Nzema East Municipal
covers 9.8 % of the total area of the Western Region, thus an area of about 2194 km2. It is
bound on the west by Jomoro, north by Wassa Amenfi East, and the east by Wassa Amenfi
West and Ahanta West District. On the south, it is bounded by the Gulf of Guinea with 70
kilometres stretch of sandy beaches

It is estimated that over 65% of the economically active population are engaged in fishing and
farming. Mean annual fish production in the district over the past five years has been 6191 mt
over the period. Main species caught are the sardinellas.
2.4.5 ELEMBELE
The Elembelle District was carved out of the Nzema East District in 2007 with Nkroful as its
administrative capital. The Ellembelle District is located on the southern end of the region
between longitudes 2º05’ and 2º35’ West and latitude 4º40 and 5º20 N. It covers a total area
of about 1,468 km2 which constitute about 6.8% (Percent) of the total land mass of the
Western Region with a total population of 107,673 for the district (Ghana Statistical Service,
2010).
Fishing and Cocoa growing is the main occupation of the people in the district. However,
small scale mining, and trading is carried out in the middle and the northern zones. Processing
and sale of copra oil is also carried out in certain parts of the district. Major fish species
caught are Sardinellas.
2.4.6 JOMORO DISTRICT
Created by a Legislative Instrument 1394 in 1988, the Jomoro District used to be part of the
then Nzema East Municipal. The size of the district is 1344 km2 and Half Assini is District
Capital. It lies between Latitudes 04° 55’ – 05° 15’ N and Longitudes 02° 15’ – 02° 45’ W
and is bordered on the North by Wassa Amenfi West and Aowin Suaman districts, Nzema
East Municipal on the East, La Cote d’ivoire to the West and the gulf of Guinea to the
South. It is located in the Southwestern corner of the Western Region of Ghana. The
population of the district is 111,348 with a density of 83 persons per km2 and an annual
growth rate of 3%. (2000 PHC Census). The population of the district is 5.8% of that of the
region.
The main occupation of the people in this district is subsistence agriculture and fishing. Mean
Fish production in the district annually has been approximately 825mt over the period. Main
species caught are the Atlantic little tuna (Euthynnus alleteratus) and the Round and Flat
Sardines (Sardinella aurita & Sardinella madernsis).

3.0 METHODOLOGY
3.1 STUDY AREA
The survey covered the entire marine coastline with approximately 550 km from Aflao in the
Eastern border in the republic of Togo side to Half-Assini (Newtown) in the western border
with Cote d’Ivoire.
The method of full coverage was used (Banerji, 1974) with the entire coastline of Ghana
divided into four sectors corresponding to the four administrative regions bordering the sea
(Fig.1). These are Volta, Greater-Accra, Central and Western regions. The Regions were
subdivided into districts numbering 26 in total. These were Ketu south and Keta districts
in the Volta region, Dangme East, Ada West, Dangme West, Kpone-Katamanso, Tema,
Ledzokuku-Krowor, La-Dadekotopon, AMA and Ga-South districts in the Greater Accra
region, Awutu-Senya, Effutu Municipality, Gomoa East, Gomoa West, Ekumfi, Mfantseman,
Cape Coast, Abura-Asebu-Kwamankese, Komenda-Edina-Eguafo-Abrew districts and
Shama, Sekondi-Takoradi, Ahanta West, Nzema East, Ellembelle, Jomoro districts in the
Central and Western Regions.. Within each district enumerators covered the full length of the
coastline listing all fishing villages and associated landing beaches.
For the purpose of this survey, a fishing village is a village (town or city) where fishermen
reside and have a chief fisherman. The chief fisherman is generally the head of the fishing
community. A landing beach on the other hand, is the stretch of coastline on which fish is
typically landed and canoes are beached. Similarly, a number of villages that are governed by
one chief fisherman are considered as landing beaches under the fishing village where the
chief fisherman resides. Thus villages or beaches as used here may have been reassigned
under newly created administrative areas/districts recently but however cover the sites and
areas along the coastline.
The Survey team consisted of Fisheries Officers, Technical Officers, and Technical Assistants
from the coastal regions/districts who all acted as enumerators during the period under
review. The team numbering approximately 80 (grouped according to districts) went through
a three day pre-survey training in March 2013 highlighting on the methodology to be used,
identification of types of fishing gears, fishing crafts as well as administering of
questionnaires.
At the fishing village, the enumerators enquire and establish the number of landing beaches.
The number and type of canoes at each landing beach were physically counted. A sample of

each type of canoe was measured with a tape measure. The type of canoe is determined,
generally by the kind of fishing method carried out on it. The canoes were also examined for
motorisation. A canoe is considered motorized if it carries a bracket or cradle on which an
outboard motor can be mounted.
All other information requested are indicated in the questionnaires (Appendices A & B). The
findings of most questionnaire have not been put in this report but only summaries because
they were put in to help design and monitor catch assessment surveys. However these results
can be incorporated in a detailed register with detailed information on ownership, names of
canoes, symbols, crew size per individual canoes etc.
Canoes in estuaries, rivers and lagoons no matter how close they were to the open sea, were
excluded in the count. New canoes which were being prepared to go to sea and old ones
undergoing repairs were all counted and included in the database. Canoes that were seen
broken beyond repairs or abandoned were not counted. In each canoe, the number of
fishermen were also sought.
The chief fisherman in each village was the first point of contact before the enumeration was
done and they often delegated some trustworthy and experienced subordinates to help the
enumerators do their job.
The rest of the survey was conducted by interviewing either the chief fisherman or other
fishermen in the village. Some of the information demanded from them are on non-fishing
days, range of fishing operations, main species fished or sought, migration of fishermen
within and out of the country etc.
All the information obtained were crosschecked and later entered into a database for further
scrutiny.
The entire programme lasted for a month starting on the 2nd
March and endeing on the 29th
March 2013 and was undertaken by - technical assistants n some districts due to the lack of
field staff a few retired officers were recruited to join the existing numbers of enumerators.
Most of them had taken part in previous surveys with the content of recording schedules not
substantially changed.
A post census check was organized in the first week of April 2013 where four officers from
the Fisheries Scientific Survey Division (also known as Research) were tasked to visit some
landing sites to ascertain the true numbers of canoes there, ascertain boundaries of newly
created districts and recommend sampling sites for catch assessment surveys among others.
Besides counting the numbers and types of canoes and gears associated, some aspects of the
livelihoods of fisher folks were sought. The aim was to find out some socio-economic
conditions of the fisher folks along the coastal districts of Ghana such as their family size,
educational backgrounds, and livelihoods among others. The respondents were mainly
fishermen and fishmongers in the various fishing communities. A sample size of 500 per
region of fishers/fishmongers (respondents) were used though low in relation to the total
number of respondents in the fishery. Results using the Statistical Package for Social Sciences
(SPSS v-16) was conducted to give us a fair idea of the social importance of fishers within our
coastal communities. Results however should be taken as tentative and used with much
caution.
4.0 RESULTS
4.1 Number anf Types of Canoes
Classification of canoes in the artisanal sector is based on the type of gear the canoes operate.
The major gears operated by the canoes during the survey were Purse seine, Hook & Line,
Drifting Gill Net (Nifa-Nifa was also categorize as Drifting Gill Net ), Beach Seine, Ali,
Lobster Set Net and One Man Canoe. As one canoe can be used to operate more than one type
of fishing gear, each canoe was put in the category of gear for which it is most often used.
Doyi 1984 describes the various gears used in the artisanal fishery in Ghana.
Triplochiton scleroxylon and Ceiba petandra locally called Wawa and Onyina respectively
are the main materials used for the manufacturing of these canoes.
4.1.1 Ali/Poli/Watsa
A total of 3085 pursing nets (Poli/Watsa) and 1873 Ali net canoes were counted. These are
large wooden canoes in the size range of 12.0 – 19.5m long x 1.2 – 2.4m wide that are used to
operate the ali/poli/watsa nets. They are mainly propelled by 25 – 40 hp Outboard Motors
with some also using electronic devices like the fish finders and echo sounders.
4.1.2 Beach Seine
During the survey 1074 beach seines were recorded. In this category, old “Ali/Poli/Watsa”
canoes are converted for beach seining. Normally, the bow is raised to avoid taking water
when crossing through the surf. Beach seine canoes are mostly propelled by paddles
nevertheless outboard motors may be used as well. Their sizes range between 8.5-11.5m.

4.1.3 Setnet
Setnet canoes are those that are used to operate small nets rigged to fish at bottoms or in
midwaters depending on the strength of the floats and leadlines. They are used mainly on
daily basis using paddles and sails or outboard motors. Their size ranges from about 7.0 –
9.5m long.
4.1.4 Line
The number of line canoes recorded were 1142. Line canoes in Ghana also termed “Lagas”
canoes (French word for ice, “la glace”), are canoes that specialize in hook and line fishing.
Ice is used at sea to preserve high value demersal fish at sea in insulated containers. They stay
out at sea for 2 to 4 days targeting large demersals such as sparids, snappers and groupers
within rocky bottoms. The size range is approximately 12.0 – 18.5m long.
4.1.5 Drift Gill Net
During the count, a total of 976 drifting net canoes were recorded. Their size range is the
same as that of “Ali/Poli/Watsa” and can only be identified with the gear on board. These are
used to operate a drifting gillnet for large pelagic species such as the skipjack tuna, swordfish
and sailfishes.
4.1.6 One Man Canoes
481 canoes were counted. These are small canoes measuring up to 6 m. They are operated by
one person either using a set net or small handline. They are usually too small to be operated
by outboard engines.
4.1.7 Service canoes
Service canoes measure about 6.0 – 18m long and do not operate any fishing gear. They are
mainly used to transport fish often termed as discards from industrial trawlers (system known
as ‘seiko’) at Apam, Mumford, Elmina and Sekondi.
During the survey a total of 12,728 canoes were recorded of which 3,085 of the number was
pursing net canoes, 1,074 beach seine canoes, 1142 line canoes, 1,236 lobster set net canoes,
2861 other set net canoes, 1,873 ali net canoes, 976 drifting net canoes and 481 one man
canoes. The number of canoes for the different categories of gears operated at the landing
beaches in each district is presented in table 1.1 to table 1.26
Table 2 contains the summary of the various numbers of canoes for each district and region .

4.2 Number and Type of Fishing Gears
were The seven different gears widely in use during the survey were the Pursing Nets, Beach
Seines, Line, Lobster Set Net, Ali, Other Set Nets and Drifting Gill Net.
Except for canoes that operated line, lobster net and other set net gears, every other canoe
operated one unit of fishing gear. On the average, a lobster net or set net canoe operated up
to18 units of fishing gear.
4.3 Number and Types of Outboard Motors
A total of 9,313 outboard engines of various brands and capacity were recorded. Seven brands
of various capacities ranging from 4hp to 40hp were identified during the survey. The
Yamaha brand of 40hp dominated the motor types by 66%. Other brands were Johnson,
Suzuki, Marina, Tohatsu, Mercury and Towakyo which had capacities between 4 and 9hp .
Engines with such small capacities were common in the Central and Western regions, where
they are used to propel small set net canoes which are common in these areas.
The regional distribution of outboard motors is presented in tables 2 and 3. The level of
motorization for each region is also presented in table 3.
4.4 Number of Fishing Villages and Landing Beaches
A total of 186 fishing villages and 302 landing beaches were recorded during the survey.
Names of the various fishing villages and landing beaches are in Tables 1.1 to Ttable 1.26
At the regional level, there were 26, 44, 44 and 76 fishing villages in the Volta, Greater
Accra, Central and Western regions respectively. The highest number of landing beaches
(106) was recorded in the Central Region with the lowest number (44) in the Volta Region.
In table 2 shows the breakdown of numbers of fishing villages and landing beaches by
districts and regions.
4.5 Number of Fishermen
The number of fishermen recorded during the survey was 139,155 (Table 3). The total
number for each landing beach is presented in table 1.1 to 1.26. Presented also in table 3 are
the number of fishermen in each district and region. Percentage of fishermen in the Volta
region is less 13.4% compared to that of the Greater Accra, Central and Western regions. The
total numbers in each region is presented below;
Table 1 Number of Fishermen in the Regions

Region Number of Fishermen Percentage (%)
Volta 18,150 13.4
Greater Accra 39,737 28.56
Central 40,563 29.15
Western 40,705 29.25
4.6 Cost of Fishing Inputs
It was realized that a 40hp Yamaha outboard engine which is the most popular sold between
Gh¢7,200 and Gh¢8,500 depending on the location of the coast it was bought. Engines of
lower capacities sold between GH¢3,200 and GH¢6,000. The very small motors like the 4 hp
and 9 hp also cost between GH¢1,500 and Gh¢3,000.
The large size nets for Watsa, Drift Gill nets and Beach Seines sold between Gh¢15,000 and
Gh¢40,000. Medium size set nets cost GH¢800 and Gh¢3,000 and small set nets for One Man
canoes also sold between Gh¢500 and Gh¢1,500.
Canoes for large heavy gears such as the big Beach Seines, Watsa and Drift Gill nets cost
between Gh¢10,000 and Gh¢26,000 whilst canoes for lighter gears like the Set nets sold
between Gh¢500 and Gh¢8,000. One Man Canoes were also sold between GH¢500 and
GH¢1,500.
Table 5 shows mean ranges of price of canoes, fishing gears and outboard motors.
4.7 Fish Sharing Systems
In the marine artisanal fisheries in Ghana, the daily catches by each fishing unit are usually
shared according to laid down ratios. A percentage of the catch goes to the crew on one side
and the owner of the craft, gear (net) and outboard motor. The sharing system from village to
village is more or less similar within the regions and does not differ much from year to year.
Table 10 shows the various sharing systems within the regions.
4.8 Fishing Holidays
Along the coast of Ghana, at least one day in a week is observed as a fishing holiday by the
various fishing communities. The day usually varies in the various communities along the
coast. However, a few communities in the Volta Region were noted of not having any fishing
holiday. A summary of the various days observed as fishing holidays by different regions are
presented below:

Region Fishing Holiday
Volta Region Tuesday, Wednesday, Thursday and Sunday
Greater Accra Region Tuesday
Central Region Tuesday
Western Region Tuesday, Thursday and Sunday
4.9 Migration Patterns
Based on information collected during the survey, two types of migration patterns were
detected. These were migrations within or outside the country.
Often, the Ghanaian fisherman migrates beyond Ghana’s territorial waters and can be found
as far as Mauritania to the north and Angola to the south. They could stay away for a few
months to several years. There were a few reported cases of canoes coming from
neighbouring countries around the eastern border especially from the Republic of Togo and
Republic of Benin. Immigrant fishers pay a token fee “drink” to the chief fisherman of the
landing village they take sojourn. They normally stay for a few months and get back to their
home countries.
4.10 Comparison of Results with Previous Surveys
4.10.1 Canoes
Table 5 shows comparison of the 2013 survey with the previous surveys. There is seen an
increase in the number of canoes since the 1997 survey. A 13.5% increment is seen from the
2004 numbers of 11,213 to the current 12,728 canoes registered.
4.10.2 Outboard Motors
With regards to outboard motors since 1981 there has been increasing trends in the numbers
until in 1992 when there was an 8 percent decrease. The current survey registered 9,313
motors giving a high motorization level of 73.2 percent.
4.10.3 Fishermen
Historically the number of fishermen population have increased over the years except
between 1986 and 1989 when there was a 12.7 percent decrease. However in 2013 survey,
139,155 fishermen were recorded giving a 12 percentage increase from the previous survey.

5.0 DISCUSSIONS
5.1 Number and type of canoes
Total enumeration of canoes, gears and fishing inputs in all the fishing districts along the
coast to evaluate the status of the marine artisanal fisheries sector has being a periodic
exercise. This present survey incorporated some socio-economic aspects of the artisanal
fishery and where livelihoods are changing rapidly due to varying factors such as access to the
resources and changes in socio-economic trends within the environment.
The total number of active canoes in comparison to that of 2004 recorded an increment of
13.5% nationally. It is consistent with the results from Koranteng et al 1987, 1992 who also
recorded an increase in the number of canoes during those surveys. This increase is not
equally distributed among the regions; Central Region shows a decrease of 12.5% opposite to
the Volta, Greater Accra and western regions that had an increase in the number of canoes.
5.2 Number of Types of Fishing Gear
In the canoe categories, of the five types of canoes that increased in numbers, the Drifting Gill
Net canoe is 87.7 percent up on 2004. Other Set nets and One Man canoes have however
decreased in numbers by 143 and 49 respectively since the last survey in 2004. This is
because Set nets are becoming less profitably to operate and the use of One Man canoes also
of less significance.
5.3 Number of Types of Outboard Motors
9,313 outboard engines were recorded in the survey depicting a high percentage of 73.2
percent level of motorization. There has been an increment of 45.4 percent level of
motorization since the 2004 survey. Over 80 percent of these motors were of the Yamaha
brand because it is a dominant brand in the market and mostly preferred by fisher folks. Other
brands encountered were of lower capacities of Yamaha, Johnson, and Suzuki etc.
On regional basis the Western Region had the highest number of motors of 3,454 which
constitutes some 37 percent of the national total. This could possibly be due to the dominance
of Drift Gill net canoes in the region whose operations fishing offshore require the use of
motors. Investment in motors in this fishery is worthwhile and it is therefore not uncommon
to see some of these canoes using two motors for a trip.
Number of motors recorded in the Central, Greater Accra and Volta regions were 3016, 2449
and 426 respectively. The highest percentage of crafts with engines comes from the Greater
Region. 83.5 percent of crafts in this region were motorized. Central region follows with 77.4
percent, Western Region comes next with 68.9 percent and Volta Region comes last with the
least level of motorization (47.3 percent).
There have been increases in sizes of canoes in recent times. Large canoes like those that
operate the Pursing nets and Drifting Gill nets were planked up to increase height and width
to carry heavier gears. Without powerful motors to propel them, operations would be difficult
if not impossible.
The increases in the number of canoes and gears over the years could possibly be due to open
access in the artisanal sector, subsidy packages and tax wavers on imported fishing inputs and
also because there are few alternative source of employment in the coastal areas.
5.4 Number of Fishing Villages and Landing Beaches
Compared with the previous survey in 2004, the number of fishing villages throughout the
four regions had decreased by 9 during the count. These were noticed especially in the Volta
and Greater Accra regions. The number of landing beaches also decreased by 32 in the current
enumeration, as only 302 landing sites were recorded as against 334 in the 2004 survey.
Although the construction of a sea defense wall at Keta in 2004 effectively stopped the
erosion and reclaimed land that were submerged the numbers nevertheless of landing beaches
decreased again because of the resurgence of the coastal erosion in the area over the period
2004-2013. Beside Keta, the coastal erosion is taking its toll in other coastal areas of the
country especially the sand beaches in the Greater Accra region Glefe and some parts of
Central region. Migrations of canoes to nearby fishing countries have led to some fishing
villages and landing beaches in the Greater Accra Region and the Western Region to be
inactive.
5.5 Number of Fishermen
The total number of fishermen enumerated in the survey was 139,155. This showed a 12
percent increase from the 2004 survey which recorded 124,219 fishermen. From the regional
breakdown, 13 percent of all the fishermen were in the Volta Region, 28.6 percent in the

Greater Accra Region, 29.1 percent in the Central Region and 29.3 percent of fishermen or
were recorded in the Western Region.
5.6 Cost of Fishing Input
The cost of fishing input depends on location, sizes and ages of equipment. The most
expensive artisanal fishing net is the Poli/Watsa net which costs between Gh¢15,000 and
Gh¢30,000 This was followed by large beach seine nets between Gh¢7,000 and Gh¢30,000
Drift Gill Net is also sold between Gh¢7,000 and Gh¢15,000. The gear for line fishing was
the cheapest and they cost between Gh¢750 and Gh¢1, 500. With respect to canoes, those for
Drift Gill nets, Pursing nets and Beach Seine operations were the most expensive; costing
between Gh¢10, 000 and Gh¢20, 000.
The artisanal fishing fleet is self-financing as canoe fishermen virtually have no access to
institutionalized form of credit. They depend on local money lenders and traders when it
becomes necessary to raise funds to replace their fishing gear.
5.7 Fishing Sharing System
The sharing system from village to village are more or less similar with in the regions and
according to laid down rations. These do not diferr from year to year (Koranteng and
Nmashie, 1987).
5.8 Fishing Holidays
Fishinh holidays or non-fishing days are usually on Tuesdays however in some villages
especially in the volta and western regions they differ. Thses days are usually used to repaur
nets .
5.9 Migration Patterns
Fishermen still migrate to other villabes or out of the country for several reasons. Usually
within the country its mainly due to rough beaches and chasing fish which are more abundant
in a particular locality. Others migrate to seek greener pastures all along the western African
coast and beyond.
6.0 SOCIO-ECONOMIC STUDIES
Fisheries development aims at improving the socio-economic conditions of the fisher folks.
Their social systems can play an important role in the local ecosystem hence these systems

must be studied and understood clearly to help policy makers to bring to the fishers acceptable
and beneficial innovations to improve their living standards.
In order to have an idea of the socio economic conditions of the fisher folks along the coastal
districts of Ghana, a primary data was collected as part of the canoe frame survey. Socio-
economic parameters such as family size, age structure, education etc. was collected from
various sample centres in the Volta, Greater Accra, Central regions and the Western region.
This study aimed at presenting a semblance of the socio-economic situation of the fisher folk.
110 fishers; 70 fishermen and 40 fish mongers were interviewed using the semi-structured
interview method. A more in depth study is required to confirm or reject the findings
presented here.
The fishing workforce
In fishing communities family sizes are large, ranging from 6-20 per household. This is
largely informed by the high demands for labour for the key stages of pre and post-harvest
activities. A typical fish-family comprises of a canoe owner and his immediate family
members, made up of one or several wives and children. This core family is in turn supported
by external relations such as nieces, nephew and cousins, who may constitute the crew
members of a canoe, or help in fish processing. Such an arrangement has provided the needed
workforce and employment in the artisanal fishery industry over the years.
Children are not left out of the fishing business as they form an integral part of the community
structure. They learn on the job and through that gain experience and knowledge in fishing
and other management practices.
Gender in marine artisanal fisheries
Gender roles in the artisanal marine fishery sector have been clearly defined for years. The
marine canoe fishery involves intensive labour. Fishermen can be as young as 7 years or as
old as 70 years. The male youths perform the hard tasks ranging from pushing the canoe to
and from the beach, casting, setting, dragging nets and often carrying fish. The elderly are
usually involved in the management and supervisory roles, providing logistics for crew
member’s net mending and facilitating arrangements for fishing expeditions.
The intrinsic role played by women is well defined. Women contribute significantly in
activities such as processing and distribution of fish landed. Most women lack the needed
capital to engage in fish processing and access to loans from financial and non-financial
institutions are hard to come by.
Socioeconomic issues concerning fishers
FISHERMEN
Seventy fishermen were interviewed on various issues and the results are presented below.
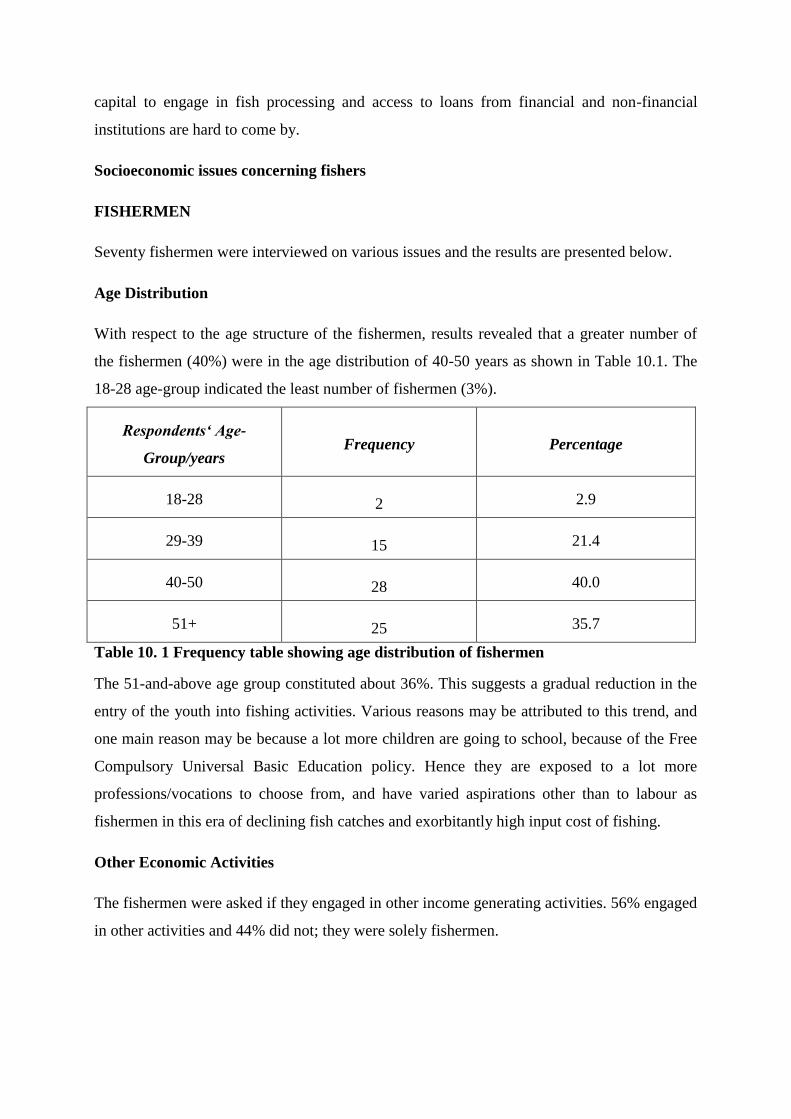
Age Distribution
With respect to the age structure of the fishermen, results revealed that a greater number of
the fishermen (40%) were in the age distribution of 40-50 years as shown in Table 10.1. The
18-28 age-group indicated the least number of fishermen (3%).
Respondents‘ Age-
Group/years Frequency Percentage
18-28 2 2.9
29-39 15 21.4
40-50 28 40.0
51+ 25 35.7
Table 10. 1 Frequency table showing age distribution of fishermen
The 51-and-above age group constituted about 36%. This suggests a gradual reduction in the
entry of the youth into fishing activities. Various reasons may be attributed to this trend, and
one main reason may be because a lot more children are going to school, because of the Free
Compulsory Universal Basic Education policy. Hence they are exposed to a lot more
professions/vocations to choose from, and have varied aspirations other than to labour as
fishermen in this era of declining fish catches and exorbitantly high input cost of fishing.
Other Economic Activities
The fishermen were asked if they engaged in other income generating activities. 56% engaged
in other activities and 44% did not; they were solely fishermen.

Table 10.2 shows that majority (60%) of those who engaged in other ventures preferred to
farm, while only a few (10%) were involved in vocations such as masonry, carpentry, basket
weaving, etc.
Other Economic Activities Frequency Percentage (%)
Farming 42 60
Trading 10 14.3
Others 7 10
No Response 11 15.7
Table 10. 2 Other economic activities of fishermen
It is interesting to note that quite a number of the fishers would not tell what other jobs they
were into.
The interview also revealed that most of the fishermen’s wives are involved in some income
earning activity. Majority (66%) of the wives of the fishermen are fish mongers as shown in
Table 10.3.
Profession Frequency Percentage (%)
Fish Monger 46 66
Trader 10 14
Farmer 6 9
No Response 4 6
Unemployed 4 6
Table 10. 3 Fishermen’s Wives Major Professions
Only a few (6%) were not employed. Here again some would not tell whether they were
employed, or what they were into. Reasons were not given for their non-response, though.
Marital Status

In response to their marital status, about 96% of the fishermen said they are married, 2% were
single. Widowers constituted about 1% of the respondents, as shown in Table 10.4.
Marital Status of Fishermen Frequency Percentage
Married 67 95.7
Single 2 2.8
Widowed 1 0.7
Table 10.4 Marital status of fishermen
Out of the married, most (70%) percent of them have one wife, about one in five have two
wives and less than 10% married to three or more women.
The average family size is seven.
Number Of Wives Frequency Percentage (%)
1 49 70.0
2 13 19.0
3 4 6.0
4 1 1.0
NO RESPONSE 3 4.0
Table 10. 5 No. of wives of fishermen
Educational Background
The educational background of fishers was ascertained during the interview. Table 10.6
shows that 40% of the respondents had attained primary level of education. Less than one in
20 fishermen had attained the Junior High School certificate, 2% of the respondents having
Senior High School certificate. 2% of the respondents had tertiary education
Educational Level Frequency Percentage (%)
None 36 52

Primary 28 40
JHS/Middle Sch. 3 4
SHS./Diploma 1 2
Tertiary 1 2
Table 10.6 Educational level of fishermen
It is disheartening to note that majority of the fishermen (52%) had no education; and a large
number (40%) also do not have complete basic education, i.e. JHS or Middle School. The
high number of primary school leavers, but very few JHS graduates also suggests a high
school dropout rate among the respondents.
RELIGION
Table 10.6 points out that majority of the respondents are Christians, 16% are traditional
believers, 2% of the respondents are Muslims and the remaining 6% of the respondents are
believers of other religions such as Buddhism, Hare Krishna and so on.
Religion of Fishermen Frequency Percentage
Christian 53 76.0
Islam 1 2.0
Traditional 11 16.0
Others 4 6.0
Table 10.7 Religion of Fishermen
FISH MONGERS
Forty fish mongers were interviewed on issues such as how long they had been in their
business, the type of processing and/or preservation they are engaged in, other post-harvest
issues and what avenues they perceive as sources for enhancing their business.
Marital Status
Four-fifths of the women interviewed were married, as depicted in table 10.7

Marital status Frequency Percentage
Married 32 80
Not married 8 20
Table 10.7 Marital status of respondents (Fishmongers)
When asked who offered child support to their children, majority (52%) of the fishmongers
said that they were solely responsible for their children’s upkeep as shown in Table 10.8. This
is interesting and yet discouraging, granted that an overwhelming majority of these women
are married. However no further probing was done to find out the reason for this trend.
Provider of child support Frequency Percentage(%)
Self 21
52
Husband 17
42
Extended Family 2
6
Table 10.8 Provider of fishmongers' children support
Length of time as a fishmonger
Although the ages of the respondents were not ascertained, fish mongers with over 40 years in
the business can be fairly said to be in the older age group and from Table 10.9 it can be seen
that that fishmongers in this group were more, concluding that more of the older generation
are in the business.
Length of time as a fish
monger/years Frequency Percentage(%)
40 + 12 30
21-30 11 28
11-20 7 18
1-10 5 12
31-40 5 12
10.9 Length of time as a fishmonger
This assertion notwithstanding, it is evident that fish mongers who have been in the business
from 31 to 40 years are the least. Reasons were not found out, and it is believed that an
extensive survey with a representative sample size might give a clearer trend. Five
respondents each have been in business for up to 10 years and from 31 to 40 years.
Fish processing/preservation
The main method of processing fish in Ghana is smoking (Kegan, 2001). Most of the
respondents confirmed this, as 76% of them said they smoke their fish before they sell. 4%
salt their fish, 4% fry their fish and 16% of the respondents either dry or salt their fish before
they sell, presented in Table 10.10.
Fish processing method Frequency percentage
Smoked 30 76.0
Salted 2 4.0
Fried 2 4.0
Salted & dried 6 16.0
Table 10.10 Fish processing methods among fish mongers
Post-harvest loss
Majority of the respondents (70%) acknowledged that they experience fish spoilage at times.
Such situations are a source of income loss to them. Table 10.11 shows that more than half
(58%) of them attributed the fish spoilage they experience to the presence of moulds.
Perceived causes of
post-harvest losses Frequency Percentage
Moulds 23 58.0
Insect Infestation 12 30.0

Others 5 12.0
Table 10.11 Fishmongers' perceived causes of post-harvest losses
Thirty percent (30%) blamed insect infestation while others said the absence of, and improper
storage facilities results in poor humidity/ventilation, which in turn caused their fish to spoil.
Finance
Financing fishing ventures comes from their own initial savings and contributions from
family members. Women agents serve as a major source of interest free loans for the
fishermen to ensure that when fish are landed, they would be the first to receive their supply.
Table 10.12 shows how much fishmongers spend in their various processing methods.
Oil (for frying)
70.00 – 90.00
Salt (salting) 10.00 – 30.00
Charcoal (smoking ) 100.00 and above
Chorkor smoker 100.00 and above
Firewood 100.00 and above
Table 10.12 Costs associated with various fish processing methods
Income derived from fishing is shared among the household and the crew at the end of each
fishing trip or season, after some amount has been set aside for daily operational costs. Other
expenses such as the repayment of loans for purchasing canoes, out-board motor and gears to
their respective owners are also set aside.
Operational costs fishermen incur are as shown in Table 10.13
Input Price range (GH¢)
Premix
Food 100.00 – 200.00
Communication 5.00
Trip maintenance i.e. carting fish, minor net
mending, carburetor servicing, etc. 200.00 – 300.00
Table 10.13 Operational costs incurred by fishermen
Costs of purchasing canoes and gear are presented in Table 4

Fishmongers were asked where they obtain funds for their business. From Table 10.14
summarises their sources of funding. 2% of the respondents fund their business from
associations, 46% of the respondents admitted that they borrow money from the bank, 16% of
the respondents get some help from government and 34% finance their business from their
own money.
Source of funds Frequency Percentage (%)
Associations Funds 2
4.0
Microfinance loan 18
46.0
Government assistance 6
16.0
Self 14
34.0
Table 10.14 Sources of funding of fishmongers' business
Fishers’ Suggestions on Ways of Enhancing their Work
On suggestions for the improvement and enhancement of the fisheries sector, the fisher folks,
both fishermen and fishmongers, made very important inputs.
Fishmongers
A large majority of the fishmongers (76%) wanted loans from government to improve their
business. About a tenth of them wanted financial assistance in the provision of Chorkor
smokers.
Improvement of the fisheries
sector Frequency Percentage
Loans from gov't 30 76
Assistance in the provision of
Chorkor smokers 5 12
Infrastructure
2 4
Transportation 3 8
Table 10.15 Fishmongers' suggestions on improvement of the fisheries sector

Fishermen
42% of the fishermen were of the view that loans from Government will go a long way to
enhance their work. 24% suggested the regular supply of premix fuel since unavailability of
the fuel delays their fishing (Table 10.16).
Table 10.16 Suggestions on way to improve the fisheries sector
In the ‘Others’ category, suggestions made included free education of their children and
transportation (motorized tricycles from government).
7.0 CONCLUSION AND RECOMMENDATIONS
Overall, the results of the survey indicate that the number of canoes increased by 13.1% from
the previous survey of 2004. Over 73.17% of canoes were motorized about 16.1% up from the
2004 survey. Number of fishermen in the sector has increase by 14936 people from 124219 in
2004 to 139155 in 2013. Increase in the number of gears was in mainly the Drift Gill Nets
(87.7%) and not other Set Nets which had the highest increase in numbers in 2004 but has
decreased by 143 in the current survey. From the last survey, a total of five fishing villages
Fishers’ suggestions on ways
to improve the fisheries sector Frequency Percentage
Loans from government 29 42.0
Regular supply of inputs
especially premix fuel 17 24.0
Free education of children 4 5.0
Infrastructural development e.g.
cold stores 3 4.0
Education on fisheries laws 1 2.0
Others 16 23.0

and twenty landing beaches have been lost with the majority from the Volta region followed
by Greater Accra region.
Given the changes observed in the numbers of canoes, fishermen, gears, new landing sites etc.
and also of the socio-economic status of the fisher folks over period during the survey, it is
necessary to monitor the effect these changes have on the status of the artisanal marine sector
by updating the canoe frame surveys periodically.
ACKNOWLEDGEMENT This publication has been produced with the kind assistance of the Department for
International development (DFID) of the United Kingdom Great Britain and Northern
Ireland; through the NEPAD Agency’s Partnership for African Fisheries (PAF). We are most
appreciative of their support.
We are also grateful to Regional Directors of Fisheries (Messrs Matthew Oyih-Volta Region;
Scott Apawudza- Greater-Accra Region; Papa Yaw Atobra- Central Region; and Alexander
Sabah- Western Region), the various Chief fishermen and their elders and also the Director of
Fisheries Samuel Quaatey and Paul Bannerman the Deputy Director for their encouragement,
corrections and suggestions during the conduction of the frame survey.
We acknowledge the contributions of all District officers, Technical officers, Technical
assistants, drivers for their support during the survey. We also thank all the retired technical
officers who even out of retirement came to train the young and upcoming officers and also
for their assistance.
To all others who supported us in diverse ways we are most grateful.
References Anon; 2011): Annual report for the Fisheries Commission 2011
Amador K et al 2006 Ghana Canoe Frame Survey 2004. MFRD Info Report no. 34 2006
Banerji S.K. (1972): Fisheries Statistics in West Africa. Work undertaken during the period
September 1971 - February 1973 FAO, Rome WS/E7 100: 16pp.
Doyi, B.A (1984): Catalogue of snmall-sacle fishing gear of Ghana, CECAF/ECAF series
84/31 (en) FAO Rome.
FAO (1991): FAO year book Fisheries Statistic catches and landing 1989, FAO, Fisheries
Series 36 and FAO Statistics series 68. Rome, FAO.
Koranteng, K.A. and O.O. Nmashie and A.N.A. Baiddoo (1992): Ghana Canoe Frame survey
1992. Fisheries Department, Research and Utilization Branch, Tema, Ghana, August 1993.
Koranteng, K.A. and O.O. Nmashie (1987): A report on the 1986 Ghana Canoe Frame
Survey, Inf. Rep. No. 21, Research & Utilization Branch, Tema, Ghana.
Appendices
Tables 1-26
Figures 1-7
Questionaires

Table 2.1a -1z Results of Frame Survey showing number of fishing units by gear for all districts
FISHING VILLAGE LANDING BEACH
PURSING
NETS
BEACH
SEINE LINE
LOBSTER
NETS
OTHER
SET NETS ALI NET
DRIFTING
NET
ONE MAN
CANOE CANOES
TOTAL
MOTORS FISHERMEN
AFLAO ABELIAKOPE 2 18 20 40 2 329
AFLAO SAPENUKOPE 1 1 1 30
AFLAO AKLIGOKOPE 1 5 6 170
DENU DENU 11 2 3 16 16 332
HEDRANAWO HEDRANAWO 10 7 17 17 456
ADAFIENU DZEGAKOPE 2 4 6 4 115
ADAFIENU ABGADZIKOPE 4 2 1 7 6 103
ADAFIENU DAVORKOPE 2 2 2 41
AGORKO TETEKOPE 1 2 3 16
AGORKO DAVIDKOPE 1 4 5 3 142
AGORKO AGORKO 13 2 15 11 389
ADINA ADINA 41 16 26 83 53 1328
AMUTINU AMUTINU 3 17 1 1 22 15 467
SALAKOPE SALAKOPE 5 3 3 11 7 212
AGAVEDZI AGAVEDZI 21 16 37 29 967
BLEKUSU BLEKUSU 28 4 32 12 664
HORVIE HORVIE 8 8 8 380
TOTAL 99 131 18 0 62 1 0 0 311 186 6141
TABLES 1.1a FISHING UNIT BY GEAR - KETU SOUTH DISTRICT (VOLTA REGION

FISHING VILLAGE LANDING BEACH PURSING NETS
BEACH SEINE LINE
LOBSTER NETS
OTHER SET NETS ALI NET
DRIFTING NET
ONE MAN CANOE CANOES
TOTAL MOTORS FISHERMEN
KEDZI AGORTA 11 2 16 29 440 KEDZI HORVI 8 8 8 380 VODZA VODZA 13 12 4 29 10 500 ADZIDO ADZIDO 8 14 5 5 1 33 8 200 KEDZIKOPE KEDZIKOPE 1 5 3 9 5 118 ABUTIAKOPE ABUTIAKOPE 2 21 1 70 12 106 32 860
DZELUKPE DZELUKOPE 17 21 1 39 3 450
VUI NUKPESEKOPE 8 9 17 2 157 VUI TETEVIKOPE 26 24 50 14 644 TEGBI HEKPA 12 1 13 5 433 TEGBI ADZIAKPOR 4 4 2 170 TEGBI DEKPORKOPE 10 4 14 5 410
TEGBI AMERIKOPE 4 4 2 115 TEGBI KLAMATSI 6 1 7 5 275 TEGBI HELOGLOKOPE 3 6 9 1 95 TEGBI WOYANA 5 3 8 4 230 TEGBI ASHIATA 4 1 5 3 195 WOE LIGHTHOUSE 7 7 6 320 WOE DEKPEKOPE 5 5 2 140 WOE AKLUBORORDZI 6 6 5 205 WOE AKROBODZI 10 10 3 69 ANLOGA ATIEFE 16 16 8 880 ANLOGA CAPECOAST 11 11 2 440 ATORKOR WHUTI 13 13 4 550 SROGBE SROGBE 7 1 8 2 330 ATORKOR ATORKOR 8 6 14 5 432 ATORKOR DAKORDZI 2 2 100 AKPLORTORKOR AKPLORTORKOR 3 3 150 DZITA DZITA 16 1 17 3 776 DZITA AGBEDOME 16 1 17 4 855 ATITETI ATITETI 8 13 21 13 571 ATITETI FUVEME 4 37 1 42 42 519
TOTAL 24 292 12 0 212 17 13 6 576 208 12009
TABLES 1.1b FISHING UNIT BY GEAR - KETA DISTRICT (VOLTA REGION)

FISHING VILLAGE LANDING BEACH
PURSING
NETS
BEACH
SEINE LINE
LOBSTER
NETS
OTHER
SET NETS ALI NET
DRIFTING
NET
ONE MAN
CANOE CANOES
TOTAL
MOTORS FISHERMEN
AZIZANYA MATAHEKO 24 1 1 26 23 636
AZIZANYA ADJIVONPANYA 12 2 1 15 10 371
KEWUNOR KEWUNOR 5 8 13 6 405
LOLONYAKOPE LOLONYAKOPE 2 3 1 6 2 183
OTROKPE KPONKPO 13 2 15 15 474
OTROKPE MANKPETI 10 3 1 1 15 14 175
OTROKPE DOEMEKOPE 5 3 2 10 10 349
TOTIMEKOPE TOTIMEKOPE 1 1 1 25
OCANSEYKOPE OCANSEYKOPE 1 4 1 6 3 139
ANYAKPOR ANYAKPOR 5 5 16 15 41 38 549
SONGNTSOKPA SONGNTSOKPA 11 2 13 13 271
PATUKOPE PATUKOPE 7 2 9 7 240
ELAVANYO ELAVANYO 1 11 12 8 688
PUTE PUTE 35 8 43 43 1170
TOTOPE TOTOPE 14 14 8 269
TOTAL 146 50 0 0 20 19 4 0 239 201 5944
Table 1.1c FISHING UNIT BY GEAR - DANGME EAST( GREATER ACCRA REGION

FISHING VILLAGE LANDING BEACH
PURSING
NETS
BEACH
SEINE LINE
LOBSTER
NETS
OTHER
SET NETS ALI NET
DRIFTING
NET
ONE MAN
CANOE CANOES
TOTAL
MOTORS FISHERMEN
KABLEVU KABLEVU 1 5 6 6 265
KABLEVU KPOTITSEKOPE 4 4 4 200
LOLONYA LOLONYA 19 5 1 1 26 26 748
GOI GOI 10 4 6 12 32 32 516
ANYAMAM ANYAMAM 66 42 1 1 110 110 3678
AKPLABANYA AKPLABANYA 161 4 165 165 4199
WEKUMAGBE WEKUMAGBE 15 5 1 3 24 24 598
TOTAL 272 69 1 9 14 0 2 0 367 367 10204
Table 1.1d FISHING UNIT BY GEAR - ADA WEST DISTRICT – GREATERA(ACCRA REGION)

FISHING VILLAGE LANDING BEACH
PURSING
NETS
BEACH
SEINE LINE
LOBSTER
NETS
OTHER
SET NETS ALI NET
DRIFTING
NET
ONE MAN
CANOE CANOES
TOTAL
MOTORS FISHERMEN
LEKPONGUNOR ZONGO/ANASI 16 5 21 15 318
LEKPONGUNOR NMETSOKOPE 19 4 3 4 30 3 567
LEWEM LEWEM 7 3 3 4 1 1 19 12 328
KPONGUNOR AFIYONYA 1 4 6 11 5 168
AYETEPAH AYETEPAH 1 1 6 8 1 67
MANGOTOSNYA MANGOTOSNYA 4 5 6 15 12 141
AHWIAM AHWIAM 7 70 48 125 113 881
OLD NINGO OLD NINGO 14 2 3 1 20 538
NEW NINGO TOZAH 1 37 3 41 38 434
ABIA ABIA 9 9 9 135
U/PRAMPRAM FUKUDORNYA 1 24 25 23 325
L/PRAMPRAM LIGHTHOUSE 48 1 4 2 55 55 787
TOTAL 118 12 156 7 71 1 14 0 379 286 4689
Table 1.5 DANGMBE WEST DISTRICT - GREATER-
ACCRA REGION

FISHING VILLAGE LANDING BEACH
PURSING
NETS
BEACH
SEINE LINE
LOBSTER
NETS
OTHER
SET NETS ALI NET
DRIFTING
NET
ONE MAN
CANOE CANOES
TOTAL
MOTORS FISHERMEN
KPONE LAA LOI NAA 8 19 7 6 40 37 487
KPONE ODUNYAONMA 56 14 6 10 86 51 658
KPONE SEGA 3 114 8 4 10 139 76 1151
TOTAL 11 0 189 0 22 17 26 0 265 164 2296
FISHING VILLAGE LANDING BEACH
PURSING
NETS
BEACH
SEINE LINE
LOBSTER
NETS
OTHER
SET NETS ALI NET
DRIFTING
NET
ONE MAN
CANOE CANOES
TOTAL
MOTORS FISHERMEN
TEMA ASHAMANG 53 49 18 66 186 137 870
TEMA AWUDUN 308 4 312 308 6789
SAKUMONO SAKUMONO 5 15 3 23 2 254
TOTAL 308 5 68 4 52 18 66 0 521 447 7913
FISHING VILLAGE LANDING BEACH
PURSING
NETS
BEACH
SEINE LINE
LOBSTER
NETS
OTHER
SET NETS ALI NET
DRIFTING
NET
ONE MAN
CANOE CANOES
TOTAL
MOTORS FISHERMEN
NUNGUA TSIENAA 21 1 22 18 62 42 579
TESHIE SANGONAA 54 3 7 9 83 156 149 1264
TOTAL 75 3 8 0 31 101 0 0 218 191 1843
TABLE 1.8 LEDZOKUKU - KROWOR MUNICIPAL ASSEMBLY DISTRICT - GREATER-ACCRA REGION
Table 1.6 KPONE-KATAMANSO DISTRICT - GREATER-ACCRA REGION
Table 1.7 TEMA MUNICIPAL ASSEMLY - GREATER-ACCRA REGION

FISHING VILLAGE LANDING BEACH
PURSING
NETS
BEACH
SEINE LINE
LOBSTER
NETS
OTHER
SET NETS ALI NET
DRIFTING
NET
ONE MAN
CANOE CANOES
TOTAL
MOTORS FISHERMEN
LA PLEASURE BEACH 4 4 26
LA ABESE 2 1 2 16 21 12 86
TOTAL 2 5 2 0 16 0 0 0 25 12 112
FISHING VILLAGE LANDING BEACH
PURSING
NETS
BEACH
SEINE LINE
LOBSTER
NETS
OTHER
SET NETS ALI NET
DRIFTING
NET
ONE MAN
CANOE CANOES
TOTAL
MOTORS FISHERMEN
OSU ALATA 2 97 99 78 735
ACCRA GA MASHIE 122 32 7 40 45 246 237 1375
ACCRA KORLEY NAA 5 5 28
ACCRA MENSAH GUINEA 5 5 27
CHORKOR WOLEI AMLI 105 7 14 126 119 1065
CHORKOR MANTSURU 72 5 77 77 634
CHORKOR LANTEMAN 49 4 53 53 448
CHORKOR CHEMU NAA 34 12 46 46 336
GBEGBEYISEE GBEGBEYISEE 40 11 19 3 73 61 470
TOTAL 424 28 129 7 59 83 0 0 730 671 5118
TABLE 1.10 ACCRA METROPOLITAN ASSEMBLY DISTRICT -GREATER-ACCRA REGION
TABLE 1.9 LA-DADEKOTOPON MUNICIPAL DISTRICT -GREATER-ACCRA REGION

FISHING VILLAGE LANDING BEACH
PURSING
NETS
BEACH
SEINE LINE
LOBSTER
NETS
OTHER
SET NETS ALI NET
DRIFTING
NET
ONE MAN
CANOE CANOES
TOTAL
MOTORS FISHERMEN
BORTIANOR TSOKOME 5 3 8 3 163
BORTIANOR BORTIANOR 28 47 2 2 4 83 65 571
OSHIE OSHIE 7 1 11 16 35 15 218
KOKROBITE KOKROBITE 12 4 2 27 1 46 22 392
LANMA LANMA 2 7 9 1 178
FAANAA FAANAA 7 7 4 96
TOTAL 54 22 47 15 45 5 0 0 188 110 1618
FISHING VILLAGE LANDING BEACH
PURSING
NETS
BEACH
SEINE LINE
LOBSTER
NETS
OTHER
SET NETS ALI NET
DRIFTING
NET
ONE MAN
CANOE CANOES
TOTAL
MOTORS FISHERMEN
SENYA BERAKU MBANYINMPOANO 28 1 59 9 21 2 120 79 1067
SENYA BERAKU ODUMSANO 20 3 23 18 484
SENYA BERAKU AHWIASO 5 5 5 180
TOTAL 48 9 59 9 21 2 0 0 148 102 1731
TABLE 1.11 GA SOUTH DISTRICT - GREATER-ACCRA REGION
TABLE 1.12 AWUTU-SENYA DISTRICT - CENTRAL REGION
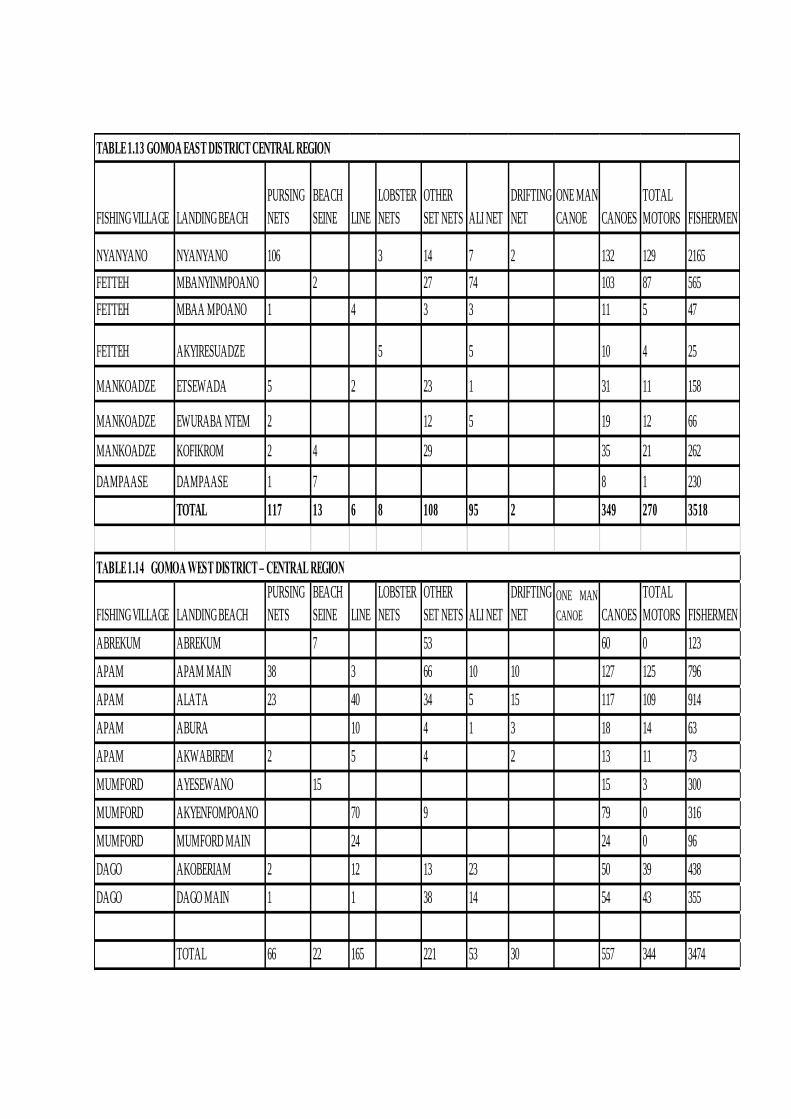
FISHING VILLAGE LANDING BEACH
PURSING
NETS
BEACH
SEINE LINE
LOBSTER
NETS
OTHER
SET NETS ALI NET
DRIFTING
NET
ONE MAN
CANOE CANOES
TOTAL
MOTORS FISHERMEN
NYANYANO NYANYANO 106 3 14 7 2 132 129 2165
FETTEH MBANYINMPOANO 2 27 74 103 87 565
FETTEH MBAA MPOANO 1 4 3 3 11 5 47
FETTEH AKYIRESUADZE 5 5 10 4 25
MANKOADZE ETSEWADA 5 2 23 1 31 11 158
MANKOADZE EWURABA NTEM 2 12 5 19 12 66
MANKOADZE KOFIKROM 2 4 29 35 21 262
DAMPAASE DAMPAASE 1 7 8 1 230
TOTAL 117 13 6 8 108 95 2 349 270 3518
FISHING VILLAGE LANDING BEACH
PURSING
NETS
BEACH
SEINE LINE
LOBSTER
NETS
OTHER
SET NETS ALI NET
DRIFTING
NET
ONE MAN
CANOE CANOES
TOTAL
MOTORS FISHERMEN
ABREKUM ABREKUM 7 53 60 0 123
APAM APAM MAIN 38 3 66 10 10 127 125 796
APAM ALATA 23 40 34 5 15 117 109 914
APAM ABURA 10 4 1 3 18 14 63
APAM AKWABIREM 2 5 4 2 13 11 73
MUMFORD AYESEWANO 15 15 3 300
MUMFORD AKYENFOMPOANO 70 9 79 0 316
MUMFORD MUMFORD MAIN 24 24 0 96
DAGO AKOBERIAM 2 12 13 23 50 39 438
DAGO DAGO MAIN 1 1 38 14 54 43 355
TOTAL 66 22 165 221 53 30 557 344 3474
TABLE 1.14 GOMOA WEST DISTRICT – CENTRAL REGION
TABLE 1.13 GOMOA EAST DISTRICT CENTRAL REGION

FISHING VILLAGE LANDING BEACH
PURSING
NETS
BEACH
SEINE LINE
LOBSTER
NETS
OTHER
SET NETS ALI NET
DRIFTING
NET
ONE MAN
CANOE CANOES
TOTAL
MOTORS FISHERMEN
WINNEBA AYIPEY 56 35 25 27 143 108 1539
WINNEBA ABOADZE 24 5 19 48 43 498
WINNEBA PENKYI 12 16 33 61 61 494
WINNEBA AKOSUA VILLAGE 10 10 5 212
WINNEBA WARABEBA 5 5 5 198
TOTAL 92 15 40 0 41 79 0 0 267 222 2941
FISHING VILLAGE LANDING BEACH
PURSING
NETS
BEACH
SEINE LINE
LOBSTER
NETS
OTHER
SET NETS ALI NET
DRIFTING
NET
ONE MAN
CANOE CANOES
TOTAL
MOTORS FISHERMEN
OTUAM SASANO/NTSE 0
OTUAM ASESEM 11 22 13 46 42 378
OTUAM OBOM/ETUEI 16 52 7 75 69 600
KOTANKORE KOTANKORE 10 10 1 134
SRAFA SRAFA MPOANO 2 2 0 50
SRAFA ABO ANO 2 2 2 80
TOTAL 11 30 0 0 74 20 0 0 135 114 1242
TABLE 1.15 EFFUTU MUNICIPAL – CENTRAL REGION
TABLE 1.16 EKUMFI DISTRICT – CENTRAL REGION

FISHING VILLAGE LANDING BEACH
PURSING
NETS
BEACH
SEINE LINE
LOBSTER
NETS
OTHER
SET NETS ALI NET
DRIFTING
NET
ONE MAN
CANOE CANOES
TOTAL
MOTORS FISHERMEN
IMMUNA AMANSAFO 4 4 4 90
AKRA AKRA MPOANO 5 10 15 4 233
EKUMPOANO EKUMPOANO 5 7 12 11 201
NARKWA NARKWA MPOANO 32 2 3 37 37 838
ASAAFA EKUMFI ASAAFA 9 3 33 45 5 701
HINYI HINIYI 11 11 11 330
KUNTU PEBI 7 7 7 110
ANKAFUL ANKAFUL 70 4 74 74 1840
NANKESEDO NANKESEDO 15 4 1 20 20 284
SALTPOND SALTPOND 7 7 7 81
KROMANTSE 1 KROMANTSE 1 45 6 51 47 1110
KROMANTSE 2 KROMANTSE 2 8 2 1 11 10 178
ABANDZE ABANDZE 23 2 69 94 94 736
EGYA EGYA NO. 1 BEACH 29 6 2 37 31 131
EGYA EGYA NO. 2 BEACH 20 1 21 21 63
EGYA EGYA NO. 3 BEACH 4 6 10 2 25
ANOMABO KROM MPOANO 3 20 3 26 20 17
ANOMABO ATSIWA 4 3 4 64 13 88 76 387
ANOMABO AFARI KUMAWU 8 6 74 19 107 103 482
ANOMABO AHWEANO 25 14 12 51 51 691
ANOMABO BAKA ANO 14 10 5 1 30 30 409
BIRIWA ABAKA EKYIR 30 79 109 80 980
BIRIWA SIMA BREMU 4 2 26 32 14 233
BIRIWA OBER ENYIM 17 18 55 90 55 773
TOTAL 316 48 11 80 484 50 0 0 989 814 10923
TABLE 1.17 MFANTSEMAN DISTRICT – CENTRAL REGION
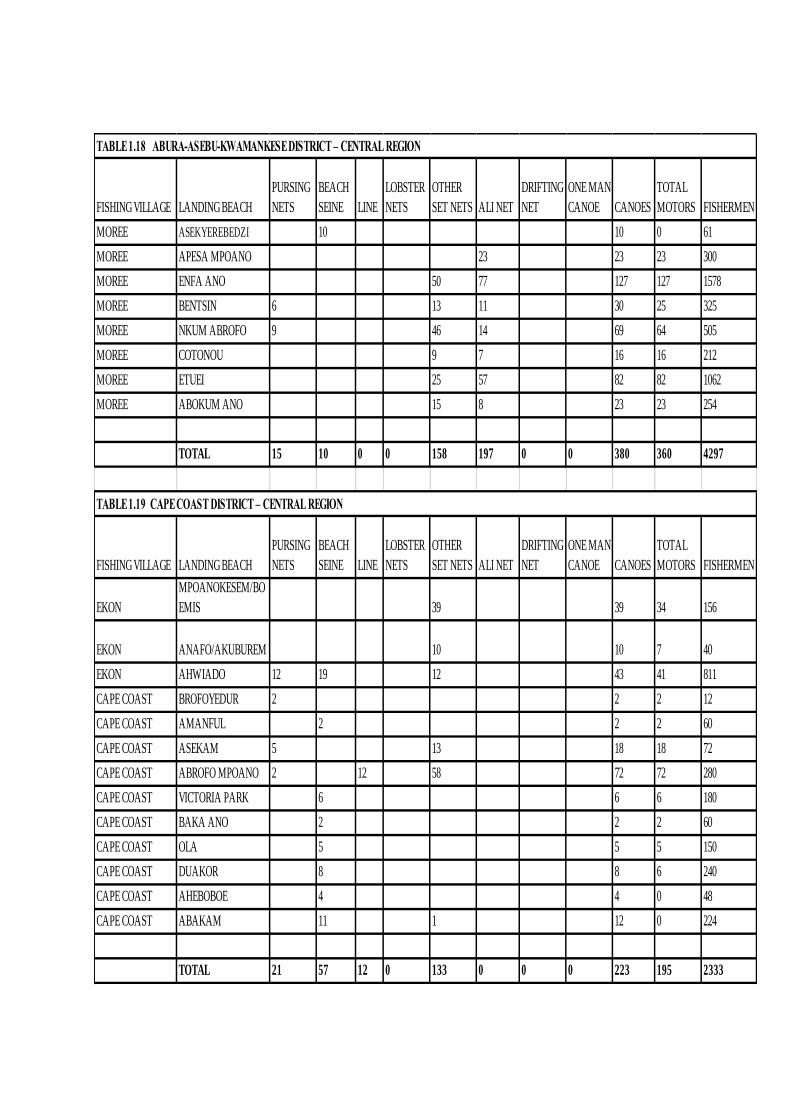
FISHING VILLAGE LANDING BEACH
PURSING
NETS
BEACH
SEINE LINE
LOBSTER
NETS
OTHER
SET NETS ALI NET
DRIFTING
NET
ONE MAN
CANOE CANOES
TOTAL
MOTORS FISHERMEN
MOREE ASEKYEREBEDZI 10 10 0 61
MOREE APESA MPOANO 23 23 23 300
MOREE ENFA ANO 50 77 127 127 1578
MOREE BENTSIN 6 13 11 30 25 325
MOREE NKUM ABROFO 9 46 14 69 64 505
MOREE COTONOU 9 7 16 16 212
MOREE ETUEI 25 57 82 82 1062
MOREE ABOKUM ANO 15 8 23 23 254
TOTAL 15 10 0 0 158 197 0 0 380 360 4297
FISHING VILLAGE LANDING BEACH
PURSING
NETS
BEACH
SEINE LINE
LOBSTER
NETS
OTHER
SET NETS ALI NET
DRIFTING
NET
ONE MAN
CANOE CANOES
TOTAL
MOTORS FISHERMEN
EKON
MPOANOKESEM/BO
EMIS 39 39 34 156
EKON ANAFO/AKUBUREM 10 10 7 40
EKON AHWIADO 12 19 12 43 41 811
CAPE COAST BROFOYEDUR 2 2 2 12
CAPE COAST AMANFUL 2 2 2 60
CAPE COAST ASEKAM 5 13 18 18 72
CAPE COAST ABROFO MPOANO 2 12 58 72 72 280
CAPE COAST VICTORIA PARK 6 6 6 180
CAPE COAST BAKA ANO 2 2 2 60
CAPE COAST OLA 5 5 5 150
CAPE COAST DUAKOR 8 8 6 240
CAPE COAST AHEBOBOE 4 4 0 48
CAPE COAST ABAKAM 11 1 12 0 224
TOTAL 21 57 12 0 133 0 0 0 223 195 2333
TABLE 1.19 CAPE COAST DISTRICT – CENTRAL REGION
TABLE 1.18 ABURA-ASEBU-KWAMANKESE DISTRICT – CENTRAL REGION

FISHING VILLAGE LANDING BEACH
PURSING
NETS
BEACH
SEINE LINE
LOBSTER
NETS
OTHER
SET NETS ALI NET
DRIFTING
NET
ONE MAN
CANOE CANOES
TOTAL
MOTORS FISHERMEN
ELMINA ESSUAKYIR 70 16 31 117 117 1834
ELMINA ASAMANPOWMU 18 3 23 40 84 64 693
ELMINA ELMINA MAIN 112 30 68 210 210 3363
BANTAMA DETSEDO 19 4 7 30 25 393
AKYINIM AKYINIM 14 14 0 392
ANKWANDA ANKWANDA MPON 10 14 3 10 37 8 150
BREMU AKYINMU DOGOFOMU 6 6 2 30
BREMU AKYINMU MOWUREFOM 1 1 1 3 1 17
BREMU AKYINMU BROFO MPOANO 3 12 3 18 3 90
AMPENYIN ANAFO 1 20 1 22 8 134
AMPENYIN ABAKAM 18 18 4 73
AMPENYIN BENTSIR 10 1 11 3 41
AMPENYIN BEREKESEMU 1 13 13 5 32 14 207
DUT. KOMENDA AWONA BEACH 3 3 0 72
DUT. KOMENDA
KANKAM
ANHWEADO 2 13 26 4 45 12 225
DUT. KOMENDA EWUGYAN 3 3 0 12
BRI. KOMENDA BAKA ANO 57 16 26 2 101 91 1688
BRI. KOMENDA SESAM 9 9 9 234
ABROBEANO ABROBEANO 9 13 2 24 2 103
KAFODZIDZI KAFODZIDZI 22 30 2 54 13 218
KAFODZIDZI ABAN ENYIM 3 6 9 9 135
TOTAL 289 17 56 93 338 31 0 23 7 595 10104
LANDING BEACH
PURSING
NETS
BEACH
SEINE LINE
LOBSTER
NETS
OTHER
SET NETS ALI NET
DRIFTING
NET
ONE MAN
CANOE CANOES
TOTAL
MOTORS FISHERMEN
SHAMA AWUNAKROM 33 33 0 1188
SHAMA APO 2 6 68 39 107 222 207 1287
SHAMA BENTSIR 29 36 187 252 252 1720
SHAMA AMENA-ANO 5 12 5 6 28 28 203
ABUESI ABUESI 47 13 60 60 950
ABUESI SAMAN-ADZE 15 10 25 25 350
ABUESI COMPOUND 32 3 10 45 45 665
ABOADZE BRONYI-BOMA 72 184 119 375 367 3232
ABOADZE EKROABEM 16 140 84 240 213 1380
ABUESI KESEWOKAN 27 7 44 78 78 903
TOTAL 216 33 6 443 360 300 1358 1275 11878
TABLE 1.20 KOMENDA EDINA EGUAFO ABREW DIASTRICT – CENTRAL REGION
TABLE 1.21 SHAMA DISTRICT WESTERN REGION

FISHING VILLAGE LANDING BEACH
PURSING
NETS
BEACH
SEINE LINE
LOBSTER
NETS
OTHER
SET NETS ALI NET
DRIFTING
NET
ONE MAN
CANOE CANOES
TOTAL
MOTORS FISHERMEN
NGYIRESIA NGYIRESIA 21 91 45 161 4 130 118 752
SEKONDI SEKONDI 80 69 6 155 155 155 1737
ESSAMAN
EGYINAMBOA
BAKAM 3 3 3 0 20
NKONTOMPO NKONTOMPO 28 3 35 4 35 19 84
POASE POASE 1 24 25 25 11 62
NEW TAKORADI NEW TAKORADI 49 49 49 33 131
TOTAL 101 3 70 192 54 428 4 4 397 336 2786
FISHING VILLAGE LANDING BEACH
PURSING
NETS
BEACH
SEINE LINE
LOBSTER
NETS
OTHER
SET NETS ALI NET
DRIFTING
NET
ONE MAN
CANOE CANOESTOTAL
MOTORS FISHERMEN
NEW AMANFUL AMANFU-KUMAN 1 15 25 15 62 62 388
FUNKO BENTIN BEACH 2 150 25 177 177 782
ADJOA UPPER BEACH 2 20 20 3 1 46 44 268
ADJOA LOWER BEACH 4 4 0 45
ENYIMA EHU ENYIMA EHU 2 14 1 17 3 74
PUNPUNI PUNPUNI BEACH 5 35 40 6 125
AMPATANO AMPATANO 1 100 100 4 4 209 23 830
ASEMKOW ASEMKOW 1 1 30 30 5 67 26 317
BUTRE AWUNA BEACH 4 4 0 144
BUTRE BUTRE ETROM 9 1 32 32 42 2 2 120 75 749
BUSUA BUSUA BEACH 2 20 20 6 14 1 63 63 509
UPPER DIXCOVE UPPER DIXCOVE 2 10 100 112 106 838
LOWER DIXCOVE LOWER DIXCOVE 4 2 6 4 320 2 338 336 2662
DIXCOVE TUROM 4 3 35 4 46 42 514
ACHOWA ACHOWA 1 10 1 15 27 2 80
AKWADAE AKWADAE 21 2 15 25 22 100 185 83 873
KETAKOR KETAKOR 10 2 15 27 5 63
CAPE-3-POINTS ATENKYEN 2 18 8 8 1 50 87 30 164
AKITAKYI AKITAYI MPOANO 25 6 8 15 15 20 89 63 947
PRINCESS TOWN PRINCESS TOWN 4 8 3 1 12 28 5 101
MIEMIA MIEMIA 23 25 10 58 38 524
AGYAMBRA ELAZULEYNU 20 20 0 20
TOTAL 87 27 28 327 459 161 475 256 1826 1189 11017
TABLE 1.22 SEKONDI TAKORADI METROPOLITAN ASSEMBLY - WESTERN REGION
TABLE 1.23 AHANTA WEST

FISHING VILLAGE LANDING BEACH
PURSING
NETS
BEACH
SEINE LINE
LOBSTER
NETS
OTHER
SET NETS ALI NET
DRIFTING
NET
ONE MAN
CANOE CANOES
TOTAL
MOTORS FISHERMEN
EGHAN EGHAN 8 50 58 8 58
DOMULI ADJEI-SUAZO 10 10 0 10
DOMULI AKONU 10 10 0 10
DOMULI DOMULI/TAHELAH 1 1 0 43
LOWER AXIM NKAKEMU 34 25 1 2 62 62 844
LOWER AXIM SIKA SANTEWASE 5 7 12 12 138
LOWER AXIM SIKA ABWIADO 21 7 28 28 488
LOWER AXIM ANTOAPEWUSIKA 6 2 1 28 37 9 259
LOWER AXIM FANTI-LINE 9 1 1 26 25 62 62 559
LOWER AXIM BOAT-ASE 10 2 12 16 40 24 334
LOWER AXIM SUKPOM 43 43 0 43
UPPER AXIM SOLO 2 4 23 29 6 71
UPPER AXIM AMANFOKUMANU 2 29 31 31 160
UPPER AXIM BRAWERE 20 20 20 400
UPPER AXIM ANTO BREWERE 38 38 38 560
UPPER AXIM AKYINIM 8 8 8 160
UPPER AXIM AWUNA-KROM 5 5 0 125
TOTAL 89 6 59 0 89 31 40 180 494 308 4262
TABLE 1.24 NZEMA EAST DISTRICT – WESTERN REGION

FISHING VILLAGE LANDING BEACH
PURSING
NETS
BEACH
SEINE LINE
LOBSTER
NETS
OTHER
SET NETS ALI NET
DRIFTING
NET
ONE MAN
CANOE CANOES
TOTAL
MOTORS FISHERMEN
ANKOBRA ANKOBRA 7 7 0 280
ASANTA ASANTA 9 9 3 300
KIKAM KIKAM 6 2 4 12 11 160
ESSIAMA ESSIAMA 11 6 17 6 730
AZULELUNUANU AZULELUNUANU 4 20 12 36 20 352
AMPAIN AMPAIN 3 3 0 136
BAKANTA BAKANTA 5 5 0 240
SANZULE SANZULE 4 4 0 160
KRISTIAN KRISTIAN 5 5 3 200
EIKWE EIKWE 3 3 0 120
NGALEKPOLE NGALEKPOLE 2 2 0 138
NGALEKYI NGALEKYI 5 5 0 200
BAKU BAKU 9 7 16 7 672
ANOKYI ANOKYI 3 3 0 120
ATUABO ATUABO 4 4 8 4 360
TOTAL 6 76 0 33 0 8 0 12 135 54 4168
TABLE 1.25 ELLEMBELE DISTRICT – WESTERN REGION

FISHING VILLAGE LANDING BEACH
PURSING
NETS
BEACH
SEINE LINE
LOBSTER
NETS
OTHER
SET NETS ALI NET
DRIFTING
NET
ONE MAN
CANOE CANOES
TOTAL
MOTORS FISHERMEN
AKABAKU AKABAKU 2 2 0 60
BENYIN BENYIN 3 4 7 4 140
ELLOYIN ELLOYIN 1 6 7 1 200
KANGEN KANGEN 3 9 12 3 183
TWENE TWENE 2 2 0 152
AGYEZA AGYEZA 2 3 5 3 13 7 260
EZINLEBO EZINLEBO 3 6 9 0 120
BONYERE BONYERE 7 2 9 0 73
EGBAZO EGBAZO 4 4 0 120
NEW AHOBRE AHOBRE KAKRABA 20 1 2 23 23 551
OLD AHOBRE AHOBRE KESE 1 2 1 5 1 10 8 120
OLD EDOBO OLD EDOBO 2 2 0 60
NEW EDOBO NEW EDOBO 2 2 0 60
ANTWEBANSO ANTWEBANSO 3 3 1 105
EKPU EKPU 7 1 4 14 8 34 34 397
HALF ASSINI FANTI-LINE 36 1 37 37 935
HALF ASSINI EWE-LINE 4 4 4 120
METIKA METIKA 4 3 7 7 220
ANOMATUAPE-
EWE ANOMATUAPE-EWE 6 6 6 210
ANOMATUAPE-
FANTI
ANOMATUAPE-
FANTI 5 5 5 35
BUAKWA BUAKWA 8 8 8 240
MPAASEM MPAASEM 6 2 8 7 190
NZIMITIAN NZIMITIAN 3 1 4 4 140
MANGYEA MANGYEA 3 7 13 23 23 360
EFFASU EFFASU 4 2 10 9 25 25 368
NEW TOWN NEW TOWN 5 20 60 85 85 1175
TOTAL 78 91 0 9 77 96 0 0 351 292 6594
TABLE 1.26 JOMORO DISTRICT – WESTERN REGION
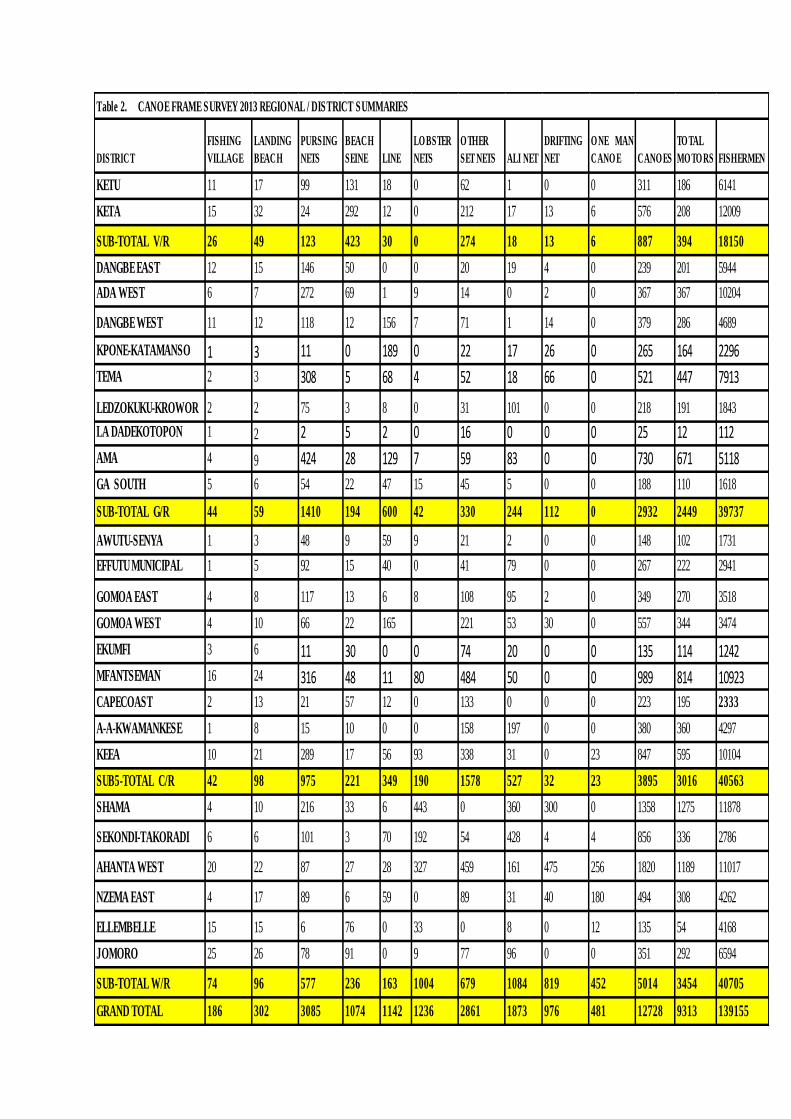
DISTRICT
FISHING
VILLAGE
LANDING
BEACH
PURSING
NETS
BEACH
SEINE LINE
LO BSTER
NETS
O THER
SET NETS ALI NET
DRIFTING
NET
O NE MAN
CANO E CANO ES
TO TAL
MO TO RS FISHERMEN
KETU 11 17 99 131 18 0 62 1 0 0 311 186 6141
KETA 15 32 24 292 12 0 212 17 13 6 576 208 12009
SUB-TOTAL V/R 26 49 123 423 30 0 274 18 13 6 887 394 18150
DANGBE EAST 12 15 146 50 0 0 20 19 4 0 239 201 5944
ADA WEST 6 7 272 69 1 9 14 0 2 0 367 367 10204
DANGBE WEST 11 12 118 12 156 7 71 1 14 0 379 286 4689
KPONE-KATAMANSO 1 3 11 0 189 0 22 17 26 0 265 164 2296
TEMA 2 3 308 5 68 4 52 18 66 0 521 447 7913
LEDZOKUKU-KROWOR 2 2 75 3 8 0 31 101 0 0 218 191 1843
LA DADEKOTOPON 1 2 2 5 2 0 16 0 0 0 25 12 112
AMA 4 9 424 28 129 7 59 83 0 0 730 671 5118
GA SOUTH 5 6 54 22 47 15 45 5 0 0 188 110 1618
SUB-TOTAL G/R 44 59 1410 194 600 42 330 244 112 0 2932 2449 39737
AWUTU-SENYA 1 3 48 9 59 9 21 2 0 0 148 102 1731
EFFUTU MUNICIPAL 1 5 92 15 40 0 41 79 0 0 267 222 2941
GOMOA EAST 4 8 117 13 6 8 108 95 2 0 349 270 3518
GOMOA WEST 4 10 66 22 165 221 53 30 0 557 344 3474
EKUMFI 3 6 11 30 0 0 74 20 0 0 135 114 1242
MFANTSEMAN 16 24 316 48 11 80 484 50 0 0 989 814 10923
CAPECOAST 2 13 21 57 12 0 133 0 0 0 223 195 2333
A-A-KWAMANKESE 1 8 15 10 0 0 158 197 0 0 380 360 4297
KEEA 10 21 289 17 56 93 338 31 0 23 847 595 10104
SUB5-TOTAL C/R 42 98 975 221 349 190 1578 527 32 23 3895 3016 40563
SHAMA 4 10 216 33 6 443 0 360 300 0 1358 1275 11878
SEKONDI-TAKORADI 6 6 101 3 70 192 54 428 4 4 856 336 2786
AHANTA WEST 20 22 87 27 28 327 459 161 475 256 1820 1189 11017
NZEMA EAST 4 17 89 6 59 0 89 31 40 180 494 308 4262
ELLEMBELLE 15 15 6 76 0 33 0 8 0 12 135 54 4168
JOMORO 25 26 78 91 0 9 77 96 0 0 351 292 6594
SUB-TOTAL W/R 74 96 577 236 163 1004 679 1084 819 452 5014 3454 40705
GRAND TOTAL 186 302 3085 1074 1142 1236 2861 1873 976 481 12728 9313 139155
Table 2. CANOE FRAME SURVEY 2013 REGIONAL / DISTRICT SUMMARIES
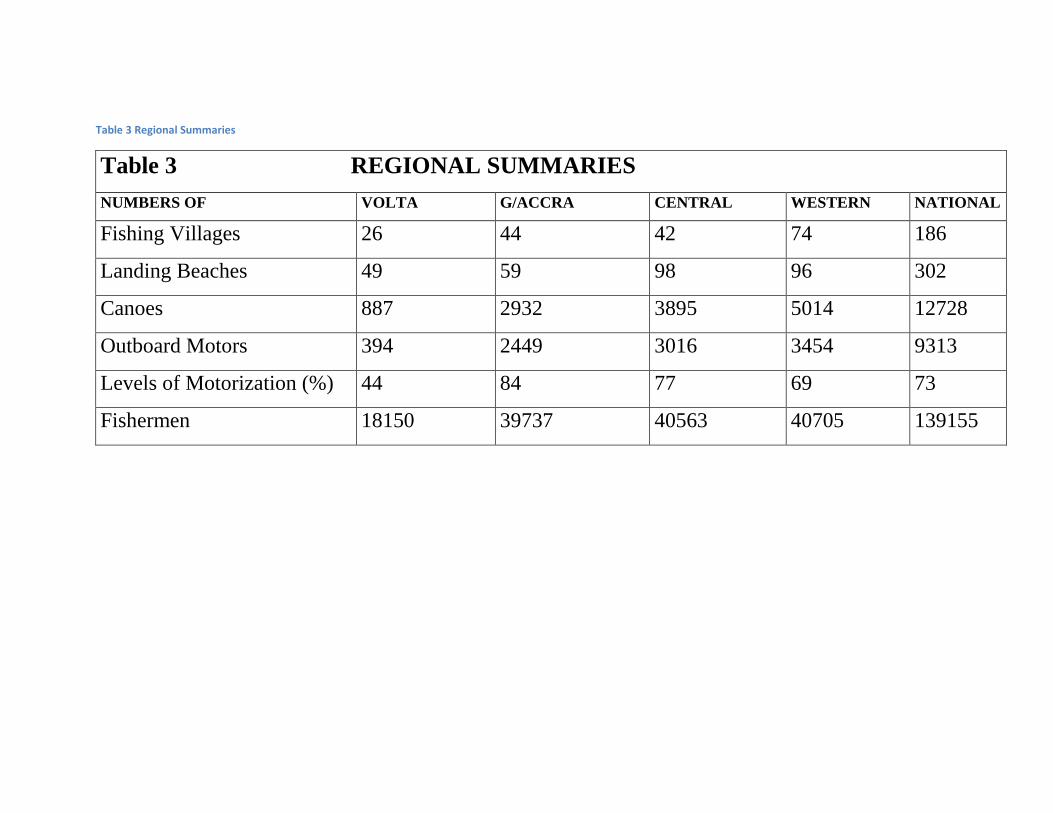
Table 3 Regional Summaries
Table 3 REGIONAL SUMMARIES
NUMBERS OF VOLTA G/ACCRA CENTRAL WESTERN NATIONAL
Fishing Villages 26 44 42 74 186
Landing Beaches 49 59 98 96 302
Canoes 887 2932 3895 5014 12728
Outboard Motors 394 2449 3016 3454 9313
Levels of Motorization (%) 44 84 77 69 73
Fishermen 18150 39737 40563 40705 139155

Table 4 Mean rangeof price/cost of Canoes, Fishing gear and Outboard motors in the Regions
Table 4 MEAN RANGE OF PRICES/COST OF CANOES, FISHING GEARS AND OUTBOARD MOTORS (GHS)
GEARS VOLTA GT. ACCRA CENTRAL WESTERN
Ali 7,000-10,000 7,500 - 15,000 5,000 - 8,000 6,000 - 12,000
Poli/Watsa 15,000 - 30,000 15,000 - 30,000 15,000 - 30,000 15,000 - 30,000
Beach Seine (Big) 25,000 - 80,000 15,000 - 20,000 8,000 - 30,000 7,000 - 30,000
Beach Seine (Small) 10,000-50,000 4,000 - 80,000 6,000 - 20,000 5,000 - 15,000
Set Net 1,000-4,000 1,500 - 3,000 800 - 1,600 1,000 - 3,000
Line 750-1,500 750 - 1,500 750 - 1,500 1000 - 1,500
Drift Gill Net 15,000-30,000 20,000 - 30,000 15,000 - 20,000 15,000 - 18,000
Lobster Net 500-2,000 500 - 1,600 1,000 - 2,500 400 - 1,500
CANOES
Ali 15,000-20,000 15,000 - 20,000 10,000 - 20,000 8,000 - 10,000
Poli/Watsa 20,000-25,000 20,000 - 25,000 20,000 - 26,000 14,000
One Man Canoe 500-800 1,000 - 1,500 500-800 500-700
MOTORS
YAMAHA 40hp 7,200-8,000 7,200 - 8,000 8,000 - 8,500 7,200 - 8,500
YAMAHA 30hp 5,000-6,000 5,000 - 6,000 5,000 - 6,000 5,000 - 6,000
YAMAHA 25hp 4,000-5,000 4,000 - 5,000 4,800 - 5,000 4,200 - 4,800
YAMAHA 15hp 4,000-5,000 4,000 - 4,500 3,800 - 4,200 3, 500-4,000
YAMAHA 9hp 3,500-4,000 3,500 - 4,000 3,000 - 4,000 3, 000 - 4,000
YAMAHA 8hp 1,300-3,000 1,300 - 2,500 2,500- 3,000 2,500 - 3,000

Table 5 Summary of Results of Canoe Frame Survey conducted between 1972 - 2013
Table 5 SUMMARY OF RESULTS OF CANOE FRAME SURVEYS CONDUCTED BETWEEN 1969 AND 2013
Number of 1969 1973 1977 1981 1986 1989 1992 1995 1997 2001 2004 2013
Fishing Villages 198 191 200 174 188 192 189 189 191 185 195 186
Landing Beaches 269 257 238 222 276 264 206 310 308 304 334 302
Outboard Motors
3698 4250 4631 4262 5076 5139 5256 6405 9313
Fishermen
81000 84100 104700 91400 96400 101700 103340 123156 124219 139155
Number of Canoes for
Poli/Watsa 3215 2244 3005 3359 3969 3684 3458 3923 3709 2439 2597 3085
Beach Seine 1587 1081 761 833 797 852 775 790 769 813 903 1074
Line 734 676 1174 661 1004 157 1040 782 920 1134 933 1142
Lobster Set Net
1114 547 402 430 549 871 1236
Set Net 3347 2973 3532 1734 1852 574 1955 2294 2036 2324 3004 2861
Ali
1874 1292 1437 1394 1618 1855 1873
Poli
Watsa
Nifa Nifa
249 333 332 462
Drifting Nets
351 450 366 880 476 414 312 520 976
One Man Canoe
142 162 580 327 332 330 530 481
Total Canoes 8728 8238 8472 6938 8214 8052 8688 8641 8610 9981 11213 12728
% Motorized
53.3 51.7 57.5 49.1 58.7 61.2 52.6 57.1 73.17

Table 6 Regional Summaries 1997, 2001, 2004, 2013
Table 6 COMPARISON OF THE RESULTS OF THE 1997, 2001, 2004 AND 2013 CANOE FRAME SURVEYS
Numbers of Volta Region Greater Accra Region Central Region Western Region Total
1997 2001 2004 2013 1997 2001 2004 2013 1997 2001 2004 2013 1997 2001 2004 2013 1997 2001 2004 2013
Fishing Villages 27 23 29 26 47 48 48 44 42 42 43 42 75 72 75 74 191 185 195 186
Landing Beaches 50 42 63 49 64 67 68 59 99 101 103 98 95 94 100 96 308 304 334 302
Motors 278 242 323 394 1974 1921 2144 2449 1797 1547 2097 3016 1090 1546 1841 3454 5139 5256 6405 9313
Fishermen
1098
7
1186
3
1738
2
1815
0 35921 41026 35168 39737 38741 45909 44303 40563 17691 24358 27366 40705
10334
0
12315
6 124219 139155
Pursing Nets 75 62 99 123 1029 1164 1185 1410 860 848 931 975 351 365 382 577 2315 2439 2597 3085
Beach Seines 291 294 384 423 168 184 158 194 187 195 198 221 123 140 163 236 769 813 903 1074
Line 0 23 0 30 657 790 586 600 234 235 280 349 29 86 67 163 920 1134 933 1142
Lobster Set Nets 0 0 0 0 80 121 168 42 148 206 296 190 202 222 407 1004 430 549 871 1236
Other Set Nets 51 88 230 274 149 263 218 330 1317 1338 1788 1578 519 635 768 679 2036 2324 3004 2861
Ali 3 48 20 18 469 351 364 244 595 657 710 527 327 562 761 1084 1394 1618 1855 1873
Nifa nifa 4 3
46 13
18 2
264 444
332 462
Other Drifting Nets 0 0 3 13 16 40 81 112 31 272 63 32 35 0 373 819 82 312 520 976
One Man Canoe 0 0 0 6 16 31 21 0 102 22 184 23 214 277 325 452 332 330 530 481
Total Canoes 424 518 736 887 2630 2957 2781 2932 3492 3775 4450 3895 2064 2731 3264 5014 8610 9981 11231 12728

Table 7 Brand and Size of Outboard Motors
Table 7 BRANDS AND SIZE OF OUTBOARD MOTORS -BY REGION 2013
YAMAHA JOHNSON SUZUKI MARINA TOHATSUA
4HP 5HP 6HP 8HP 9HP 10HP 15HP 20HP 25HP 30HP 40HP 25HP 4HP 5HP 8HP 15HP 4HP 8HP 9HP
VOLTA
REGION
2
18
91 1 46
151 49
2
34
GREATER
ACCRA 2 3 0 7 146 1 149 3 146 4 1784 111 2 10 1 73 2 0 5
CENTRAL
REGION 1 1
331 0 326 9 157 29 1681 277 0 62 42 4 88 0 8
WESTERN
REGION 2 1 1
385 0 206 0 120 0 2533 198 0 0 2 0 5 0 1
TOTAL 5 7 1 25 862 1 772 13 469 33 6149 635 2 74 45 111 95 0 14
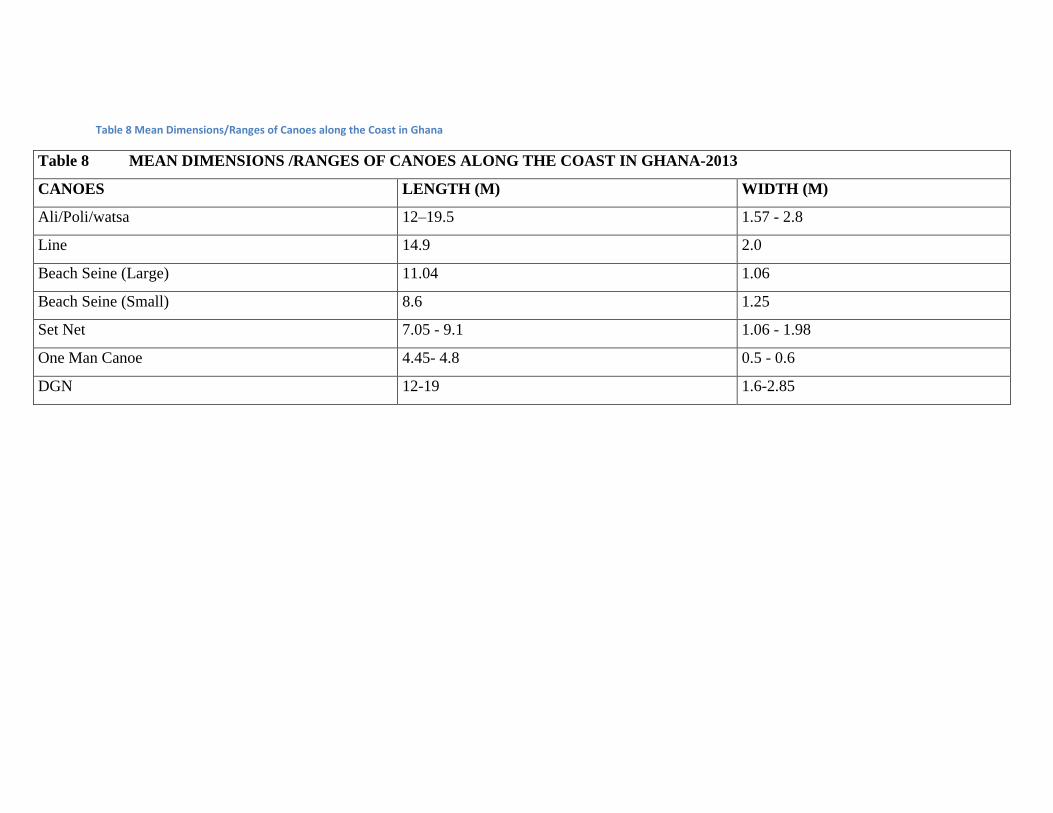
Table 8 Mean Dimensions/Ranges of Canoes along the Coast in Ghana
Table 8 MEAN DIMENSIONS /RANGES OF CANOES ALONG THE COAST IN GHANA-2013
CANOES LENGTH (M) WIDTH (M)
Ali/Poli/watsa 12–19.5 1.57 - 2.8
Line 14.9 2.0
Beach Seine (Large) 11.04 1.06
Beach Seine (Small) 8.6 1.25
Set Net 7.05 - 9.1 1.06 - 1.98
One Man Canoe 4.45- 4.8 0.5 - 0.6
DGN 12-19 1.6-2.85

Table 9 Fish Sharing System within the Region
TABLE 9 FISH SHARING SYSTEM WITHIN THE REGIONS
VOLTA GREATER ACCRA
NET CANOE OUTBOARD MOTOR CREW NET CANOE OUTBOARD MOTOR CREW
Ali 50% 50% 50% 50%
Poli 50% 50% 50% 50%
Watsa 50% 50% 50% 50%
Beach Seine 20%
30%
50%
50%
50%
Set Net (Toga) 50% 50% 50% 50%
Set Net (Lobster) 50% 50% 50% 50%
Drift Gill Net 50% 50% 50% 50%
Line 50% 50% 50% 50%
CENTRAL WESTERN
NET CANOE OUTBOARD MOTOR CREW NET CANOE OUTBOARD MOTOR CREW
Ali 50% 50% 50% 50%
Poli 50% 50% 50% 50%
Watsa 50% 50% 50% 50%
Beach Seine 50% 50% 50% 50%
Set Net (Toga) 50% 50% 50% 50%
Set Net (Lobster) 50% 50% 50% 50%
Drift Gill Net 50% 50% 50% 50%
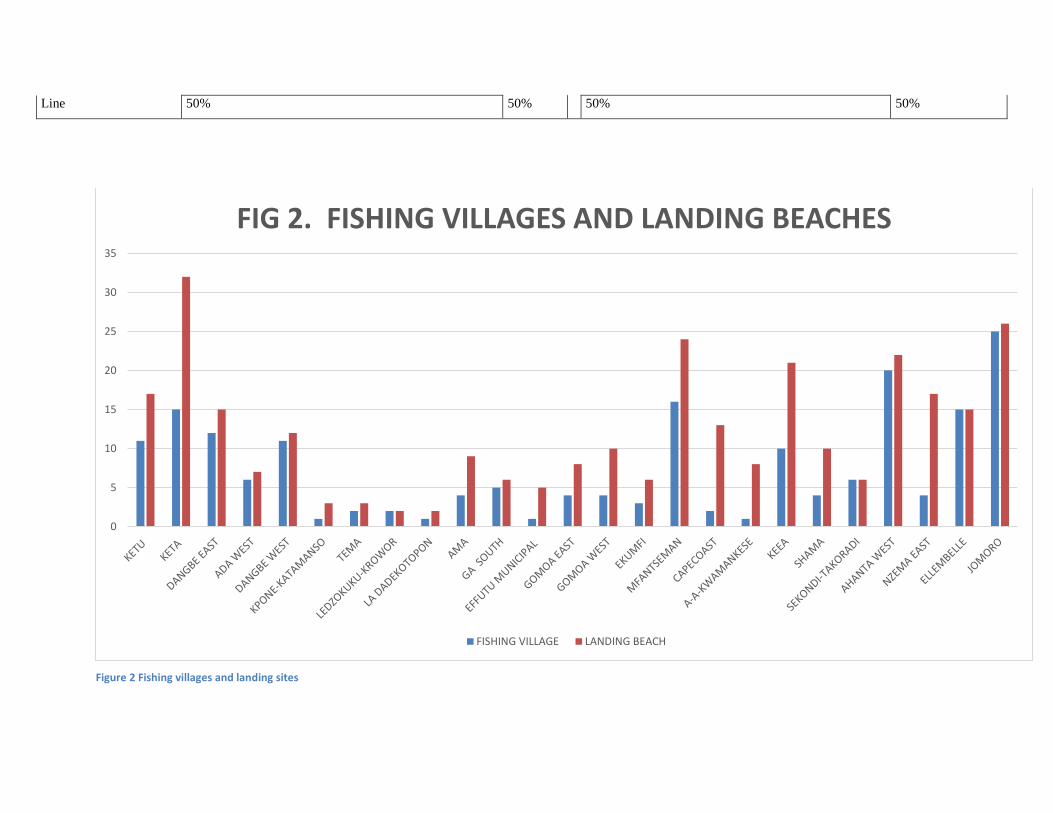
Line 50% 50% 50% 50%
Figure 2 Fishing villages and landing sites
0
5
10
15
20
25
30
35
FIG 2. FISHING VILLAGES AND LANDING BEACHES
FISHING VILLAGE LANDING BEACH


Figure 3 Total number of canoes 1969 - 2013
0
2000
4000
6000
8000
10000
12000
14000
1969 1973 1977 1981 1986 1989 1992 1995 1997 2001 2004 2013
Can
oe
Year
FIG. 3 Total Number of Canoes: 1969 -2013

Figure 4 Fishermen and Motors
0
20000
40000
60000
80000
100000
120000
140000
160000
1981 1986 1989 1992 1995 1997 2001 2004 2013
NU
MB
ER
YEAR
Fig. 4 Fishermen and Motors
Outboard Motors
Fishermen
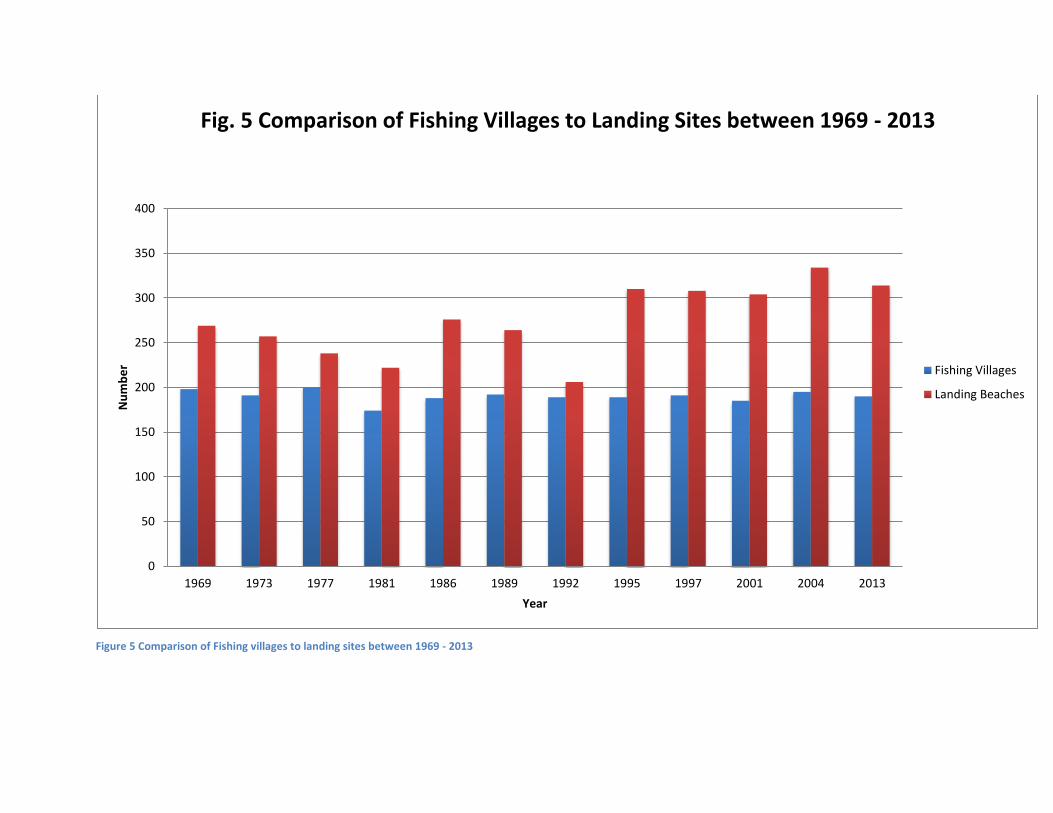
Figure 5 Comparison of Fishing villages to landing sites between 1969 - 2013
0
50
100
150
200
250
300
350
400
1969 1973 1977 1981 1986 1989 1992 1995 1997 2001 2004 2013
Nu
mb
er
Year
Fig. 5 Comparison of Fishing Villages to Landing Sites between 1969 - 2013
Fishing Villages
Landing Beaches

Figure 6 Canoes and Fishermen in the Regions 2013
0
5000
10000
15000
20000
25000
30000
35000
40000
45000
VOLTA GREATER ACCRA CENTRAL WESTERN
Nu
mb
er
Region
Fig. 6 Canoes to Fishermen in the Regions - 2013
CANOES
FISHERMEN

KETU PURSINGNETSBEACH SEINE
LINE
LOBSTERNETSOTHER SETNETSALI NET
KETA PURSINGNETSBEACHSEINELINE
LOBSTERNETSOTHER SETNETSALI NET
ADA EAST PURSING NETS
BEACH SEINE
LINE
LOBSTER NETS
OTHER SET NETS
ALI NET
ADA WEST PURSING NETS
BEACH SEINE
LINE
LOBSTER NETS
OTHER SET NETS
ALI NET
DANGBE WEST PURSING NETS
BEACH SEINE
LINE
LOBSTER NETS
OTHER SETNETSALI NET
TEMA PURSING NETS
BEACH SEINE
LINE
LOBSTER NETS
OTHER SET NETS
ALI NET
DRIFTING NET
LEDZOKUKU-KROWOR
PURSINGNETS
BEACH SEINE
LINE
LOBSTERNETS
OTHER SETNETS
AMA PURSING NETS
BEACH SEINE
LINE
LOBSTER NETS
OTHER SET NETS
ALI NET
DRIFTING NET
GA PURSING NETS
BEACH SEINE
LINE
LOBSTER NETS
OTHER SET NETS
ALI NET
DRIFTING NET
EFUTU-EWUTU-SENYA PURSING NETS
BEACH SEINE
LINE
LOBSTER NETS
OTHER SETNETSALI NET
EFFUTU MUNICIPAL PURSING NETS
BEACH SEINE
LINE
LOBSTER NETS
OTHER SET NETS
ALI NET
DRIFTING NET
GOMOA EAST
PURSING NETS
BEACH SEINE
LINE
LOBSTER NETS
OTHER SET NETS
ALI NET
Figure 7: RELATIVE IMPORTANCE OF FISHING GEAR IN SOME COASTAL DISTRICTS
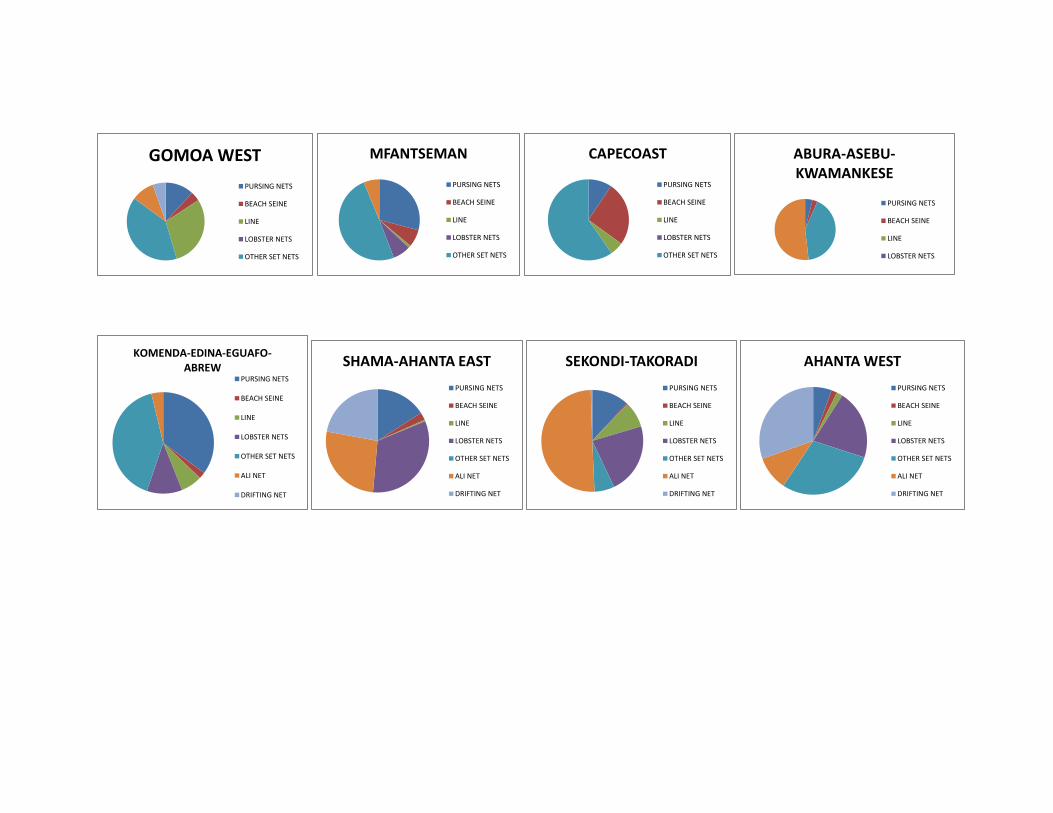
GOMOA WEST
PURSING NETS
BEACH SEINE
LINE
LOBSTER NETS
OTHER SET NETS
MFANTSEMAN
PURSING NETS
BEACH SEINE
LINE
LOBSTER NETS
OTHER SET NETS
CAPECOAST
PURSING NETS
BEACH SEINE
LINE
LOBSTER NETS
OTHER SET NETS
ABURA-ASEBU-KWAMANKESE
PURSING NETS
BEACH SEINE
LINE
LOBSTER NETS
KOMENDA-EDINA-EGUAFO-ABREW
PURSING NETS
BEACH SEINE
LINE
LOBSTER NETS
OTHER SET NETS
ALI NET
DRIFTING NET
SHAMA-AHANTA EAST
PURSING NETS
BEACH SEINE
LINE
LOBSTER NETS
OTHER SET NETS
ALI NET
DRIFTING NET
SEKONDI-TAKORADI
PURSING NETS
BEACH SEINE
LINE
LOBSTER NETS
OTHER SET NETS
ALI NET
DRIFTING NET
AHANTA WEST
PURSING NETS
BEACH SEINE
LINE
LOBSTER NETS
OTHER SET NETS
ALI NET
DRIFTING NET

Figure 7 Relative importance of Fishing gear in each coastal districts
NZEMA EAST
PURSING NETS
BEACH SEINE
LINE
LOBSTER NETS
OTHER SET NETS
ALI NET
DRIFTING NET
ELLEMBELLE PURSING NETS
BEACH SEINE
LINE
LOBSTER NETS
OTHER SET NETS
ALI NET
DRIFTING NET
JOMORO PURSING NETS
BEACH SEINE
LINE
LOBSTER NETS
OTHER SET NETS
ALI NET
DRIFTING NET

Pic 1. Officers interviewing fishermen
Pic 2. Landing Beach
Pic 3.Officers measuring canoes
Pic 4. Officers en-route to a fishing village

APPENDIX 1 FORM A FRAME SURVEY (CANOE REGISTRATION)
REGION…………………………….…………. DATE………………………………………. ENUMERATOR…………….……………..………………
FISHING VILLAGE………………………….. LANDING BEACH…………………….. CHIEF FISHERMAN……………….…………………….
SERIAL NO.
REGISTRATION NO.
NAME OF CANOE SYMBOL
NAME OF OWNER
NO. OF CREW
TYPES OF GEAR
OUTBOARD MOTOR
REMARKS
DO YOU HAVE
IF YES
1 YES NO NO TYPE HP
2 3
4
5 6
7 8
9 0
1
2

APPENDIX 2
FORM B FRAME SURVEY CANOE FISHERY STATISTICS
REGION………………………………………………………………… …….. DATE…………………………………………………
DISTRICT ………………………………………………………………………
FISHING VILLAGE………………………………………………………….. ENUMERATOR……………………….……..……
LANDING BEACH……………………………………………………………
WHERE DOES THE CHIEF FISHERMAN LIVE (VILLAGE):……………………………..…………………………….……….
GEAR CANOE AVERAGE NO. OF FISHERMEN
NAME NO. TOTAL MOTORS ACTIVE AVE. NO. OF CREW ON CANOE
FULL TIME
TOTAL
ALI
POLI
WASTA
BEACH SEINE
S/N LOBSTER
LINE
DGN/NIFA-NIFA
ONE MAN CANOE
TOTAL
2. For one man canoe, what gears are usually used?
……………………………………………………………………………………………………..………………………………………….
3. Does fishing go on all the year around? Yes/No

4. If “No” state the period of operation……………………………………………………………………………………..
5. Range of fishing grounds……………………………………………………………………………..…………..……………
6. Do the canoes here migrate to other centers within Ghana? Yes/No
(i) If “Yes”, where do they go mainly to:……………………………….……………………………………………………..
(ii) State the usual period that they migrate from the center?...........................................................
(iii) What type of gear do they mainly migrate to operate?................................................................
8. Do canoes at other centers migrate into this center? Yes/No
(i) If “Yes” where do they mainly come from?....................................................................................
(ii) State the usual period that they migrate from this center:………………………………………………………
(iii) The canoes that migrate into this center operate what main
gear………………………………………………………………………………………………………………..……………………..
9. Do canoes at this center migrate outside the country? Yes/No
If “Yes
(i) Where do they usually migrate to?...........................................................................................
(ii) How long do they stay?.............................................................................................................
(iii) State the usual period they migrate from this
center…………………………………………………………………………………………………………..…………………..
(iv) Do they register with Ghana Embassy Abroad?........................................................................
(v) What do they usually migrate with?.........................................................................................

10. Do non-Ghanaians canoes migrate to this center? Yes/No If yes
(i) Where do they usually migrate to this center
from………………………………………………………………………………………………………………..…………………
(ii) How long do they stay?..............................................................................................................
(iii) What period do they usually migrate from this
center…………………………………………………………………………………………………………………….………..
11. Are there conflicts between Ghanaian and Fisherman at this center? Yes/No
(i) If yes, what is the nature of the conflicts…………………………………………………………………….………
12. Are there conflicts between Ghanaian and Non Ghanaian Fishermen at this center? Yes/No
(i) If Yes, what is the nature of the conflicts…………………………………………………………………………….
13. What condition does migrant fisherman have to satisfy at this center?
(a) Ghanaian
(b) Non-Ghanaian
14. Does this fishing village observe non-fishing days? (Fishing holiday) Yes/No If Yes, State the
Day(s) …………………………………………………………………………………………………………………………..…..

15. How are the proceeds from Fishing shared? Give the percentage/Fractions for the input
GEAR NET CANOE OUTBOARD MOTOR CREW
ALI POLI
WASTA BEACH SEINE
S/N TOGA S/N LOBSTER
LINE
D.G.N/NIFA-NIFA O.M.C