INFLATION REPORT - Bangko Sentral Ng Pilipinas · he primary objective of monetary policy is to...
75
i INFLATION REPORT First Quarter 2008 Bangko Sentral ng Pilipinas
-
Upload
nguyenkhue -
Category
Documents
-
view
214 -
download
2
Transcript of INFLATION REPORT - Bangko Sentral Ng Pilipinas · he primary objective of monetary policy is to...
i
INFLATION REPORT
First Quarter 2008
Bangko Sentral ng Pilipinas

i
FOREWORD
he primary objective of monetary policy is to promote a low and stable rate of inflation conducive to a balanced and sustainable economic growth. The adoption
in January 2002 of the inflation targeting framework for monetary policy was aimed at helping fulfill this objective.
One of the key features of inflation targeting is greater transparency, which means greater disclosure and communication by the BSP of its policy actions and decisions. This Inflation Report is published by the BSP as part of its transparency mechanisms under inflation targeting. The objectives of this Inflation Report are: (i) to identify the risks to price stability and discuss their implications for monetary policy; and (ii) to document the rigorous economic analysis behind the conduct of monetary policy and convey to the public the overall thinking behind the BSP’s decisions on monetary policy. The broad aim is to make monetary policy easier for the public to follow and understand and enable them to better monitor the BSP’s commitment to the inflation target, thereby helping both in anchoring inflation expectations and encouraging informed debate on monetary policy issues.
The government’s targets for annual headline inflation under the inflation targeting
framework have been set at 4.0 percent and 3.5 percent for 2008 and 2009, respectively, both with a tolerance interval of ± 1.0 percentage point.
The report is published on a quarterly basis, presenting a survey of the various
factors affecting inflation. These include recent price and cost developments, prospects for aggregate demand and output, monetary and financial market conditions, labor market conditions, fiscal developments, and the international environment. A section is devoted to the BSP’s view of the inflation outlook during the policy horizon. This is followed by a discussion of the implications of the assessment of inflation and economic conditions on the monetary policy settings of the BSP. This issue also features a box article on the developments in global food prices and their impact on domestic food prices.
The Monetary Board approved this Inflation Report at its meeting on 30 April 2008.
AMANDO M. TETANGCO, JR.
Governor
May 2008
T

ii
List of Acronyms, Abbreviations and Symbols AMCs Asset Management Companies ARMM Autonomous Region of Muslim Mindanao BAS Bureau of Agricultural Statistics BES Business Expectations Survey BI Bureau of Immigration BIR Bureau of Internal Revenue BNM Bank Negara Malaysia BNBs Bank Negara Bills BOC Bureau of Customs BOE Bank of England BOJ Bank of Japan BOK Bank of Korea BOT Bank of Thailand BTr Bureau of the Treasury CalPERS California Public Employees’ Retirement System CAMPI Chamber of Automotive Manufacturers of the Philippines, Inc. CAR Capital Adequacy Ratio CBD Central Business District CCRs Credit Card Receivables CES Consumer Expectations Survey CDS Credit Default Swaps CPI Consumer Price Index DBCC Development Budget Coordinating Committee DCS Depository Corporations Survey ECB European Central Bank ERC Energy Regulatory Commission FBT Food, beverage and tobacco FIREBS Financial institutions, real estate and business services FLW Fuel, light and water FOMC Federal Open Market Committee GDP Gross Domestic Product GNP Gross National Product GRAM Generation Rate Adjustment Mechanism GS Government Securities HICP Harmonized Indices of Consumer Prices ICERA Incremental Currency Exchange Rate Adjustment IMF International Monetary Fund KBs Commercial banks KWH Kilowatt hour LFS Labor Force Survey LPG Liquefied Petroleum Gas LTO Land Transportation Office MAS Monetary Authority of Singapore MEM Multi-Equation Model Meralco Manila Electric Company MISSI Monthly Integrated Survey of Selected Industries MS Monetary Survey MSBs Monetary Stability Bonds MT Metric Tons

iii
MTP Major Trading Partner NCR National Capital Region NEER Nominal Effective Exchange Rate NFIA Net Factor Income From Abroad NG National Government NIA National Income Accounts NPC National Power Corporation NPLs Non-performing loans NSO National Statistics Office OFs Overseas Filipinos OMOs Open market operations OPEC Organization of Petroleum Exporting Countries PBC People’s Bank of China PMI Purchasing Managers’ Index PSEi Philippine Stock Exchange Composite Index PSS Postal Savings System PSIC Philippine Standard Industrial Classification PTIC Philippine Telecommunications Investment Corporation RDA Reserve Deposit Account REER Real Effective Exchange Rate RM Reserve Money ROP Republic of the Philippines RP Repurchase RRP Reverse Repurchase RVAT Reformed Value Added Tax SEM Single-Equation Model SDA Special Deposit Account TLP Total Loan Portfolio TMA Truck Manufacturers Association TransCo National Transmission Corporation U/KBs Universal/commercial banks VAPI Value of Production Index VOPI Volume of Production Index WESM Wholesale Electricity Spot Market

iv
THE MONETARY POLICY OF THE BANGKO SENTRAL NG PILIPINAS
The BSP Mandate The BSP’s main responsibility is to formulate and implement policy in the areas of money, banking and credit, with the primary objective of maintaining stable prices conducive to a balanced and sustainable economic growth in the Philippines. The BSP also aims to promote and preserve monetary stability and the convertibility of the national currency. Monetary Policy Instruments The BSP uses various instruments to effect the desired monetary policy stance to achieve the inflation target. These include (a) raising/reducing the BSP's policy interest rates; (b) increasing/decreasing the reserve requirement; (c) encouraging/discouraging deposits in the special deposit account (SDA) facility by banks and trust entities of BSP-supervised financial institutions; (d) increasing/decreasing its rediscount rate on loans extended to banking institutions on a short-term basis against eligible collaterals of banks’ borrowers; and (e) outright sales/purchases of the BSP’s holdings of government securities. The BSP’s primary monetary policy instruments are its overnight reverse repurchase (borrowing) rate and overnight repurchase (lending) rate. Policy Target The BSP uses the Consumer Price Index (CPI) or headline inflation rate which is compiled and released to the public by the National Statistics Office (NSO) as its target for monetary policy. The policy target is set by the Development Budget Coordinating Committee (DBCC)1 in consultation with the BSP. For 2008, the Government’s target for annual headline inflation has been set at 4.0 percent with a tolerance interval of ± 1.0 percentage point. For 2009, the headline inflation target has been set at 3.5 percent ± 1.0 percentage point. BSP’s Explanation Clauses These refer to the predefined set of acceptable circumstances under which an inflation-targeting central bank may fail to achieve its inflation target. These clauses recognize the fact that there are limits to the effectiveness of monetary policy and that deviations from the inflation target may sometimes occur because of factors beyond the control of the central bank. Under the inflation targeting framework of the BSP, these exemptions include inflation pressures arising from: (a) volatility in the prices of agricultural products; (b) natural calamities or events that affect a major part of the economy; (c) volatility in the prices of oil products; and (d) significant government policy changes that directly affect prices such as changes in the tax structure, incentives and subsidies.
1 The DBCC, created under Executive Order (E.O.) No. 232 dated 14 May 1970, is an inter-agency committee tasked
primarily to formulate the National Government's fiscal program. It is composed of the Department of Budget and Management (DBM), National Economic and Development Authority (NEDA), and the Department of Finance (DOF). The BSP sits as a resource agency.

v
The Monetary Board The powers and functions of the BSP, such as the conduct of monetary policy and the supervision over the banking system, are exercised by its Monetary Board, which has seven members appointed by the President of the Philippines. Beginning in July 2006, the Monetary Board meets every six weeks to review and decide on the stance of monetary policy. Prior to July 2006, monetary policy meetings by the Monetary Board were held every four weeks.
Chairman Amando M. Tetangco, Jr. Members Romulo L. Neri
Vicente B. Valdepeñas, Jr.
Raul A. Boncan
Juanita D. Amatong
Nelly F. Villafuerte
Alfredo C. Antonio
The Advisory Committee The Advisory Committee was established as an integral part of the institutional setting for inflation targeting. It is tasked to deliberate, discuss and make recommendations on monetary policy to the Monetary Board. The Committee meets every six weeks (beginning July 2006) but may also meet in between the regular meetings, whenever it is deemed necessary. Prior to July 2006, the Committee met every four weeks.
Chairman Amando M. Tetangco, Jr.
Governor Members2 Diwa C. Guinigundo
Deputy Governor Monetary Stability Sector
Nestor A. Espenilla, Jr. Deputy Governor Supervision and Examination Sector
Ma. Cyd N. Tuaño-Amador
Managing Director Monetary Policy Sub-Sector
Ma. Ramona GDT Santiago Managing Director Treasury Department
2 The Advisory Committee is supported by a Technical Secretariat composed of officers and staff from the Department of
Economic Research, Center for Monetary and Financial Policy, and the Treasury Department.

vi
Mtg. No. Advisory Committee 1/ Monetary Board 2/ Publication of Monetary Board Highlights 3/
1 28 January, Monday 31 January, Thursday 28 February, Thursday
2 10 March, Monday 13 March, Thursday 10 April, Thursday
3 21 April, Monday 24 April, Thursday 22 May, Thursday
3 2 June, Monday 5 June, Thursday 03 July, Thursday
5 14 July, Monday 17 July, Thursday 14 August, Thursday
6 26 August, Tuesday /a 28 August, Thursday 25 September, Thursday
7 6 October, Monday 9 October, Thursday 06 November, Thursday
8 17 November, Monday 20 November, Thursday 17 December, Thursday
9 15 December, Monday 18 December, Thursday 22 January 2009, Thursday
Notes:
SCHEDULE OF THE MEETINGS ON MONETARY POLICYAND PUBLICATION OF HIGHLIGHTS FOR 2008
2008
starting July 2006. Prior to this, the Advisory Committee and Monetary Board meetings were held every four weeks. 2/ Monetary Board meetings on monetary policy are held on the Thursday after the latest Advisory Committee meeting. 3/ Under MB Resolution No. 630, the lag in the publication of the highlights of the Monetary Board meetings on monetary policy issues
1/ Under MB Resolution No. 630, the frequency of meetings of the Advisory Committee and the Monetary Board was set at every six weeks
was reduced to four weeks. Prior to this, the highlights were published six weeks after the reference meeting date.a/ The AC meeting will be held a day later since the scheduled AC meeting date on 25 August 2008 (Monday) coincides with the celebration of the Ninoy Aquino Day and the National Heroes' Day.

vii
CONTENTS
Overview 1
I. Inflation and Real Sector Developments 3
Prices 3
Box Article: Developments in Global Food Prices and their Impact on Domestic Prices
8
Aggregate Demand and Supply 19
Labor Market Conditions 30
II. Monetary and Financial Conditions
31
Interest Rates 31
Financial Market Conditions 33
Banking System 35
Exchange Rate 39
Monetary Aggregates 42
Fiscal Developments 43
III. External Developments 44
IV. Monetary Policy Developments 50
V. Inflation Outlook 52
Private Sector Economists’ Inflation Forecasts BSP Inflation Forecasts
52
53
Risks to the Inflation Outlook 57
IVI. Implications for the Monetary Policy Stance 62
Summary of Monetary Policy Decisions 67

1
OVERVIEW3
Price pressures increased in Q1 2008. Average headline inflation rose to 5.6 percent from 3.3 percent in the previous quarter. Similarly, core inflation, an indicator of the long-term trend of inflation, increased during the review quarter to 4.1 percent from 2.4 percent in the previous quarter. Rising inflation pressures stemmed mainly from the higher international prices of oil and non-oil commodity products. Higher food prices, particularly of rice, continued to drive the trend of headline inflation.
Gross Domestic Product (GDP) increased by 7.4 percent in Q4 2007, maintaining the
growth rate (revised) in the previous quarter. This growth was faster compared to the 5.5 percent growth in the comparable period last year. The Q4 year-on-year performance was supported by household spending and capital investments. By major production sectors, services remained the key contributor to growth, accounting for more than half of total GDP growth. Other demand indicators similarly showed modest strengthening: employment increased, business confidence remained positive and consumer confidence improved, property prices rose and the vacancy rates of both residential and office spaces decreased, and volume sales of passenger cars, commercial vehicles, appliances, and electricity continued to grow. Similarly, external demand was stronger in Q4 relative to the same period in the previous year as reflected in the growth of exports.
Domestic interest rates displayed mixed trends in Q1 2008. Primary interest rates fell
while secondary market yields rose during the quarter. Rates were lower in the primary market for government securities as the National Government rejected some bids because of its stable cash position. Secondary market yields, however, rose on concerns of a prolonged slowdown in the US economy, and possibly the global economy, as well as the continued uptrend in international oil and food prices. The high inflation outturn during the first quarter of 2008 and worries about the possible knock-on effects on the Philippine economy of a US economic slowdown contributed to higher risk aversion.
Investor sentiment was cautious. The equity market was bearish, with weaker trading
reflecting investors’ cautious stance due to global economic concerns, rising inflation pressures and local political noise. In the market for government securities, oversubscription for T-Bills declined during the quarter. Meanwhile, the average monthly peso-dollar exchange rate depreciated in March relative to the levels in the previous two months as market uncertainty rose in February amid the turbulence in global financial markets.
Global financial markets continued to experience volatility during the review period.
The financial market strains have started to be felt in the real sector, with indicators pointing to a slowing down of the US, Euro area, and Japanese economies. In contrast, emerging Asian economies continued to expand, although they too are vulnerable to the effects of weak global growth particularly if the duration of the slowdown becomes longstanding. Meanwhile, the sustained elevated levels of oil and non-oil commodity prices have pushed up inflation in most parts of the world.
Domestic liquidity growth slowed down in February. Domestic liquidity or M3 grew by 6.6
percent year-on-year in February, lower than the 22.0 percent expansion recorded during the same month a year ago and the 9.0 percent growth as of end-December 2007. The slowdown in the growth of domestic liquidity can be traced to the decline in the net domestic assets (NDA) and the slowdown in the growth of net foreign assets (NFA). The tapering off of M3 growth is also seen to reflect in part the impact of the measures implemented by the BSP in May 2007.
3 The analyses in this report are based on information as of 31 March 2008.

2
The BSP eased policy rates further during the quarter. The Monetary Board decided in January to reduce by 25 basis points the BSP’s key policy interest rates to 5 percent for the overnight borrowing or reverse repurchase (RRP) rate and 7 percent for the overnight lending or repurchase (RP) rate. This was the fourth consecutive reduction in policy rates since October 2007. In March, the Monetary Board fine tuned the Special Deposit Account (SDA) facility by: 1) closing the windows for the two-three- and six-month tenors; and 2) reducing the interest rates on the remaining tenors.
In its latest assessment, the Monetary Board noted that, depending on the movements
in oil and non-oil commodity prices, inflation could settle above the 2008 inflation target range but will be within the 3.5 percent ± 1.0 percentage point target range for 2009. The factors driving inflation have come mostly from the supply side and such pressures are also evident in other countries. While the balance of risks to the inflation outlook is tilted to the upside, price movements could return to manageable levels over the policy horizon as supply responses come on stream and prospects of a prolonged global economic slowdown moderate demand pressures.
[Subsequently, in April, the Monetary Board decided to keep the BSP’s key policy interest rates at 5 percent for the overnight borrowing or reverse repurchase (RRP) facility and 7 percent for the overnight lending or repurchase (RP) facility.]

3
I. INFLATION AND REAL SECTOR DEVELOPMENTS Prices
0
2
4
6
8
10
12
1995 1996 1997 1998 1999 2000 2001 2002 2003 2004 2005 2006 2007 2008
Average headline inflation rose to 5.6 percent from 3.3 percent in the previous quarter. Similarly, core inflation, an indicator of the long-term trend of inflation, increased during the review quarter to 4.1 percent from 2.4 percent in the previous quarter. Rising inflation pressures stemmed mainly from the higher international prices of oil and non-oil commodity products. Higher food prices, particularly of rice, continued to drive the trend of headline inflation.
Headline and Core Inflation
Average headline inflation rose to 5.6 percent in Q1 2008 from 3.3 percent in the previous quarter and 2.9 percent in the same quarter a year ago. Of the 5.6 percent average headline inflation rate for Q1 2008, 3.4 percentage points were attributed to food alone. Services contributed 0.9 percentage point while housing and repairs contributed 0.5 percentage point. In terms of contribution to headline inflation, core inflation accounted for 3.5 percentage points of the headline inflation rate in Q1 2008, higher than 2.1 percentage points in Q4 2007 and 2.5 percentage points in the same quarter a year ago. Similarly, the contribution of non-core CPI items increased to 2.0 percentage points from 1.2 percentage points in the previous quarter; it was also higher than 0.4 percentage point in the same quarter a year ago.
Inflation strengthens in Q1 2008.
Q1 2008
Contribution to Quarterly InflationContribution to Quarterly Inflationin percent in percent
ItemItem Weight in Weight in Headline CPIHeadline CPI
Percentage Contribution to Percentage Contribution to YearYear--onon--Year Headline Year Headline
InflationInflationQ1 Q1
20082008Q4 Q4
20072007Q1 Q1
20072007Core Inflation 81.6 3.56 2.06 2.55Non-core Items 18.4 2.01 1.20 0.35
Rice 9.4 0.81 0.65 0.15Corn 0.9 0.05 0.02 0.06Fruits and Vegetables 5.3 0.56 0.18 0.20Gas, LPG 1.3 0.28 0.18 -0.06Kerosene 0.3 0.04 0.02 0.01Oil, Gasoline and Diesel 1.3 0.26 0.15 -0.01
Headline Inflation100.00 5.57 3.27 2.90
Source of Basic Data: NSO, BSP

4
-2
0
2
4
6
8
10
12
14
1995 1996 1997 1998 1999 2000 2001 2002 2003 2004 2005 2006 2007 2008
Headline Inflation Food Inflation Non-food Inflation
Headline, Food and Non-food Inflation Quarterly average in percent (2000=100)
Both food and non-food inflation were higher compared to the previous quarter and the same quarter a year ago. Inflation for food, beverages and tobacco (FBT) increased to 7.0 percent in Q1 2008 from 4.1 percent in the previous quarter and 3.3 percent in the same quarter a year ago. Likewise, non-food inflation was higher at 4.2 percent relative to 2.6 percent in the last quarter and 2.5 percent in the same quarter a year ago.
0
2
4
6
8
10
12
1995 1996 1997 1998 1999 2000 2001 2002 2003 2004 2005 2006 2007 2008
Headline Inflation Core Inflation
Headline and Core InflationQuarterly average in percent (2000=100)
Core inflation, an indicator of the long-term trend of inflation, increased during the review quarter. The official NSO core inflation measure rose to 4.1 percent in Q1 2008 from 2.4 percent in the previous quarter and 3.2 percent in the same quarter a year ago. Similarly, alternative measures of core inflation estimated by the BSP all went up in Q1 2008. The trimmed mean went up to 5.1 percent from 2.9 percent in the previous quarter and in the same quarter a year ago; the weighted median went up to 4.5 percent from 2.5 percent in the previous quarter and in the same quarter a year ago; and the net of volatile items measure went up to 4.6 percent from 3.0 percent in the previous quarter and in the same quarter a year ago.
Alternative Core Inflation MeasuresQuarterly averages of year-on-year change
Quarter TrimmedMean 1/
WeightedMedian 2/
Net of Volatile Items 3/ *
2006 5.4 5.0 6.9Q1 5.9 5.4 8.1Q2 5.8 5.0 7.6Q3 5.2 5.2 6.7Q4 4.5 4.2 5.0
2007Q1 2.9 2.5 3.0Q2 2.2 2.2 2.5Q3 2.3 2.1 2.5Q4 2.9 2.5 3.0
2008Q1 5.1 4.5 4.6
1/ The trimmed mean represents the average inflation rate of the (weighted) middle 70 percent in a lowest-to-highes t ranking of year-on-year inf lation rates for all CPI components .
2/ The weighted median represents the middle inflation rate (corresponding to a cumulative CPI weight of 50 percent) in a lowes t-to-highest rank ing of year-on-year inflat ion rates .
3/ The net of volat ile items method excludes the following items : educational serv ices, f ruits and vegetables, personal services, rentals, recreat ional services, rice, and corn.
* The series has been recomputed using a new methodology that is aligned with NSO’s method of comput ing the off ic ial core inf lation, which re-weights remaining items to comprise 100 percent of the core basket af ter excluding non-core items . The previous methodology retained the weights of volat ile items in the CPI basket while keeping their indices constant at 100.0 f rom month to month.
Source: NSO, BSP estimates
Looking at the distribution of price changes in the CPI basket, it would also be useful to determine the proportion of CPI basket components (at the 4-digit Philippine Standard Industry Classification (PSIC) level) showing inflation rates above a given threshold and find out whether that proportion has been increasing or decreasing. This would provide an indication as to whether pressures on consumer prices are becoming generalized over time.
Core inflation increases in Q1 2008.
Both food and non-food items register stronger price pressures.

5
The number of items with above-target inflation rates increases.
0
10
20
30
40
50
60
70
80
90
Q1 Q2 Q3 Q4 Q1 Q2 Q3 Q4 Q1 Q2 Q3 Q4 Q1 Q2 Q3 Q4 Q1
2004 2005 2006 2007 2008
Cumulative Weight (in percent) Number of Items Exceeding Threshold Inflation
CPI Items with Inflation Above Threshold
As may be expected with higher inflation, the number of items with inflation rates greater than 5.0 percent, the upper end of the inflation target for 2008, increased to 55 in Q1 2008 from 28 in the previous quarter. Likewise, these items accounted for a bigger proportion of the CPI basket at 40.1 percent compared to 27.1 percent in the last quarter. Dividing the CPI basket into food and non-food components generates the same trend. There were 41 food items with inflation rates above threshold compared to 20 in the previous quarter. Meanwhile, 14 non-food commodities posted inflation rates higher than the threshold in the current quarter compared to 8 a quarter earlier.

6
Inflation Rates for Selected Food ItemsQuarterly averages in percent (2000=100)
Commodity2008 2007 Q1 Q4 Q3 Q2 Q1
Food, Beverage and Tobacco 7.0 4.1 2.9 2.7 3.3Food 7.2 4.1 2.9 2.6 3.3Cereal & Cereal Products 8.6 6.0 3.5 2.2 2.7o/w Rice 8.7 7.0 3.4 1.6 1.6
Corn 5.9 2.7 4.3 4.1 6.7Dairy Products 11.4 7.6 5.5 4.1 4.4Eggs 8.1 7.6 7.6 6.3 5.5Fish 7.8 3.8 2.6 3.3 3.4Fruits & Vegetables 10.6 3.4 1.7 2.8 3.8Meat 4.9 2.6 3.1 2.4 2.3Misc. Food 4.2 2.5 1.9 2.3 3.8Beverages 3.7 2.7 2.9 3.5 5.4Tobacco 3.1 2.5 2.4 2.1 2.2
Source of Basic Data: NSO, BSP
Food Prices Higher food prices have continued to dominate overall headline inflation for the past five quarters starting Q1 2007. In the past two quarters, this was mainly triggered by the elevated global prices of virtually all agricultural commodities, particularly dairy and cereals, including rice and wheat, on account of global supply and demand factors.4 Both processed and unprocessed foods registered increases in Q1 2008, but the developments in global commodity prices appeared to have had the most impact on processed foods particularly in cereal preparations and dairy products. All prices of food items rose, with cereals (particularly rice), fruits and vegetables, and fish recording the top contributions to quarterly inflation during Q1 2008. Rice, which constitutes 9.4 percent of the CPI basket, increased by 8.7 percent in Q1 2008 from 7.0 percent in the previous quarter. Domestic retail prices of rice increased sharply during this quarter, following the sudden spike in international rice prices during the same period. Domestic retail prices of ordinary and special rice increased in March 2008 year-on-year by 14.5 percent and 16.8 percent, from 8.4 percent and 9.0 percent in December 2007, respectively. Similarly, the All Rice Price Index (ARPI) from FAO had increased by 17 percent year-on-year in March 2008. Coupled with tight demand-supply conditions in global rice markets, the spillover effect from rising prices of other agricultural commodities has made the price increases for rice even more pronounced. Higher prices for wheat, for example, raise the demand for substitutes such as rice, pushing up the price of rice even further. The hoarding of rice, whether by consumers or speculators may also be exacerbating the hike in domestic rice prices.
4 See box article for a thorough discussion of the developments in international food prices.
Food prices continue to drive headline inflation.

7
In order to moderate the rise in rice prices, the government, through the DA, has implemented various programs to help alleviate the impact of the rice price increases on the poorest of the poor. For one, the National Food Authority (NFA) will carry out “supervised selling” of medium-priced commercial varieties in addition to NFA- subsidized rice as well as undertake measures to prevent the diversion of NFA rice to private warehouses and profiteering by rice traders. In addition, President Arroyo ordered the revocation of licenses of some 5,000 NFA retailers in the country to flush out hoarders and other erring grains traders. Meanwhile, a shortage of top-quality spring wheat in the US (the world’s largest wheat exporter) helped push up the domestic prices of flour, which is the primary ingredient for making bread and instant noodles (together accounting for 1.7 percent of the CPI basket). The price spikes in fruits and vegetables were traced mainly to base effects due to low price levels in 2007. The price of meat products also increased, due mainly to the rising costs of feeds and the tight domestic supply of beef and pork.

8
Box Article: Developments in Global Food Prices and their Impact on Domestic Prices Overview International food prices rose significantly in 2007 as income growth in emerging as well as developing economies, and the high demand for biofuel are redefining the pattern of food consumption and production globally. Since these structural changes are expected to affect food prices for years, developments in world food prices could become a major issue as monetary authorities worldwide are concerned that this may trigger higher food-based domestic inflation and inflation expectations. In addition to the spike in world oil prices, the rise in global food prices has already led to significant increases in domestic prices of several countries. Accelerating food and energy prices lifted inflation sharply throughout Asia, with headline inflation at its highest in 25 years in Singapore, almost 12 years in China, and nearly 10 years in Hong Kong and Taiwan. This prompted governments across the Asian region to use fiscal policy in response to these supply shocks. The fiscal measures include price subsidies, cuts in import duties, export restrictions and temporary price controls that cover basic goods, fertilizer, school and transportation fees, oil products, natural gas, and electricity. In Latin America, sharp increases in food prices also pushed Chile’s inflation to levels well above the tolerance range of its inflation target. Similarly, Brazilian inflation surged to 4.6 percent in February 2008 from 3.0 percent in the previous year, the first time since 2002 that inflation accelerated in Latin America's largest nation. In the euro area, higher food prices pushed year-on-year inflation to 3.3 percent in March 2008 from 3.2 percent in the previous month, the highest level in more than six years. Meanwhile, Russia’s inflation rate rose to 11.9 percent in 2007 from 9.0 percent in 2006, the highest in four years, even as the government cut dairy and vegetable oil import duties, sold grain from state reserves, and added a grain export duty. What is causing the surge in food prices? The dramatic increase in the prices of grains and edible oils over the past year was attributed mainly to the strong demand for biofuel, the rising prosperity in China and other emerging nations, and supply concerns following abnormal weather conditions in major agriculture-exporting countries. In 2007, the World Bank’s food price index was at its highest level since 1960 at 146.0 as prices of grains and edible oils—the commodity groups that are used heavily in biofuel production—increased significantly (Figure 1). Figure 1

9
Supply disruptions caused by bad weather, local cases of animal disease outbreaks and crop infestation also contributed to the spike in food prices over the past year. Global harvests were severely affected by the drought in major wheat-producing countries like Australia and Canada, while abnormal monsoon patterns affected rice production in Latin America and the Caribbean (LAC), Asia (Bangladesh, China, India, Indonesia, Philippines, and Nepal), Western Africa, and Southern Africa. In China, the outbreak of the “blue ear pig disease” drove up pork prices, igniting fears of a global pandemic as a similar virus has been detected in neighboring countries like Vietnam and Myanmar. The more recent trends in food prices and the supply and demand fundamentals in food products, however, are now affected by the income growth in emerging countries and the strong demand for biofuel following the renewed surge in crude oil prices. The following diagram illustrates the interplay of interrelated factors which affected global prices in 2007 and up to early 2008. Figure 2: Factors Affecting Global Food Prices
New Factors: Affluence in Asia, High Demand for Biofuel and Financial Trends With the rising incomes in China, India and other emerging economies, demand has shifted from grains and other staple crops to high-value food products such as meat and dairy products, resulting in higher demand for animal feeds. That, in turn, is stoking the demand for grains many times over since it takes more grains to produce a kilo of meat than to produce bread. On top of this, the growing demand for feed ingredients will push up the prices of grains further as it competes with the demand for biofuel raw materials. Ultimately, this leads to rapidly escalating prices of cereals, meat, poultry and dairy products.

10
The demand for biofuel has affected the prices of other food items as it competes with agricultural land needed for food production. Strong demand for biofuel has led more farmers to switch to more profitable crops used for biofuel production, such as barley for example. The reduction in land areas used for planting barley in favor of other crops used as biofuel feedstocks has brought down its supply, driving up the price of barley in 2007. Robust economic growth in the emerging markets is also indirectly linked with the demand for biofuel. The tight supply-demand condition in the oil market was in part triggered by the surge in demand for fuel from China and India, thus the call for alternative sources of fuel. The International Monetary Fund (IMF) attributes recent trends in the global financial market as one of the main drivers of the recent run-up in global commodity prices.5 Specifically, the dollar depreciation in 2007 has stimulated demand as it increased the purchasing power of consumers in the non-dollar region. The falling US dollar also made commodities a more attractive class of alternative assets. Speculative inflows toward the commodity market were also observed to have increased, leading to more volatility and escalating prices. Lastly, freight costs have risen because of high and volatile oil prices coupled with increasing global trade activity. All these factors combined have made food importation more costly, and have therefore contributed to higher food prices. The magnitude of the impact of these factors on food prices and the influence of the food price increases on headline inflation, however, vary across economies. In more developed countries, food accounts for only about 10 to 15 percent of the consumer price index (CPI) basket on average. By contrast, food has a bigger share (30 percent or more) in the CPI basket in many emerging market economies. In many developing Asian countries including the Philippines, it is 50 percent or more. Is Philippine inflation vulnerable to swings in international food prices? Recent developments in global food prices have spawned interest on the direct pass-through effects of the international price of food products on domestic inflation in the Philippines. This is in consideration of the fact that food accounts for 50 percent of the Philippine CPI basket. Evidence from past empirical studies for other countries are mixed. A considerable amount of literature point to small pass-through effects. Herrero and Thornton (1997), using cointegration and an error-correction model (ECM), concluded that world commodity prices seemed to have little predictive power in forecasting movements in domestic retail prices in the United Kingdom (U.K.), both in the long run and in the short run. They also found that there was little evidence of causality from world commodity prices to U.K. retail prices. The study noted that commodity price indices, particularly food, are inherently volatile in that they exhibit inflation variances that are many times larger than that of the consumer price index. Moreover, supply conditions in world food prices may deviate significantly from aggregate demand in an individual economy. Similarly, Boughton and Branson (1988), using ordinary least squares (OLS) and ECM found no stable long-run relationship between commodity prices and retail prices but suggested that in the short run, world commodity prices exhibited a signaling power on domestic inflation. Meanwhile, a number of studies which used unstructured vector autoregression (VAR) models yielded the following results:6
• Higher food prices, particularly in developing countries, seemed to be a significant determinant of non-food inflation through its indirect impact on the demand for higher wages (Cheng and Samiei, 2007); and
• World food commodity prices may be directly linked to broad inflation because these commodities are used as valuable inputs to production and should eventually be passed on to final goods’ prices. Large direct input price effects have historically been concentrated in food and energy commodities. Not surprisingly, food and oil, which are particularly sensitive

11
to major supply disruptions, appear to have more explanatory power in the link between commodity prices and consumer price inflation (Bloomberg and Harris, 1995).
Empirical Findings Staff estimates using both ordinary least squares and vector-autoregression indicate minimal direct pass-through. An error-correction model, however, yielded results that show a more significant impact of international food prices on domestic inflation. For some broad measure of long-run and short-run pass-through effects of imported food prices on domestic food prices, simple linear regression was used to derive the long-run effect while an error-correction representation was used to estimate the short-run impact. These relationships were represented as follows: Long Run:
LOG(CPIFBT) = c + α*LOG(GFINDEX) + β*LOG(FOREX) + γ*LOG(CPIFBT(-1)) Short Run:
D(LOG(CPIFBT)) = c + η*resid(-1) + α*D(LOG(GFINDEX)) + β*D(LOG(PCEFOOD(-1))) + γ*D(LOG(CPIFBT(-1))) where: CPIFBT = domestic food price index GFINDEX = Global Food Price Index FOREX = nominal peso-dollar exchange rate PCEFOOD = personal consumption expenditure on food Table 1. Summary of Results7
Coefficients (t-statistics)
Long-run Dependent variable: Domestic food price GFINDEX 0.06
(5.34) FOREX 0.05
(4.32) Lagged CPIFBT 0.91
(47.52) Adjusted R2 0.98 Short-run Dependent variable: Change in domestic food price ECM term -0.94
(-5.97) Change in GFINDEX 0.04
(1.83) Change in PCEFOOD 0.02
(2.81) Lagged change in CPIFBT 0.98
(13.00) Adjusted R2 0.56
The proposed specification passed all residual tests. All variables are expressed in logs, hence, coefficients are interpreted as elasticities. All regressors are significant at one percent level of significance.
The ECM results showed that a 1 percent increase in global food prices will lead to a 0.04 percent to 0.06 percent increase in domestic food prices. This implies that movements in global food prices have limited direct impact on domestic food prices and on domestic inflation. This could be because the share of imported food commodities to total demand based on the 2000 input-output (I-O) table is just 13.2 percent. This is consistent with the observation that the pass-through of import prices of commodities (particularly food and oil) to domestic inflation appears to have a stronger effect on

12
countries with a larger import share (Mc Carthy, 1999). However, with the recent surge in the global food index, the impact on domestic food inflation is expected to be more pronounced. In Q1 2008, for example, global food price index rose by 55.6 percent from the same period a year ago. This implies that the impact of the increase in global food index on domestic food inflation is estimated to be around 2.2 percentage points for Q1 2008 if the resulting coefficient from the ECM is applied.
Figure 3
To account for the disaggregated impact of international prices on the prices of the country’s three major food imports —cereals, feeds and dairy products — an unstructured VAR analysis was conducted. The objective of the VAR analysis is to capture the impact of increases in the import prices of various food products on domestic food inflation. Import prices of certain food products serve as a channel through which international food prices impact domestic food prices, and hence broad inflation. The VAR system has five endogenous variables: import price indices of cereals (CERIMP), feeds (FFEDS), and dairy (DAIRY), domestic food CPI (FOOD), and the nominal exchange rate (XRATE).8 A time trend is included to account for the trend decline in inflation. Two sets of statistics were used to assess the effect of import prices of these three major food imports on domestic food inflation. First, impulse responses to shocks on the import prices of each of these food imports were estimated over a two-year period (eight quarters). Second, variance decompositions were obtained to assess how much of the variance in the domestic prices of food and indices over the period can be attributed to variances in the imported food prices. Figure 4 displays the impulse responses9—from the VAR system of equations—of domestic food CPI to a shock in the import prices of cereals, feeds and dairy, which would reflect the movements in world food prices. The impact of a shock10 on the imported price of cereals is small, owing largely to low percentage share of imported cereals (11.2 percent) to domestic requirements. Similarly, the impact on domestic food inflation from a shock in the imported price of feeding stuffs is minimal.11 This may be attributed to the high corn sufficiency level of the Philippines at 88 percent as of 2007.12 On the other hand, a shock on the international price of dairy products has a relatively higher impact on domestic inflation, albeit the magnitude is also small. This is expected since almost 99 percent of the country’s dairy requirement is imported, but its weight in the CPI basket is only around 2.9 percent.13
Figure 4

13
-1.0
-0.5
0.0
0.5
1.0
1.5
2.0
1 2 3 4 5 6 7 8 9 10
Accumulated Response of D(FOOD(-1)) to D(CERIMP(-1))
-1.0
-0.5
0.0
0.5
1.0
1.5
2.0
1 2 3 4 5 6 7 8 9 10
Accum ulated Response of D(FOOD(-1)) to D(FEEDS(-1))
-1.0
-0.5
0.0
0.5
1.0
1.5
2.0
1 2 3 4 5 6 7 8 9 10
Accumulated Response of D(FOOD(-1)) to D(DAIRY(-1))
-1.0
-0.5
0.0
0.5
1.0
1.5
2.0
1 2 3 4 5 6 7 8 9 10
Accumulated Response of D(FOOD(-1)) to D(FOOD(-1))
-1.0
-0.5
0.0
0.5
1.0
1.5
2.0
1 2 3 4 5 6 7 8 9 10
Accum ulated Response of D(FOOD(-1)) to D(XRATE(-1))
Accumulated Response to Cholesky One S.D. Innovations ± 2 S.E.
In determining the extent to which these shocks account for the variances in domestic food price inflation over the horizon, the variance decomposition of the price variables was obtained. The variance explained by the import price of dairy 1 period after a shock is 6.1 percent. Over time, the explanatory power of dairy import prices increases and becomes more pronounced, averaging at about 12.0 percent 3 to 10 periods after the shock. This is higher than the variance explained by cereals and feeds, averaging at about 1.0 percent and 8.0 percent, respectively, throughout the horizon. Exchange rate variations also appear to be explaining only a small share of the fluctuations in domestic food prices, contributing only a range of about 2.4 to 3.6 percent. Table 2. Variance Decomposition of Domestic Food Inflation
Period Cereals Feeds Dairy Products Exchange Rate
1 0.581980 8.517446 6.069621 0.000000 2 0.818875 7.538437 11.44329 2.433805 3 0.846071 7.728077 12.06762 3.374878 4 0.934462 7.787152 12.25076 3.541627 5 0.967411 7.865361 12.22868 3.569854 6 1.016549 7.920535 12.22648 3.565776 7 1.044662 7.962701 12.22454 3.563065 8 1.069044 7.995840 12.22151 3.560886 9 1.087110 8.020940 12.22038 3.559067
10 1.101060 8.040426 12.21901 3.557764

14
In summary, the variance decompositions indicate that the influence of external factors appears to be modest in the initial periods after a shock, but persists and increases over a longer time period particularly with respect to dairy products that have a larger import share to domestic requirements. Conclusion The results of the OLS and VAR estimations show that the estimated direct pass-through effects of imported food prices on domestic food inflation are proportionally limited. In the unstructured VAR estimation, it was seen that the response of domestic food CPI to shocks in the import prices of cereals, feeds, and dairy is low. Meanwhile, the measure of short-run pass-through effects using the ECM showed that the sensitivity of food inflation is only at 0.04 percentage point for every one percent increase in the global food price index, while the long-run impact is estimated at 0.06 percentage point. However, it is important to emphasize that the global food index has increased rapidly over the past year and well into 2008, so that the total pass-through effect of global food prices on domestic food price movements has become more pronounced. Trends in commodity prices—particularly food and oil—bear close and diligent monitoring as these price indices contain forward-looking characteristics and have the ability to nudge up inflation expectations (Herrerro 1997) and even encourage speculative behavior as agents may view commodities as a useful hedge against inflation. Against this backdrop, there would be upward pressure on the price and wage-setting behavior of economic agents in response to the movement in domestic food prices. Another area for further study is the role of inflation expectations in the short-run relationship between international commodity prices and domestic food inflation as this may well be a relevant channel by which the surge in global food prices affects the domestic economy. Moreover, another area to consider is how to isolate the impact of exchange rate movements on prices of imported commodities and, ultimately, on domestic food CPI. The peso has helped moderate the pass-through effects of higher global food prices on domestic food inflation. However, given that food accounts for half of the Philippine CPI basket, the tight condition in the global food market will continue to exert pressure on domestic headline inflation. Thus, the risks posed by the rising global food prices will remain a long-term challenge for monetary authorities.
Bibliography: Bloomberg, S. and E. Harris, 1995, “The Commodity-Consumer Price Connection: Fact or Fable?” FRBNY Economic Policy Review, October 1995 Branson, W., and J. Boughton, 1988, “Commodity Prices as Leading Indicator of Inflation,” IMF Working Paper, WP/88/87 Cheng, K. and H. Samiei, 2007, “Who Is Harmed by the Surge in Food Prices?” IMF World Economic Outlook, October 2007. Green, H. Herrero, A. and J. Thornton, 1997, “World Commodity Prices as a Forecasting Tool for Retail Prices: Evidence From the United Kingdom,” IMF Working Paper, WP/97/70 Johansen, M., 1988, “Estimation and Hypothesis Testing of Cointegration Vectors in Gaussian

15
Vector Autoregressions,” Econometrica 59, no. 6:1551-80 McCarthy, J., 1999, “Pass-through of Exchange Rates and Import prices to Domestic Inflation in Some Industrialized Economies,” BIS Working Paper, November 1999
International Monetary Fund, World Economic Outlook, January 2008

16
Inflation Rates for Selected Non-Food ItemsQuarterly averages in percent (2000=100)
Commodity2008 2007 Q1 Q4 Q3 Q2 Q1
Non-Food Items 4.2 2.6 2.2 2.0 2.4Clothing 3.1 1.8 2.1 2.5 2.8Housing & Repairs 2.7 1.2 1.3 1.5 2.2Fuel, Light & Water 5.4 2.8 4.2 3.3 2.4
Fuel 16.8 10.1 0.8 3.5 -1.1Ligh t -1.8 -2.6 6.7 2.8 3.8Water 2.5 4.4 4.5 5.0 6.9
Services 5.9 4.3 2.1 2.1 2.8Transpo & Comm. 5.6 3.2 -1.1 -0.5 0.5Miscellaneous 2.0 1.3 1.4 1.6 2.1
Source of Basic Data: NSO, BSP
5
15
25
35
45
55
65
75
85
1995 1996 1997 1998 1999 2000 2001 2002 2003 2004 2005 2006 2007 2008
Dubai Crude OilQuarterly average spot price in US dollars per barrel
Q1 2008 US$91.38
Non-Food Prices Non-food inflation reached its highest level since Q1 2007, driven mainly by fuel and the transportation and communication sectors. High global oil prices were directly reflected in the five rounds of increases in the domestic pump prices of gasoline products, kerosene and diesel oil in March. This, in turn, translated into higher price levels of fuel, and of transportation and communication services. The inflation rate of services, which accounts for 15.9 percent of CPI, was higher at 5.9 percent in Q1 2008 as against 4.3 percent in the previous quarter, and was considerably higher than the 2.8 percent registered in the same period last year. Meanwhile, all other non-food sub-components registered increases in their inflation rates during the quarter compared to a year ago and the previous quarter Energy Prices International oil prices averaged higher in Q1 2008 partly due to geopolitical tensions in oil-producing nations like Nigeria and Iraq. Supply disruptions due to the suspension of crude oil deliveries of Venezuela’s state petroleum company (Petroleos de Venezuela SA) to the biggest energy company in the US (Exxon Mobil) along with the unrest in Pakistan also pushed prices up. OPEC’s decision in its 5 March 2008 meeting to keep its output unchanged as well as speculative investment in the oil commodity market, driven by the weak US dollar, also supported high oil prices. Dubai crude oil reached an average of US$91.38 per barrel in Q1 2008, higher by 9.8 percent compared to the previous quarter’s average of US$83.19 per barrel.
Likewise, fuel and transportation costs push up non-food inflation.
International oil prices strongly rise.

17
Local pump prices of oil products are raised during the quarter.
6
11
16
21
26
31
36
41
46
51
1998 1999 2000 2001 2002 2003 2004 2005 2006 2007 2008
Premium Gasoline Diesel Oil
Local Retail Prices of Selected Oil ProductsPrice in pesos per liter
Mar P47.07
Mar P39.44
10
20
30
40
50
60
70
80
90
100
110
2000 2001 2002 2003 2004 2005 2006 2007 2008 2009
Spot and Estimated Future Prices of Dubai Crude Oil* Price in US dollars per barrel
*Futures price derived using Brent crude futures data.
31 Mar 08
28 Dec 07
In the domestic market, pump prices of gasoline products increased by an average of P2.00 per liter while that of diesel oil increased by about P1.00 in Q1 2008 relative to the end of Q4 2007. The increase, however, was lower compared to that of the previous quarter. During the review quarter, prices of gasoline products and diesel oil were reduced once in February but increased five times in March. Meanwhile, the price of LPG decreased four times (three times in February and once in March) in Q1 2008. In response to escalating world oil prices which translated to higher domestic pump prices of petroleum products, the tariff on imported oil products was reduced from three percent in January to one percent in February, and then raised to two percent in March. Under the implementing guidelines, the tariff on imported oil products will be reduced to between 0-2 percent when oil prices reach the (revenue neutral) trigger price levels indicated by the Department of Finance (DOF). The actual oil prices with which the trigger price levels will be compared shall be based on the average price of oil during the first 15 days of the month. If the actual prices reach any of the trigger price levels, the Department of Energy shall issue a certification to DOF for the latter to implement the corresponding reduction in the oil import tariff. The estimated future price of Dubai crude oil, based on movements in Brent crude oil futures, suggested higher prices in 2008. Market fundamentals are projected to remain tight despite forecasts of slower global economic growth which could weaken demand for oil.
Outlook for world prices remains tight.

18
Power rates are higher in Q1. PSALM bids out 12 power plants, accounting for 42.8 percent of the capacity target set to be bidded out by 2009. The MWSS approves the rate increase of MWCI as a result of rate rebasing. Meanwhile, water rates of Maynilad are lower due to the higher discount in the FCDA charge.
Power Electricity rates were generally higher in the first quarter of 2008 as the National Power Corporation (NPC) reverted to its higher dry-season (semestral) rates for Luzon and Mindanao for the first half of the year in January. There was no increase in the rates for Visayas, as semestral rates only apply to regions with major hydroelectric power plants. The higher discount from the incremental currency exchange rate adjustment (ICERA) for Luzon has tempered the increase in the semestral rates by P0.11/kwh. Nonetheless, more pressures on electricity rates in the coming months are expected with the start of the summer season. This, however, may be tempered by the broadly steady peso and higher utilization of hydroelectric power plants with expectations of more rainfall due to La Niña even as weather conditions are forecast to normalize by June 2008. On the status of the privatization program, the Power Sector Assets and Liabilities Management Corporation (PSALM) had successfully bid out 12 plants (Tolomo, Agusan, Barit, Cawayan, Loboc, Pantabangan-Masiway, Magat, Masinloc, Calaca, and Ambuklao-Binga) as of Q1 2008. This translates to 1,855.5 MW operating capacity, or 42.8 percent of the 4,336 MW aggregate capacity target set for bidding by 2009. Water Water rates were higher in the first quarter of 2008 as the Manila Water Company, Inc. (MWCI) implemented a higher rate increase compared to the rate reduction of Maynilad. The Metropolitan Waterworks and Sewerage System (MWSS) approved the increase in the rate of Manila Water Company, Inc. (MWCI), following the rate rebasing. The rate hike was implemented on a staggered basis over the first three months of the year. The rebasing allowed for an average tariff increase of P4.00 per cubic meter, equivalent to a 20 percent increase from the average tariff as of December 2007.
19
Rate rebasing is done every five years to review the water concessionaire’s service improvement plan and evaluate the required capital investment to implement the plan. Meanwhile, Maynilad rates declined despite the increase in its basic charge as this was offset by the higher discount from the foreign currency differential adjustment (FCDA) charge. Residential water rate charged by Maynilad was lower by P1.30 per cubic meter in the first quarter.
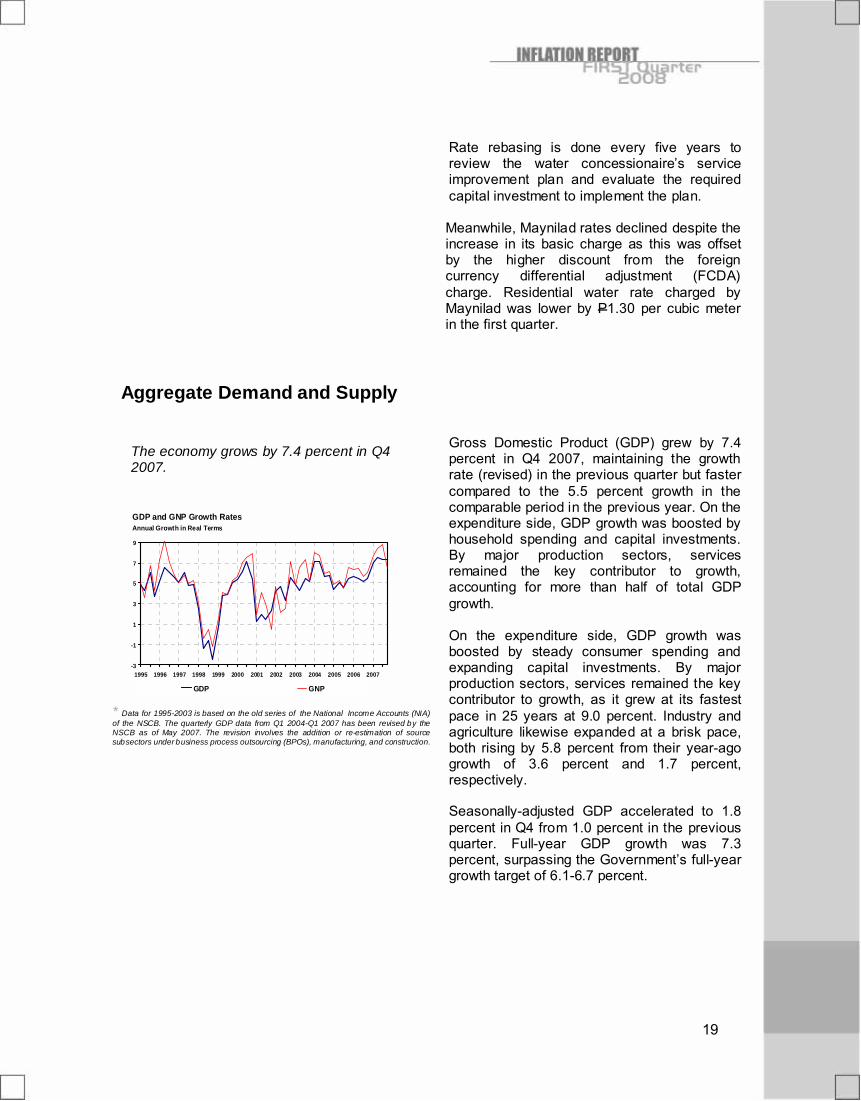
Aggregate Demand and Supply Domestic economy grows by 7.4 percent in Q4
2007.
-3
-1
1
3
5
7
9
1995 1996 1997 1998 1999 2000 2001 2002 2003 2004 2005 2006 2007
GDP GNP
GDP and GNP Growth Rates Annual Growth in Real Terms
* Data for 1995-2003 is based on the old series of the National Income Accounts (NIA) of the NSCB. The quarterly GDP data from Q1 2004-Q1 2007 has been revised by the NSCB as of May 2007. The revision involves the addition or re-estimation of source subsectors under business process outsourcing (BPOs), manufacturing, and construction.
Gross Domestic Product (GDP) grew by 7.4 percent in Q4 2007, maintaining the growth rate (revised) in the previous quarter but faster compared to the 5.5 percent growth in the comparable period in the previous year. On the expenditure side, GDP growth was boosted by household spending and capital investments. By major production sectors, services remained the key contributor to growth, accounting for more than half of total GDP growth. On the expenditure side, GDP growth was boosted by steady consumer spending and expanding capital investments. By major production sectors, services remained the key contributor to growth, as it grew at its fastest pace in 25 years at 9.0 percent. Industry and agriculture likewise expanded at a brisk pace, both rising by 5.8 percent from their year-ago growth of 3.6 percent and 1.7 percent, respectively. Seasonally-adjusted GDP accelerated to 1.8 percent in Q4 from 1.0 percent in the previous quarter. Full-year GDP growth was 7.3 percent, surpassing the Government’s full-year growth target of 6.1-6.7 percent.
The economy grows by 7.4 percent in Q4 2007.

20
Aggregate Demand Expenditures (by major economic sectors) PCE growth was robust, expanding by 6.3 percent in Q4 2007 from 5.8 percent in the same quarter last year. Higher household spending was supported by the low inflation environment, modest improvement in employment, and the surge in remittances from OFs. Nonetheless, household spending remained concentrated on necessities such as food, clothing, and utilities. Expenditures on food, which comprised over half of total PCE, rose faster at 6.6 percent. Household spending on beverages and miscellaneous items also registered higher growth rates relative to the previous year.
Government consumption accelerated further to 10.8 percent in Q4 2007 from 9.9 percent a year ago. This may be partly traced to the disbursement of government funds for infrastructure projects during the quarter. Supported by positive investor sentiments and the low and stable interest rate environment, investments rose further in Q4 2007, with investments in fixed capital posting a 10.3 percent growth, a significant improvement from the year-ago growth of 2.2 percent. The expansion was driven by the 17.6 percent surge in construction,14 particularly private construction, during the period.
Household and public sector spending boost aggregate demand.
-25-20-15-10-505
1015202530
1995 1996 1997 1998 1999 2000 2001 2002 2003 2004 2005 2006 2007
Govt. Spending Private Consumption Fixed Investment
Domestic Demand Annual Growth in Real Terms
2006
5.86.06.3Personal consumption9.96.710.8Government Consumption1.88.414.7Capital Formation2.29.210.3Fixed Capital Formation2.30.7-2.0Exports1.4-5.5-2.3Imports
Q4By expenditure item
Q3Q4
Source: NSCB
2007Sector
Economic PerformanceGrowth rate (in percent)
2006
5.86.06.3Personal consumption9.96.710.8Government Consumption1.88.414.7Capital Formation2.29.210.3Fixed Capital Formation2.30.7-2.0Exports1.4-5.5-2.3Imports
Q4By expenditure item
Q3Q4
Source: NSCB
2007Sector
Economic PerformanceGrowth rate (in percent)

21
Imports Based on the Balance of Payments (BOP) data, imports of goods rose by 14.6 percent year-on-year to US$15.5 billion in Q4 2007, an acceleration from both the previous quarter and the previous year. 15 All major commodity groups posted year-on-year increments during the review quarter. In particular, imports of mineral fuels and lubricants rose significantly by 58.6 percent to US$2.9 billion due to higher prices of petroleum crude and other mineral fuels and lubricants. Imports of consumer goods at US$1.3 billion also posted a hefty increase of 47.6 percent led by the increase in the procurement of rice, the rising cost of dairy products, and the robust demand for passenger cars and motorized vehicles. For 2007, merchandise imports increased at a slower pace of 8.1 percent from the 10.9 percent growth rate posted in 2006.
Imports of Goods (BOP data)Growth rate (in percent)
Commodity Group2007 2006
Q4 Q3 Q4Capital Goods 11.3 -3.7 -0.3Raw Materials & Intermediate Goods 3.1 4.7 6.1
Mineral Fuels & Lubricant 58.6 26.6 30.0Consumer Goods 47.6 28.6 17.1Total Imports1/ 14.4 7.9 7.5Conceptual and coverage
adjustments -15.2 -154.2 -44.4Total Imports, BPM5 14.6 8.9 8.3
1/ Include valuation adjustments to NSO dataSource: BSP

22
*Base year chosen was the earliest year for which data was available
Other Demand Indicators Other demand indicators similarly showed modest strengthening: 1) property prices increased and vacancy rates decreased; 2) sales of vehicles, power and appliances continued to grow; and 3) business confidence remained positive and consumer confidence improved. Property Prices • Based on estimates from Colliers International
Research, land values in Q4 2007 rose by 30.3 percent year-on-year for the Makati Central Business District (CBD) and 20.9 percent year-on-year for Ortigas Center. Quarter-on-quarter, the estimated land values in the Makati CBD and the Ortigas area were 5.5 percent and 4.0 percent higher, respectively. Colliers expects land values to rise further by 10.0 percent year-on-year in Q4 2008. Colliers further noted that the land value appreciation is expected to be tempered in 2008 and 2009 because of the massive potential supply of business process outsourcing (BPO) office space in 2009 across Metro Manila and the over-supply of residential condominium units in locations such as Fort Bonifacio where rents may be lower.16 Land values were about 60-70 percent of their 1997 levels in nominal terms, but only about one-third of their 1997 levels in real terms.
Vacancy Rates, Makati CBD (%)
2007 2006Forecast
2008Q4 Q3 Q4 Q4 Q1
Office 2.3 3.7 3.9 2.6 2.9Residential (3-bedroom
condominiums) 6.6 7.1 10.0 6.5 6.7
Source: Colliers International Research
Vacancy Rates • Office and residential vacancy rates in the
Makati CBD at 2.3 percent and 6.6 percent were lower in Q4 2007, respectively, compared to the previous quarter and year-ago levels. For Q1 2008, Colliers projects the office vacancy rate at 2.9 percent as office spaces being completed have already been pre-leased. For residential space, Colliers projects the Q1 2008 vacancy rate at 6.7 percent. For Q4 2008, Colliers expects the average office vacancy rate to settle at 2.6 percent, which is lower than the Q3 2008 forecast, while the residential vacancy rate is projected to remain at 6.5 percent with expectations that new office spaces would be quickly occupied during the year.
*Average Land Values, Makati CBD and Ortigas Real prices, based on CPI (1991=100) (in pesos per square meter)
0 50,000
100,000
150,000
200,000
250,000
300,000
1998 2001 2002 2003 2004 2005 2006 2007
Makati Ortigas

23
Rental Values
• Office rents in the Makati CBD increased by 25.6 percent year-on-year in Q4 2007 to an average of P795/sq.m. and are forecasted to rise further by 10.0 percent in Q4 2008. Rents for 3-bedroom condominium units rose by 14.0 percent year-on-year to P539/sq.m. in Q4 2007 and are expected to increase by 10.0 percent in Q4 2008.
• Office rental values continued to rise in Q4
2007 and have breached the 1997 levels for premium grade offices. In real terms, however, office rents are only 60 percent of the levels in 1997.
• Consistent with the data from Colliers
International Research, Makati CBD data from Jones Lang La Salle in Q3 2007 showed year-on-year increases in office and residential rents of around 30.0 percent and 33.0 percent (in peso terms), respectively. Jones Lang La Salle noted that the sustained growth of rentals in Makati CBD was driven mainly by the growing BPO industry.
• Colliers also reported that residential rents in
Rockwell and Fort Bonifacio as of Q4 2007 rose year-on-year by 4.6 percent to P636/sq.m. and 4.5 percent to P578/sq.m. Colliers expects residential rents in Rockwell and Fort Bonifacio to escalate by 10 percent and 5 percent, respectively, in 2008.
Office and Residential Rental Values Real prices, based on CPI (1995=100)(in pesos per square meter per month)
0 100 200 300 400 500 600 700 800 900
1,000
1998 2001 2002 2003 2004 2005 2006 2007
Office rental value Residential rental value

24
-100
-50
0
50
100
150
200
2003 2004 2005 2006 2007 2008Passenger Cars Commercial Vehicles
Sales of Passenger Cars and Commercial VehiclesYear-on-year change in percent
-80
-60
-40
-20
0
20
40
60
80
100
120
140
2003 2004 2005 2006 2007 2008
Sales of Trucks and BusesYear-on-year change in percent
Sales of Vehicles • Passenger car sales in January-February 2008
increased by 19.0 percent year-on-year, a turnaround from the 4.0 percent decline recorded in the comparable period last year. This was also higher than the 15.1 percent year-on-year growth registered in the first two months of the previous quarter. According to the Chamber of Automotive Manufacturers of the Philippines, Inc. (CAMPI), the increase in sales can be attributed to the promotional activities of car dealerships coupled with the introduction of new models. Meanwhile, total sales of passenger cars increased by 11.3 percent year-on-year in Q4 2007.
• Likewise, sales of commercial vehicles grew
although at a slower pace of 12.6 percent year-on-year in the first two months of the year from 28.7 percent a year ago and 33.7 percent in the comparable period in Q4 2007. Total commercial vehicle sales for the last quarter of 2007 registered a growth of 32.8 percent year-on-year.
• Meanwhile, sales of trucks and buses for the
first two months of Q1 2008 went down by 5.3 percent year-on-year compared to the 52.5 percent expansion in the same period last year and the 2.8 percent decline in October-November 2007. On a full-quarter basis, sales of trucks and buses posted a 6.2 percent decline year-on-year in Q4 2007.

25
-10
-5
0
5
10
15
2000 2001 2002 2003 2004 2005 2006 2007 2008
Meralco Power SalesYear-on-year change in percent
Power Sales • Energy sales by Meralco rose by 5.2 percent
year-on-year for the first two months of the year, up from 2.9 percent in the comparable period last year. However, this was slightly lower compared to the growth of 5.8 percent in the first two months of the previous quarter. The rise in energy sales can be attributed mainly to the favorable sales to all sectors particularly the commercial sector which accounts for more than 50 percent of the increase in sales. Meanwhile, energy sales growth for Q4 2007 reached 3.8 percent year-on-year.
-60
-50
-40
-30
-20
-10
0
10
20
30
40
J F M A M J J A S O N D J F M A M J J A S O N D J F
Appliance SalesYear-on-year change in percent
2006 2007 2008
Appliance Sales • Appliance sales surged by 19.9 percent year-
on-year in January-February 2008, more than double the 7.9 percent growth recorded in the same period a year ago. This was also slightly higher than the 19.6 percent year-on-year expansion in the first two months of the previous quarter. Total appliance sales in Q4 2007 registered a growth of 17.2 percent year-on-year.
75.0
76.0
77.0
78.0
79.0
80.0
81.0
82.0
83.0
84.0
85.0
2007 2008
Average Capacity Utilization for Manufacturing In percent
• Based on the NSO’s Monthly Integrated Survey of Selected Industries (MISSI), average capacity utilization in manufacturing was relatively steady for the sixth consecutive month at 80.2 percent in January 2008 from 80.1 percent in Q4 2007.

26
-15
-10
-5
0
5
2007 2008
Volume of Production Value of Production
Volume and Value Indices of Manufacturing Production year-on-year change in percent
• On a quarterly basis, the average growth rate of the value of production index (VAPI) in Q4 2007 remained negative at -4.2 percent from the -1.7 percent average growth rate in the previous quarter. Likewise, the VAPI continued its decline at a rate of 1.4 percent year-on-year in January 2008 from its declines of 1.3 percent in December 2007 and 0.5 percent a year ago.
• After posting a -4.0 percent average growth
rate in Q4 2007, the positive outturn in the January 2008 volume of production index (VOPI) may indicate a possible recovery in Q1 2008. The VOPI grew modestly by 0.5 percent year-on-year in January 2008 from 0.1 percent in December 2007 and a decline of 3.6 percent a year ago.
Business sentiment remains positive in Q1.
Business Expectations SurveyIndex 2008 2007
Q1 Q4 Q3 Q2 Q1
Business Outlook Index
Current Quarter 29.9 48.0 40.9 46.4 44.9
Next Quarter 41.0 40.9 53.0 44.7 49.4
Source: BSP
Business Expectations Survey • Business confidence remained positive but the
lower index point for the current quarter indicated that more firms expect a slowdown in business activity. The overall confidence index (CI) remained positive at 29.9 percent as respondent firms with a positive outlook continued to outnumber those with a negative outlook. This index, however, was lower compared to the levels in the previous quarter and a year ago by 18.1 index points and 15.0 index points, respectively.
• The lower index was attributed to the weakening in the outlook particularly of exporter firms.17 Expectations of weaker demand after the holiday season also contributed to the weaker business optimism. Firms cited the following factors for their cautious outlook: 1) production slack in the first quarter due to seasonality; 2) concerns over a possible recession in the US economy; 3) reduced competitiveness of exports due to the peso appreciation; 4) unabated increase in crude oil prices; and 5) local political noise.
• Nonetheless, respondents believed that
business activity would be upbeat in Q2 2008 as the survey registered a higher confidence index of 41.0 percent, since consumer expenditures usually pick up during the summer season and the school year opening.
27
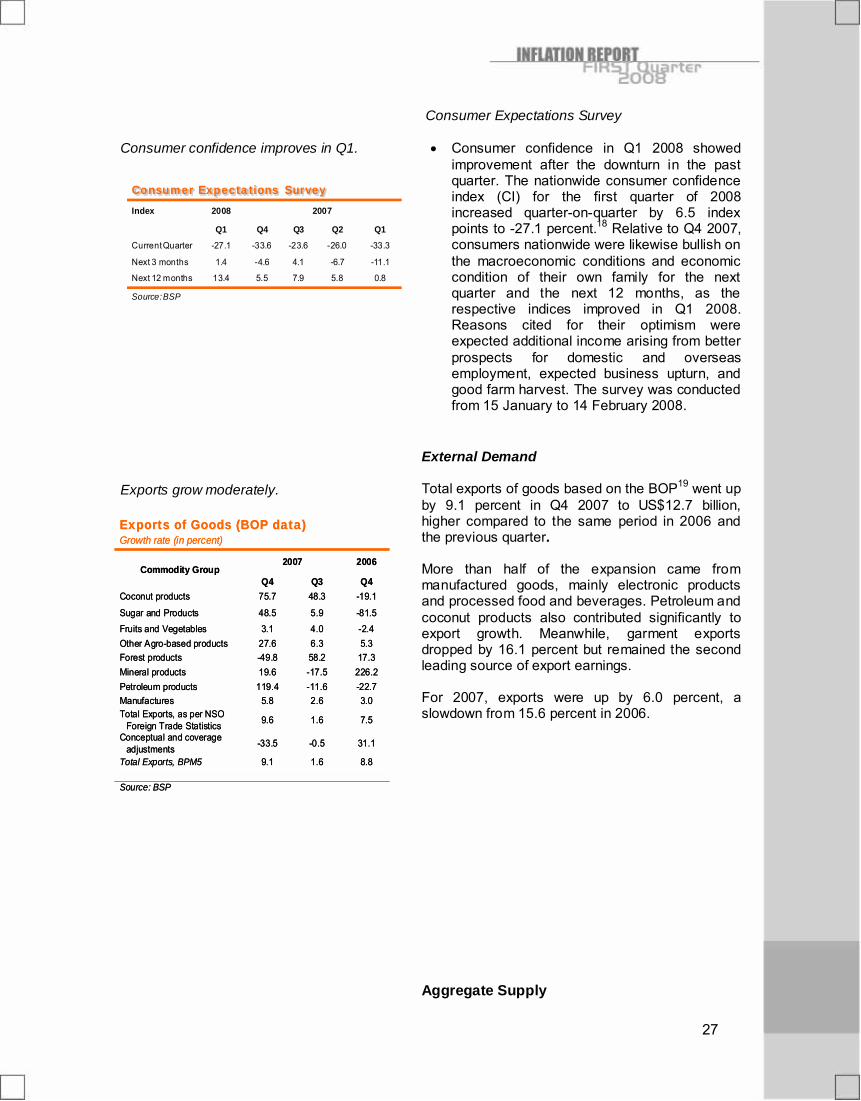
Consumer confidence improves in Q1.
Consumer Expectations SurveyIndex 2008 2007
Q1 Q4 Q3 Q2 Q1
Current Quarter -27.1 -33.6 -23.6 -26.0 -33.3
Next 3 months 1.4 -4.6 4.1 -6.7 -11.1
Next 12 months 13.4 5.5 7.9 5.8 0.8
Source: BSP
Consumer Expectations Survey • Consumer confidence in Q1 2008 showed
improvement after the downturn in the past quarter. The nationwide consumer confidence index (CI) for the first quarter of 2008 increased quarter-on-quarter by 6.5 index points to -27.1 percent.18 Relative to Q4 2007, consumers nationwide were likewise bullish on the macroeconomic conditions and economic condition of their own family for the next quarter and the next 12 months, as the respective indices improved in Q1 2008. Reasons cited for their optimism were expected additional income arising from better prospects for domestic and overseas employment, expected business upturn, and good farm harvest. The survey was conducted from 15 January to 14 February 2008.
Exports grow moderately.
External Demand Total exports of goods based on the BOP19 went up by 9.1 percent in Q4 2007 to US$12.7 billion, higher compared to the same period in 2006 and the previous quarter. More than half of the expansion came from manufactured goods, mainly electronic products and processed food and beverages. Petroleum and coconut products also contributed significantly to export growth. Meanwhile, garment exports dropped by 16.1 percent but remained the second leading source of export earnings. For 2007, exports were up by 6.0 percent, a slowdown from 15.6 percent in 2006. Aggregate Supply
Exports of Goods (BOP data)Growth rate (in percent)
Commodity Group2007 2006
Q4 Q3 Q4Coconut products 75.7 48.3 -19.1
Sugar and Products 48.5 5.9 -81.5Fruits and Vegetables 3.1 4.0 -2.4Other Agro-based products 27.6 6.3 5.3Forest products -49.8 58.2 17.3Mineral products 19.6 -17.5 226.2Petroleum products 119.4 -11.6 -22.7Manufactures 5.8 2.6 3.0Total Exports, as per NSO
Foreign Trade Statistics 9.6 1.6 7.5
Conceptual and coverage adjustments -33.5 -0.5 31.1
Total Exports, BPM5 9.1 1.6 8.8
Source: BSP

28
Major production sectors, led by services, boost output growth in Q4.
On the production side, GDP growth was boosted by services which registered a 9.0 percent expansion in Q4 2007 following the acceleration in the growth registered by trade, transportation, communication and storage (TCS), and private services relative to the same period in the previous year. Retail trade also remained strong, supported by brisk sales from the newly-opened malls and hypermakets all over the country. Meanwhile, private services accelerated in the fourth quarter due to the robust expansion in the tourism industry. The growth of other services sectors including hotels and restaurants, recreational services, medical and health services, and educational services also accelerated in the fourth quarter compared to the same period in the previous year. Meanwhile, industry growth at 5.8 percent was supported by the stronger growth in mining and quarrying, construction, and electricity, gas and water sectors. The turnaround in mining and quarrying from the 25.1-percent decline a year ago to the 27.7 percent expansion in Q4 2007 was due to the upsurge in gold mining and other non-metallic minerals, particularly coal. The higher production of coal can be attributed to the rising demand for coal both in the local and international market as an alternative fuel source following the rise in the cost of crude oil. Likewise, boosted by the growing demand for both residential and commercial space, construction posted a robust growth of 18.4 percent during the quarter. Favorable weather conditions during Q4 2007 boosted growth in agriculture, fishery and forestry (AFF), which accelerated to 5.8 percent from 1.7 percent in the same quarter in the previous year. Growth in AFF during the period, which accounted for 18.3 percent of total GDP, was driven by the palay, other crops, fishery, corn, and banana subsectors.
Agriculture sustained its growth in Q4 2007 notwithstanding the destruction brought by typhoons that visited certain areas of the country during the quarter as a result of the ongoing La Niña phenomenon which started in August 2007. According to the DA, agricultural production will be supported by the anticipated rise in public spending on irrigation and other infrastructure, postharvest facilities, research and development (R&D), and agricultural extension work. The palay subsector surged by 10.1 percent in Q4
8.48.78.8Private services
8.48.49.0Services7.05.87.1Transport., Comm., & Storage8.110.910.7Trade
15.69.013.3Finance6.66.95.4O. Dwellings & real estate
-25.122.227.7Mining and quarrying4.83.72.5Manufacturing 7.618.518.4Construction4.58.410.6Electricity, gas and water
6.14.33.9Government services
8.6-1.68.4Forestry 1.75.85.8Agriculture and Fishery
2006
1.75.85.8Agriculture, Fishery & Forestry
3.66.65.8Industry
Q4
By industrial origin
Q3Q4
Source: NSCB
2007Sector
Economic PerformanceGrowth rate (in percent)
29
2007 from a decline of 2.0 percent in the same period of 2006, due to the sustained usage of hybrid and high quality inbred seed and favorable weather conditions. Corn continued to grow at 15.7 percent from 16.0 percent in the same quarter in the previous year as it benefited from the sustained rainfall and usage of open-pollinated varieties (OPV) and hybrid seeds through the DA-GMA Corn Program. Higher demand for yellow corn by seed millers was also noted in SOCCKSARGEN, Northern Mindanao, Davao, and Zamboanga Peninsula. Despite the favorable palay production, however, domestic rice prices increased sharply in Q1 2008, influenced partly by the surge in imported rice prices which are now at historic highs. Contributing further to the increase in domestic rice prices is the rise in farm gate prices of palay coming from the provinces, attributed to higher fertilizer, fuel, and irrigation costs. Amid rising international prices of rice and other agricultural products, the DA is pushing for a concerted effort by all sectors to sustain the growth momentum of the farm sector in 2008 and onwards in the face of looming downward supply trends following the recent tightening in global supply and surging prices of commodities. In particular, the DA is pushing for the introduction of productivity-enhancing technologies and the construction of irrigation and postharvest facilities to improve farm productivity in the medium term.

30
Labor Market Conditions Unemployment and underemployment rates continue to decline.
6.0
6.5
7.0
7.5
8.0
8.5
Q2 Q3 Q4 Q1 Q2 Q3 Q4 Q1 Q2 Q3 Q4 Q1
2006 2007 2008
Unemployment Rate
Based on the preliminary results of the January 2008 Labor Force Survey (LFS), the unemployment rate declined to 7.4 percent in January 2008 from its year-ago level of 7.8 percent.20 There were 33.7 million Filipinos employed in January out of approximately 36.4 million Filipinos in the labor force. Total employment grew by 0.4 percent year-on-year. The services sector employed 50.2 percent of the total employed population, while the agriculture and industry sectors accounted for 35.0 percent and 14.8 percent, respectively. The underemployment rate declined to 18.9 percent in January 2008 from 21.5 percent in the same period last year. Underemployed persons in agriculture accounted for 49.3 percent, services, 35.8 percent, and industry, 14.9 percent.21
II. MONETARY AND FINANCIAL CONDITIONS

31
Interest Rates
2
4
6
8
10
12
14
16
18
20
2000 2001 2002 2003 2004 2005 2006 2007 2008
91-day T-bill rate Overnight RRP Rate Bank Lending Rate (Low-end)
91-day T-bill rate, BSP RRP rate and KBs Lending RateIn percent
The benchmark 91-day T-bill rate averaged slightly lower in Q1 2008 at 3.673 percent from 3.706 percent in the previous quarter. Similarly, the average rates for the 182-day and 364-day tenors declined by 4.5 basis points and 20.5 basis points to settle at 4.670 percent and 5.384 percent, respectively. The lower yields for the 91-day and 182-day T-bills during the first quarter reflect the rates in January 2008 as there were no primary issuances for these tenors in February and March 2008. The Bureau of the Treasury (BTr) rejected the high bid rates during these two months, citing the stable cash position of the National Government (NG). Meanwhile, the average bank lending rate was almost unchanged at 7.9 percent in the first three months of 2008 compared to the previous quarter.
2
3
4
5
6
7
8
9
10
11
12
3Mo 6Mo 1Yr 2Yr 3 Yr 4Yr 5Yr 7Yr 10Yr 20Yr 25YrMaturity
Yiel
d in
per
cent
end Sep 2007end Dec 2007end March 2008
Yield of Government Securities in the Secondary Market In percent
Yield Curve Secondary market yields generally rose across all tenors by end-March 2008 from end-December 2007. The increase in the yields ranged from 24 basis points (25-year GS) to 88 basis points (7-year GS). The yield curve shifted upward on concerns of a prolonged slowdown in the US economy, and possibly the global economy, and the continued uptrend in international oil and food prices. The high inflation outturn during the first quarter of 2008 and worries about the possible knock-on effects on the Philippine economy of a US economic slowdown contributed to higher risk aversion.
Domestic interest rates decline in Q1 2008.
Yields in the secondary market rose during the quarter.

32
-400.0
-300.0
-200.0
-100.0
0.0
100.0
200.0
300.0
Mar 06 Jun 06 Sep 06 Dec 06 Mar 07 Jun 07 Sep 07 Dec 07 Jan 08
91-day T-bi ll vs US 90- day T-bil l (before tax) 91-day T-bil l vs US 90-day LIBOR (before tax)
91-day T-bi ll vs US 90- day T-bil l (after tax) 91-day T-bil l vs US 90-day LIBOR (after tax)
Interest Rate Differentials in basis points
0
1
2
3
4
5
6
7
8
2004 2005 2006 2007 2008
BSP RRP rate US Fed funds rate
BSP RRP Rate and US Fed Funds Rate In percent
Interest Rate Differentials The positive differentials between domestic and US T-bill rates, net of tax, widened during Q1 2008 with the decline in the US 90-day T-bill rate. Likewise, the after-tax differentials between domestic interest rates and US LIBOR widened compared to the previous quarter and turned positive. The differential between the BSP's policy interest rate (overnight borrowing or RRP rate) and the US federal funds target rate widened from 100 basis points in Q4 2007 to 275 basis points in Q1 2008 reflecting the 175-basis point net effect of the BSP's policy rate reduction of 25 basis points and the Fed's three consecutive policy rate cuts totaling 200 basis points during the quarter. Adjusted for the risk premium—which is measured by the differential between the 10-year Republic of the Philippines (ROP) note and the 10-year US Treasury note—the differential between the BSP’s policy rate and the US federal funds target rate widened and became positive (27 basis points) as of end-March 2008 compared to -94 basis points as of end-December 2007. The rise in interest rate differentials potentially attracts foreign exchange inflows.
Real lending rate declines during the quarter.
2.50
1.20
-1.20
-0.50
1.60
3.60
3.30
0.40
8.00
5.60
-2 0 2 4 6 8 10 12
Philippines
Japan
Singapore
Hong Kong
Thailand
Malaysia
South Korea
Taiwan
India
Indonesia
Average Real Lending Rates: Selected Asian Countries*In percent
The real lending rate--measured as the difference between the median bank lending rate and inflation--declined to 2.5 percent in Q1 2008 from 4.0 percent in Q4 2007. This was due mainly to higher inflation recorded in the first three months of 2008. Among a sample of 10 Asian countries, the Philippines' real lending rate ranked the fourth highest.
Interest rate differentials between Philippine and US rates widen.

33
Financial Market Conditions
Investor sentiment in domestic financial markets was bearish, with weaker trading reflecting investors’ cautious stance over global economic concerns, rising inflation pressures and local political noise. Meanwhile, the amount of oversubscription for T-Bills declined during the quarter.
500
1,000
1,500
2,000
2,500
3,000
3,500
4,000
2000 2001 2002 2003 2004 2005 2006 2007 2008
PSE Composite Index
Stock Market After registering an improvement in Q4 2007, the domestic stock market registered a downtrend in the first quarter of 2008, with the Philippine Stock Exchange Composite Index (PSEi) averaging (using monthly closing averages) 3,126.9 index points from the previous quarter’s 3,653.0 index points. Weaker trading in the local bourse reflected the investors’ cautious stance amidst rising inflationary pressures in the domestic market and the ongoing political noise. The continued concerns over the possibility of the US heading toward a sharper-than-expected slowdown also weighed down on investors’ confidence. The market is expected to continue to take its lead from external and domestic developments, particularly the economic condition in the US and the impact of global oil and non-oil commodity prices on inflation. Government Securities
Liquidity in the financial system continued to fuel demand for government securities as T-Bills continued to attract an excess of bids. However, the amount of oversubscription has moderated, from P16.4 billion in Q4 2007 to P7.2 billion in the first quarter of 2008. Likewise, average monthly oversubscriptions went down in Q1 2008 to P1.5 billion relative to the P3.2 billion recorded in the previous quarter. The T-Bill offerings were oversubscribed in January and February but were undersubscribed in March. During the quarter, the Bureau of the Treasury (BTr) granted only partial awards for most of the auctions, rejecting some or all bids for all tenors due to excessively high bids.
Demand for equities and government securities moderates, reflecting risk-aversion in the money market.
Stock market sentiment is cautious amid economic developments.
BTr auctions for GS continue to be oversubscribed.
0
20
40
60
80
100
120
140
2000 2001 2002 2003 2004 2005 2006 2007 2008
Oversubscription of T-bill AuctionsIn billion pesos

34
Debt spreads widen further on growing financial sector strains.
Sovereign Bonds and CDS Spreads Debt spreads widened to their highest levels for the year in Q1 2008 as the market digested recent economic developments in the US along with domestic political concerns. Although tensions in the financial market eased by mid-February on hopes that the Federal Reserve will continue to cut interest rates to avert a recession, weak US macroeconomic data, combined with further large-scale bank writedowns and concerns about financial guarantors, increased worries that the global financial stress will impact on the real economy.22 The spreads of ROP 2015 bonds over the benchmark 10-year US Treasury notes and CDS23 widened significantly in Q1 2008 relative to the previous quarter. As of end-March 2008, the ten-year ROP and CDS spreads in Q1 2008 widened to 263 basis points and 243 basis points, respectively, from 200 basis points and 153 basis points as of end-December 2007.
Banking System
Philippine banking system remains stable. The Philippine banking system remained stable during the quarter supported by adequate capital and improved balance sheets. Improving macroeconomic conditions helped keep the financial system afloat and resilient, readily able to meet the demands of a growing economy, and the challenges posed by the recent developments in regional and international financial institutions.

35
Banks’ deposit base increases.
Savings Mobilization The banking system’s deposit liabilities as of end-December 2007 continued to grow, posting an increase of 4.4 percent to P3.6 trillion from the year-ago level of P3.45 trillion. Demand and time deposits sustained year-on-year growth at 15.7 percent and 8.0 percent, respectively. However, savings deposits, which continued to account for almost half of the banks’ funding base, declined by 1.1 percent relative to the level a year ago. Compared to the end of the previous quarter, the banking system’s deposit liabilities rose by 3.5 percent in Q4 2007.
Lending Operations Outstanding loans of banks (net of reverse repurchase or RRP placements) expanded by 9.4 percent year-on-year in February 2008 compared to 5.4 percent during the same period last year. Lending to most sectors of the economy grew, led by utilities (81.4 percent); transportation, storage and communication (20.5 percent); financial institutions, real estate and business services (12.1 percent); and community, social and personal services (9.2 percent). Meanwhile, manufacturing continued to post deceleration in lending growth to 2.4 percent compared to a similar decline of 0.9 in the previous year. Gross of banks’ RRP placements with the BSP, bank lending grew by 4.7 percent year-on-year in February. This was lower compared to the 9.3 percent expansion in December 2007 and the 8.4 percent growth recorded in the same month of the previous year and 7.9 percent in December 2007.
Consumer loans increase.
Meanwhile, the combined credit card receivables (CCRs) of universal and commercial banks (U/KBs) as well as thrift banks as of end-December 2007 increased by 16.5 percent year-on-year to reach P116.1 billion, and by 9.5 percent compared to the end of the previous quarter’s level of P106.0 billion. The ratio of CCRs to the total loan portfolio (TLP) at 5.4 percent stood higher than last year’s 5.2 percent, but slightly lower than the 5.5 percent recorded during the previous quarter. Of the total CCRs, 14.2 percent was past due, lower than the 16.4 percent recorded at end-December 2006.
Growth in bank lending continues.

36
Similarly, U/KBs’ and TBs’ combined auto loans as of end-December 2007 rose by 19.4 percent to P86.2 billion from P72.2 billion in December 2006, and by 3.8 percent from the end-September 2007 level of P83.0 billion. Auto loans accounted for 4.0 percent of TLP, higher than the same period in the previous year at 3.7 percent but lower than previous quarter’s 4.3 percent. Past due auto loans to total auto loans eased moderately to 5.1 percent from 5.2 percent in the previous year but remained at the same level compared to the previous quarter’s level. U/KBs' real estate loans (RELs) as of end-December 2007 declined minimally by 0.6 percent to P197.7 billion from its year-ago level of P198.9 billion but increased modestly by 2.7 percent compared to the previous quarter’s level of P192.6 billion. This resulted in a lower ratio of RELs to TLP at 10.4 percent compared to 11.5 percent in the previous year and 11.3 percent in the previous quarter. The majority or 97.2 percent of total RELs was held by U/KBs’ bank proper while the remaining 2.8 percent was accounted for by U/KBs’ trust department. Institutional Developments The total resources of the banking system rose by 5.3 percent to P5.248 trillion as of end-December 2007 from the year-ago level of P4.986 trillion. The increase was due mainly to the rise in cash, banks’ deposits with the BSP, and loans and discounts accounts. KBs continued to account for almost 90 percent of the total resources of the banking system.
The number of banking institutions (head offices) fell further to 847 as of end-December 2007 from the year ago level of 862 and quarter level of 852, reflecting continued consolidations and mergers, as well as the closure of weak banks. The total number of banking institutions was comprised of 38 KBs, 82 TBs and 727 rural banks (RBs). The banking system’s asset quality improved significantly with the non-performing loan (NPL) ratio at a record low of 4.9 percent as of end-December 2007 compared to 6.2 percent a year ago. The ratio was much closer to its pre-crisis level of around 3 to 4 percent owing to sustained asset disposals through SPV-related transactions and other alternative modes of asset cleanup. Compared with other countries in the region, the Philippine banking system’s NPL ratio of 4.9
Resources of the banking system rise.
Number of banks falls due to mergers and consolidations but operating network continues to expand.
Asset quality of banks continues to improve.

37
percent as of end-December was higher than Indonesia’s 4.6 percent, Malaysia’s 3.2 percent, Thailand’s 4.8 percent, and Korea’s 0.7 percent.24 The loan exposure of banks remained adequately covered as the banking system’s NPL coverage ratio remained steady at 81.6 percent as of end-December 2007, reflecting banks’ diligent compliance with the loan-loss provisioning requirements of the BSP to provide a buffer against unexpected losses. The banking system’s average capital adequacy ratios (CAR) as of end-September 2007 remained strong at 14.7 percent on solo basis and 15.7 percent on consolidated basis, which are both higher than the 10.0 percent required minimum ratio.25 The Philippines’ CAR remains comparatively higher than those of Thailand (14.8 percent), Malaysia (13.3 percent), and Korea (12.6 percent). Meanwhile, Indonesia posted the highest CAR in the region at 21.0 percent.26 SDA placements rose by P538.1 billion to P591.0 billion as of end-March 2008 from last year’s level of P53.0 billion. The more than tenfold increase in SDAs could be attributed to the policy measures implemented by the BSP in May last year, which allowed trust entities of BSP-supervised financial institutions to make placements in the SDA facility with the objective of managing liquidity. Meanwhile, the total volume of banks’ placements with the BSP under the RRP window amounted to P247.9 billion as of end-March 2007, lower by P59.9 billion than the year-ago level.
Placements under the BSP’s SDA facility increase.

38
Exchange Rate
35
40
45
50
55
60
2000 2001 2002 2003 2004 2005 2006 2007 2008
P/US$
Daily Peso-US Dollar Rate
The average peso-dollar exchange rate depreciated in March relative to the levels in the previous two months. On a year-to-date basis, the peso depreciated by 1.1 percent versus the US dollar in Q1 2008. The Indian rupee, the Thai baht, and the Korean won also depreciated while other Asian currencies strengthened versus the US dollar, led by the Japanese yen’s 13.0 percent appreciation.27 The peso depreciated as market uncertainty rose in February amid the turbulence in global financial markets. On 11 February, along with several Asian currencies, the peso28 depreciated after the Group of Seven (G7) industrialized countries issued a statement on 9 February that growth in all economies is expected to slow down in the short term amid downside risks, which include the further deterioration of the US residential housing markets, tighter credit conditions from prolonged difficulties in the financial markets, high oil and non-oil commodity prices, and heightened inflation expectations in several countries. While the peso and other regional currencies recovered in the latter part of February due to strong foreign inflows from investors seeking higher yields in emerging Asian markets (boosted by expectations of further interest rate cuts by the US Federal Reserve),29 risk aversion rose again in March as investors shifted away from emerging market assets due to concerns on the worsening global credit crisis as reflected by the sale of Bear Stearns, the fifth-largest investment bank in the US, to JP Morgan Chase. Moreover, despite the Federal Reserve’s cut in the target for the federal funds rate by 75 basis points on 18 March 2008, risk aversion remained high as the Fed noted in its accompanying statement that the financial markets are still under considerable stress, and the tightening of credit conditions and the deepening of the housing contraction are likely to weigh on US economic growth over the next few quarters. The developments in the global financial markets translated to the weakening of the peso to its lowest daily average for the review quarter on 31 March at P41.87/US$1.
Changes in Selected Dollar Rates
Appr ./ Depr. ( - ) Year - to - date
31 Mar 08 28 Dec 07 Philippine peso - 1.1 18.8
Thai baht (offshore) - 4.8 19.8 Chinese yuan 4.2 6.9 Malaysian ringgit 3.9 6.4 South Korean won - 5.6 - 0.6 Singaporean dollar 4.8 6.3
New Taiwan dollar 7.0 0.3 Indonesian rupiah 1.9 - 4.5 Japanese yen 13.0 5.3 Indian Rupee -1.3 12.2
The peso depreciates as of end-March 2008.

39
.
However, on a quarter-on quarter basis, the peso appreciated by 5.3 percent to average P40.95/US$1.30 On a year-on-year basis, the peso likewise appreciated by 18.7 percent. Volatility, as measured by the standard deviation of the daily exchange rates, decreased to P0.45 for the period 2 January – 31 March 2008 relative to the fourth quarter as the local currency moved against a tight range against the US dollar. On a real, trade-weighted basis, the peso lost some external price competitiveness in Q1 2008 against the baskets of currencies of major trading partners (MTPs) and competitor countries in the broad and narrow series. The nominal appreciation of the peso during the quarter coupled with the slight widening of the inflation differential translated to a quarter-on-quarter increase in the real effective exchange rate (REER) index of the peso by 3.6 percent and 5.2 percent against the baskets of currencies of MTPs and competitor countries in the broad series, respectively.31 Meanwhile, the REER of the peso increased quarter-on-quarter by 3.8 percent against the basket of currencies of competitor countries in the narrow series as the tightening of the inflation differential failed to offset the nominal appreciation of the peso during the quarter. On a year-on-year basis, the REER index of the peso increased by 13.4 percent, 17.0 percent and 16.5 percent against the baskets of currencies of MTPs and competitor countries in the broad and narrow series, respectively.
Going forward, the value of the peso will be affected by several factors. On the upside, the projected strong dollar inflows from OF

40
remittances, export earnings and foreign direct and portfolio investments could prop up the peso. A more diversified OF workers’ base is likely to sustain the growth in OF remittances and foreign direct and portfolio investments are expected to remain robust in 2008 given upbeat investors’ outlook on the economy’s performance. The country’s solid macroeconomic fundamentals amidst the current global financial market turbulence could also boost the peso. On the downside, domestic and global developments that encourage risk aversion on the part of investors could weaken the peso.

41
Monetary Aggregates
Domestic liquidity or M3 grew by 6.6 percent year-on-year in February 2008, slower than the 9.0 percent growth registered in December 2007.32 This was also lower than the 22.0 percent expansion recorded during the same month a year ago. The slowdown in the growth of domestic liquidity can be traced to both the decline in net domestic assets (NDA) and the slowdown in the growth of net foreign assets (NFA). NFA grew by 16.7 percent in February, compared to the 19.5 percent year-on-year growth in December 2007. This developed as a result of the decline in the net foreign assets of other depository corporations.
Credit extended to the private sector sustained its expansion at 10.1 percent from the 7.2 percent growth posted in December 2007. Credit extended to the public sector also rose by 11.6 percent as lending to the national government (NG) picked up at 17.6 percent even as lending to local government units (LGUs) and other public entities continued to decline. However, NDA declined for the seventh consecutive month in February, as the Net Other Items account (which includes SDAs and RRPs) registered a negative balance, following the BSP’s implementation of liquidity management measures in May 2007. Year-on-year growth in reserve money, a narrower measure of monetary aggregates, declined to 10.7 percent as of end-February from 18.1 percent as of end-December 2007.33
Liquidity growth slows down.

42
National Government Fiscal PerformanceFirst Quarter 2008In billion pesos
January-March Percent Change
2008 Q1* Program
Program vs
Actual2008 2007
Surplus/(Def icit) -51.6 -52.0 -0.8 -60.2 8.7
Revenues 253.5 237.3 6.8 249.6 4.0
Expen ditures 305.1 289.3 5.5 309.8 -4.8
Source: BTR*The quarterly targets are sti ll subject to confirmation by the DBCC
The National Government (NG) posted a fiscal deficit of P51.6 billion for the first quarter of 2008, 0.8 percent lower than the P52.0 billion deficit in the same period last year. This was lower than the P60.2 billion program for the quarter. Exceeding the P249.6 billion target, revenue collections for January-March grew by 6.8 percent to P253.5 billion from P237.3 billion in the same period last year. Of this amount, the Bureau of Internal Revenue (BIR) and the Bureau of Customs (BOC) contributed P166.6 billion and P48.9 billion, as their collections grew by 16.4 percent and 21.5 percent, respectively. The Bureau of the Treasury (BTr) also contributed P17.1 billion, while other offices registered an income of P21.0 billion. Total expenditures for Q1 2008 reached P305.1 billion, 5.5 percent higher than the same period in 2007 but P4.8 billion lower than the program. Excluding interest payments, total disbursements increased by 2.4 percent to reach P100.2 billion from P89.1 billion in the same period in 2007. The NG recorded a deficit of P18.6 billion in March, 44.2 percent lower than the P33.4 billion deficit in the same period last year.
Fiscal Developments The NG’s fiscal deficit for Q1 2008 is lower than year-ago levels and program.
43
III. External Developments Global financial markets continued to experience volatility during the review period.
The US economy is set to grow below trend in 2008.
The financial market strains have started to be felt in the real sector, with indicators pointing to a slowing down of the US, Euro area, and Japanese economies. In contrast, emerging Asian economies continued to expand, although they too are vulnerable to the effects of weak global growth particularly if the duration of the slowdown becomes longstanding. Meanwhile, the sustained elevated levels of oil and non-oil commodity prices have pushed up inflation in most parts of the world. Meanwhile, Central banks are now faced with the challenge of striking an appropriate mix between fiscal stimulus, monetary tightening, and exchange rate policies in the face of the combined upward movement of oil and non-oil commodity prices and weakening economic growth. Weak data and increased uncertainty in the financial markets point to a soft US economy in the near term. Advanced estimates from the U.S. Bureau of Economic Analysis showed that Q4 2007 real GDP slowed sharply to 0.6 percent from the exceptionally strong growth of 4.9 percent in the previous quarter, reflecting the downturn in inventory investment and residential fixed investment.34 Further supporting the prognosis of below-trend growth in 2008 is the weak performance of the labor market, as this adds to the downward pressure on consumer spending, which has already been negatively affected by falling home prices. The unemployment rate rose and nonfarm payroll employment has declined in Q1 2008, reflecting the continued fall in employment in construction, manufacturing, and employment services.35

44
Consumer confidence also fell markedly during the quarter. The Conference Board Consumer Confidence Index, which had rebounded in December 2007, declined sharply in Q1 2008, with the March index falling to its lowest in 17 years at 64.5 index points. The Conference Board research center noted that “…consumers' outlook for business conditions, the job market and their income prospects is quite pessimistic and suggests further weakening may be on the horizon…”36 On price developments, headline inflation rose to an average of 4.2 percent in the first two months of Q1 2008 from 3.9 percent in the same period in the previous quarter, owing mainly to soaring energy and commodity prices. This has also put some upward pressure on core inflation, but this may be offset by soft economic activity, rising unemployment, and weak housing markets.

45
National accounts data showed that growth moderated to 0.4 percent in Q4 2007 following a 0.8 percent growth in the previous quarter. Year-on-year growth in Q4 2007 was 2.2 percent, slower than the 2.7 percent growth posted in the previous quarter. Survey indicators support this growth trend. The European Commission investment survey37 suggested a slowdown in investment growth, driven mainly by a decline in investment plans from the consumer goods sector and a slowdown in manufacturing investment. In the industrial sector, both the Purchasing Manager’s Index (PMI) and the European Commission’s industrial confidence indicator declined in February 2008, signaling a moderation in industrial activity observed from last year. On price developments, overall HICP inflation rose to 3.3 percent in the first two months of Q1 2008, from 2.9 percent in the same period in Q4 2007. This reflected the continued upward strong pressure from sharp increases in energy and commodity prices in recent months. As in the rest of the world, food prices have continued to be a major driver of overall HICP inflation. Meanwhile, core inflation has remained broadly stable over the recent months, although at a relatively higher level than in 2007, and would likely trend down in the near term due to the strength of the euro and a weaker economy.
Higher inflation and low growth characterize the Euro area economy in Q1 2008.

46
Japan’s GDP during Q4 2007 posted a stronger-than-expected growth of 0.9 percent quarter-on-quarter from 0.3 percent in Q3 2007.38 Year-on-year, the Japanese economy grew by 2.0 percent in Q4 2007 compared to 1.7 percent in the same period last year. Growth was supported mainly by strong domestic demand and exports to Asia. Nevertheless, the domestic economy has been slowing down in recent months, following the revision of the Building Standard Law in June 2007, which resulted in a significant drop in housing and corporate construction starts beginning in the second semester of 2007. Because of this, business and consumer sentiments have continued to deteriorate. The influential Bank of Japan Tankan survey showed that confidence among Japan's large manufacturers deteriorated sharply in Q1 2008 as a slowing U.S. economy, rising yen and higher energy and food prices undermine business conditions.39 The quarterly Tankan survey of manufacturing sentiment fell to 11 index points in March 2008 from 19 index points in December 2007. With regard to price developments, Japan’s inflation has been on an uptrend in Q1 2008, with inflation rising to an average of 0.9 percent in the first two months of Q1 2008 from an average of 0.5 percent in the same period in Q4 2007, due mainly to rising oil prices. Looking ahead, inflation is expected to rise, although gradually, given that asset prices have started to pick up, and energy prices are on an uptrend. However, due to the soft outlook on growth and wages, inflation is likely to taper off in the latter part of the year.
Japan’s leading indicators signal a slowdown in the near term.

47
Emerging Asian economies continue to expand but are set for an uneven ride as a result of weak global growth.
China’s Q4 2007 GDP growth stood at 11.2 percent year-on-year, slightly lower than the previous quarter’s 11.5 percent. Export growth lost momentum in Q4 2007 relative to the previous quarter. Meanwhile, inflationary pressures picked up further during the quarter, with headline inflation rising to an almost 12 year-high at 8.7 percent in March 2008. Headline inflation was mainly driven by the rise in food prices. Meanwhile, India’s recent monetary tightening, a stronger rupee, and a slowdown in the global economy have led to a somewhat slower GDP growth in Q3 2007 at 8.9 percent from 9.3 percent in Q2 2007. Inflation has been moderating, reflecting mainly the effects of the monetary tightening measures of the Reserve Bank of India (RBI) in recent months. For the rest of Asia, many analysts see that the region may not be able to decouple, as most of the countries, led by China, are vulnerable to an export-led slowdown. Meanwhile, the economies of Thailand, Korea, and the Philippines are the most vulnerable to high oil prices, while countries with weaker fundamentals as well as very open economies (e.g. Singapore) are highly exposed to a further weakening of the US economy. Nonetheless, emerging and developing markets in Asia would generally be more resilient today than in previous episodes of financial market volatility, given their high levels of international reserves, stronger public sector balance sheets, and improved macroeconomic management.

48
The US Federal Reserve eased policy settings by a total of 200 basis points in Q1 2008. During their unscheduled meeting on 22 January, the Federal Reserve made an emergency move to cut the target for the federal funds rate by 75 basis points, making it the first emergency rate reduction since 2001. The Fed further reduced interest rates during their scheduled meeting on 30 January by 50 basis points. During its latest meeting on 18 March 2008, the Federal Open Market Committee (FOMC) reduced its target for the federal funds rate by another 75 basis points to 2.75 percent, as the available set of information on economic activity showed that growth was slowing down and the tension in financial markets has increased. The FOMC noted that, “… the outlook for economic activity has weakened further…financial markets remain under considerable stress, and the tightening of credit conditions and the deepening of the housing contraction are likely to weigh on economic growth over the next few quarters.” On top of the monetary easing, the Fed announced an expansion of its securities lending program, which is intended to promote liquidity in the financing markets for Treasury and other collateral and is expected to give a boost to financial markets.
The Bank of England reduced its Official Bank Rate by a total of 50 basis points during the quarter, on deteriorating prospects for output growth and continuing disruptions in the global financial markets. Meanwhile, as of their latest policy meetings in March or early April 2008, monetary policy settings were maintained in Asia (Indonesia, Thailand, South Korea, Malaysia, India and Japan), New Zealand, Australia and the Euro region. Meanwhile, only Taiwan in Asia increased its policy rates, while Chile and Colombia in Latin America and several Eastern European countries tightened monetary policy settings on concerns over rising inflationary pressures from rising energy and food prices.
The US Fed eases monetary policy settings aggressively while most major central banks remain on hold.
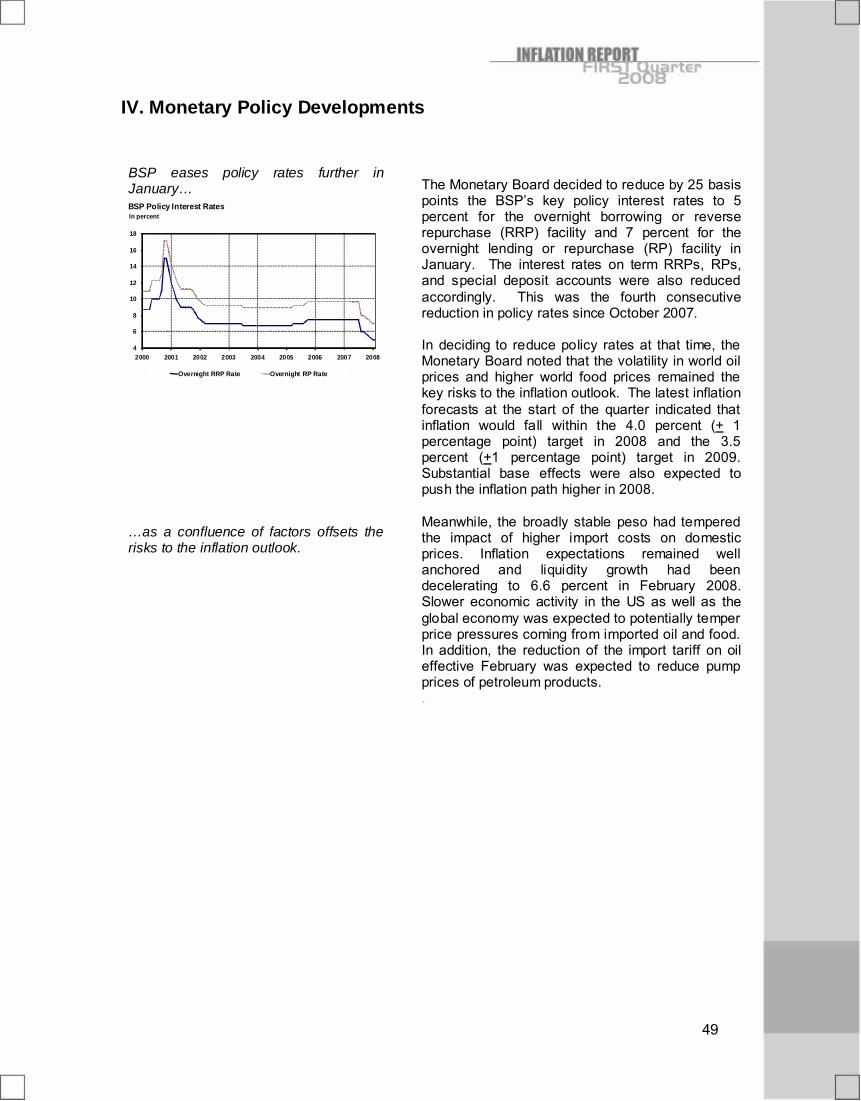
49
IV. Monetary Policy Developments
4
6
8
10
12
14
16
18
2000 2001 2002 2003 2004 2005 2006 2007 2008
Overnight RRP Rate Overnight RP Rate
BSP Policy Interest RatesIn percent
The Monetary Board decided to reduce by 25 basis points the BSP’s key policy interest rates to 5 percent for the overnight borrowing or reverse repurchase (RRP) facility and 7 percent for the overnight lending or repurchase (RP) facility in January. The interest rates on term RRPs, RPs, and special deposit accounts were also reduced accordingly. This was the fourth consecutive reduction in policy rates since October 2007. In deciding to reduce policy rates at that time, the Monetary Board noted that the volatility in world oil prices and higher world food prices remained the key risks to the inflation outlook. The latest inflation forecasts at the start of the quarter indicated that inflation would fall within the 4.0 percent (+ 1 percentage point) target in 2008 and the 3.5 percent (+1 percentage point) target in 2009. Substantial base effects were also expected to push the inflation path higher in 2008. Meanwhile, the broadly stable peso had tempered the impact of higher import costs on domestic prices. Inflation expectations remained well anchored and liquidity growth had been decelerating to 6.6 percent in February 2008. Slower economic activity in the US as well as the global economy was expected to potentially temper price pressures coming from imported oil and food. In addition, the reduction of the import tariff on oil effective February was expected to reduce pump prices of petroleum products. .
BSP eases policy rates further in January…
…as a confluence of factors offsets the risks to the inflation outlook.

50
The BSP takes a neutral monetary policy stance in March. Supply-side factors driving inflation are best addressed via non-monetary measures.
During its subsequent meeting in March, the Monetary Board decided to keep the BSP’s key policy interest rates at 5 percent for the overnight borrowing or reverse repurchase (RRP) facility and 7 percent for the overnight lending or repurchase (RP) facility. The interest rates on term RRPs and RPs were also left unchanged. In its assessment, the Monetary Board observed that the outlook for inflation in 2008 was influenced by elevated prices of global food and energy products. Since the key risks to the outlook for the remainder of the year were linked to imported oil and non-oil commodity prices, the Monetary Board concluded that these risks could be best addressed by non-monetary measures. These include keeping a close watch on the trends in the global commodities market, coordinating closely with concerned government agencies involved in monitoring prices and ensuring the adequate supply of commodities, and careful communication of the inflation outlook. The Monetary Board also decided to implement immediately the following refinements in the Special Deposit Account (SDA) facility: (1) the closure of existing windows for the two-, three-, and six-month tenors; and (2) the reduction of the interest rates on the remaining tenors. These refinements in the SDA facility will ensure that banks’ loanable funds remain adequate to meet the requirements of the expanding economy. Encouraging banks to lend more will help sustain the strengthening of most demand indicators and will be consistent with the forecast for continued strong economic activity.
During the quarter, the BSP continued to be attentive to possible second-round effects from supply shocks and to ensure that inflation expectations were well-anchored in order to achieve the Government’s inflation targets.

51
V. INFLATION OUTLOOK Private Sector Economists’ Inflation Forecasts
2.0
2.5
3.0
3.5
4.0
4.5
5.0
5.5
6.0
6.5
7.0
2006 Q4 2007 Q1 2007 Q2 2007 Q3 2007 Q4 2008 Q1
Mean Inflation Forecasts by Private Sector Economists/AnalystsIn percent
2008
2009
41.4
29.8
0.0
5.0
10.0
15.0
20.0
25.0
30.0
35.0
40.0
45.0
<0 1.0-2.0 2.1-3.0 3.1-4.0 4.1-5.0 5.1-6.0 6.1-7.0 7.1-8.0 8.1-9.0 9.1-10.0 >10.0
2008 2009
Probability Distribution For Analysts' Inflation Forecasts* 2008 and 2009
*Probability distributions were averages of those provided by 10 respondents. (Source: B SP Survey)
Private Sector Forecasts for InflationAnnual Percent Change
2008 2009ATR Kim Eng Securities 3.5 3.5Banco de Oro 3.5 3.5Bank of America 5.0 3.5Citigroup 4.5 3.5Deutsche Bank 5.5 4.5Development Bank of Singapore 5.0 2.7HSBC 5.0 4.8IDEA 5.0 5.6ING Bank 4.9 3.8Lehman Brothers 6.0 6.5Metrobank 5.8 -Philippine Equity Partners 5.5 4.3RCBC 5.0 4.0
Median Forecast 5.0 3.9Mean Forecast 4.9 4.2High 6.0 6.5Low 3.5 2.7Number of observations 13 12
Memo Item:Government Target 4.0±1.0 3.5±1.0
Inflation
Results of the first quarter survey on inflation forecasts40 showed higher inflation expectations for both 2008and 2009. The mean inflation forecast for 2008 was higher at 4.9 percent compared to the previous quarter’s 3.9 percent. Upside risks to inflation are expected to come mainly from high prices of fuel and other major commodity prices. In addition, possible increases in electricity and wages in the second half of the 2008 may also put upward pressure on prices. However, analysts noted that the strong domestic currency and the expected surge of foreign exchange inflows in the coming quarters are considered downside risks to domestic inflation. For 2009, the survey showed a slightly higher mean inflation forecast of 4.2 percent, compared to the previous quarter’s 4.1 percent. Based on the probability distribution of respondents’ forecasts, 10 out of 13 respondents indicated that there is a 41.4-percent chance that inflation will be within 5.1-6.0 percent, higher than the 4.0 percent (±1.0 percentage point) target for 2008. Consistent with the survey conducted by the BSP, the Asia Pacific Consensus Forecasts41 for Philippine inflation also showed rising expectations as of April 2008 relative to a quarter ago. Inflation for 2008 is now forecast at 5.1 percent from 3.5 percent in January 2008, while 2009 inflation is forecast at 4.2 percent from 3.6 percent in the same month.
Private sector forecasts are higher for 2008 and 2009.

52
Inflation Forecasts Emerging baseline forecasts show that depending on the movements in oil and non-oil commodity prices, inflation could settle above the 2008 inflation target range but will be within the 3.5 percent ± 1.0 percentage point target range for 2009
The emerging baseline forecasts indicate an elevated inflation path over the policy horizon. Compared with the outlook in the previous Inflation Report and depending on the outcome of near term movements of price, the current inflation outlook shows a hump-shaped path that could settle above the target range for 2008, while trending within the inflation target range for 2009. The upward shift in the inflation path was due largely to the effect of high actual inflation outcomes in the first quarter of 2008, the elevated price of oil, and more robust economic expansion. The forecast inflation is expected to fall within the 2009 inflation target range, supported by modest domestic demand despite the impact of a global economic slowdown, moderate liquidity growth, expectations of adequate domestic food supply, and the continued broad stability of the peso. Demand Conditions Domestic demand conditions strengthened. Real GDP grew by 7.3 percent in 2007 compared to 5.4 percent in the previous year. This growth was supported by the broadening expansion of all production sectors and, on the expenditure side, by the increase in investments and stable consumption growth. Other demand indicators showed similar strengthening in early 2008, including the sales of electricity and appliances, lower office and residential vacancy rates, rise in rental rates, increase in land values and a tempered rise in land values in the next two years. Meanwhile, sales of vehicles continued to increase although at a slower pace compared to a year ago. Consumer confidence also improved after its downturn in the fourth quarter of 2007. However, the lower, albeit positive, index points for business confidence indicated expectations of a slowdown in business activity.

53
Supply Conditions Agriculture output sustained its growth in 2007 despite weather disturbances and the volatility of prices of raw materials in the world market. The dry spell and typhoons over the past year dampened production in selected areas of the country but, overall, the farm sector still grew by 5.1 percent in 2007. According to the Department of Agriculture, agricultural production in 2008 will be supported by the anticipated rise in public spending on irrigation and other infrastructure, postharvest facilities, research and development (R&D), and agricultural extension work. The outlook for palay and corn production for the first half of 2008 remains favorable. Apart from the expected increase in infrastructure spending to support farming-related activities, the Government is set to expand the coverage of the quick turnaround (QTA) program which has helped offset the effects of the dry spell in selected provinces, intensify the provision of hybrid and certified seeds, and introduce productivity-enhancing technologies. Both spot and futures prices of oil in the international market surged in 2007 and Q1 2008 due to geopolitical tensions in the Middle East, refinery bottlenecks, dwindling oil inventories, growing world oil demand, OPEC’s decision to keep production quotas unchanged, and a weaker US dollar which also prompted speculative fund buying. Electricity rates in Metro Manila were also higher in March 2008 relative to the previous month as Meralco raised its generation charge by almost P0.20/kwh due to a spike in the average price in the WESM in February.

54
Output Gap Estimates The balance of demand and supply conditions, as captured by the output gap (or the difference between actual and potential output) provides an indication of potential inflationary pressures in the near term. Inflation tends to rise (fall) when demand for goods and services exert pressure on the economy’s ability to produce goods and services, i.e., when the output gap is positive (negative). Based on the revised GDP data, preliminary estimates yielded an output gap of 4.2 percent in Q4 2007. It represents an increase from the 3.6 percent reading in Q3 2007. The rise in the output gap amid the record high expansion in output in Q4 2007 could indicate possible demand pressures that may contribute to higher inflation.
Inflation expectations Expectations of future inflation from the results of the BSP’s latest survey among the private sector economists/analysts were higher for 2008 and 2009 compared to the previous survey. Household respondents from the Consumer Expectations Survey (CES) and firm respondents from the Business Expectations Survey (BES) indicated similar expectations of an increase in the prices of goods and services over the next twelve months and the next quarter, respectively.
Consistent with survey results, the term premiums or the secondary market yield differentials between long-term government securities and the 1-year tenor are on an uptrend, indicating relatively higher inflation expectations. The differentials between the yields of the 5-,7- and 10-year tenors and the 1-year tenor rose on 31 March 2008 relative to 31 December 2007 from 37 basis points to 74 basis points, 47 basis points to 99 basis points and 92 basis points to 123 basis points, and, respectively.

55
Key assumptions for the inflation forecasts indicate increased risks.
The BSP’s baseline inflation forecasts as of 5 March 2008 indicate a generally higher path over the policy horizon relative to the previous quarter’s estimates. The BSP’s forecasts42 were based on the following assumptions:
a. Real GDP growth of 6.7 percent in 2008 and 6.8 percent in 2009;43
b. Balanced National Government budget in
2008 and 2009; c. Headline overnight RRP rate of 5.0 percent
from March 2008 to December 2009; d. 91-day T-bill rate of 3.8 percent for 2008
and 4.1 percent for 2009;44 e. International crude oil prices which are
consistent with the latest BSP projections (as of 5 March 2008, based on estimated future prices) of US$93.29 per barrel for 2008 and US$93.04 per barrel for 2009;
f. Increase in nominal wage of 6.9 percent in
2008 and 6.5 percent in 2009; and
g. Endogenously determined exchange rate in the BSP’s Multi-Equation Model through purchasing power parity and interest rate parity relationships.

56
Risks to the Inflation Outlook Significant near-term upside risks to inflation include the continued volatility of oil prices and the uptrend in the global prices of non-oil commodities. Additional upside risks could come from a possible increase in utility rates and transport fares, wage adjustments, and a modest build-up in domestic demand. On the other hand, downside risks such as the weakening in domestic demand due to global economic slowdown could ease inflationary pressures.
The risks to the inflation outlook over the policy horizon may be presented graphically through a fan chart. The fan chart depicts the probability of different inflation outcomes based on the central projection (corresponding to the baseline forecast of the BSP) and the risks surrounding the inflation outlook. The current fan chart depicts an elevated inflation path relative to that of the previous quarter, particularly in the first year of the policy horizon. This reflects mainly the impact of the higher-than-projected inflation outturns for Q1 2008 and the higher price fluctuations in the world markets of oil and food commodities. The central projection is expected to accelerate in Q2 and Q3 of 2008 due to base-year effects of low inflation during the same period in 2007 and the impact of the La Niña episode which is incorporated as a slowdown in agricultural output during the quarter. The central projection is expected to decelerate in the second half of 2008 on the back of a more favorable outlook for agricultural production and moderate liquidity growth which helps temper inflationary pressures from increases in world prices of both oil and non-oil commodities. This outlook is subject to some uncertainty as depicted by the widening bands of the fan chart over time. Upside risks to the projected inflation path continue to dominate downside risks as illustrated by the wider bands above the central projection compared to those below it. The main risks to the inflation outlook consist of the elevated world oil price assumptions; the uptrend in food commodity prices; further adjustments in wages; resulting increases in transport fares; and cost-push pressures in utility rates. On the other hand, there are downside risks which could come from the modest growth of domestic liquidity, broad stability of the peso, and the possibility of a downside impact of the global economic slowdown on domestic demand.

57
Latest Inflation Profile
The fan chart shows the probability of various outcomes for inflation over the forecast horizon. The darkest band depicts the central projection, which corresponds to the BSP’s baseline inflation forecast. It covers 25 percent of the probability. Each successive pair of bands is drawn to cover a further 25 percent of probability, until 75 percent of the probability distribution is covered. The bands widen (i.e. “fan out”) as the time frame is extended, indicating increasing uncertainty about outcomes. The band in wire mesh depicts the inflation profile as of Q4 2007.
International prices of oil shift significantly upward due to low surplus capacity and rising world oil consumption. Future prices of oil will depend on the outcome of the planned investments in capacity as well as on the impact of a global slowdown in oil consumption.
Futures prices of oil in the international market continued to rise. According to the US Energy Information Administration (EIA), the global oil market remains fundamentally tight entering the second quarter, despite a slowdown in US oil consumption and growing risks to global economic growth. Rising world oil consumption and low surplus production capacity are putting upward pressure on oil prices, while speculative investment in commodities is keeping oil prices volatile.45 OPEC’s 5 March 2008 decision to keep production quotas unchanged has also driven prices upward.46
Moving forward, EIA and IMF projections point to the global oil market balance remaining tight over the next two years.47
Upside risks to prices include the possibility of supply shocks, heightened geopolitical tensions, and delays in planned capacity expansion. Meanwhile, downside pressures on prices could

58
come from a sharp slowdown in world economic growth which could cut into global oil consumption. In the domestic oil market, the import tariff on specific crude and refined petroleum products was lowered to one percent effective 1 April from two percent in March. The Department of Finance (DOF) estimates that a one-percentage point reduction in the import tariff leads to a P0.23/liter decline in the pump prices of petroleum products. This could help mitigate the impact of high world oil prices and translate to downside pressures on consumer prices. The Food and Agriculture Organization (FAO) noted that global prices of agricultural commodities remain high and could still increase moving forward. While the significant expansion in plantings of wheat suggests downward pressure on wheat prices this year, rice prices are likely to be volatile in the coming months. The reasons for this include: (1) the potential shift in production towards more profitable crops, (2) dwindling inventories of major rice trade players, and (3) policy changes such as export restrictions in key rice-producing countries. Strong demand for maize and sorghum in Europe, limited supplies of barley and feed grains, and uncertainty about growth prospects for the coarse grains sector and the global economy as a whole, have kept spot and futures prices in the coarse grains market very volatile. Part of the uncertainty about global food prices may also be tied to world oil prices, given that petroleum products are used for transporting agricultural produce and that major crops are utilized for biofuel production.
Global and domestic prices of agricultural commodities are on an uptrend and could rise further.

59
The continued increase in domestic rice prices in recent weeks is also due to the rise in fertilizer prices by up to 150 percent, reduced supply coming from the major producing regions following the end of the harvest season, and possible hoarding. However, the government is implementing some measures to stabilize rice prices such as increasing the NFA’s rice buffer stock by importing from the US and Vietnam, and initiating “supervised selling” of rice starting April 2008. With the possible approval by the ERC of Meralco’s petition to retrieve under-recoveries from lifeline subsidies, Meralco’s electricity rate could increase by P0.40 per kilowatt hour over a one-year period. Also, Meralco will increase its distribution charge starting this year by P0.08/kwh under the performance-based rate (PBR) application. The rate increase will be implemented as soon as the ERC approves the new rate schedule filed by Meralco in the first week of January 2008. The succeeding increases from 2009 to 2011 will average P0.10/kwh. Other upside risks include higher transmission charges related to Meralco’s petition to recover advances made to TransCo and the latter’s petition before the ERC to recover typhoon-related losses incurred in 2006; and the readjustment in the WESM settlement price following the ERC ruling on the price manipulation issue. Downward pressures on power rates could stem from PSALM’s prepayment of NPC’s loan obligations; the potential shift in power use to off-peak periods with the implementation of the time-of-use scheme; the provision of preferential generation rates to PEZA-accredited industrial users; and the possible implementation of the open access system for ecozones.
Additional price pressures could come from possible adjustments in utility rates, wages, and transport fares.

60
The elevated price of domestic oil combined with higher food and non-fuel prices could encourage petitions for wage and transport fare hikes. The monthly pay of all civilian government employees as well as the base pay of uniformed and military personnel is expected to increase by 10 percent effective 1 July 2008, according to the Department of Budget and Management (DBM). For the private sector, the RTWPBs have already commenced wage reviews for this year. Among the petitions that will be considered by the regional wage boards are the petitions filed by the TUCP for across-the-board increases of P80, P50, and P100 in the daily minimum wages in the NCR, Region VI, and Region X, respectively. In addition, proposals for a legislated wage increase of P125 for private sector employees and salary adjustments for public sector employees via SSL III remain pending with Congress. In the transport sector, a provisional increase of P0.50 in the minimum fare for jeepneys in NCR, Region III, and Region IV may be implemented by June 2008 but the petitions filed by jeepney operators in December 2007 seeking a P1.00-P1.50 increase in the minimum fare for Metro Manila remain pending with the LTFRB. Meanwhile, bus operators in Metro Manila revived the petition they earlier withdrew for a fare increase and provincial operators submitted a new petition. Taxi operators are also expected to submit their formal request for a P10.00 increase in the flag down rate.
61
VI. IMPLICATIONS FOR THE MONETARY POLICY STANCE
The inflation environment in the next few months is expected to be challenging if the prices of oil and non-oil products continue to be elevated. Global financial market turbulence poses downside risks to Philippine economic growth…
Depending on the movements in oil and non-oil commodity prices, the BSP’s baseline inflation forecasts indicate that inflation could settle above the 2008 inflation target range but within the 3.5 percent ± 1.0 percentage point target range for 2009. The recent surge in global food prices by 55.6 percent in Q1 2008 relative to Q1 2007 and the resulting increases in domestic food inflation and on headline inflation exemplifies how significant the influence of food prices could be on general price pressures in the economy. The factors driving inflation are still coming mostly from the supply side, and the use of monetary instruments against such influences may have less effect compared with direct supply-side intervention. Factoring in the impact of the recent supply shocks, forecasted inflation for 2008 and 2009 remain within the supply shock-adjusted targets. It is worth noting that inflation pressures are also evident in other countries. Economies around the world experienced higher inflation outturns in Q1 2008. At the same time, global financial markets have continued to be volatile since the BSP’s previous policy meeting in March, and remain vulnerable to further shocks. Equity prices have declined in Asia and across the globe, reflecting increased risk aversion. In the Philippines, the buoyancy of domestic demand, based on latest readings on various demand indicators, has been strong but not excessive. Against a background of slower global growth and greater risk aversion, the Philippine economy could be affected via a slowdown in remittances, lower investments, and weaker external demand for exports. Nevertheless, the balance of risks to prices is tilted toward the upside and there are some indications of demand-side inflation pressures setting in. Core inflation has drifted upward, with the March 2008 reading at its highest level since November 2006. Inflation expectations are now relatively higher, based on information from consumer, business and analyst surveys and term spreads. In addition, the recent requests for wage and transport fare increases have raised the risk of second-round effects.
…but the balance of risks to inflation is tilted to the upside.

62
While the balance of risks to the inflation outlook is tilted to the upside, price movements could return to manageable levels over the policy horizon as supply responses come on stream and prospects of a prolonged global economic slowdown moderate demand pressures. [Subsequently, in April, the Monetary Board decided to keep the BSP’s key policy interest rates at 5 percent for the overnight borrowing or reverse repurchase (RRP) facility and 7 percent for the overnight lending or repurchase (RP) facility.]

63

64

65
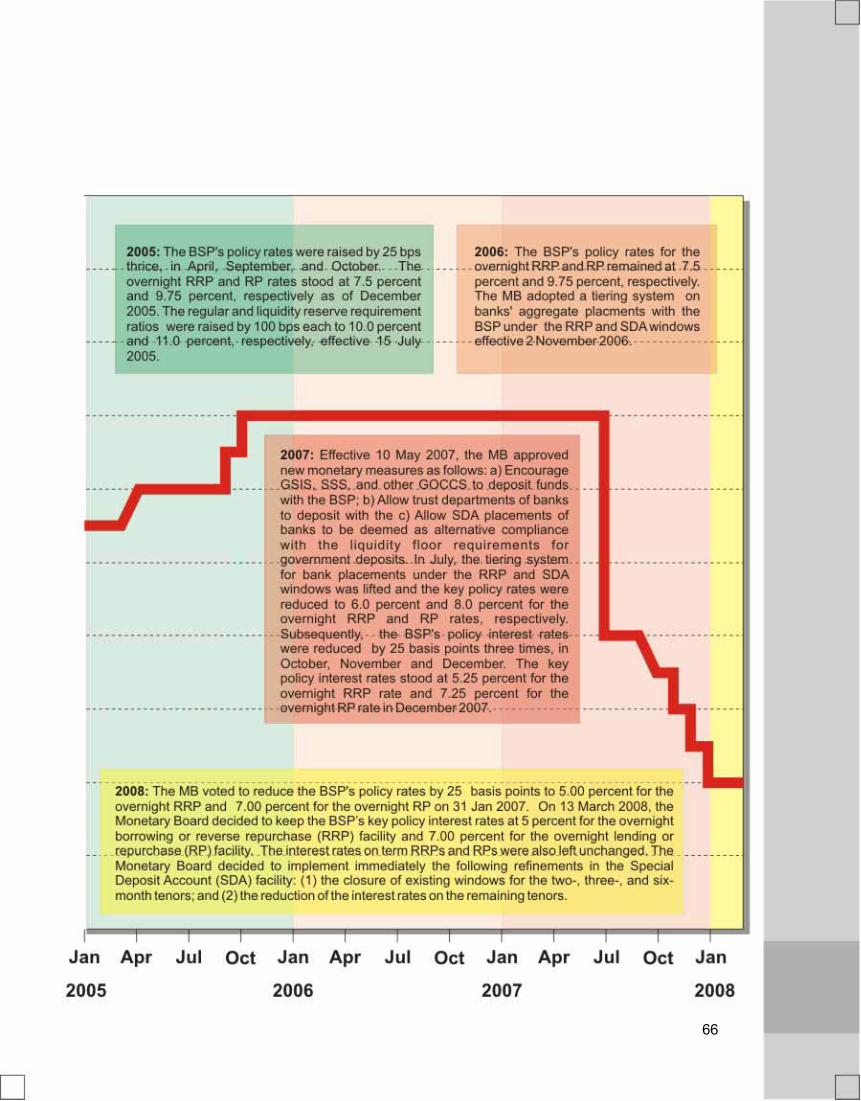
66

64
The BSP Inflation Report is published every quarter by the Bangko Sentral ng Pilipinas. The report is available as a complete document in pdf format, together with other general information about inflation targeting and the monetary policy of the BSP, on the BSP’s website:
www.bsp.gov.ph/monetary/inflation.asp If you wish to receive an electronic copy of the latest BSP Inflation Report, please send an e-mail to [email protected]. The BSP also welcomes feedback from readers on the contents of the Inflation Report as well as suggestions on how to improve the presentation. Please send comments and suggestions to the following addresses:
By post: BSP Inflation Report
c/o Department of Economic Research Bangko Sentral ng Pilipinas
A. Mabini Street, Malate, Manila Philippines 1004
By e-mail: [email protected]