Foreword - Bangko Sentral Ng Pilipinas · 2016-08-22 · i Foreword The primary objective of...
59
Transcript of Foreword - Bangko Sentral Ng Pilipinas · 2016-08-22 · i Foreword The primary objective of...


i
The primary objective of monetary policy is to promote a low and stable rate of inflation conducive to a balanced and sustainable economic growth. The adoption in January 2002 of the inflation targeting
framework for monetary policy was aimed at helping to fulfill this objective. One of the key features of inflation targeting is greater transparency, which means greater disclosure and communication by the BSP of its policy actions and decisions. This Inflation Report is published by the BSP as part of its transparency mechanisms under inflation targeting. The objectives of this Inflation Report are: (i) to identify the risks to price stability and discuss their implications for monetary policy; and (ii) to document the economic analysis behind the formulation of monetary policy and convey to the public the overall thinking behind the BSP’s decisions on monetary policy. The broad aim is to make monetary policy easier for the public to understand and enable them to better monitor the BSP’s commitment to the inflation target, thereby helping both in anchoring inflation expectations and encouraging informed debate on monetary policy issues.
The government’s target for annual headline inflation under the inflation targeting framework has been set at 3.0 percent ± 1.0 percentage point (ppt) for 2016-2018 by the Development Budget Coordination Committee (DBCC). This is consistent with the desired disinflation path over the medium term, favorable trends in inflation dynamics, and expected higher capacity of the economy for growth under a low inflation environment.
The report is published on a quarterly basis, presenting an analysis of the various factors affecting inflation. These include recent price and cost developments, inflation expectations, prospects for aggregate demand and output, labor market conditions, monetary and financial market conditions, fiscal developments, and the international environment. An entire section is devoted to a discussion of monetary policy developments in the most recent quarter, while a separate section provides a comprehensive analysis of the BSP’s view of the inflation outlook for the policy horizon.
The Monetary Board approved this Inflation Report at its meeting on 14 July 2016.
Foreword
AMANDO M. TETANGCO, JR. Governor
ii
The BSP Mandate
The BSP’s main responsibility is to formulate and implement policy in the areas of money, banking and credit, with the primary objective of maintaining stable prices conducive to a balanced and sustainable economic growth in the Philippines. The BSP also aims to promote and preserve monetary stability and the convertibility of the national currency.
Monetary Policy Instruments The BSP’s primary monetary policy instrument is its overnight reverse repurchase (RRP) or borrowing rate. Other instruments to implement the desired monetary policy stance to achieve the inflation target include (a) increasing/decreasing the reserve requirement; (b) conducting auctions for the term deposit facility (TDF);1 (c) adjusting the rediscount rate on loans extended to banking institutions on a short-term basis against eligible collateral of banks’ borrowers; and (d) outright sales/purchases of the BSP’s holdings of government securities.
Policy Target The BSP’s target for monetary policy uses the Consumer Price Index (CPI) or headline inflation rate, which is compiled and released to the public by the National Statistics Office (NSO). The policy target is set by the Development Budget Coordination Committee (DBCC)2 in consultation with the BSP. The inflation target for 2016-2018 is 3.0 percent ± 1.0 ppt.3
BSP’s Explanation Clauses
These are the predefined set of acceptable circumstances under which an inflation-targeting central bank may fail to achieve its inflation target. These clauses reflect the fact that there are limits to the effectiveness of monetary policy and that deviations from the inflation target may sometimes occur because of factors beyond the control of the central bank. Under the inflation targeting framework of the BSP, these exemptions include inflation pressures arising from: (a) volatility in the prices of agricultural products; (b) natural calamities or events that affect a major part of the economy; (c) volatility in the prices of oil products; and (d) significant government policy changes that directly affect prices such as changes in the tax structure, incentives, and subsidies.
1 The TDF was introduced under the interest rate corridor system which was implemented on 3 June 2016. 2 The DBCC, created under Executive Order (E.O.) No. 232 dated 14 May 1970, is an inter-agency committee tasked primarily to formulate the National Government's fiscal program. It is composed of the Office of the President (OP), Department of Budget and Management (DBM), National Economic and Development Authority (NEDA), and the Department of Finance (DOF). The BSP attends the Committee meetings as a resource agency. 3 The inflation range target for 2015-2018 was announced thru DBCC Resolution No.2015-1 dated 27 January 2015. The decision to maintain the inflation range target for 2016-2018 was announced thru DBCC Resolution No.2015-7 dated 29 December 2015.
The Monetary Policy of the Bangko Sentral ng Pilipinas

iii
The Monetary Board
The powers and functions of the BSP, such as the conduct of monetary policy and the supervision over the banking system, are exercised by its Monetary Board, which has seven members appointed by the President of the Philippines. The Monetary Board holds eight (8) monetary policy meetings in a year to review and decide on the stance of monetary policy.
Chairman & Governor
Amando M. Tetangco, Jr.
Members
Cesar V. Purisima
Alfredo C. Antonio
Felipe M. Medalla
Armando L. Suratos
Juan D. De Zuñiga, Jr.
Valentin A. Araneta
The Advisory Committee
The Advisory Committee was established as an integral part of the institutional setting for inflation targeting. It is tasked to deliberate, discuss, and make recommendations on monetary policy to the Monetary Board. Like the Monetary Board, the Committee meets eight times a year but may also meet between regular meetings, whenever deemed necessary.
Chairman & Governor
Amando M. Tetangco, Jr.
Members
Diwa C. Guinigundo Deputy Governor
Monetary Stability Sector
Nestor A. Espenilla, Jr. Deputy Governor
Supervision and Examination Sector
Ma. Ramona GDT Santiago Assistant Governor
Treasury Department
Francisco G. Dakila, Jr. Managing Director
Monetary Policy Sub-sector

iv
Technical Staff
Head
Zeno Ronald R. Abenoja Director, Department of Economic Research
Members
Edna C. Villa Managing Director, Office of the Governor
Veronica B. Bayangos
Director, Center for Monetary and Financial Policy
Lorelei S. Fernandez Chief Dealer, Treasury Department
Rosabel B. Guerrero
Director, Department of Economic Statistics
Dennis D. Lapid Deputy Director, Department of Economic Research
Dennis M. Bautista
Deputy Director, Department of Economic Research
Ma. Mediatriz M. Boelsch Assistant Chief Dealer, Treasury Department
Thea Josefina Natalia W. Santos
Deputy Director, Capital Markets Specialist Group
Jose Recon S. Tano Deputy Director, Financial Supervision Research and Consumer Protection Sub-sector
Lara Romina E. Ganapin
Bank Officer V, Department of Economic Research
Cherrie F. Ramos Bank Officer V, Department of Economic Research
Jasmin E. Dacio
Bank Officer V, Department of Economic Research
Eduard Joseph DP Robleza Bank Officer V, Department of Economic Research
Vanessa T. Españo
Bank Officer V, Department of Economic Research
Marites B. Oliva Bank Officer V, Center for Monetary and Financial Policy

v
2016 Schedule of Monetary Policy Meetings, Inflation Report Press Conferences and Publication of MB Highlights
2016 Advisory
Committee Meeting
Monetary Board Meeting
Publication of MB Highlights
Inflation Report Press
Conference
Jan 14 (Thu) (17 Dec 2015 MB)
22 (Fri)
(Q4 2015 IR)
Feb 5 (Fri) 11 (Thu)
Mar 18 (Fri) 23 (Wed) 10 (Thu) (11 Feb 2016 MB)
Apr 21 (Thu) (23 Mar 2016 MB)
22 (Fri) (Q1 2016 IR)
May 6 (Fri) 12 (Thu)
Jun 17 (Fri) 23 (Thu) 9 (Thu) (12 May 2016 MB)
Jul 21 (Thu) (23 Jun 2016 MB)
22 (Fri) (Q2 2016 IR)
Aug 5 (Fri) 11 (Thu)
Sep 16 (Fri) 22 (Thu) 8 (Thu) (11 Aug 2016 MB)
Oct 20 (Thu) (22 Sep 2016 MB)
21 (Fri) (Q3 2016 IR)
Nov 4 (Fri) 10 (Thu)
Dec 16 (Fri) 22 (Thu) 8 (Thu)
(10 Nov 2016 MB)

vi
List of Acronyms, Abbreviations, and Symbols
AL BES
Auto Loans Business Expectations Survey
NBQBs Non-Bank Financial Institutions with Quasi-Banking Functions
BTr CAMPI
Bureau of the Treasury Chamber of Automotive Manufacturers of the Philippines, Inc.
NEDA NEER NNPL
National Economic and Development Authority Nominal Effective Exchange Rate Net Non-Performing Loan
CAR Capital Adequacy Ratio NFA Net Foreign Assets; National Food Authority
CBD Central Business District NG National Government
CES Consumer Expectations Survey NGCP National Grid Corporation of the Philippines
CDS Credit Default Swaps NPC National Power Corporation
CI Confidence Index NPI Net Primary Income
COV Coefficient of Variation NPL Non-Performing Loan
CPI DBCC
Consumer Price Index Development Budget Coordination Committee
OECD Organization for Economic Cooperation and Development
DOE DI
Department of Energy Diffusion Index
OPEC Organization of the Petroleum Exporting Countries
DOF Department of Finance OF Overseas Filipinos
EIA US Energy Information Administration PMI Purchasing Managers’ Index
EM EMBI
Emerging Market JP Morgan Emerging Market Bond Index
PSA Philippine Statistical Authority; Power Supply Agreement
ERC FCDA
Energy Regulatory Commission Foreign Currency Differential Adjustment
PSALM Power Sector Assets and Liabilities Management Corporation
GDP Gross Domestic Product PSEi Philippine Stock Exchange Composite Index
GNI Gross NationaI Income RBs Rural Banks
GOUR Generation Over/Under Recovery REER Real Effective Exchange Rate
GNPL Gross Non-Performing Loan ROP Republic of the Philippines
GS Government Securities RP Repurchase
IEA International Energy Agency RR Reserve Requirement
IMF International Monetary Fund RRP Reverse Repurchase
IPP Independent Power Producer RWA Risk-Weighted Asset
IRI International Research Institute for Climate and Society
SDA SEM
Special Deposit Account Single-Equation Model
LFS Labor Force Survey SLOUR System Loss Over/Under Recovery
LPG Liquefied Petroleum Gas SME Small and Medium Enterprise
LSOUR Lifeline Subsidy Over/Under Recovery SOSFM Society of Fellows in Supply Management, Inc.
LTFRB Land Transportation Franchising and Regulatory Board
TB TLP
Thrift Banks Total Loan Portfolio
MB Monetary Board TOUR Transmission Over/Under Recovery
MEM Multi-Equation Model U/KBs Universal and Commercial Banks
MERALCO Manila Electric Company VAPI Value of Production Index
MISSI Monthly Integrated Survey of Selected Industries
VOPI WESM
Volume of Production Index Wholesale Electricity Spot Market
MTP Major Trading Partner
vii
Contents
Overview ................................................................................................... viii
I. Inflation and Real Sector Developments .................................................... 1
Prices ................................................................................................................................. 1
Private Sector Economists’ Inflation Forecasts. ......................................................... 2
Energy prices. ............................................................................................................ 3
Aggregate Demand and Supply ........................................................................................ 5
Aggregate Demand. ................................................................................................... 6
Other Demand Indicators. ......................................................................................... 7
Box Article. A Residential Real Estate Price Index (RREPI)
for the Philippines: Maiden Results ......................................................................... 10
Aggregate Supply. .................................................................................................... 17
Labor Market Conditions ............................................................................................... 18
II. Monetary and Financial Market Conditions .............................................. 20
Domestic Liquidity and Credit Conditions....................................................................... 20
Interest Rates .................................................................................................................. 23
Financial Market Conditions ........................................................................................... 25
Banking System ............................................................................................................... 27
Exchange Rate ................................................................................................................. 29
III. Fiscal developments ............................................................................... 31
IV. External Developments .......................................................................... 32
V. Monetary Policy Developments ............................................................... 35
VI. Inflation Outlook .................................................................................... 36
BSP Inflation Forecasts.................................................................................................... 36
Risks to the Inflation Outlook ......................................................................................... 38
VII. Implications for the Monetary Policy Stance .......................................... 39
Summary of Monetary Policy Decisions ....................................................... 41

viii
Overview
Headline inflation rises slightly but remains subdued. Headline inflation for Q2 2016 rose to 1.5 percent, slightly higher than the 1.1 percent recorded in the previous quarter. This brought average inflation for the first six months of the year to 1.3 percent, lower than the National Government’s range target of 3.0 percent ± 1.0 percentage point for 2016-2018. Brisker food inflation, due to tighter domestic supply, contributed to the slightly higher inflation reading. Similarly, non-food inflation inched up on service-related CPI items as well as clothing and footwear. Meanwhile, core inflation edged upward to 1.7 percent from 1.6 percent a quarter ago. Moreover, two of the three alternative measures of core inflation computed by the BSP were higher, namely, the trimmed mean and weighted median. Consistent with the price developments during the review quarter, there was an increase in the number of CPI items with inflation rates greater than the upper end of the 2016 inflation target to 26 from 22 a quarter ago, which together comprised 12.6 percent of the CPI basket. Inflation expectations remain low. The BSP’s survey of private sector economists for June 2016 yielded mean inflation forecasts that were lower for 2016 at 1.8 percent from 1.9 percent in March; and unchanged for 2017 at 2.7 percent. Analysts attributed their inflation expectations to low global oil prices and slower global economic growth. These are likely to outweigh the upside risks brought by the El Niño phenomenon, the rebound in oil prices, power rate adjustments, expected occurrence of La Niña in the latter part of 2016, and holiday-related spending in Q4 2016. Similarly, results of the June 2016 Consensus Economics survey also showed lower mean inflation forecasts compared to the March results at 1.9 percent from 2.2 percent for 2016; and 2.9 percent from 3.1 percent for 2017. Meanwhile, domestic demand continues to be strong. Domestic economic growth for Q1 2016 expanded by 6.9 percent, exceeding market expectations. This was also higher than the quarter- and year-ago growth rates of 6.5 percent and 5.0 percent, respectively. Growth for the quarter in review was supported by higher expansion in consumer spending as well as in fixed capital investments. On the production side, the services and industry sectors continued to be the main drivers of growth. Similarly, trends in higher-frequency demand indicators point to optimistic prospects in the near term.
Vehicle sales continued to post double-digit growth rates, supported by brisk consumer demand amid deliveries of new car models and attractive marketing promotions. Outlook on economic activity remained upbeat as the composite Purchasing Managers’ Index registered firmly above the 50-point expansion threshold.
Inflation edges higher amid
slightly higher food prices but
remains benign
At the same time, business expectations have turned optimistic while consumer outlook remained broadly steady, consistent with the BSP’s assessment that underlying domestic demand continues to be firm against a backdrop of sustained credit growth and notable improvements in employment conditions. However, global economic growth remains tepid. Major economies such as the US and core euro nations registered mild output growth. In contrast, economic activity eased further in Japan, while the severe downturn in Brazil persisted. In addition, key indicators in China pointed to further deterioration in key sectors such as manufacturing. The continued weak growth outlook for emerging market economies combined with the absence of a solid economic rebound among advance economies led a number of central banks to ease their monetary settings in order to support economic activity.
Domestic financial market remains stable despite external volatility. The domestic financial system remained stable and resilient, anchored on solid macroeconomic fundamentals. However, episodes of volatility remain on the external front as global economic conditions become more challenging with the slowdown and rebalancing issues in the Chinese economy and the Brexit referendum. These developments were mitigated by the US Fed’s decision to maintain policy settings in June which partially boosted emerging market assets. These external factors, along with several domestic developments such as the national elections in May, were key movers of Philippine financial markets. The Philippine equities market rallied during the review quarter as the

ix
stronger-than-expected GDP and credible election outcomes resulted in bullish investor sentiments. Moreover, investor appetite for local currency government securities remained healthy, affirmed by the continued oversubscription in the scheduled GS auctions. However, uncertainty on the external front was also reflected in the country’s wider bond spreads and risk premiums. Nevertheless, the Philippine banking system remained sound, resilient and capable of supporting the expanding economy, marked by a continued increase in assets, lending, and deposits, and with capital adequacy ratios comfortably above the BSP’s prescribed levels and international norms. In addition, bank lending standards for loans to both enterprises and households were also broadly unchanged during the quarter, indicating a generally stable supply of credit.
Monetary policy settings were maintained during the quarter. The BSP decided to maintain its key policy interest rate for the overnight reverse repurchase or RRP facility. The interest rates for other monetary policy instruments were also kept steady. Similarly, the reserve requirement ratios were left unchanged. The BSP’s assessment of the emerging outlook for inflation and demand conditions continued to support keeping monetary policy unchanged.
The benign inflation
environment provided
flexibility for the BSP to shift to
an interest rate corridor
system and implement key
reforms in its monetary
operations in June
On 3 June 2016, the BSP made a formal shift in its monetary operations to an interest rate corridor (IRC) system. The system for monetary operations was modified to consist of the following: overnight liquidity facilities, namely, the overnight lending facility (OLF) and the overnight deposit facility (ODF); the overnight RRP facility; and a term deposit facility (TDF). The interest rates for these facilities were recalibrated as follows:
3.5 percent in the overnight lending facility
(a reduction in the upper bound of the
corridor from the overnight RP rate of 6.0 percent);
3.0 percent in the overnight RRP rate (an adjustment from 4.0 percent); and
2.5 percent in the overnight deposit facility (no change from the SDA rate).
The adjustments in the BSP’s key interest rates under the IRC reform were primarily operational in nature and were not expected to materially affect prevailing monetary policy settings. Latest baseline forecasts indicate that inflation could settle at the low-end of the government’s announced target range in 2016 and approach the midpoint of the target range in 2017-2018. Global growth is expected to be modest, with commodity prices likely to remain muted. Nevertheless, while inflation pressures remain subdued, prospects for domestic economic activity continue to remain favorable on the back of stronger growth in manufacturing and public sector construction. Moreover, continued growth in liquidity and credit conditions indicate that overall monetary conditions remain sufficiently appropriate with respect to supporting economic activity.
The BSP is of the view that
current monetary policy
settings are appropriate
Current monetary policy settings remain appropriate. The sum of recent information continues to support keeping the stance of monetary policy unchanged in view of the emerging outlook for inflation and demand conditions. With manageable inflation dynamics and favorable prospects for domestic demand, the stance of monetary policy can continue to be kept steady for the near term. At the same time, there continues to be ample room for fiscal policy to provide an additional boost to domestic demand through infrastructure and social spending. On balance, the BSP is of the view that current monetary policy settings remain appropriately calibrated. Going forward, the BSP will continue to monitor domestic and external developments to ensure that the monetary policy stance remains consistent with its price and financial stability objectives.
Q2 2016 Inflation Report | 1
I. Inflation and Real Sector Developments
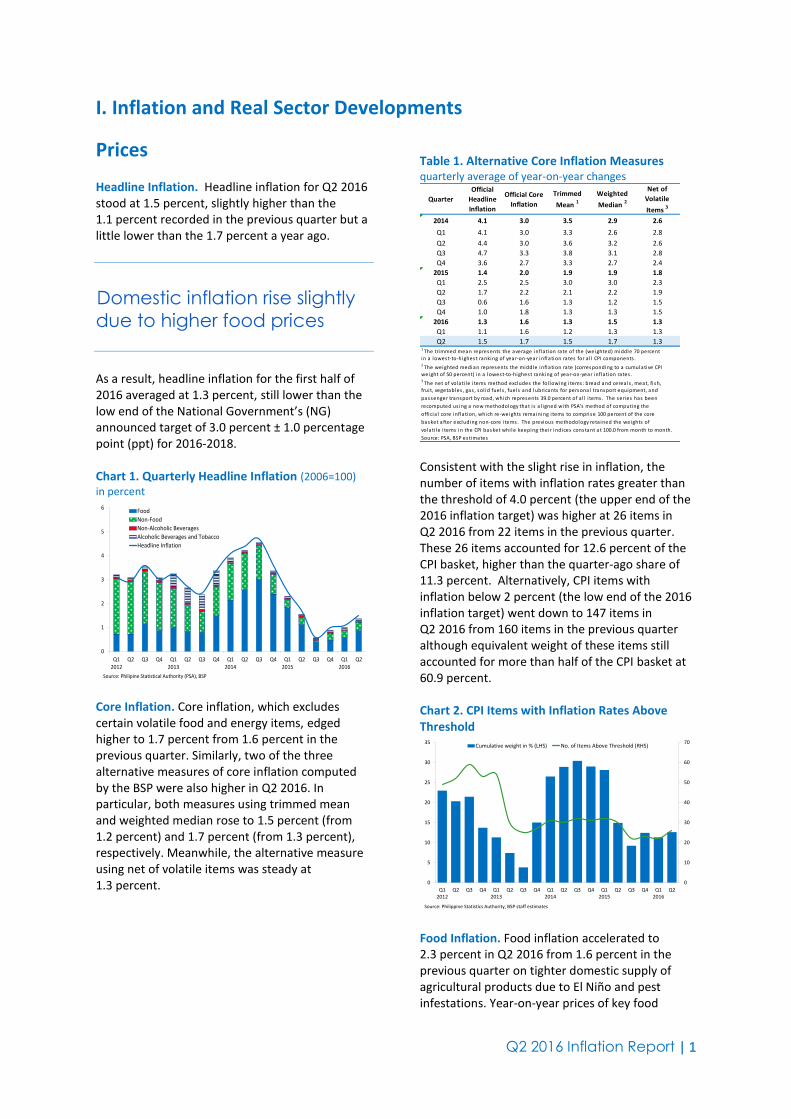
Prices Headline Inflation. Headline inflation for Q2 2016 stood at 1.5 percent, slightly higher than the 1.1 percent recorded in the previous quarter but a little lower than the 1.7 percent a year ago.
Domestic inflation rise slightly
due to higher food prices
As a result, headline inflation for the first half of 2016 averaged at 1.3 percent, still lower than the low end of the National Government’s (NG) announced target of 3.0 percent ± 1.0 percentage point (ppt) for 2016-2018. Chart 1. Quarterly Headline Inflation (2006=100) in percent
0
1
2
3
4
5
6
Q12012
Q2 Q3 Q4 Q12013
Q2 Q3 Q4 Q12014
Q2 Q3 Q4 Q12015
Q2 Q3 Q4 Q12016
Q2
Food
Non-Food
Non-Alcoholic Beverages
Alcoholic Beverages and Tobacco
Headline Inflation
Source: Philipine Statistical Authority (PSA), BSP Core Inflation. Core inflation, which excludes certain volatile food and energy items, edged higher to 1.7 percent from 1.6 percent in the previous quarter. Similarly, two of the three alternative measures of core inflation computed by the BSP were also higher in Q2 2016. In particular, both measures using trimmed mean and weighted median rose to 1.5 percent (from 1.2 percent) and 1.7 percent (from 1.3 percent), respectively. Meanwhile, the alternative measure using net of volatile items was steady at 1.3 percent.
Table 1. Alternative Core Inflation Measures quarterly average of year-on-year changes
Quarter
Official
Headline
Inflation
Official Core
Inflation
Trimmed
Mean 1
Weighted
Median 2
Net of
Volatile
Items 3
2014 4.1 3.0 3.5 2.9 2.6
Q1 4.1 3.0 3.3 2.6 2.8
Q2 4.4 3.0 3.6 3.2 2.6
Q3 4.7 3.3 3.8 3.1 2.8
Q4 3.6 2.7 3.3 2.7 2.4
2015 1.4 2.0 1.9 1.9 1.8
Q1 2.5 2.5 3.0 3.0 2.3
Q2 1.7 2.2 2.1 2.2 1.9
Q3 0.6 1.6 1.3 1.2 1.5
Q4 1.0 1.8 1.3 1.3 1.5
2016 1.3 1.6 1.3 1.5 1.3
Q1 1.1 1.6 1.2 1.3 1.3
Q2 1.5 1.7 1.5 1.7 1.31 The trimmed mean represents the average inflation rate of the (weighted) middle 70 percentin a lowest-to-highest ranking of year-on-year inflation rates for a l l CPI components .2
The weighted median represents the middle inflation rate (corresponding to a cumulative CPIweight of 50 percent) in a lowest-to-highest ranking of year-on-year inflation rates .3
The net of volati le i tems method excludes the fol lowing i tems: bread and cereals , meat, fi sh,frui t, vegetables , gas , sol id fuels , fuels and lubricants for personal transport equipment, and
passenger transport by road, which represents 39.0 percent of a l l i tems. The series has been
recomputed us ing a new methodology that i s a l igned with PSA's method of computing the
officia l core inflation, which re-weights remaining i tems to comprise 100 percent of the core
basket after excluding non-core i tems. The previous methodology reta ined the weights of
volati le i tems in the CPI basket whi le keeping their indices constant at 100.0 from month to month.
Source: PSA, BSP estimates Consistent with the slight rise in inflation, the number of items with inflation rates greater than the threshold of 4.0 percent (the upper end of the 2016 inflation target) was higher at 26 items in Q2 2016 from 22 items in the previous quarter. These 26 items accounted for 12.6 percent of the CPI basket, higher than the quarter-ago share of 11.3 percent. Alternatively, CPI items with inflation below 2 percent (the low end of the 2016 inflation target) went down to 147 items in Q2 2016 from 160 items in the previous quarter although equivalent weight of these items still accounted for more than half of the CPI basket at 60.9 percent.
Chart 2. CPI Items with Inflation Rates Above Threshold
0
10
20
30
40
50
60
70
0
5
10
15
20
25
30
35
Q12012
Q2 Q3 Q4 Q12013
Q2 Q3 Q4 Q12014
Q2 Q3 Q4 Q12015
Q2 Q3 Q4 Q12016
Q2
Cumulative weight in % (LHS) No. of Items Above Threshold (RHS)
Source: Philippine Statistics Authority, BSP staff estimates Food Inflation. Food inflation accelerated to 2.3 percent in Q2 2016 from 1.6 percent in the previous quarter on tighter domestic supply of agricultural products due to El Niño and pest infestations. Year-on-year prices of key food

Q2 2016 Inflation Report | 2
commodities such as meat, fruits, milk, cheese, and eggs rose during the review quarter while vegetable price inflation remained at double-digit levels. By contrast, rice prices continued to decline compared to year-ago levels on the back of ample supply due to the onset of the summer harvest season and arrival of additional rice imports. Table 2. Inflation Rates for Selected Food Items quarterly averages in percent (2006=100)
Q1 Q2 Q3 Q4 Q1 Q2
Food and Non-Alcoholic Beverages 4.8 3.0 1.1 1.3 1.6 2.3
Food 5.0 3.1 1.1 1.3 1.6 2.4
Bread and Cereals 5.7 2.6 -0.5 -1.6 -1.2 -0.2
Rice 7.2 3.3 -0.9 -2.5 -2.0 -0.9
Corn 2.4 0.2 -0.6 -0.4 1.7 2.6
Meat 4.2 1.3 0.4 0.8 1.0 2.2
Fish 5.1 5.3 3.2 3.7 2.8 2.7
Milk, Cheese and Eggs 4.4 3.3 1.9 1.3 1.2 1.5
Oils and Fats 2.7 0.9 -0.3 -0.2 0.3 2.1
Fruit 11.4 9.6 4.9 3.5 3.3 4.4
Vegetables 1.1 0.3 0.2 9.0 10.3 12.9
Sugar, Jam, Honey 3.8 4.2 2.9 3.9 6.4 5.0
Food Products, N.E.C. 4.8 4.6 3.8 2.7 3.1 -1.0
Non-Alcoholic Beverages 2.1 2.2 1.8 1.4 1.2 1.2
Alcoholic Beverages and Tobacco 4.0 3.8 3.7 3.9 4.9 5.5
2016
Source of Bas ic Data: PSA, BSP
Commodity2015
Non-Food Inflation. At the same time, non-food inflation inched up during the review quarter to 0.6 percent from 0.5 percent in the previous quarter. Clothing and footwear, health and catering services contributed the most to non-food inflation. Meanwhile, due mainly to the approved tuition fee hikes in most regions by the Commission on Higher Education (CHED) for the academic year 2016-2017, education inflation continued to increase, albeit slightly slower than in the previous quarter. The higher inflation in food and selected non-food items more than offset the continued decline in oil-related CPI items such as electricity rates and prices of domestic petroleum products relative to year-ago levels. Table 3. Inflation Rates for Selected Non-Food Items quarterly averages in percent (2006=100)
Q1 Q2 Q3 Q4 Q1 Q2
Non-Food 0.6 0.5 0.1 0.5 0.5 0.6
Clothing and Footwear 3.1 2.6 2.3 2.3 1.9 2.3
Housing, Water, Electricity,
Gas and Other Fuels -1.1 -1.1 -1.7 -1.2 -1.0 -1.0
Electricty, Gas, and Other Fuels -8.7 -8.2 -9.8 -8.8 -6.9 -6.7
Furnishings, Household Equipment
& Routine Maintenance of the House 2.2 2.1 1.7 1.6 1.5 1.6
Health 2.7 2.3 1.7 1.8 1.9 2.4
Transport -0.7 0.0 -0.5 0.9 0.3 0.1
Transport Services 2.6 2.9 2.5 3.3 1.2 0.7
Communication -0.1 -0.1 0.0 0.0 0.1 0.2
Recreation and Culture 1.1 1.1 1.0 1.0 1.1 1.6
Education 5.1 4.7 3.6 3.6 3.6 3.0
Restaurant and Miscellaneous
Goods and Services 1.6 1.2 1.2 1.3 1.6 2.2
2016
Source of Bas ic Data: PSA, BSP
Commodity2015
Private Sector Economists’ Inflation Forecasts. Results of the BSP’s survey of private sector economists for June 2016 yielded lower mean inflation forecast for 2016 relative to the results in March 2016.4
Mean inflation forecast for
2016 is lower
In particular, the mean inflation forecast for 2016 declined to 1.8 percent from 1.9 percent in March 2016. By contrast, the average annual inflation forecast for 2017 was unchanged at 2.7 percent from the March 2016 survey results. Meanwhile, mean inflation forecast for 2018 was at 2.9 percent. Chart 3. BSP Private Sector Economists’ Survey mean forecast for full year; in percent
1
2
3
4
5
Jan
20
14
Feb
Mar
Ap
r
May Jun
Jul
Au
g
Sep
Oct
No
v
Dec
Jan
20
15
Feb
Mar
Ap
r
May Jun
Jul
Au
g
Sep
Oct
No
v
Dec
Jan
20
16
Feb
Mar
Ap
r
May Jun
2016 2017 2018 Target Range2016: 1.8
2017: 2.72018: 2.9
Source: BSP Analysts attributed their lower inflation expectations to the persistently low global oil prices and slower global economic growth. These are likely to outweigh the upside risks to inflation that include the lingering effects of El Niño phenomenon, rebound in oil prices, power rate adjustments, possible occurrence of La Niña in the latter part of 2016, and holiday-related spending in Q4 2016. Based on the probability distribution on the forecasts provided by 22 out of 27 respondents, there is a 65.2-percent chance that average inflation for 2016 will settle between the 1.0-1.99 percent range. Meanwhile, there is a 29.5-percent chance that 2016 inflation rate will fall within the 2-4 percent target range. For 2017, the respondents assigned a 71.8-percent chance 4 There were 27 respondents in the BSP’s survey of private sector economists in June 2016. The survey was conducted between 8-30 June 2016.

Q2 2016 Inflation Report | 3
that inflation will fall within the 2-4 percent target range. Chart 4. Probability Distribution for Analysts’ Inflation Forecasts* 2016-2018
0
10
20
30
40
50
60
70
80
90
100
<1 1.0 – 1.99 2.0 – 3.0 3.1 – 4.0 4.1 – 5.0 5.1 – 6.0 6.1 – 7.0
2016 2017 2018
*Probability distributions were averages of those provided by 22 out of 27 respondents. Source: BSP Survey Similarly, results for the June 2016 Consensus Economics survey also showed lower mean inflation forecast for 2016 at 1.9 percent (from 2.2 percent in March 2016). Likewise, mean inflation forecast for 2017 was lower at 2.9 percent from 3.1 percent.5 Table 4. Private Sector Forecasts for Inflation, June 2016 annual percentage change
2017 2018
Q3 Q4 FY FY FY
1) Al-Amanah Islamic Bank 1.80 1.70 1.60 2.00 2.00
2) Asia ING 2.00 2.40 1.80 3.00 3.70
3) Banco de Oro 1.87 1.87 1.60 2.00 2.50
4) Bangkok Bank 1.90 2.00 1.80 2.50 2.80
5) Bank of Commerce 2.18 2.65 1.85 - -
6) Bank of China 1.50 1.80 2.20 3.00 3.00
7) Bank of the Philippine Islands 2.20 2.30 2.10 3.00 -
8) Barclays 2.10 2.30 1.80 2.00 -
9) Chinabank 1.90 2.30 1.70 2.30 2.50
10) CTBC Bank 1.50 1.80 1.50 2.20 3.00
11) Deutsche Bank - - 2.20 3.20 -
12) Eastwest Bank 1.25 1.50 1.70 1.90 2.00
13) IDEA 2.36 2.60 1.89 3.13 3.56
14) Korea Exchange Bank 2.60 2.60 2.70 2.70 2.80
15) Land Bank of the Philippines 1.60-1.90 1.70-2.00 1.50-1.80 2.30-2.60 2.30-2.60
16) Maybank 2.00 2.40 1.78 2.70 3.00
17) Maybank-ATR KimEng 2.40 2.90 2.00 - -
18) Metrobank - - 2.00 3.80 3.80
19) Multinat'l Inv. Banc 1.75 2.00 1.57 2.50 -
20) Mizuho 2.00 2.50 1.70 1.90 -
21) Nomura 2.00 3.00 2.40 3.50 -
22) Phil. Equity Partners 2.18 2.65 1.86 3.36 3.20
23) RCBC 1.90-2.20 2.10-2.70 1.50-2.00 3.00-3.50 2.80-3.30
24) Robinsons Bank 2.00 2.10 1.70 3.00 2.00
25) Standard Chartered 2.10 2.20 1.80 2.90 3.30
26) UBS 2.10 1.90 1.70 2.40 -
27) Union Bank 1.60 1.73 1.48 2.47 2.67
Median Forecast 2.0 2.3 1.8 2.7 2.9
Mean Forecast 2.0 2.2 1.8 2.7 2.9
High 2.6 3.0 2.7 3.8 3.8
Low 1.3 1.5 1.5 1.9 2.0
Number of Observations 25 25 27 25 18
Government Target 3.0±1.00 3.0±1.00 3.0±1.00 3.0±1.00 3.0±1.00
2016
Source: BSP On the other hand, based on the BSP Business Expectations Survey (BES), majority of firms in 5 There were 19 respondents in the Consensus Economics’ survey in June 2016.
Q2 2016 expect inflation to increase in the current quarter relative to the previous quarter (from a diffusion index of 25.2 percent to 31.4 percent).
BSP surveys show modest
increase in inflation
expectations
The number of firms that expect inflation to increase in the next quarter was broadly steady from 32.7 percent to 32.3 percent. Meanwhile, results of the Q2 2016 BSP Consumer Expectations Survey (CES) showed that respondents anticipate inflation to move at a modest rate to 3.4 percent from 3.3 percent in the previous quarter. Energy prices. The average price of Dubai crude oil increased by 42.0 percent in Q2 2016 after declining consistently in the previous four quarters. International Dubai crude prices rallied on the back of unplanned output losses from oil producers, higher seasonal demand in the US, declining US stockpiles, and renewed speculation over OPEC production.
Global oil price rallies in Q2
2016 on lower crude supply
Various supply outages caused by, (a) the wildfire in Canadian oil sands, (b) militant attacks in Nigeria, and (c) political tensions in Libya—led to lower production volume, contributing to the price increase. At the same time, higher oil prices can also be attributed to the increased demand for driving in the US during the warm months from April-September of the year. Likewise, US tight oil production and inventories have also been on a downtrend.6 Based on the data from the US Energy Information Administration (EIA), tight oil production has been declining thus far in 2016. 6 Based on the definition by the US EIA, tight oil refers to oil produced from petroleum-bearing formations with low permeability such as the Eagle Ford, the Bakken, and other formations that must be hydraulically fractured to produce oil at commercial rates. Shale oil is a subset of tight oil.

Q2 2016 Inflation Report | 4
Similarly, US commercial crude oil inventory has also gone down recently at 526.6 million for the week ending 24 June 2016 compared to the reported figures in 17 June. Meanwhile, the estimated futures prices of Dubai crude oil has already exceeded US$50 per barrel starting in September 2017. The Q2 2016 futures data for Dubai showed a higher path for 2016 to 2018 compared to the estimates in the previous quarter.7 Chart 5. Spot and Estimated Prices of Dubai Crude Oil
20
40
60
80
100
120
140
Q1
20
12
Q2
Q3
Q4
Q1
20
13
Q2
Q3
Q4
Q1
20
14
Q2
Q3
Q4
Q1
20
15
Q2
Q3
Q4
Q1
20
16
Q2
Q3
Q4
Q1
20
17
Q2
Q3
Q4
Q1
20
18
Q2
Q3
Q4
*Futures prices derived using Brent crude futuresSource: Bloomberg, BSP
31 March 2016
28 June 2016
The US EIA revised upward demand forecasts for
2016 and 2017 due largely to China and India –
particularly for transportation use – in its June
assessment8 relative to the March report. On the
other hand, supply estimates for 2016 was
downgraded in the June report while the 2017
supply was higher due to rising crude production
from Iran and Saudi Arabia as well as existing
project commitments. Nevertheless, the EIA
expects the oil oversupply to end by the second
half of 2017 due largely to lower US oil production.
Demand-supply gap seen to
narrow in 2017
Projections on oil consumption from other energy
agencies were mixed. The International Energy
Agency revised its earlier demand growth
estimates to 1.3 mb/d in June from 1.2 mb/d in its
March report. Meanwhile, OPEC kept demand
forecasts steady at 1.2 mb/d for 2016.
7 Future prices derived using Brent crude futures data. 8 US EIA Short-Term Energy Outlook (June 2016)
Consistent with the direction of international crude prices, prices of domestic petroleum products were likewise higher relative to previous end-quarter levels. Prices of gasoline, kerosene, diesel, and LPG increased by as much as P5.15 per liter (for diesel) by end-June 2016. Relative to year-ago levels, however, prices remained subdued. Table 5. Domestic Retail Pump Prices peso/liter; end-quarter prices
Quarter Gasoline Kerosene Diesel LPG
2014 Q1 53.75 50.87 44.25 41.73
Q2 54.95 51.51 43.70 40.27
Q3 52.15 47.99 40.70 38.74
Q4 41.20 37.39 30.05 33.87
2015 Q1 42.60 35.59 28.85 31.19
Q2 45.90 37.49 29.65 30.18
Q3 42.25 33.44 26.80 28.00
Q4 38.10 29.07 22.60 32.14
2016 Q1 39.00 30.32 22.80 27.69
Q2 41.15 33.53 27.95 29.12
2016 Q2 2.15 3.21 5.15 1.43
2016 Q2 (4.75) (3.96) (1.70) (1.06)
Quarter-on-Quarter Change
Year-on-Year Change
*Average Metro Mani la reta i l pump prices for the big three oi l
companies : Ca l tex, Petron and Shel l
Source: Department of Energy (DOE) Power. Overall electricity rates went down in Q2 2016 due to lower generation costs. During the review quarter, the average generation charge dropped by P0.13 per kilowatt hour (kWh) to P3.90 per kWh from P4.03 per kWh in Q1 2016.
Retail electricity prices decline
on lower generation charges
The decline in the average electricity rates during the quarter was driven generally by the lower generation cost from the Wholesale Electricity Spot Market (WESM) and Independent Power Producers (IPPs) in May and June 2016, which offset the slight increase recorded in April 2016 due to higher generation cost brought by seasonal demand and the additional Feed-in-Tariff Allowance (FIT-All). The lower generation cost of WESM and IPPs were driven mainly by lower fuel cost, supported by higher dispatch of plants and lesser outages of power plants.

Q2 2016 Inflation Report | 5
Chart 6. Meralco’s Generation Charge PhP/kWh; year-on-year growth rates in percent
-40
-30
-20
-10
0
10
20
30
40
50
0
1
2
3
4
5
6
7
8
9
Q12012
Q2 Q3 Q4 Q12013
Q2 Q3 Q4 Q12014
Q2 Q3 Q4 Q12015
Q2 Q3 Q4 Q12016
Q2
Generation Charge (PhP/kWh) (LHS)
Generation Charge (year-on-year growth rates in percent) (RHS)
Source: Meralco However, there are potential sources of upside pressures on electricity charges. Meralco has existing petitions for rate increases with ERC which include the petition to implement the Maximum Average Price for 2012-2015; amended application for a rate increase in the January 2014 billing (consisting of incremental fuel costs and deferred generation cost to be collected monthly for six months); and petitions for the refund of generation over/under recovery (GOUR), transmission over/under recovery (TOUR), system loss over/under recovery (SLOUR), and lifeline subsidy over/under recovery (LSOUR) for the period January-December 2011. In addition, the Power Sector Assets and Liabilities Management (PSALM) has several pending petitions with ERC for the recovery of True-Up Adjustments of Fuel and Purchased Power Costs (TAFPPC), Foreign Exchange Related Costs (TAFxA) and Purchased Power Costs and Foreign Exchange Related Costs by the National Power Corporation (NPC), and NPC’s Stranded Debt portion of the universal charge. Likewise, the National Grid Corporation of the Philippines (NGCP) also filed several petitions to recover connection charges and residual sub-transmission charges for 2011-2013 and the costs of repair on damages caused by force majeure events such as earthquake, flooding, landslides, and lightning incidents in 2011-2012.
MWSS implements rate
adjustments for
concessionaires due to FCDA
Water. Effective 1 July 2016, the all-in-water rates of Manila Water Company, Inc. (MWCI) and Maynilad Water Services, Inc (MWSI) went down slightly by P0.01/cu.m. from P33.81/cu.m to
P33.79/cu.m. and from P45.68/cu.m. to P45.67/cu.m., respectively. The decrease was due to the foreign currency differential adjustment or FCDA approved by the Metropolitan Waterworks and Sewerage System-Regulatory Office (MWSS-RO) for Q3 2016.
Aggregate Demand and Supply The Philippine economy grew by 6.9 percent in Q1 2016, higher than the 6.5-percent expansion in the previous quarter and the 5.0-percent growth in the same period last year.
Real GDP growth exceeds
market expectations
Gross domestic product (GDP) for Q1 was supported by higher expansions in consumer spending as well as fixed capital investments, particularly in durable equipment and construction. On the production side, the services and industry sectors continued to be the main drivers of growth. On a seasonally-adjusted basis, q-o-q GDP growth slowed down to 1.1 percent in Q1 2016 from 2.1 percent in Q4 2015. Gross national income (GNI) grew by 7.6 percent in Q1 2016, the highest reading since Q4 2013, from the previous quarter’s growth of 7.3 percent. Similarly, net primary income expanded by 10.7 percent in Q1 2016, albeit lower than 11.5 percent in Q4 2015, due to sustained increase in compensation. Chart 7. Gross Domestic Product (GDP) and Gross National Income (GNI) at constant prices
2
4
6
8
10
Q12012
Q2 Q3 Q4 Q12013
Q2 Q3 Q4 Q12014
Q2 Q3 Q4 Q12015
Q2 Q3 Q4 Q12016
GDP GNI
Source: PSA

Q2 2016 Inflation Report | 6
Aggregate Demand. On the expenditure side,
household and government spending as well as fixed capital investments led to the accelerated growth of the economy (with contributions to GDP growth of 4.9 ppts, 1.0 ppt, and 5.9 ppts, respectively), offsetting the negative contribution of net exports (-5.4 ppts), which was due mainly to the slowdown of exports growth (both goods and services) and the higher expansion in imports of goods.
Benign inflation boosts
household consumption
Household spending, which accounted for more than two-thirds of the country’s output at 69.8 percent, rose by 7.0 percent in Q1 2016, an acceleration from the 6.5-percent growth in the previous quarter. The slower pace of increase in prices of consumer goods and services available to households boosted household spending during the quarter. The top contributors to growth of household final consumption expenditure were food and non-alcoholic beverages (2.5 ppts), miscellaneous goods and services (e.g., personal care, personal effects, etc.) with 1.1 ppts, and housing, water, electricity, gas and other fuels (1.0 ppt). Chart 8. Gross Domestic Product by Expenditure Shares at constant prices
-40
-30
-20
-10
0
10
20
30
40
50
60
Q12012
Q2 Q3 Q4 Q12013
Q2 Q3 Q4 Q12014
Q2 Q3 Q4 Q12015
Q2 Q3 Q4 Q12016
HH Consumption Govt Spending Capital Formation
Source: PSA
7.0 pct 9.9 pct 23.8 pct
Growth in investments in capital formation rose to 23.8 percent in Q1 2016 from 13.3 percent in Q4 2015, as growth in fixed capital investments increased to 25.6 percent in Q1 2016 from 24.2 percent in Q4 2015. The expansion in fixed capital investments can be attributed mainly to the following:
(a) higher growth in private construction (7.1 percent from 1.1 percent in the previous quarter) as well as sustained increase in public construction, although lower at 39.9 percent in Q1 2016 from 43.5 percent in Q4 2015;
(b) positive growth in private investments in
durable equipment (36.6 percent in Q1 2016 from 42 percent a quarter ago) as investments in road vehicles grew by 36.6 percent, albeit lower than 59.1 percent in the previous quarter, which could be attributed to the positive growth in car sales9 reported in Q1 2016 at 37.0 percent (compared to the previous quarter’s 38.9 percent); and
(c) accelerated growth in investments in breeding
stock and orchard development to 4.1 percent from 2.6 percent in the previous quarter due to increased production of livestock and poultry.
Government expenditures growth slowed down to 9.9 percent in Q1 2016 from 15.8 percent in Q4 2015.
Overall exports growth slowed down in Q1 2016 to 6.6 percent from the quarter-ago growth rate of 10.9 percent. Both exports of goods and services (which expanded by 5.2 percent from 9.0 percent in Q4 2015 and by 11.1 percent from 19.1 percent in Q4 2015, respectively), contributed to the slowdown in overall exports growth. The weakening of growth in exports of services was due mainly to the decrease in miscellaneous services, such as maintenance and repair services, charges for the use of intellectual property, and telecommunications, computer, and information services (which contributed 9.5 ppts). Likewise, growth in exports of goods decelerated, driven by the higher contraction in exports of articles of apparel and clothing accessories and others (e.g., transport equipment/parts), which contributed -1.2 percentage points and -0.5 percentage points, respectively. 9 Data based on the Chamber of Automotive Manufacturers of the Philippines (CAMPI) and Association of Vehicle Importers and Distributors (AVID).

Q2 2016 Inflation Report | 7
Table 6. Economic Performance at constant 2000 prices; growth rate in percent
Q1 Q2 Q3 Q4 Q1
Household Consumption 6.1 6.4 6.1 6.5 7.0
Government Consumption 0.2 2.4 15.7 15.8 9.9
Capital Formation 12.5 21.4 14.5 13.3 23.8
Fixed Capital Formation 8.8 12.7 13.9 24.2 25.6
Exports 10.6 5.1 9.8 10.9 6.6
Imports 12.2 12.6 16.2 14.9 16.2
BY EXPENDITURE ITEM2015 2016
Source: PSA Meanwhile, overall imports posted a 16.2-percent growth for Q1 2016, higher than the quarter-ago increase of 14.9 percent, owing to the double-digit growth in imports of goods at 15.9 percent. Growth in imports of semiconductors and transport equipment contributed mainly to Q1 growth of imports of goods. Meanwhile, imports of services slowed down to 17.5 percent (from 19.9 percent a quarter ago) due largely to the slowdown in transportation imports (9.6 percent) and lower growth in imports of miscellaneous services, such as financial services, charges for the use of intellectual property, and personal, cultural and recreational services (44.3 percent from 47.9 percent).
Other Demand Indicators. High-frequency
demand indicators point to sustained positive impulses. During the review quarter, the property sector continued to expand, vehicle sales sustained its double-digit growth while the composite Purchasing Managers’ Index remained above the 50-point expansion threshold, indicating continued firm domestic demand. Moreover, business and consumer confidence for the current quarter improved and turned more optimistic for the next quarter. Property Prices
Implied land values trend
higher but still below 1997
levels in real terms
Land Values, Metro Manila. Data from Colliers International indicated that implied land values10 in the Makati CBD and Ortigas Center appreciated in Q1 2016 from quarter- and year-ago levels. 10 In the absence of reported closed transactions, implied land values based on trends are used by Colliers International to monitor prices.
Implied land values in the Makati CBD reached P523,000/sq.m. in Q1 2016, higher by 4.6 percent and 17.9 percent relative to the levels recorded in Q4 2015 and Q1 2015, respectively. Similarly, implied land values in the Ortigas Center rose by 5.3 percent quarter-on-quarter and 17.0 percent year-on-year to P189,000/sq.m. Land values in the Makati CBD were above their 1997 levels in nominal terms, but just about half of their 1997 levels in real terms. Meanwhile, land values in the Ortigas Center were about 96.9 percent of their 1997 levels in nominal terms and 42.1 percent in real terms. Chart 9. Land Values average price per square meter
100,000
200,000
300,000
400,000
500,000
600,000
Q12013
Q2 Q3 Q4 Q12014
Q2 Q3 Q4 Q12015
Q2 Q3 Q4 Q12016
Makati Bonifacio Global City Ortigas
Source: Colliers International Philippines
Continued demand for office
space keeps vacancy rates
low
Vacancy Rates, Makati CBD. The office vacancy rate in the Makati CBD was lower at 1.7 percent relative to the quarter- and year-ago levels of 2.0 percent and 2.2 percent, respectively. The continued strong office demand of business process outsourcing companies in the Makati CBD has kept office vacancy rates at low single-digit levels. However, Colliers anticipates office vacancy to rise slightly to 2.0 percent in Q1 2017 with the addition of new office supply. In contrast, the residential vacancy rate in the Makati CBD increased to 9.6 percent in Q1 2016 from 8.9 percent in the previous quarter.
Q2 2016 Inflation Report | 8
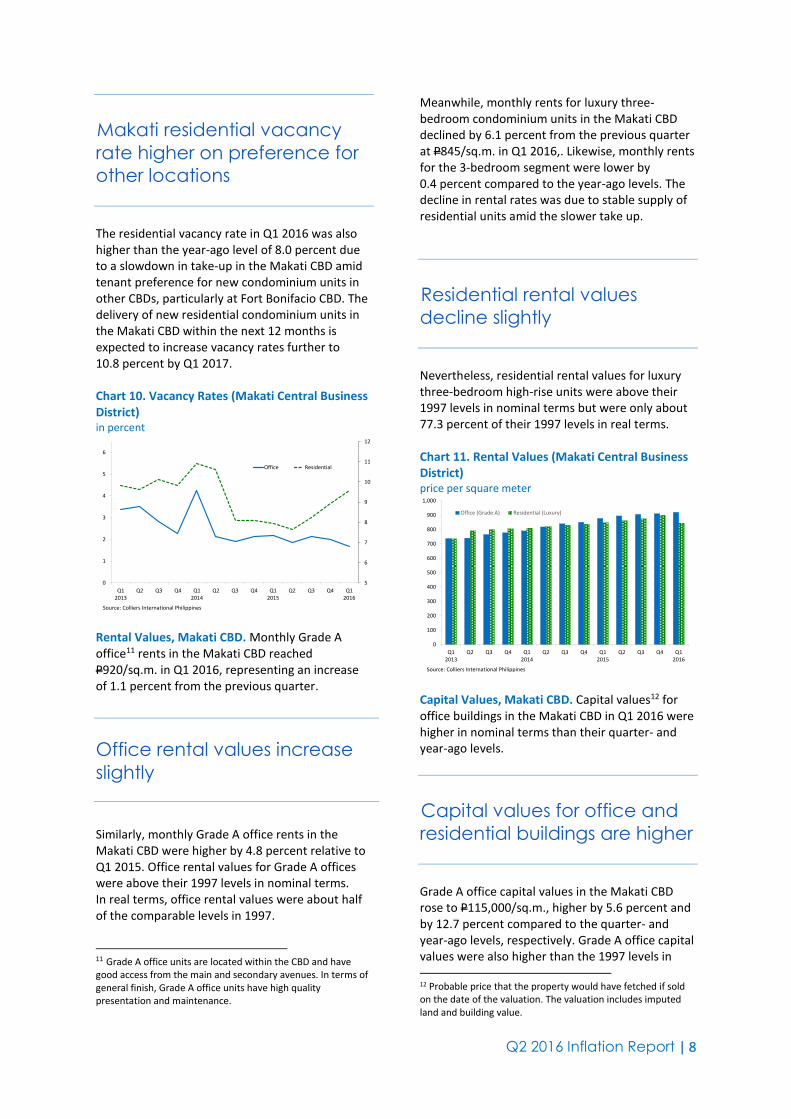
Makati residential vacancy
rate higher on preference for
other locations
The residential vacancy rate in Q1 2016 was also higher than the year-ago level of 8.0 percent due to a slowdown in take-up in the Makati CBD amid tenant preference for new condominium units in other CBDs, particularly at Fort Bonifacio CBD. The delivery of new residential condominium units in the Makati CBD within the next 12 months is expected to increase vacancy rates further to 10.8 percent by Q1 2017. Chart 10. Vacancy Rates (Makati Central Business District) in percent
5
6
7
8
9
10
11
12
0
1
2
3
4
5
6
Q12013
Q2 Q3 Q4 Q12014
Q2 Q3 Q4 Q12015
Q2 Q3 Q4 Q12016
Office Residential
Source: Colliers International Philippines
Rental Values, Makati CBD. Monthly Grade A office11 rents in the Makati CBD reached P920/sq.m. in Q1 2016, representing an increase of 1.1 percent from the previous quarter.
Office rental values increase
slightly
Similarly, monthly Grade A office rents in the Makati CBD were higher by 4.8 percent relative to Q1 2015. Office rental values for Grade A offices were above their 1997 levels in nominal terms. In real terms, office rental values were about half of the comparable levels in 1997. 11 Grade A office units are located within the CBD and have good access from the main and secondary avenues. In terms of general finish, Grade A office units have high quality presentation and maintenance.
Meanwhile, monthly rents for luxury three-bedroom condominium units in the Makati CBD declined by 6.1 percent from the previous quarter at P845/sq.m. in Q1 2016,. Likewise, monthly rents for the 3-bedroom segment were lower by 0.4 percent compared to the year-ago levels. The decline in rental rates was due to stable supply of residential units amid the slower take up.
Residential rental values
decline slightly
Nevertheless, residential rental values for luxury three-bedroom high-rise units were above their 1997 levels in nominal terms but were only about 77.3 percent of their 1997 levels in real terms. Chart 11. Rental Values (Makati Central Business District) price per square meter
0
100
200
300
400
500
600
700
800
900
1,000
Q12013
Q2 Q3 Q4 Q12014
Q2 Q3 Q4 Q12015
Q2 Q3 Q4 Q12016
Office (Grade A) Residential (Luxury)
Source: Colliers International Philippines Capital Values, Makati CBD. Capital values12 for office buildings in the Makati CBD in Q1 2016 were higher in nominal terms than their quarter- and year-ago levels.
Capital values for office and
residential buildings are higher
Grade A office capital values in the Makati CBD rose to P115,000/sq.m., higher by 5.6 percent and by 12.7 percent compared to the quarter- and year-ago levels, respectively. Grade A office capital values were also higher than the 1997 levels in 12 Probable price that the property would have fetched if sold on the date of the valuation. The valuation includes imputed land and building value.

Q2 2016 Inflation Report | 9
nominal terms. Nevertheless, in real terms, office capital values were about 62.8 percent of the comparable levels in 1997. Capital values for luxury residential buildings13 in Makati CBD in Q1 2016 rose to P151,600/sq.m. from their quarter- and year-ago levels. Average prices for three-bedroom luxury residential condominium units increased by 0.3 percent q-o-q and 2.9 percent y-o-y.
Capital values for luxury residential buildings were above their 1997 levels in nominal terms. In real terms, residential capital values were about 67.5 percent of the comparable levels in 1997. Chart 12. Capital Values (Makati Central Business District) price per square meter
0
20,000
40,000
60,000
80,000
100,000
120,000
140,000
160,000
Q12013
Q2 Q3 Q4 Q12014
Q2 Q3 Q4 Q12015
Q2 Q3 Q4 Q12016
Office (Grade A) Residential (luxury)
Source: Colliers International Philippines
BSP Residential Real Estate Price Index (RREPI).14 The maiden results of the RREPI show that residential real property prices increased by 9.2 percent in Q1 2016 from its year-ago level. Residential real property prices in the NCR and areas outside NCR increased by 9.7 percent and 9.4 percent, respectively. 13 In terms of location, luxury residential units are located within the CBD core and have quality access to/from and have superior visibility from the main avenue. Meanwhile, in terms of general finish, luxury residential units have premium presentation and maintenance. 14 The RREPI measures the average changes in prices of different types of housing units over a period of time across different geographical regions where the growth rate of the index measures house inflation. It is computed as a weighted chain-linked index based on the average appraised value per square meter weighted by the share of floor area of housing units.
Residential property prices
increased in Q1 2016
The highlights of the results also indicate the following: (a) about 7 out of 10 residential real estate loans granted were for the purchase of new housing units; (b) condominium units were the most common house purchases in NCR while in AONCR, single detached houses were the most popular; and (c) by region, NCR accounted for half (50.4 percent) of the residential real estate loans granted in Q1 2016, followed by Calabarzon (28.4 percent), Central Luzon (7.6 percent), Western Visayas (3.8 percent), and Central Visayas (3.3 percent). Table 7. Residential Real Estate Price Index Q1 2014=100; growth rate in percent
Overall NCR AONCR
2015 Q2 109.7 115.0 104.6
Q3 110.4 116.3 105.4
Q4 113.1 116.9 109.6
2016 Q1 115.2 116.6 114.2
2015 Q2 12.8 17.9 8.3
Q3 4.3 8.6 1.8
Q4 5.1 6.3 5.9
2016 Q1 9.2 9.7 9.4
2015 Q2 3.9 8.2 0.2
Q3 0.7 1.1 0.7
Q4 2.4 0.5 4.1
2016 Q1 1.9 -0.2 4.2
Year-on-Year Growth Rates
Quarter-on-Quarter Growth Rates
Residential Real Estate Price IndexQuarter

Q2 2016 Inflation Report | 10
Box Article. A Residential Real Estate Price Index (RREPI) for the Philippines: Some Maiden Results
Introduction Real estate property prices have long been recognized as an important indicator of economic growth. It is not uncommon for residential properties to represent the largest financial outlay of a household as well as its most valuable asset. Indeed, an index of real estate property prices is an important indicator in any analysis of a country’s macroeconomic and financial stability. The Bangko Sentral ng Pilipinas developed a methodology for the compilation and generation of a residential real estate price index (RREPI) for the Philippines. The availability of data on property prices is one of the information gaps identified in the Group of Twenty (G-20) report following the Global Financial Crisis. Data on property prices are also included in the Special Data Dissemination Standard (SDDS) Plus categories under Financial Soundness Indicators that member countries of the International Monetary Fund should adhere to by 2019. Moreover, the generation of the RREPI is a first in the Philippines and is expected to be a valuable tool in assessing the real estate and credit market conditions in the country. The maiden results in this article cover Q2 2015 to Q1 2016. RREPI Methodology The RREPI measures the average changes in prices of different types of housing units over a period of time across different geographical regions. The growth rate of the index measures house price inflation. The RREPI is computed as a weighted chain-linked index based on the average appraised value per square meter weighted by the share of floor area of housing units. To add layers to the analysis, sub-indices are constructed for the different types of housing units (single, duplex, apartments and residential condominium units). This recognizes the often different price evolutions of the various types of housing units. From a geographical perspective, the indices cover areas in the National Capital Region (NCR) and areas outside the NCR (AONCR). The RREPI is computed for new housing units only and is generated by the BSP on a quarterly basis.15 Source of Data The data used in the construction of the RREPI are obtained from the Bank Quarterly Report on Residential Real Estate Loans (RRELs). Based on the BSP Circular No. 892 dated 16 November 2015, all universal/commercial banks (UBs/KBs) and thrift banks (TBs) are required to submit reports on RRELs granted in a given quarter to individual households for the purpose of financing the acquisition of housing units and any associated land. For each RREL granted, the following information are included in the said report:
Location of property;
Type of property (whether new, pre-owned, or foreclosed);
Information about the housing unit such as type (i.e, single detached house, duplex, townhouse, apartment, and condominium unit), appraised value per square meter, floor area, number of floors, number of bedrooms, and effective age in years;
Appraised value per square meter and area of lot;
Total appraised value of the property;
Housing segment based on price ceiling as defined under the existing guidelines of the Housing and Urban Development Coordinating Council (i.e, socialized, economic, low cost, medium cost, open market);
Acquisition cost; and
Name of developer. 15 It is posted in the BSP website every last Friday of the quarter. Available quarterly series are from the second quarter of 2015 to the first quarter of 2016.

Q2 2016 Inflation Report | 11
It should be noted that the above-mentioned information from the bank quarterly report are at a micro-data level covering all individual transactions of residential real estate loans granted by all UBs/KBs and TBs. Highlights of the Results The maiden results highlighted the following findings: For the Philippines as a whole, real property prices increased by 9.2 percent in Q1 2016 from its year-ago level. However, real property prices increased faster in the National Capital Region (9.7 percent) than in areas outside the NCR (9.4 percent) (Figure 1).
Figure 1. RREPI Growth Rate, year-on-year
Figure 1 shows that real property price movements in the NCR and AONCR relatively follow the same pattern from Q1-Q3 2015, with lower growth rates in AONCR. However, starting Q3 2015, year-on-year growth of real property prices in AONCR increased at a faster rate due to the higher growth rates in the prices of townhouses and condominium units. In particular, condominium units posted the highest year-on-year growth in prices at 12.9 percent followed by townhouses at 8.5 percent. Moreover, condominium units were the most common house purchases in NCR while in AONCR, single detached houses were the most popular. Geographically, half of the residential real estate loans (50.4 percent) granted in Q1 2016 were from the National Capital Region, followed by the Calabarzon area with 28.4 percent. With smaller shares of the real estate loans, Central Luzon has 7.6 percent, Western Visayas with 3.8 percent, and Central Visayas with 3.3 percent. Finally, about 7 out of 10 residential real estate loans granted were for the purchase of new housing units. Robustness Checks To check for robustness, RREPI results are supported by findings from other sources. For instance, the slower increase of residential real estate prices at 4.3 percent year-on-year in Q3 2015 (Figure 1) is consistent with the seasonal slack in demand during the quarter as reported by firms in the real estate sector in the Q3 2015 Business Expectations Survey report. This was further validated by the Q3 2015 Consumer Expectations Survey of lower buying outlook for real estate/purchased house and lot or lot only by consumers as respondents prioritized spending on basic needs (from 38.7 percent in the second quarter of 2015 to 35.3 percent in the third quarter of 2015). Furthermore, Household Final Consumption Expenditure (HFCE) for housing, water, electricity, gas, and other fuels had a lower growth rate in Q3 2015 at -1.8 percent from 5.2 percent in Q2 2015.

Q2 2016 Inflation Report | 12
One may also consider the quarter-on-quarter data. Residential property prices grew at a slower pace of 0.7 percent in Q3 2015 compared to Q2 2015. The decline in the growth rates of townhouses and condominium units contributed to the slower growth in house prices. In comparison with the Consumer Price Index (CPI), the CPI components for housing prices which consist of (a) housing rentals and (b) maintenance and repairs of dwelling registered a 2-percent and 1.6-percent increase in prices year-on-year, respectively, for Q1 2016. Compared to these CPI components, the RREPI increased much faster by about 4.6 and 5.8 times for the same period, respectively. The quarterly growth rates of residential capital values for condominium units in Makati City in Q1-Q4 2015, based on data from Colliers, are generally similar to the corresponding RREPI growth rates of condominium units for NCR, except for Q2 2015. Conclusion The BSP recognizes the significant role of real estate activities in the economy. The RREPI was constructed in order to provide a valuable tool in assessing the real estate and credit market conditions in the country. The results are robust against indicators of property prices.
Vehicle Sales. Sales of new vehicles16 grew by 30.7 percent y-o-y in the first two months of Q2 2016 from a 18.0-percent growth recorded in the same period a year ago. According to the Chamber of Automotive Manufacturers of the Philippines, Inc. (CAMPI), the sustained strong growth in automotive sales is due to continued consumer demand amid deliveries of new car models and aggressive marketing promotions of car dealers.
Sales of new vehicles
continue to be robust
Passenger car sales from CAMPI members grew by 16.4 percent y-o-y in April-May 2016, accruing to a total of 20,813 units from 17,887 units sold in the same period in 2015. Similarly, commercial vehicles, which account for about 64.1 percent of 16 Vehicle sales data is gathered on a monthly basis by the Chamber of Automotive Manufacturers of the Philippines (CAMPI). CAMPI represents the local assemblers and manufacturers of vehicle units in the Philippine automotive industry. The following are the active members of CAMPI: (1) Asian Carmakers Corp., (2) CATS Motors, Inc., (3) Columbian Autocar Corp., (4) Honda Cars Philippines, Inc., (5) Isuzu Philippines Corp., (6) Mitsubishi Motors Philippines Corp., (7) Nissan Motor Philippines Corp., (8) Suzuki Philippines Inc., (9) Toyota Motor Philippines Corp. and (10) Universal Motors Corp.
total vehicle sales, expanded by 40.3 percent in the first two months of Q2 2016. Commercial vehicles sold during the period-in-review reached 37,201 units from 26,511 units in the same period in 2015. Chart 13. Vehicle Sales number of units
-15
-10
-5
0
5
10
15
20
25
30
35
Q12012
Q2 Q3 Q4 Q12013
Q2 Q3 Q4 Q12014
Q2 Q3 Q4 Q12015
Q2 Q3 Q4 Q12016
Q2*
* April-May 2016 Source: Chamber of Automotive Manufacturers of the Philippines, Inc. (CAMPI)
Energy Sales. Meralco’s energy sales for the first two months of Q1 2016 expanded by 12.7 percent, considerably higher than the 1.9-percent growth reported in the same period a year ago.
Energy sales increase
Energy sales from all sectors expanded by 17.9 percent, 11.5 percent, and 8.7 percent for the residential sector, commercial sector and industrial sector, respectively.

Q2 2016 Inflation Report | 13
Chart 14. Energy Sales year-on-year growth in percent
-15
-10
-5
0
5
10
15
20
25
Q12012
Q2 Q3 Q4 Q12013
Q2 Q3 Q4 Q12014
Q2(Apr-May)
Q3 Q4 Q12015
Q2(Apr-May)
Q3 Q4 Q12016
Q2(Apr-May)
Total Energy Sales
Residential
Commercial
Industrial
Others
Source: Meralco, BSP calculations
12.7 pct 17.9 pct 11.5 pct
8.7 pct1.4 pct
Capacity Utilization. The average capacity utilization rate of the manufacturing sector was unchanged at 83.4 percent in April 2016 from the month-ago level based on the Philippine Statistics Authority’s Monthly Integrated Survey of Selected Industries (MISSI).
Capacity utilization in
manufacturing remains above
80 percent
Of the 652 respondent-establishments, 59.1 percent operated at least at 80.0 percent capacity in April 2016. Data show that manufacturing companies have been operating above the 80.0-percent capacity since 2010. Chart 15. Monthly Average of Capacity Utilization for Manufacturing in percent
81.8
82.0
82.2
82.4
82.6
82.8
83.0
83.2
83.4
83.6
83.8
Jan
20
12
Feb
Ma
rA
pr
Ma
yJu
nJu
lA
ug
Sep
Oct
No
vD
ec
Jan
20
13
Feb
Ma
rA
pr
Ma
yJu
nJu
lA
ug
Sep
Oct
No
vD
ec
Jan
20
14
Feb
Ma
rA
pr
Ma
yJu
nJu
lA
ug
Sep
Oct
No
vD
ec
Jan
20
15
Feb
Ma
rA
pr
Ma
yJu
nJu
lA
ug
Sep
Oct
No
vD
ec
Jan
20
16
Feb
Ma
rA
pr
Source: PSA Volume and Value of Production. Preliminary results of the MISSI showed that the volume of production index (VoPI) grew faster in April 2016 at 10.5 percent year-on-year from 8.9 percent (revised) in March 2016.
Manufacturing output
continues to rise
The February growth was led by the double-digit increment in the production of food manufacturing (27.1 percent), machinery except electrical (43.9 percent), transport equipment (23.5 percent), basic metals (18.8 percent), miscellaneous manufactures (40.7 percent), and printing (33.5 percent).
Factory output—as measured by the VoPI—increased in April 2016 as expected due to the election-related activities and robust domestic consumption, the National Economic and Development Authority (NEDA) said in a press statement dated 10 June 2016. The sector’s expansion will likely be sustained as demand typically increases in Q2 2016 attributed to the summer and enrollment seasons. This bullish outlook is also supported by stable commodity prices and low interest rates as well as sustained foreign investment flows. However, the NEDA noted some risks brought about by the possible occurrence of La Niña in Q4 2016 and rebound in oil prices. Similarly, the value of production index (VaPI) grew further in April 2016 by 6.8 percent from a modest growth of 1.8 percent (revised) in the previous month. The sustained growth in VaPI was led by the double-digit expansions in the following sub-sectors: food manufacturing (28.4 percent), machinery except electrical (18.7 percent), transport equipment (23.9 percent), miscellaneous manufactures (49.7 percent), beverages (11.9 percent), and printing (32.3 percent). Chart 16. Volume and Value Indices of Manufacturing Production year-on-year in percent
-20
-10
0
10
20
30
40
Jan
20
12
Feb
Ma
rA
pr
Ma
yJu
nJu
lA
ug
Sep
Oct
No
vD
ec
Jan
20
13
Feb
Ma
rA
pr
Ma
yJu
nJu
lA
ug
Sep
Oct
No
vD
ec
Jan
20
14
Feb
Ma
rA
pr
Ma
yJu
nJu
lA
ug
Sep
Oct
No
vD
ec
Jan
20
15
Feb
Ma
rA
pr
Ma
yJu
nJu
lA
ug
Sep
Oct
No
vD
ec
Jan
20
16
Feb
Ma
rA
pr
VAPI VOPI
Source: PSA
Q2 2016 Inflation Report | 14
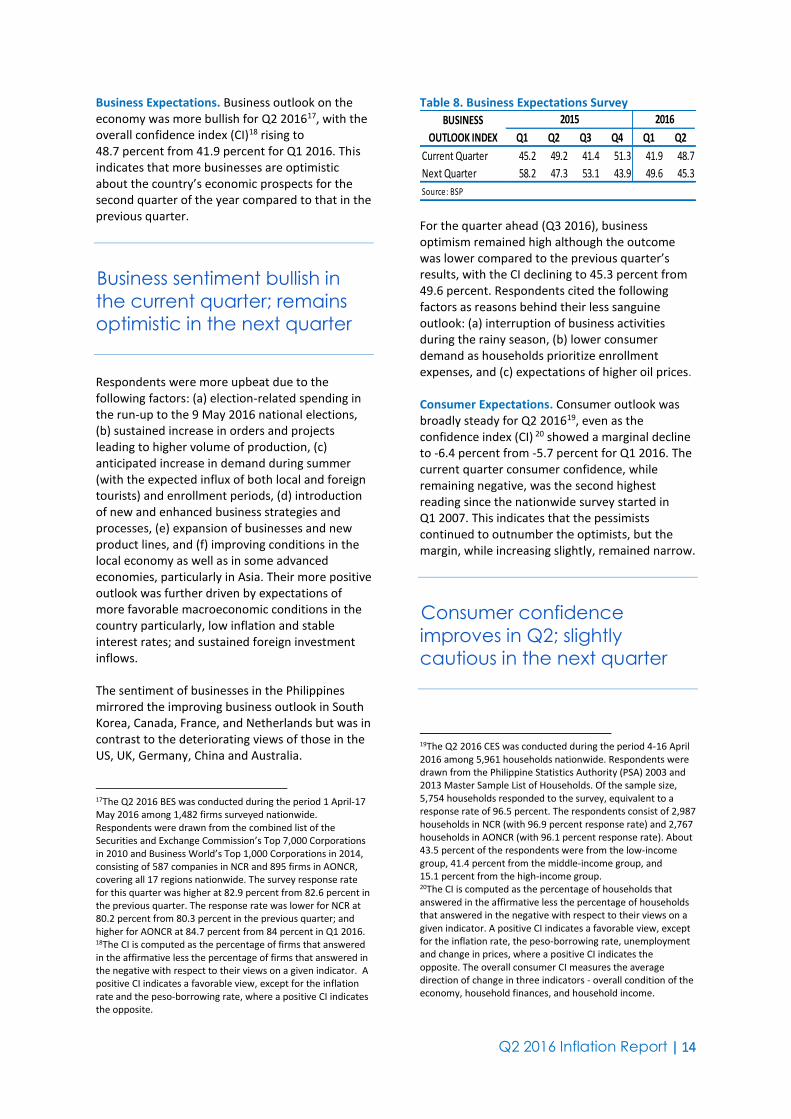
Business Expectations. Business outlook on the economy was more bullish for Q2 201617, with the overall confidence index (CI)18 rising to 48.7 percent from 41.9 percent for Q1 2016. This indicates that more businesses are optimistic about the country’s economic prospects for the second quarter of the year compared to that in the previous quarter.
Business sentiment bullish in
the current quarter; remains
optimistic in the next quarter
Respondents were more upbeat due to the following factors: (a) election-related spending in the run-up to the 9 May 2016 national elections, (b) sustained increase in orders and projects leading to higher volume of production, (c) anticipated increase in demand during summer (with the expected influx of both local and foreign tourists) and enrollment periods, (d) introduction of new and enhanced business strategies and processes, (e) expansion of businesses and new product lines, and (f) improving conditions in the local economy as well as in some advanced economies, particularly in Asia. Their more positive outlook was further driven by expectations of more favorable macroeconomic conditions in the country particularly, low inflation and stable interest rates; and sustained foreign investment inflows. The sentiment of businesses in the Philippines mirrored the improving business outlook in South Korea, Canada, France, and Netherlands but was in contrast to the deteriorating views of those in the US, UK, Germany, China and Australia. 17The Q2 2016 BES was conducted during the period 1 April-17 May 2016 among 1,482 firms surveyed nationwide. Respondents were drawn from the combined list of the Securities and Exchange Commission’s Top 7,000 Corporations in 2010 and Business World’s Top 1,000 Corporations in 2014, consisting of 587 companies in NCR and 895 firms in AONCR, covering all 17 regions nationwide. The survey response rate for this quarter was higher at 82.9 percent from 82.6 percent in the previous quarter. The response rate was lower for NCR at 80.2 percent from 80.3 percent in the previous quarter; and higher for AONCR at 84.7 percent from 84 percent in Q1 2016. 18The CI is computed as the percentage of firms that answered in the affirmative less the percentage of firms that answered in the negative with respect to their views on a given indicator. A positive CI indicates a favorable view, except for the inflation rate and the peso-borrowing rate, where a positive CI indicates the opposite.
Table 8. Business Expectations Survey
Q1 Q2 Q3 Q4 Q1 Q2
Current Quarter 45.2 49.2 41.4 51.3 41.9 48.7
Next Quarter 58.2 47.3 53.1 43.9 49.6 45.3
Source: BSP
BUSINESS
OUTLOOK INDEX
2015 2016
For the quarter ahead (Q3 2016), business optimism remained high although the outcome was lower compared to the previous quarter’s results, with the CI declining to 45.3 percent from 49.6 percent. Respondents cited the following factors as reasons behind their less sanguine outlook: (a) interruption of business activities during the rainy season, (b) lower consumer demand as households prioritize enrollment expenses, and (c) expectations of higher oil prices. Consumer Expectations. Consumer outlook was broadly steady for Q2 201619, even as the confidence index (CI) 20 showed a marginal decline to -6.4 percent from -5.7 percent for Q1 2016. The current quarter consumer confidence, while remaining negative, was the second highest reading since the nationwide survey started in Q1 2007. This indicates that the pessimists continued to outnumber the optimists, but the margin, while increasing slightly, remained narrow.
Consumer confidence
improves in Q2; slightly
cautious in the next quarter
19The Q2 2016 CES was conducted during the period 4-16 April 2016 among 5,961 households nationwide. Respondents were drawn from the Philippine Statistics Authority (PSA) 2003 and 2013 Master Sample List of Households. Of the sample size, 5,754 households responded to the survey, equivalent to a response rate of 96.5 percent. The respondents consist of 2,987 households in NCR (with 96.9 percent response rate) and 2,767 households in AONCR (with 96.1 percent response rate). About 43.5 percent of the respondents were from the low-income group, 41.4 percent from the middle-income group, and 15.1 percent from the high-income group. 20The CI is computed as the percentage of households that answered in the affirmative less the percentage of households that answered in the negative with respect to their views on a given indicator. A positive CI indicates a favorable view, except for the inflation rate, the peso-borrowing rate, unemployment and change in prices, where a positive CI indicates the opposite. The overall consumer CI measures the average direction of change in three indicators - overall condition of the economy, household finances, and household income.

Q2 2016 Inflation Report | 15
Respondents attributed their sustained outlook during the current quarter to the following reasons: (a) increase in the number of employed family members, (b) increasing family income due to higher salary and stronger business activity, (c) lower household expenses as well as debt payments, and (d) improvements in the peace and order situation. The other factors cited by respondents that helped maintain their confidence for the current quarter were assistance from government such as the Pantawid Pamilyang Pilipino Program (4Ps), and the coming change of administration as well as election of new government officials. Their positive sentiments were however counterbalanced by the adverse effects of El Niño on crop production which resulted in poor harvest. The outlook of consumers in the Philippines mirrored the steady sentiment of consumers in Austria, Belgium, Netherlands and Czech Republic but was in contrast to the less favorable sentiment of consumers in Indonesia, Japan, South Korea, Taiwan, Thailand and United States and to the improved views of those in Australia, Canada, China, Euro Area and United Kingdom for Q2 2016. Table 9. Consumer Expectations Survey
Q1 Q2 Q3 Q4 Q1 Q2
Current Quarter -10.0 -16.2 -11.6 -8.1 -5.7 -6.4
Next 3 Months 4.4 -0.4 5.8 5.7 9.1 5.6
Next 12 Months 17.3 16.4 15.8 18.0 25.4 26.6
Source: BSP
CONSUMER
OUTLOOK INDEX
2015 2016
For the next quarter (Q3 2016), consumer sentiment turned less optimistic as the CI declined to 5.6 percent from 9.1 percent in the previous quarter’s survey; but improved for the year ahead to 26.6 percent from 25.4 percent for Q1 2016. According to respondents, their less sanguine outlook for the next quarter stemmed from expectations of lower harvests, slower business activities during the rainy season and expectations of higher expenses for their children’s education (i.e., tuition fees, school supplies, and student allowances). For the year ahead, consumers attributed their more optimistic outlook to the change in administration as well as the election of new government officials, expected improvements in the peace and order situation, and availability of more jobs (both local and abroad).
Purchasing Managers’ Index.21 The composite PMI remained firmly above the 50-point expansion threshold22 at 55.3 in April 2016. However, this was lower than the composite PMI at 56.1 in the previous month.
PMI remains above the
50-point expansion threshold
The decline was due mainly to the slower rate of expansion of the services and retail/wholesale sectors. Chart 17. Purchasing Managers’ Index
40
45
50
55
60
65
70
Jan
20
12
Feb
Ma
rA
pr
Ma
yJu
nJu
lA
ug
Sep
Oct
No
vD
ec
Jan
20
13
Feb
Ma
rA
pr
Ma
yJu
nJu
lA
ug
Sep
Oct
No
vD
ec
Jan
20
14
Feb
Ma
rA
pr
Ma
yJu
nJu
lA
ug
Sep
Oct
No
vD
ec
Jan
20
15
Feb
Ma
rA
pr
Ma
yJu
nJu
lA
ug
Sep
Oct
No
vD
ec
Jan
20
16
Feb
Ma
rA
pr
Composite Manufacturing Retail & Wholesale Trade Services
55.3 56.3 50.9 56.1
Source: Philippine Institute of Supply Management (PISM) The manufacturing PMI in April 2016 expanded by 1.5 index points to 56.3 from 54.8 in March 2016. As expected, business operations accelerated in April as longer working days set in after the observance of the Holy Week in the previous month. The increase in the manufacturing PMI may also be attributed to stronger demand brought about by higher number of new orders that pumped up production, more customers during the month, as well as new product developments and higher demand from election-related activities. All the indices were above the 50-point threshold except for inventories which contracted as demand expanded faster than how much manufacturers were able to produce. Manufacturers expect a slight decline in the manufacturing PMI in May 2016 as election activities subside. Meanwhile, all the manufacturing subsectors expanded in April 2016 21 Data based on the monthly purchasing managers’ index report of the Philippine Institute for Supply Management. 22 The actual formula used to calculate the PMI assigns weights to each common element and then multiplies them by 1.0 for improvement, 0.5 for no change, and 0 for deterioration. As a result, an index above 50 indicates economic expansion, and an index below 50 implies a contraction. PMI surveys are conducted on the last week of the month.
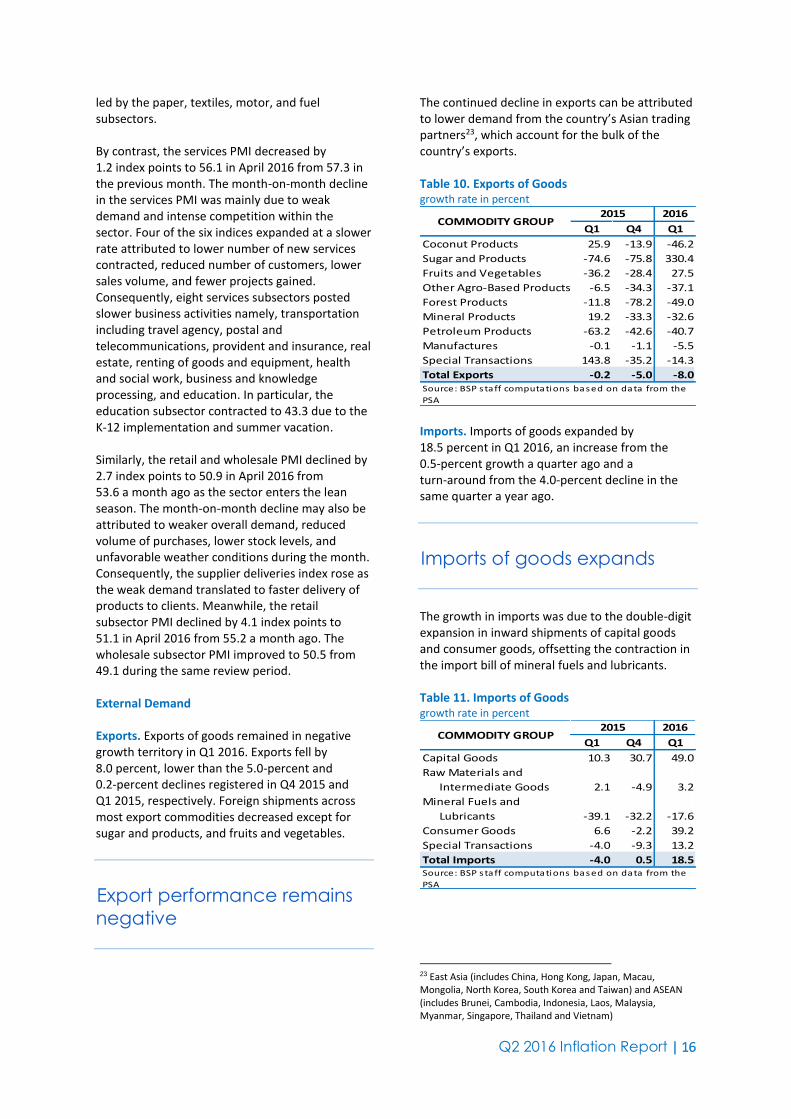
Q2 2016 Inflation Report | 16
led by the paper, textiles, motor, and fuel subsectors. By contrast, the services PMI decreased by 1.2 index points to 56.1 in April 2016 from 57.3 in the previous month. The month-on-month decline in the services PMI was mainly due to weak demand and intense competition within the sector. Four of the six indices expanded at a slower rate attributed to lower number of new services contracted, reduced number of customers, lower sales volume, and fewer projects gained. Consequently, eight services subsectors posted slower business activities namely, transportation including travel agency, postal and telecommunications, provident and insurance, real estate, renting of goods and equipment, health and social work, business and knowledge processing, and education. In particular, the education subsector contracted to 43.3 due to the K-12 implementation and summer vacation. Similarly, the retail and wholesale PMI declined by 2.7 index points to 50.9 in April 2016 from 53.6 a month ago as the sector enters the lean season. The month-on-month decline may also be attributed to weaker overall demand, reduced volume of purchases, lower stock levels, and unfavorable weather conditions during the month. Consequently, the supplier deliveries index rose as the weak demand translated to faster delivery of products to clients. Meanwhile, the retail subsector PMI declined by 4.1 index points to 51.1 in April 2016 from 55.2 a month ago. The wholesale subsector PMI improved to 50.5 from 49.1 during the same review period. External Demand Exports. Exports of goods remained in negative growth territory in Q1 2016. Exports fell by 8.0 percent, lower than the 5.0-percent and 0.2-percent declines registered in Q4 2015 and Q1 2015, respectively. Foreign shipments across most export commodities decreased except for sugar and products, and fruits and vegetables.
Export performance remains
negative
The continued decline in exports can be attributed to lower demand from the country’s Asian trading partners23, which account for the bulk of the country’s exports. Table 10. Exports of Goods growth rate in percent
Q1 Q4 Q1
Coconut Products 25.9 -13.9 -46.2
Sugar and Products -74.6 -75.8 330.4
Fruits and Vegetables -36.2 -28.4 27.5
Other Agro-Based Products -6.5 -34.3 -37.1
Forest Products -11.8 -78.2 -49.0
Mineral Products 19.2 -33.3 -32.6
Petroleum Products -63.2 -42.6 -40.7
Manufactures -0.1 -1.1 -5.5
Special Transactions 143.8 -35.2 -14.3
Total Exports -0.2 -5.0 -8.0Source: BSP s taff computations based on data from the
PSA
COMMODITY GROUP2015 2016
Imports. Imports of goods expanded by 18.5 percent in Q1 2016, an increase from the 0.5-percent growth a quarter ago and a turn-around from the 4.0-percent decline in the same quarter a year ago.
Imports of goods expands
The growth in imports was due to the double-digit expansion in inward shipments of capital goods and consumer goods, offsetting the contraction in the import bill of mineral fuels and lubricants. Table 11. Imports of Goods growth rate in percent
Q1 Q4 Q1
Capital Goods 10.3 30.7 49.0
Raw Materials and
Intermediate Goods 2.1 -4.9 3.2
Lubricants -39.1 -32.2 -17.6
Consumer Goods 6.6 -2.2 39.2
Special Transactions -4.0 -9.3 13.2
Total Imports -4.0 0.5 18.5
2015 2016
Mineral Fuels and
Source: BSP s taff computations based on data from the
PSA
COMMODITY GROUP
23 East Asia (includes China, Hong Kong, Japan, Macau, Mongolia, North Korea, South Korea and Taiwan) and ASEAN (includes Brunei, Cambodia, Indonesia, Laos, Malaysia, Myanmar, Singapore, Thailand and Vietnam)

Q2 2016 Inflation Report | 17
Aggregate Supply. On the production side,
Q1 2016 growth was driven mainly by the services sector (contributing 4.4 percentage points) and the industry sector (contributing 2.9 percentage points). Meanwhile, agriculture contributed -0.4 percentage point.
Services sector continues to
be the main driver of output
growth on the production side
The services sector expanded by 7.9 percent in Q1 2016, slightly higher than the 7.8 percent growth in Q4 2015. Major contributors to the sector’s growth were trade and repair of motor vehicles, motorcycles, personal and household goods (2.2 percentage points), real estate, renting and business activities (1.8 percentage points), other services (1.5 percentage points) and financial intermediation (1.2 percentage points). Meanwhile, growth of real estate, renting and business activities improved to 9.0 percent from 7.8 percent in the previous quarter, on account of the higher growth of renting and other business activities at 17.4 percent from 11.5 percent a quarter ago. Also, the growth in other services was due primarily to the accelerated increase from a quarter ago of hotel and restaurants (13.4 percent from 7.9 percent) and education (5.9 percent from 3.9 percent). Chart 18. Gross Domestic Product by Industrial Origin (at constant prices)
year-on-year growth in percent
-6
-4
-2
0
2
4
6
8
10
12
14
Q12012
Q2 Q3 Q4 Q12013
Q2 Q3 Q4 Q12014
Q2 Q3 Q4 Q12015
Q2 Q3 Q4 Q12016
Agriculture Industry Services
Source: PSA
-4.4 pct 8.7 pct 7.9 pct
The industry sector grew by 8.7 percent in Q1 2016, higher compared to 6.5 percent in Q4 2015. This was due mainly to the acceleration in manufacturing (which posted a growth of 8.1 percent from 6.1 percent a quarter ago) and construction activities (which grew by 10.8 percent
from 8.2 percent in the previous quarter). Growth in manufacturing came mainly from radio, television and communication equipment and apparatus (3.0 percentage points), chemical and chemical products (2.8 percentage points), and food manufactures (2.1 percentage points). Moreover, appreciable growths in office, accounting and computing machinery (25.7 percent from -4.6 percent), electrical machinery and apparatus (30.5 percent from 11.7 percent), footwear and leather and leather products (25.6 percent from 7.8 percent) and fabricated metal products (18.7 percent from 5.7 percent) were noted compared to that a quarter ago. However, negative growths were recorded primarily in petroleum and other fuel products, textile manufactures and wearing apparel. Meanwhile, growth in construction was due to the robust growth of private construction. Growth in all sub-sectors of the industry sector accelerated compared to that a quarter ago, except mining and quarrying (11.3 percent from 14.0 percent). Agriculture, hunting, forestry and fishery (AHFF) sector’s growth posted its biggest decline since late 1990’s at -4.4 percent in Q1 2016 from -0.2 percent a quarter ago. The contraction mainly came from the negative growth of palay and corn production. Table 12. Economic Performance at constant 2000 prices; growth rate in percent
Q1 Q2 Q3 Q4 Q1
Agri., Hunting, Forestry and Fishing 1.0 -0.1 -0.1 -0.2 -4.4
Agriculture and Forestry 1.7 -0.1 -0.1 0.5 -4.3
Fishing -2.9 0.0 0.0 -3.5 -4.9
Industry Sector 5.3 6.1 6.1 6.5 8.7
Mining and Quarrying -2.5 -8.6 0.5 14.0 11.3
Manufacturing 6.0 4.7 5.8 6.1 8.1
Construction 3.9 16.6 7.8 8.2 10.8
Electricity, Gas and Water Supply 5.0 4.6 7.0 5.2 9.7
Service Sector 5.5 6.7 7.2 7.8 7.9
Transport, Storage and
Communication 8.4 6.6 8.0 9.1 5.4
Trade and Repair of Motor Vehicles,
Motorcycles, Personal and
Household Goods 5.9 6.7 8.4 7.3 8.0
Financial Intermediation 4.3 5.8 5.4 8.7 9.1
Real Estate, Renting and
Business Activities 6.4 6.9 7.8 7.8 9.0
Public Administration and Defense;
Compulsory Social Security -4.0 -0.8 2.5 7.2 6.8
Other Services 6.5 10.6 6.8 7.3 8.0
Source: PSA
BY INDUSTRIAL ORIGIN2015 2016
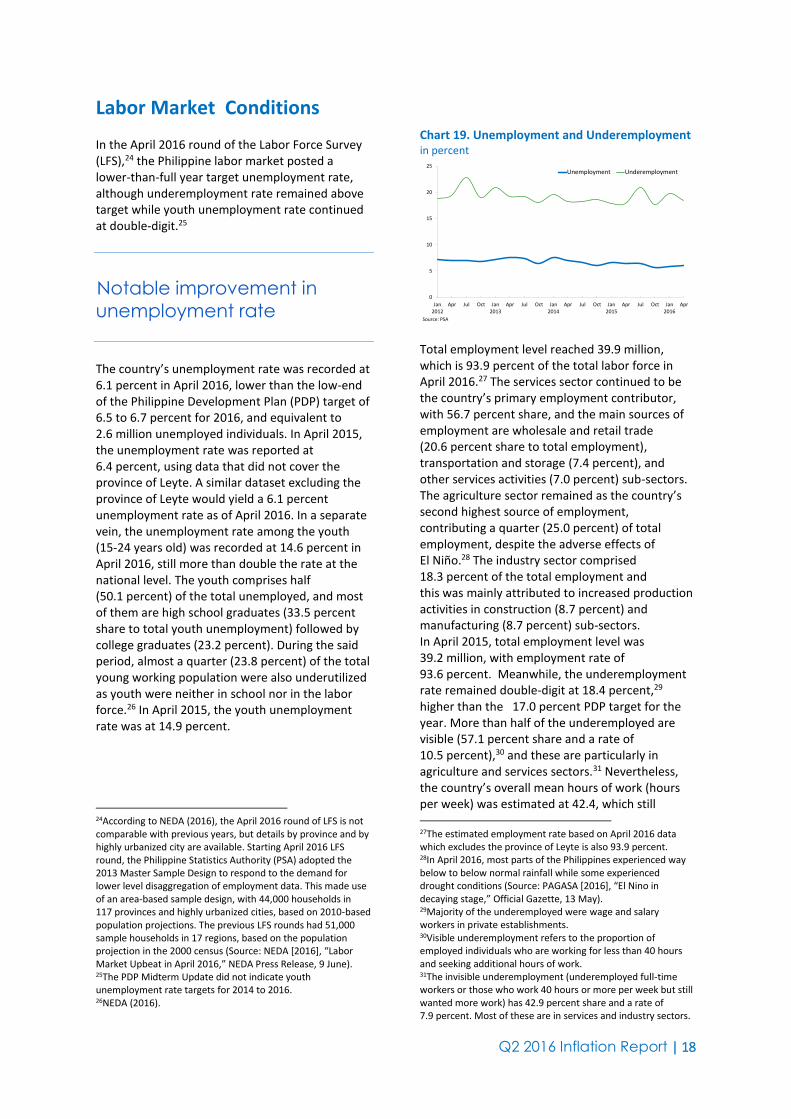
Q2 2016 Inflation Report | 18
Labor Market Conditions In the April 2016 round of the Labor Force Survey (LFS),24 the Philippine labor market posted a lower-than-full year target unemployment rate, although underemployment rate remained above target while youth unemployment rate continued at double-digit.25
Notable improvement in
unemployment rate
The country’s unemployment rate was recorded at 6.1 percent in April 2016, lower than the low-end of the Philippine Development Plan (PDP) target of 6.5 to 6.7 percent for 2016, and equivalent to 2.6 million unemployed individuals. In April 2015, the unemployment rate was reported at 6.4 percent, using data that did not cover the province of Leyte. A similar dataset excluding the province of Leyte would yield a 6.1 percent unemployment rate as of April 2016. In a separate vein, the unemployment rate among the youth (15-24 years old) was recorded at 14.6 percent in April 2016, still more than double the rate at the national level. The youth comprises half (50.1 percent) of the total unemployed, and most of them are high school graduates (33.5 percent share to total youth unemployment) followed by college graduates (23.2 percent). During the said period, almost a quarter (23.8 percent) of the total young working population were also underutilized as youth were neither in school nor in the labor force.26 In April 2015, the youth unemployment rate was at 14.9 percent. 24According to NEDA (2016), the April 2016 round of LFS is not comparable with previous years, but details by province and by highly urbanized city are available. Starting April 2016 LFS round, the Philippine Statistics Authority (PSA) adopted the 2013 Master Sample Design to respond to the demand for lower level disaggregation of employment data. This made use of an area-based sample design, with 44,000 households in 117 provinces and highly urbanized cities, based on 2010-based population projections. The previous LFS rounds had 51,000 sample households in 17 regions, based on the population projection in the 2000 census (Source: NEDA [2016], “Labor Market Upbeat in April 2016,” NEDA Press Release, 9 June). 25The PDP Midterm Update did not indicate youth unemployment rate targets for 2014 to 2016. 26NEDA (2016).
Chart 19. Unemployment and Underemployment in percent
0
5
10
15
20
25
Jan2012
Apr Jul Oct Jan2013
Apr Jul Oct Jan2014
Apr Jul Oct Jan2015
Apr Jul Oct Jan2016
Apr
Unemployment Underemployment
Source: PSA Total employment level reached 39.9 million, which is 93.9 percent of the total labor force in April 2016.27 The services sector continued to be the country’s primary employment contributor, with 56.7 percent share, and the main sources of employment are wholesale and retail trade (20.6 percent share to total employment), transportation and storage (7.4 percent), and other services activities (7.0 percent) sub-sectors. The agriculture sector remained as the country’s second highest source of employment, contributing a quarter (25.0 percent) of total employment, despite the adverse effects of El Niño.28 The industry sector comprised 18.3 percent of the total employment and this was mainly attributed to increased production activities in construction (8.7 percent) and manufacturing (8.7 percent) sub-sectors. In April 2015, total employment level was 39.2 million, with employment rate of 93.6 percent. Meanwhile, the underemployment rate remained double-digit at 18.4 percent,29 higher than the 17.0 percent PDP target for the year. More than half of the underemployed are visible (57.1 percent share and a rate of 10.5 percent),30 and these are particularly in agriculture and services sectors.31 Nevertheless, the country’s overall mean hours of work (hours per week) was estimated at 42.4, which still 27The estimated employment rate based on April 2016 data which excludes the province of Leyte is also 93.9 percent. 28In April 2016, most parts of the Philippines experienced way below to below normal rainfall while some experienced drought conditions (Source: PAGASA [2016], “El Nino in decaying stage,” Official Gazette, 13 May). 29Majority of the underemployed were wage and salary workers in private establishments. 30Visible underemployment refers to the proportion of employed individuals who are working for less than 40 hours and seeking additional hours of work. 31The invisible underemployment (underemployed full-time workers or those who work 40 hours or more per week but still wanted more work) has 42.9 percent share and a rate of 7.9 percent. Most of these are in services and industry sectors.

Q2 2016 Inflation Report | 19
indicates a high level of economic activities in Q2 2016. In April 2015, underemployment rate was at 17.8 percent while mean hours of work was at 39.6 hours per week. The latest data for labor turnover rate32 indicates that employment in large enterprises in Metro Manila grew by 0.6 percent33 in Q4 2015, a deceleration from the 1.0 percent employment growth in the same period in 2014. This could indicate a weaker employment condition in large business enterprises in the region, reverting to a similar condition in the first quarter of 2015, after posting a strong growth in the second and third quarters of the said year.34 These fourth quarter 2015 and 2014 employment growth rates based on labor turnover rate data appear to be consistent with the results of the October 2015 and 2014 rounds of labor force surveys (LFS), which indicate that total employment in the National Capital Region grew by 0.5 percent in October 2015 from 4.1 percent in October 2014. However, the LFS data is released earlier than the labor turnover rate by five months. Among the major sectors, labor turnover rates data by enterprise indicate that only services sector posted an employment growth of 0.9 percent in the fourth quarter of 2015. This was partially offset by 6.2 percent and 0.9 percent contractions in agriculture and industry sectors, respectively. Most of the subsectors posted faster accession rate relative to separation rate, although this was partially offset by the significantly higher separation rate relative to accession rate in agriculture, forestry and fishing, mining and quarrying, construction, information and communication subsectors. The total accession rate was at 8.5 percent,35 still due largely to replacement36 as the rates of hiring to replace workers were high in wholesale and retail trade, repair of motor vehicles and motorcycles, education, and accommodation and food service 32This is not strictly consistent with the labor force survey data as this is enterprise-based survey covering large enterprises in the National Capital Region, with a quarter as reference period. In contrast, the respondents in the labor force surveys are households in all regions in the country, with past week as reference period. 33 This suggests an addition of 6 workers per 1,000 employed. 34From 2nd quarter of 2014 to first quarter of 2015, labor turnover rate was lower compared to the same period in the previous year. 35 This implies that for every 1,000 employed, 85 workers were added to the enterprise workforce. 36The replacement rate was 6.4 percent rate, 1.6 percentage points higher than the expansion rate of 4.7 percent
activities. Meanwhile, the 7.9 percent37 separation rate was mostly employer-initiated (e.g., layoffs)38 and this was most apparent in mining and quarrying,39 construction and wholesale and retail trade, repair of motor vehicles and motorcycles. Since the third quarter of 2013, most of the separation rate in Metro Manila has been employer-initiated, except in the second quarter of 2015, which was dominated by employees quitting their jobs. 37This suggests that for every 1,000 employed, 79 workers were terminated or quit their jobs. 38 The employer-initiated separation rate was 4.8 percent while employee-initiated rate was 3.1 percent. 39This could be partly attributed to declining world metal prices.

Q2 2016 Inflation Report | 20
II. Monetary and Financial Market Conditions
Domestic Liquidity and Credit Conditions Domestic liquidity (M3) grew by 13.5 percent year-on-year in May to reach almost P8.7 trillion. This was faster than the 11.7-percent expansion recorded in end-Q1 2016.
Domestic liquidity growth
accelerates…
Money supply continued to expand due largely to sustained demand for credit. Chart 20. Domestic Liquidity year-on-year growth rates in percent
0
5
10
15
20
25
30
35
40
Mar2012
Jun Sep Dec Mar2013
Jun Sep Dec Mar2014
Jun Sep Dec Mar2015
Jun Sep Dec Mar2016
May
Source: BSP Domestic claims grew by 18.7 percent in May from 15.4 percent in end-Q1 2016 as credits to the private sector increased at a faster pace relative to the previous quarter. Net claims on the central government also rose by 35.0 percent in May, faster than the 33.6-percent growth at the end of the previous quarter. The growth in net foreign assets (NFA) was faster at 9.0 percent y-o-y in May from 5.8 percent in end-Q1 2016. The BSP’s NFA position continued to expand on the back of robust foreign exchange inflows coming mainly from overseas Filipinos’ remittances, business process outsourcing receipts, and portfolio investments. The NFA of banks likewise rose, driven largely by growth in their investments in marketable debt securities, while banks’ foreign liabilities grew mainly on account of higher deposits made by foreign banks.
As of May 2016, outstanding loans of commercial banks, net of reverse repurchase (RRP) placements with the BSP, grew by 17.7 percent y-o-y relative to the 14.8 percent and 14.5 percent growth posted at end-Q1 2016 and end-Q2 2015, respectively.
...while bank lending sustains
growth
The sustained expansion of bank lending was driven largely by loans for production activities, which expanded by 17.9 percent y-o-y in May 2016, higher than the 15.0 percent and 14.5 percent growth recorded at end-Q1 2016 and end-Q2 2015, respectively. Chart 21. Loans Outstanding of Commercial Banks year-on-year growth rates in percent
10
12
14
16
18
20
22
Mar2012
Jun Sep Dec Mar2013
Jun Sep Dec Mar2014
Jun Sep Dec Mar2015
Jun Sep Dec Mar2016
May
Source: BSP The expansion in production loans was driven primarily by increased lending to the following sectors: real estate activities; electricity, gas, steam and airconditioning supply; wholesale and retail trade, repair of motor vehicles and motorcycles; financial and insurance activities; and information and communication. Meanwhile, loans for household consumption grew by 17.4 percent y-o-y as of May 2016, higher than the 15.9 percent growth registered in end Q1-2016 and the 14.9 percent expansion in end-Q2 2015.
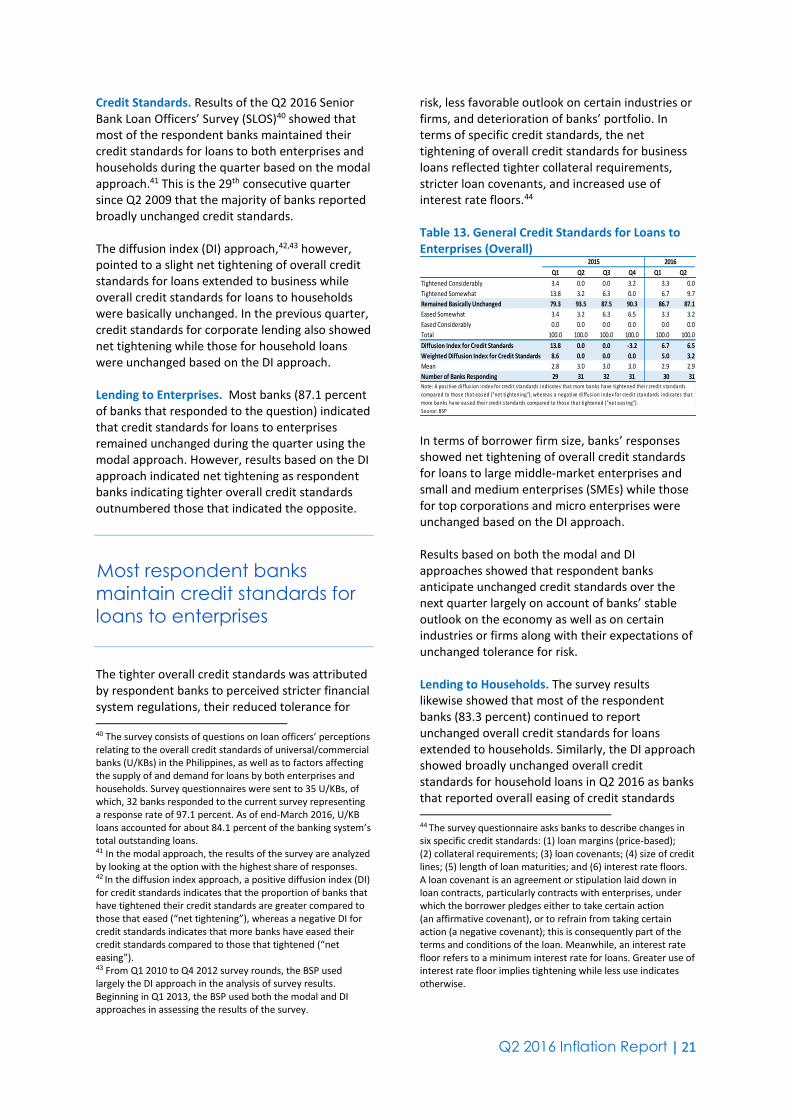
Q2 2016 Inflation Report | 21
Credit Standards. Results of the Q2 2016 Senior Bank Loan Officers’ Survey (SLOS)40 showed that most of the respondent banks maintained their credit standards for loans to both enterprises and households during the quarter based on the modal approach.41 This is the 29th consecutive quarter since Q2 2009 that the majority of banks reported broadly unchanged credit standards.
The diffusion index (DI) approach,42,43 however, pointed to a slight net tightening of overall credit standards for loans extended to business while overall credit standards for loans to households were basically unchanged. In the previous quarter, credit standards for corporate lending also showed net tightening while those for household loans were unchanged based on the DI approach. Lending to Enterprises. Most banks (87.1 percent of banks that responded to the question) indicated that credit standards for loans to enterprises remained unchanged during the quarter using the modal approach. However, results based on the DI approach indicated net tightening as respondent banks indicating tighter overall credit standards outnumbered those that indicated the opposite.
Most respondent banks
maintain credit standards for
loans to enterprises
The tighter overall credit standards was attributed by respondent banks to perceived stricter financial system regulations, their reduced tolerance for 40 The survey consists of questions on loan officers’ perceptions relating to the overall credit standards of universal/commercial banks (U/KBs) in the Philippines, as well as to factors affecting the supply of and demand for loans by both enterprises and households. Survey questionnaires were sent to 35 U/KBs, of which, 32 banks responded to the current survey representing a response rate of 97.1 percent. As of end-March 2016, U/KB loans accounted for about 84.1 percent of the banking system’s total outstanding loans. 41 In the modal approach, the results of the survey are analyzed by looking at the option with the highest share of responses. 42 In the diffusion index approach, a positive diffusion index (DI) for credit standards indicates that the proportion of banks that have tightened their credit standards are greater compared to those that eased (“net tightening”), whereas a negative DI for credit standards indicates that more banks have eased their credit standards compared to those that tightened (“net easing”). 43 From Q1 2010 to Q4 2012 survey rounds, the BSP used largely the DI approach in the analysis of survey results. Beginning in Q1 2013, the BSP used both the modal and DI approaches in assessing the results of the survey.
risk, less favorable outlook on certain industries or firms, and deterioration of banks’ portfolio. In terms of specific credit standards, the net tightening of overall credit standards for business loans reflected tighter collateral requirements, stricter loan covenants, and increased use of interest rate floors.44 Table 13. General Credit Standards for Loans to Enterprises (Overall)
Q1 Q2 Q3 Q4 Q1 Q2
Tightened Considerably 3.4 0.0 0.0 3.2 3.3 0.0
Tightened Somewhat 13.8 3.2 6.3 0.0 6.7 9.7
Remained Basically Unchanged 79.3 93.5 87.5 90.3 86.7 87.1
Eased Somewhat 3.4 3.2 6.3 6.5 3.3 3.2
Eased Considerably 0.0 0.0 0.0 0.0 0.0 0.0
Total 100.0 100.0 100.0 100.0 100.0 100.0
Diffusion Index for Credit Standards 13.8 0.0 0.0 -3.2 6.7 6.5
Weighted Diffusion Index for Credit Standards 8.6 0.0 0.0 0.0 5.0 3.2
Mean 2.8 3.0 3.0 3.0 2.9 2.9
Number of Banks Responding 29 31 32 31 30 31Note: A pos i tive di ffus ion index for credit s tandards indicates that more banks have tightened their credit s tandards
compared to those that eased ("net tightening"), whereas a negative di ffus ion index for credit s tandards indicates that
more banks have eased their credit s tandards compared to those that tightened ("net eas ing").
Source: BSP
2015 2016
In terms of borrower firm size, banks’ responses showed net tightening of overall credit standards for loans to large middle-market enterprises and small and medium enterprises (SMEs) while those for top corporations and micro enterprises were unchanged based on the DI approach. Results based on both the modal and DI approaches showed that respondent banks anticipate unchanged credit standards over the next quarter largely on account of banks’ stable outlook on the economy as well as on certain industries or firms along with their expectations of unchanged tolerance for risk. Lending to Households. The survey results likewise showed that most of the respondent banks (83.3 percent) continued to report unchanged overall credit standards for loans extended to households. Similarly, the DI approach showed broadly unchanged overall credit standards for household loans in Q2 2016 as banks that reported overall easing of credit standards 44 The survey questionnaire asks banks to describe changes in six specific credit standards: (1) loan margins (price-based); (2) collateral requirements; (3) loan covenants; (4) size of credit lines; (5) length of loan maturities; and (6) interest rate floors. A loan covenant is an agreement or stipulation laid down in loan contracts, particularly contracts with enterprises, under which the borrower pledges either to take certain action (an affirmative covenant), or to refrain from taking certain action (a negative covenant); this is consequently part of the terms and conditions of the loan. Meanwhile, an interest rate floor refers to a minimum interest rate for loans. Greater use of interest rate floor implies tightening while less use indicates otherwise.

Q2 2016 Inflation Report | 22
equaled those that reported tighter credit standards during the quarter.
Most respondent banks report
unchanged credit standards
for loans to households
The steady credit standards were attributed by respondent banks largely to their unchanged risk tolerance and profile of borrowers, stable economic outlook of respondent banks and unchanged degree of competition from banks and non-bank lenders. In particular, banks’ responses indicated unchanged loan maturities across all types of household loans, except housing loans, and steady use of interest rate floors for auto loans. Over the next quarter, results based on both the modal and DI approaches likewise showed expectations of unchanged overall credit standards, particularly for housing and credit card loans, reflecting banks’ steady economic outlook and unchanged tolerance for risk. Table 14. General Credit Standards for Loans to Households (Overall)
Q1 Q2 Q3 Q4 Q1 Q2
Tightened Considerably 0.0 0.0 0.0 0.0 0.0 0.0
Tightened Somewhat 10.5 9.5 4.2 4.5 9.5 8.3
Remained Basically Unchanged 84.2 81.0 87.5 81.8 81.0 83.3
Eased Somewhat 5.3 9.5 8.3 13.6 9.5 8.3
Eased Considerably 0.0 0.0 0.0 0.0 0.0 0.0
Total 100.0 100.0 100.0 100.0 100.0 100.0
Diffusion Index for Credit Standards 5.3 0.0 -4.2 -9.1 0.0 0.0
Weighted Diffusion Index for Credit Standards 2.6 0.0 -2.1 -4.5 0.0 0.0
Mean 2.9 3.0 3.0 3.1 3.0 3.0
Number of Banks Responding 19 21 24 22 21 24Note: A pos i tive di ffus ion index for credit s tandards indicates that more banks have tightened their credit s tandards
compared to those that eased ("net tightening"), whereas a negative di ffus ion index for credit s tandards indicates that
more banks have eased their credit s tandards compared to those that tightened ("net eas ing").
Source: BSP
2015 2016
Loan demand. Responses to the survey question on loan demand indicated that the majority of the respondent banks continued to see stable overall demand for loans from both enterprises and households.
Loan demand from both
enterprises and households is
unchanged
Using the DI approach, however, results showed a net increase in loan demand45 across all firm sizes and household loans. The net increase in loan demand of firms46 was largely attributed by banks to higher requirements of borrower firms for working capital and accounts receivable financing. Meanwhile, the net increase in demand for household loans reflected higher household consumption and banks’ more attractive financing terms, among others. Over the next quarter, most of the respondent banks expect unchanged loan demand from both firms and households. However, a larger proportion of respondents expect overall demand for corporate loans to increase further in the next quarter relative to those who indicated the opposite. Respondent banks cited expectations of higher working capital and accounts receivable financing needs of borrower firms along with improved economic outlook of clients and low market interest rates the key factors behind the expected increase in demand for business loans. Meanwhile, the anticipated net increase in household loan demand was attributed by respondent banks largely to higher household consumption as well as more attractive financing terms offered by banks. Real Estate Loans. Most of the respondent banks (90.5 percent) also indicated unchanged credit standards for commercial real estate loans in Q2 2016. The DI approach, however, continued to indicate a net tightening of overall credit standards for the second consecutive quarter.
Credit standards for real
estate loans remain steady
The tighter overall credit standards for commercial real estate loans reflected respondent banks’ wider loan margins, reduced credit line sizes, stricter loan covenants, and increased use of interest rate floors. 45 The “DI for loan demand” refers to the percentage difference between banks reporting an increase in loan demand and banks reporting a decrease. A positive DI for loan demand indicates that more banks reported an increase in loan demand compared to those stating the opposite, whereas a negative DI for loan demand implies that more banks reported a decrease in loan demand compared to those reporting an increase. 46 In particular, top corporations, large middle-market enterprises, and SMEs.
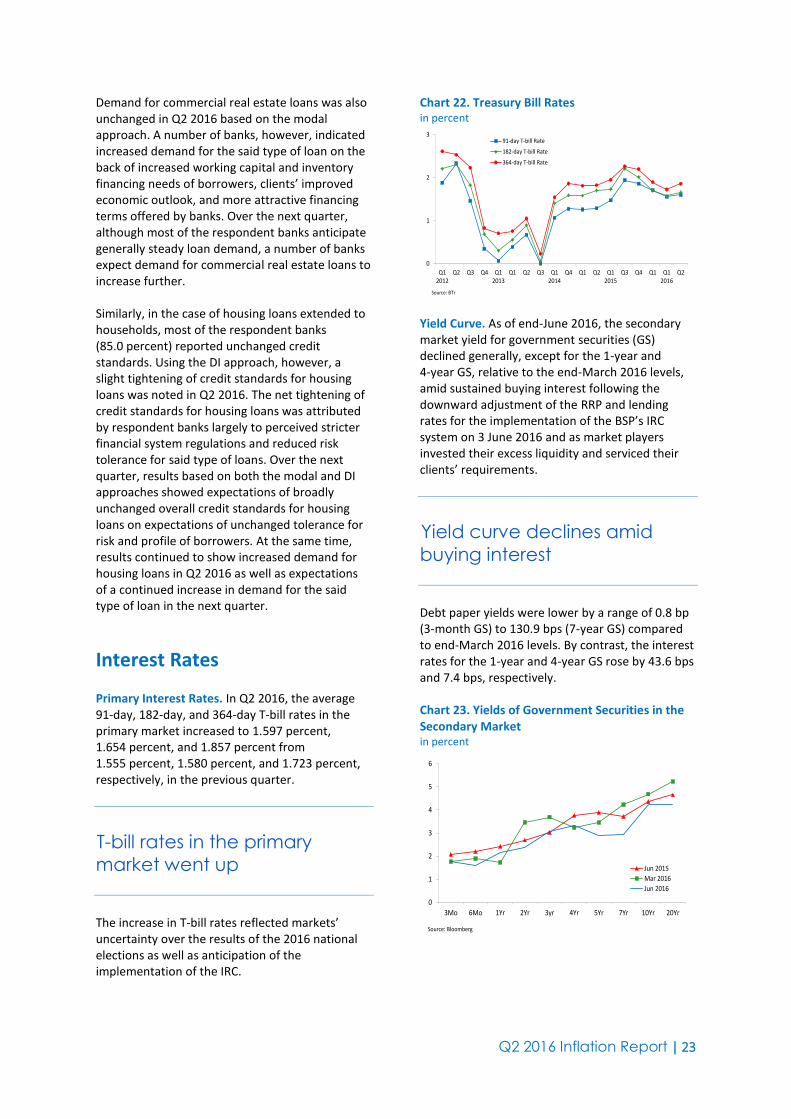
Q2 2016 Inflation Report | 23
Demand for commercial real estate loans was also unchanged in Q2 2016 based on the modal approach. A number of banks, however, indicated increased demand for the said type of loan on the back of increased working capital and inventory financing needs of borrowers, clients’ improved economic outlook, and more attractive financing terms offered by banks. Over the next quarter, although most of the respondent banks anticipate generally steady loan demand, a number of banks expect demand for commercial real estate loans to increase further. Similarly, in the case of housing loans extended to households, most of the respondent banks (85.0 percent) reported unchanged credit standards. Using the DI approach, however, a slight tightening of credit standards for housing loans was noted in Q2 2016. The net tightening of credit standards for housing loans was attributed by respondent banks largely to perceived stricter financial system regulations and reduced risk tolerance for said type of loans. Over the next quarter, results based on both the modal and DI approaches showed expectations of broadly unchanged overall credit standards for housing loans on expectations of unchanged tolerance for risk and profile of borrowers. At the same time, results continued to show increased demand for housing loans in Q2 2016 as well as expectations of a continued increase in demand for the said type of loan in the next quarter.
Interest Rates Primary Interest Rates. In Q2 2016, the average 91-day, 182-day, and 364-day T-bill rates in the primary market increased to 1.597 percent, 1.654 percent, and 1.857 percent from 1.555 percent, 1.580 percent, and 1.723 percent, respectively, in the previous quarter.
T-bill rates in the primary
market went up
The increase in T-bill rates reflected markets’ uncertainty over the results of the 2016 national elections as well as anticipation of the implementation of the IRC.
Chart 22. Treasury Bill Rates in percent
0
1
2
3
Q12012
Q2 Q3 Q4 Q12013
Q1 Q2 Q3 Q12014
Q4 Q1 Q2 Q12015
Q3 Q4 Q1 Q12016
Q2
91-day T-bill Rate
182-day T-bill Rate
364-day T-bill Rate
Source: BTr
Yield Curve. As of end-June 2016, the secondary market yield for government securities (GS) declined generally, except for the 1-year and 4-year GS, relative to the end-March 2016 levels, amid sustained buying interest following the downward adjustment of the RRP and lending rates for the implementation of the BSP’s IRC system on 3 June 2016 and as market players invested their excess liquidity and serviced their clients’ requirements.
Yield curve declines amid
buying interest
Debt paper yields were lower by a range of 0.8 bp (3-month GS) to 130.9 bps (7-year GS) compared to end-March 2016 levels. By contrast, the interest rates for the 1-year and 4-year GS rose by 43.6 bps and 7.4 bps, respectively. Chart 23. Yields of Government Securities in the Secondary Market in percent
0
1
2
3
4
5
6
3Mo 6Mo 1Yr 2Yr 3yr 4Yr 5Yr 7Yr 10Yr 20Yr
Jun 2015
Mar 2016
Jun 2016
Source: Bloomberg

Q2 2016 Inflation Report | 24
Relative to year-ago levels, the secondary market yields of GS likewise decreased generally by a range of 13.7 bps for the 10-year GS to 99.0 bps for the 5-year GS except for the 3-year GS which rose by 3.8 bps.
Interest Rate Differentials. The average differentials between domestic and US interest rates, gross and net of tax, widened in Q2 2016 relative to the previous quarter.
Interest rate differentials
widen
The average 91-day RP T-bill rate rose q-o-q by 4.9 bps to 1.604 percent in Q2 2016 from 1.555 percent in Q1 2016. Meanwhile, the average US 90-day LIBOR increased by 1.8 bps to 0.643 percent while the average US 90-day T-bill rate decreased by 14.4 bps to 0.291 percent in Q2 2016. These developments led to wider positive gross and net of tax differentials between the 91-day RP T-bill rate and US interest rates. Meanwhile, foreign interest rates showed mixed trends during the quarter following the release of better-than-expected US economic data on unemployment, manufacturing activity, consumer spending and retail sales vis a vis lower-than-expected data on home sales and industrial production. Chart 24. Interest rate Differentials quarterly averages; in basis points
-50
0
50
100
150
200
250
Q12012
Q1 Q2 Q3 Q12013
Q4 Q1 Q2 Q12014
Q3 Q4 Q1 Q12015
Q2 Q3 Q4 Q12016
Q2
RP 91-day T-bill vs. US 90-day LIBOR (before tax) RP 91-day T-bill vs. US 90-day T-bill (before tax)
RP 91-day T-bill vs. US 90-day LIBOR (after tax) RP 91-day T-bill vs. US 90-day T-bill (after tax)
Source: Bloomberg, BTr and BSP
The positive differential between the BSP's overnight borrowing or RRP rate and the US Fed funds target rate narrowed to 2.50-2.75 bps in Q2 2016 from 3.50-3.75 bps in Q1 2016, reflecting the impact of the 100-bp decrease in the BSP’s policy interest rate to 3.00 percent on 3 June 2016.
Chart 25. BSP RRP Rate and US Federal Funds Target Rate in percent
-1
0
1
2
3
4
5
Q12012
Q1 Q2 Q3 Q12013
Q4 Q1 Q2 Q12014
Q3 Q4 Q1 Q12015
Q2 Q3 Q4 Q12016
Q2
BSP RRP Rate US Federal Funds Target Rate
Source: Bloomberg and BSP
Similarly, the interest rate differential between the BSP’s overnight RRP rate and the US Fed funds target rate adjusted for risk47 narrowed to 158 bps as of end-June 2016 from 266 bps in end-March 2016 due to higher risk premium. Chart 26. Risk-Adjusted Differentials in basis points
150
175
200
225
250
275
300
Q12012
Q1 Q2 Q3 Q12013
Q4 Q1 Q2 Q12014
Q3 Q4 Q1 Q12015
Q2 Q3 Q4 Q12016
Q2
Source: Bloomberg and BSP
The rise in the risk premium could be attributed to the larger decrease in the 10-year US note relative to the decrease in the 10-year ROP yield, to 1.46 percent and 2.38 percent, respectively. The 10-year US note fell on increased demand for safe-haven assets after the UK voted to leave the European Union on 23 June 2016. Likewise, the 10-year ROP bond declined on improved investor sentiment after Standard & Poor Global Ratings’ said that its sovereign credit ratings and stable outlook on the country remain unaffected by the presidential election. Meanwhile, the real lending rate48 decreased to 1.4 percent in June 2016 from 2.8 percent in March 2016. This was due to the 80-bp rise in 47 The difference between the 10-year ROP note and the 10-year US Treasury note is used as proxy for the risk premium. 48 Real lending rate is measured as the difference between actual bank lending rate and inflation.
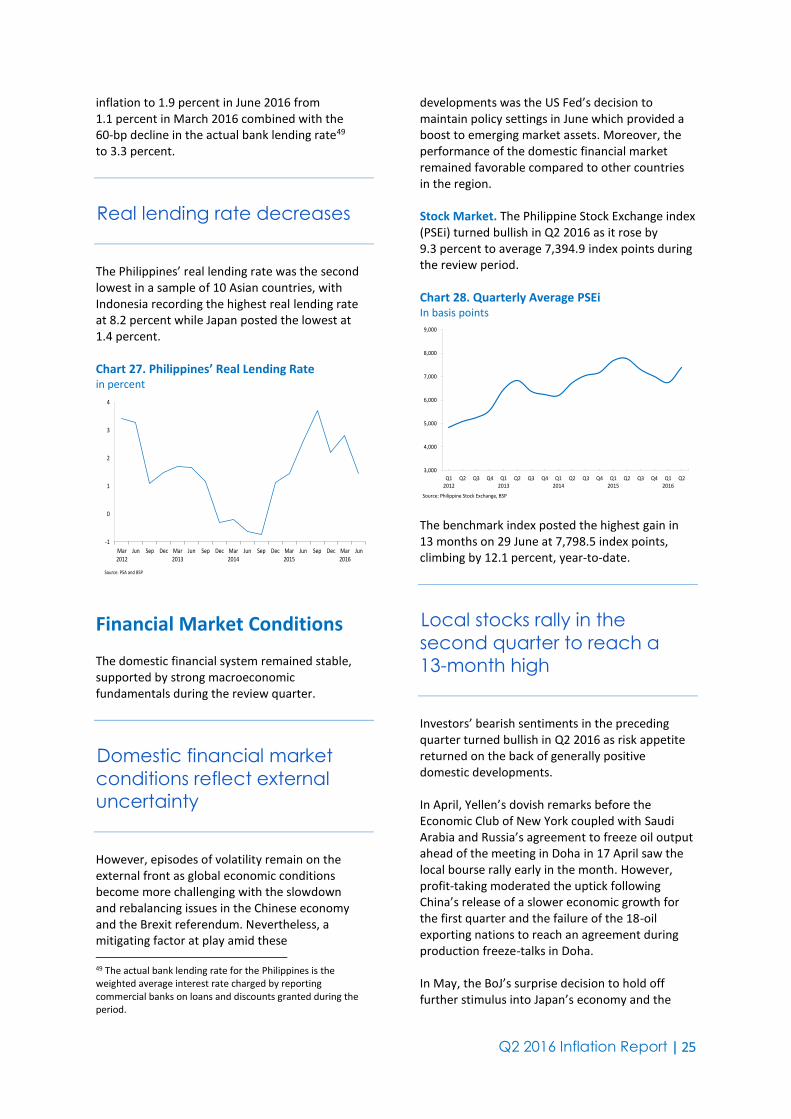
Q2 2016 Inflation Report | 25
inflation to 1.9 percent in June 2016 from 1.1 percent in March 2016 combined with the 60-bp decline in the actual bank lending rate49 to 3.3 percent.
Real lending rate decreases
The Philippines’ real lending rate was the second lowest in a sample of 10 Asian countries, with Indonesia recording the highest real lending rate at 8.2 percent while Japan posted the lowest at 1.4 percent. Chart 27. Philippines’ Real Lending Rate in percent
-1
0
1
2
3
4
Mar2012
Jun Sep Dec Mar2013
Jun Sep Dec Mar2014
Jun Sep Dec Mar2015
Jun Sep Dec Mar2016
Jun
Source: PSA and BSP
Financial Market Conditions The domestic financial system remained stable, supported by strong macroeconomic fundamentals during the review quarter.
Domestic financial market
conditions reflect external
uncertainty
However, episodes of volatility remain on the external front as global economic conditions become more challenging with the slowdown and rebalancing issues in the Chinese economy and the Brexit referendum. Nevertheless, a mitigating factor at play amid these 49 The actual bank lending rate for the Philippines is the weighted average interest rate charged by reporting commercial banks on loans and discounts granted during the period.
developments was the US Fed’s decision to maintain policy settings in June which provided a boost to emerging market assets. Moreover, the performance of the domestic financial market remained favorable compared to other countries in the region. Stock Market. The Philippine Stock Exchange index (PSEi) turned bullish in Q2 2016 as it rose by 9.3 percent to average 7,394.9 index points during the review period. Chart 28. Quarterly Average PSEi In basis points
3,000
4,000
5,000
6,000
7,000
8,000
9,000
Q12012
Q2 Q3 Q4 Q12013
Q2 Q3 Q4 Q12014
Q2 Q3 Q4 Q12015
Q2 Q3 Q4 Q12016
Q2
Source: Philippine Stock Exchange, BSP The benchmark index posted the highest gain in 13 months on 29 June at 7,798.5 index points, climbing by 12.1 percent, year-to-date.
Local stocks rally in the
second quarter to reach a
13-month high
Investors’ bearish sentiments in the preceding quarter turned bullish in Q2 2016 as risk appetite returned on the back of generally positive domestic developments. In April, Yellen’s dovish remarks before the Economic Club of New York coupled with Saudi Arabia and Russia’s agreement to freeze oil output ahead of the meeting in Doha in 17 April saw the local bourse rally early in the month. However, profit-taking moderated the uptick following China’s release of a slower economic growth for the first quarter and the failure of the 18-oil exporting nations to reach an agreement during production freeze-talks in Doha. In May, the BoJ’s surprise decision to hold off further stimulus into Japan’s economy and the

Q2 2016 Inflation Report | 26
continued deceleration in China’s manufacturing activity, coupled with domestic pre-election jitter weighed-in on investors. However, the conduct of a generally peaceful election on 9 May and President-elect Duterte’s assurance of economic policy continuity, combined with reports of the country’s robust GDP growth and strong domestic corporate earnings in the in the preceding two quarters helped boost the benchmark pass the 7,500 mark mid-month. Unfortunately, a hawkish signal from the minutes of US Fed’s April meeting tempered the recovery in end-May. In June, concerns over the appointment of an anti-mining advocate (Regina Paz “Gina” L. Lopez) as the Secretary of the Department of Environment and Natural Resources and the possible negative impact on the Philippine economy of the UK’s vote to exit from the EU further dampened investor sentiments. Nonetheless, optimism about the Philippine economy’s prospects under a new leadership, the BSP’s successful implementation of the new interest rate corridor system, and the successful conduct of the first IPO this year by Golden Haven Memorial Park, Inc.,50 combined with window dressing as the second quarter drew to a close, helped lift the index pass the 7,700 mark in the last month of the quarter. Improved investor risk appetite for local shares were similarly reflected in other stock indicators. Total market capitalization reached P15.3 trillion in end-June, higher by 9.4 percent quarter-on-quarter and by 4.5 percent year-on-year. Foreign investors’ remained net buyers of P27.0 billion worth of stocks during the quarter, a substantial improvement from the P3.5 billion net purchases posted in Q1. Data from Bloomberg similarly reflected an improvement in the domestic price-earnings ratio from an average of 20.1x in Q1 to an average of 21.8x in Q2. Government Securities. Results of the T-bill auctions conducted in Q2 2016 (April–June) continued to show robust demand for T-bills with total subscription for the quarter amounting to P99.0 billion, about 1.7 times the P60.0 billion total offered amount. The P39.0-billion oversubscription for the quarter was lower than the P75.5-billion oversubscription in the previous quarter. The Bureau of Treasury (BTr) decided to award in full bids for all tenors in auctions held during the 50 Golden Haven Memorial Park, Inc. is the death-care business of billionaire and former Senator Manuel B. Villar.
quarter, with the exceptions of the 182-day and 91-day tenors which were partially awarded during the 4-April and 2-May auctions, respectively, as the Auction Committee capped the increase in yields for the said tenors. The increase in rates reflected mainly markets’ cautiousness on the back of the upcoming interest rate corridor implementation of the BSP as well as concerns on the national election during the period. Chart 29. Total Oversubscription of T-bill Auctions
0
20
40
60
80
100
120
140
160
180
Q12012
Q2 Q3 Q4 Q12013
Q2 Q3 Q4 Q12014
Q2 Q3 Q4 Q12015
Q2 Q3 Q4 Q12016
Q2
Source: Bureau of the Treasury Sovereign Bond and CDS Spreads. In April, debt spreads narrowed as the global economic and financial environment remained calm. The market seems to have accepted a slower growth from China given the ongoing economic rebalancing, easing some of the worries of a China “hard landing.” The sentiment was generally positive especially for the emerging market economies which experienced substantial reflows of capital from non-resident investors. In May, debt spreads took a negative turnaround, as concerns on continued policy divergence among advanced economies with the US setting the stage for a rate hike in June while Europe and Japan remained on the easing side given worries over BREXIT and increasing signs of a sliding Japanese economy. The weak global growth prospects also added to market jitters. In June, heightened debt spreads remained as the issue on BREXIT was the key market mover for the month even overshadowing concerns over the rate hike in the US. Indeed, the decision of the British people to leave the European Union has generated a great deal of radical uncertainty across global markets. Yields continued to decrease as investors stayed cautious and away from high-risk assets and fled to safe havens amid global financial market volatility.

Q2 2016 Inflation Report | 27
By 30 June, the Philippines 5-year sovereign CDS stood at 112 bps, higher than the 104 bps in end 1Q but has remained lower than Indonesia’s 182 bps, Malaysia’s 153 bps. The EMBIG Philippines also ended the quarter wider at 113 bps compared to the previous quarter’s closing of 107 bps.
Debt spreads widen as
investors stay cautious
Chart 30. Quarterly Philippine Sovereign 5-Year CDS Spreads in basis points
0
50
100
150
200
250
Q12012
Q2 Q3 Q4 Q12013
Q2 Q3 Q4 Q12014
Q2 Q3 Q4 Q12015
Q2 Q3 Q4 Q12016
Q2
Philippines Indonesia Thailand Malaysia
110.3 bps 193.6 bps 121.5 bps 160.2 bps
Source: Bloomberg Chart 31. Quarterly JPMorgan EMBI+ Sovereign Bond Spreads in basis points
0
50
100
150
200
250
300
350
400
450
500
Q12012
Q2 Q3 Q4 Q12013
Q2 Q3 Q4 Q12014
Q2 Q3 Q4 Q12015
Q2 Q3 Q4 Q12016
Q2
EMBI+Philippines101.3 bps
EMBI+Global390.5 bps
Source: Bloomberg
Banking System The Philippine banking system continues to be resilient as it supports long-term economic growth. Banks’ balance sheets were marked by a steady growth in assets and deposits.
The Philippine banking system
posts steady growth in assets
and deposits
Asset quality indicators showed mix trends, while capital adequacy ratios remained above international standards, even with the implementation of the tighter Basel III framework. Savings Mobilization. Savings and demand deposits remained the primary sources of funds for the banking system. Banks’ total deposits51 as of end-May 2016 amounted to P7.5 trillion, 13.4 percent or P0.9 trillion higher than the year-ago level and 1.1 percent higher than end-March 2016 level. On a y-o-y basis, savings, demand, and time deposits expanded by 18.1 percent, 17.1 percent, and 1.4 percent respectively.52 Also, foreign currency deposits owned by residents (FCD-Residents) grew by 12.1 percent, y-o-y, to P1.5 trillion.53 Chart 32. Deposit Liabilities of Banks in billion pesos
0
1,000
2,000
3,000
4,000
5,000
6,000
7,000
8,000
Mar2012
Jun Sep Dec Mar2013
Jun Sep Dec Mar2014
Jun Sep Dec Mar2015
May Sep Dec Mar2016
May
Demand Savings Time
Source: BSP
51This refers to the total peso-denominated deposits of the banking system. 52Along with the savings, time and demand deposits, M3 includes currency in circulation and deposit substitutes. 53M4 is the sum of M3 and FCD-Residents. Along with savings, time and demand deposits, M3 includes currency in circulation and deposit substitutes.
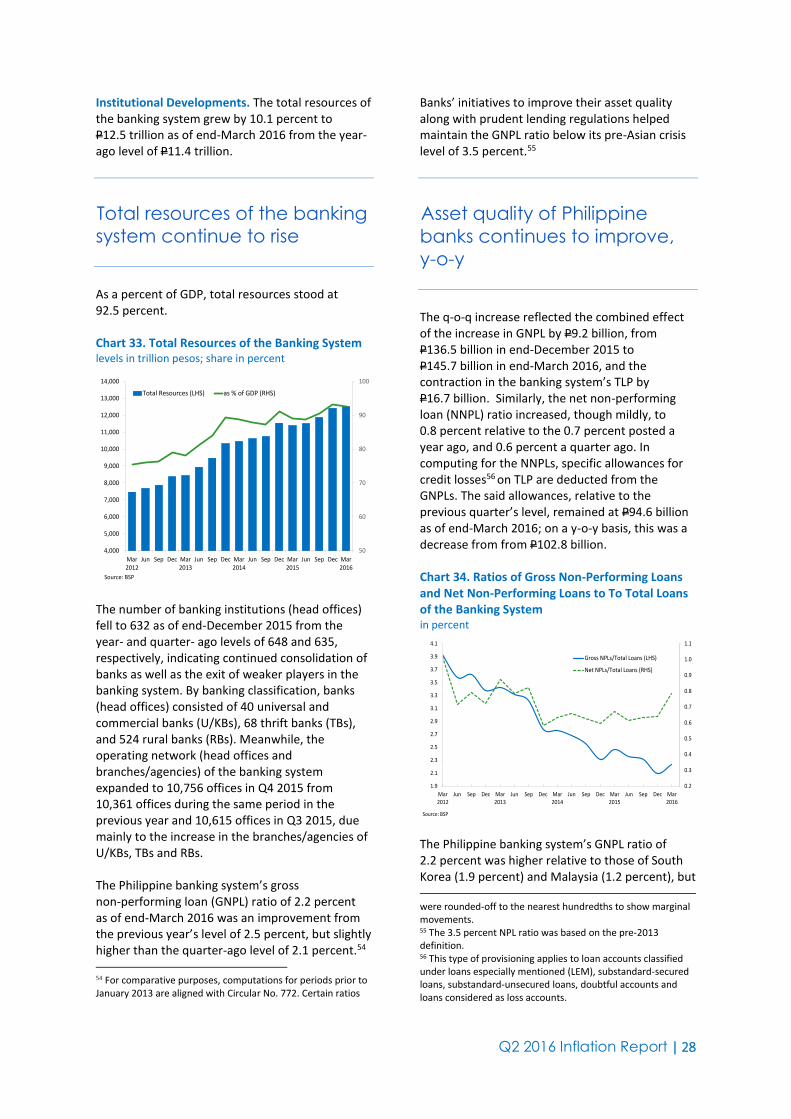
Q2 2016 Inflation Report | 28
Institutional Developments. The total resources of the banking system grew by 10.1 percent to P12.5 trillion as of end-March 2016 from the year-ago level of P11.4 trillion.
Total resources of the banking
system continue to rise
As a percent of GDP, total resources stood at 92.5 percent. Chart 33. Total Resources of the Banking System levels in trillion pesos; share in percent
50
60
70
80
90
100
4,000
5,000
6,000
7,000
8,000
9,000
10,000
11,000
12,000
13,000
14,000
Mar2012
Jun Sep Dec Mar2013
Jun Sep Dec Mar2014
Jun Sep Dec Mar2015
Jun Sep Dec Mar2016
Total Resources (LHS) as % of GDP (RHS)
Source: BSP The number of banking institutions (head offices) fell to 632 as of end-December 2015 from the year- and quarter- ago levels of 648 and 635, respectively, indicating continued consolidation of banks as well as the exit of weaker players in the banking system. By banking classification, banks (head offices) consisted of 40 universal and commercial banks (U/KBs), 68 thrift banks (TBs), and 524 rural banks (RBs). Meanwhile, the operating network (head offices and branches/agencies) of the banking system expanded to 10,756 offices in Q4 2015 from 10,361 offices during the same period in the previous year and 10,615 offices in Q3 2015, due mainly to the increase in the branches/agencies of U/KBs, TBs and RBs. The Philippine banking system’s gross non-performing loan (GNPL) ratio of 2.2 percent as of end-March 2016 was an improvement from the previous year’s level of 2.5 percent, but slightly higher than the quarter-ago level of 2.1 percent.54
54 For comparative purposes, computations for periods prior to January 2013 are aligned with Circular No. 772. Certain ratios
Banks’ initiatives to improve their asset quality along with prudent lending regulations helped maintain the GNPL ratio below its pre-Asian crisis level of 3.5 percent.55
Asset quality of Philippine
banks continues to improve,
y-o-y
The q-o-q increase reflected the combined effect of the increase in GNPL by P9.2 billion, from P136.5 billion in end-December 2015 to P145.7 billion in end-March 2016, and the contraction in the banking system’s TLP by P16.7 billion. Similarly, the net non-performing loan (NNPL) ratio increased, though mildly, to 0.8 percent relative to the 0.7 percent posted a year ago, and 0.6 percent a quarter ago. In computing for the NNPLs, specific allowances for credit losses56 on TLP are deducted from the GNPLs. The said allowances, relative to the previous quarter’s level, remained at P94.6 billion as of end-March 2016; on a y-o-y basis, this was a decrease from from P102.8 billion. Chart 34. Ratios of Gross Non-Performing Loans and Net Non-Performing Loans to To Total Loans of the Banking System in percent
0.2
0.3
0.4
0.5
0.6
0.7
0.8
0.9
1.0
1.1
1.9
2.1
2.3
2.5
2.7
2.9
3.1
3.3
3.5
3.7
3.9
4.1
Mar2012
Jun Sep Dec Mar2013
Jun Sep Dec Mar2014
Jun Sep Dec Mar2015
Jun Sep Dec Mar2016
Gross NPLs/Total Loans (LHS)
Net NPLs/Total Loans (RHS)
Source: BSP The Philippine banking system’s GNPL ratio of 2.2 percent was higher relative to those of South Korea (1.9 percent) and Malaysia (1.2 percent), but were rounded-off to the nearest hundredths to show marginal movements. 55 The 3.5 percent NPL ratio was based on the pre-2013 definition. 56 This type of provisioning applies to loan accounts classified under loans especially mentioned (LEM), substandard-secured loans, substandard-unsecured loans, doubtful accounts and loans considered as loss accounts.

Q2 2016 Inflation Report | 29
lower than Indonesia (2.7 percent) and Thailand (2.6 percent).57 The loan exposures of banks remained adequately covered as the banking system registered an NPL coverage ratio of 112.5 percent in end-March 2016. This coverage ratio was lower than 116.4 percent registered a year ago and 118.4 percent posted in end-December 2015. The decrease in the coverage ratio was due to the build-up in NPL and only marginal increase in loan loss provisions. Compliance with the BSP capital framework for U/KBs under the Basel III framework58 took effect on 1 January 2014. The new Basel III regime incorporates adjustments to the treatment of bank capital in ways that enhance the use of the CAR as a prudential measure.
Banks maintain high levels of
CAR amidst tighter capital
requirements
The capital adequacy ratio (CAR) of universal and commercial banks (U/KBs) stood at 15.6 percent on solo basis and 16.4 percent on consolidated basis at the end of the third quarter in 2015. These figures are well-above the BSP regulatory threshold of 10.0 percent and international minimum of 8.0 percent. The banks’ latest CAR on solo basis rose quarter-on-quarter from the 15.5 percent posted at end-June last year. On the other hand, U/KBs’ CAR on consolidated basis at end-September last year slightly declined from the 16.4 posted a quarter earlier. The industry’s capitalization remains predominantly composed of Common Equity Tier 1 (CET 1), the highest quality among instruments 57 Sources: IMF and financial stability reports, Indonesia (Banks’ Nonperforming Loans to Gross Loans Ratio, Q1 2016); Malaysia (Banking System’s Net Impaired Loans, Q1 2016); Thailand (Total Financial Institutions’ Gross NPLs, Q1 2016); and South Korea (Domestic Banks’ Substandard or Below Loans, Q1 2016). 58 Basel III no longer counts towards “bank capital” those Basel II-compliant capital instruments that do not have the feature of loss absorbency. Loss absorbency refers to the ability of bank-eligible capital instruments other than common equity to behave and act in the same way as common equity shares at the point where the bank takes losses and becomes non-viable. In addition, Basel III now deducts from capital the investments of banks in non-allied undertakings, defined benefit pension fund assets, goodwill and other intangible assets.
eligible as bank capital. The CET 1 of U/KBs increased quarter-on-quarter to 13.0 percent and 13.9 percent of risk weighted assets (RWA) from 12.9 percent and 13.9 percent last quarter on both solo and consolidated bases, respectively. Their Tier 1 ratio also grew to 13.2 percent and 14.1 percent from 13.1 percent and 14.1 percent last quarter on both solo and consolidated bases, respectively. Tier 1 is composed of common equity and qualified capital instruments. Both CET 1 and Tier 1 ratios of U/KBs were also above the BSP thresholds of 6.0 percent and 7.5 percent, respectively. Said capital ratios increased amid the U/KBs’ profitable operations and issuance of new shares as well as the infusion of foreign bank capital. The CAR of U/KBs on a consolidated basis at 16.4 percent was higher than South Korea (14.0 percent), but lower than Indonesia (20.6 percent), Thailand (17.8 percent), and Malaysia (16.5 percent).59
Exchange Rate The peso appreciated against the US dollar in Q2 2016. On a quarter-on-quarter basis, the peso strengthened by 1.7 percent to average P46.52/US$1 from the previous quarter’s average of P47.29/US$1. On a year-on-year basis, the peso depreciated by 4.0 percent relative to the P44.67/US$1 average in the second quarter of 2015.60
Peso strengthens on
protracted uncertainty on the
pace of US rate hike
The recovery of the peso during the review quarter was due to protracted uncertainty on the pace of interest rate hike this year and concerns on the Brexit which drove fund flows to emerging markets, including the Philippines. 59 Sources: IMF and financial stability reports, Indonesia (Banks, Regulatory Capital to Risk-Weighted Assets Ratio Q1 2016); Thailand (Commercial Banks’ Capital Funds Percentage of Risk Assets, April 2016); Malaysia (Banking System’s Total Capital Ratio, Q1 2016); and South Korea (Domestic Banks’ Capital Ratio, Q1 2016). 60 Dollar rates or the reciprocal of the peso-dollar rates were used to compute for the percentage change.

Q2 2016 Inflation Report | 30
Chart 35. Quarterly Peso-Dollar Rate PHp/US$
39
40
41
42
43
44
45
46
47
48
Q12012
Q2 Q3 Q4 Q12013
Q2 Q3 Q4 Q12014
Q2 Q3 Q4 Q12015
Q2 Q3 Q4 Q12016
Q2
Source: Reference Exchange Rate Bulletin, Treasury Department, BSP In April 2016, the peso strengthened against the US dollar by 0.9 percent to average P46.29/US$1 from the previous month's P46.72/US$1 average on account of protracted uncertainty on the pace of US interest rate hike this year, following weak inflation data in the US, which triggered risk-on sentiment towards emerging market currencies.61 In May, the peso depreciated against the US dollar by 1.1 percent to average P46.80/US$1 on account of hawkish statement from the US Fed of an interest-rate hike in the near term and the upward revision of the first quarter US GDP, which boosted sentiments towards the US dollar. In June, the trend of the peso reversed anew as it appreciated by 0.7 percent to average P46.46/US$1 as the US Fed maintained their key policy rates and concerns over Brexit resulted in fund inflows to emerging markets. Overall, the sustained inflows of foreign exchange from overseas Filipino remittances, foreign direct and portfolio investments, BPO and tourism receipts, as well as the ample level of the country’s gross international reserves and the country’s robust economic growth continued to provide stability to the peso.62
On a year-to-date (ytd) basis, the peso/dollar exchange rate closed at P46.07/US$1 on 30 June 2016, the same level as the closing rate in 29 December 2015. Meanwhile, most Asian currencies appreciated against the US dollar (ytd) except the Chinese yuan and Indian rupee.63 61 The Consumer Price Index in the United States increased 0.10 percent in March of 2016 as a drop in grocery prices offset higher energy costs. (Source: US Bureau of Labor Statistics) 62 GIR stood at US$82.9 billion as of end-May 2016 (revised).
63 Based on the last done deal transaction in the afternoon.
Table 15. Year-to-Date Changes in Selected Dollar Rates appreciation/(-depreciation); in percent
2012 2013 2014 2015 2016*
Singaporean Dollar 6.1 -2.7 -4.5 -6.0 5.1
Japanese Yen -10.9 -16.3 -12.5 -0.5 17.1
Thai Baht (Onshore) 3.0 -4.6 -0.7 -8.9 2.4
Chinese Yuan 1.0 2.6 -2.7 -4.3 -2.3
Philippine Peso 6.8 -7.0 -0.7 -5.0 0.0
New Taiwan Dollar 4.3 -1.9 -6.2 -3.6 1.9
Malaysian Ringgit 3.5 -5.5 -6.3 -18.6 6.6
Korean Won 7.7 1.1 -4.3 -6.6 1.9
Indonesian Rupiah -5.9 -19.1 -2.1 -9.8 4.6
Indian Rupee -3.1 -11.4 -2.9 -4.9 -2.0Notes :
- Negative va lue represents depreciation of the currency against the US dol lar.
- YTD changes are computed as the percent change between the clos ing prices for
the year indicated versus the clos ing prices for the preceding year (i .e., clos ing
prices are based on Bloomberg data as of 31 December except for the Phi l ippine
peso which used clos ing price for the last trading day of the year).
*Based on Bloomberg data as of 4:00 p.m., 30 June 2016 Meanwhile, volatility, as measured by the coefficient of variation (COV) of the peso’s daily closing rates stood at 0.73 percent during the second quarter of 2016, lower compared with the 1.15 percent in the previous quarter.64 On a real trade-weighted basis, the peso gained external price competitiveness, for the period April to May 2016, against the basket of currencies of all trading partners (TPI), trading partners in advanced (TPI-A) and developing countries (TPI-D) as the real effective exchange rate (REER) index of the peso decreased by 1.7 percent, 3.4 percent, and 0.3 percent, respectively, relative to the first quarter of 2016. Behind this development were the combined effects of the nominal depreciation of the peso and the narrowing inflation differential against these currency baskets.65,66
64 The coefficient of variation is computed as the standard deviation of the daily closing exchange rate divided by the average exchange rates for the period. 65 The Trading Partners Index (TPI) measures the nominal and real effective exchange rates of the peso across the currencies of 14 major trading partners of the Philippines, which includes US, Euro Area, Japan, Australia, China, Singapore, South Korea, Hong Kong, Malaysia, Taiwan, Indonesia, Saudi Arabia, United Arab Emirates, and Thailand. The TPI-Advanced measures the effective exchange rates of the peso across currencies of trading partners in advanced countries comprising of the US, Japan, Euro Area, and Australia. The TPI-Developing measures the effective exchange rates of the peso across 10 currencies of partner developing countries which includes China, Singapore, South Korea, Hong Kong, Malaysia, Taiwan, Indonesia, Saudi Arabia, United Arab Emirates, and Thailand. 66 The REER index represents the Nominal Effective Exchange Rate (NEER) index of the peso, adjusted for inflation rate differentials with the countries whose currencies comprise the NEER index basket. A decrease in the REER index indicates some gain in the external price competitiveness of the peso, while a significant increase indicates the opposite. The NEER index, meanwhile, represents the weighted average exchange rate of the peso vis-à-vis a basket of foreign currencies.

Q2 2016 Inflation Report | 31
Relative to the second quarter of 2015, the peso likewise gained external price competitiveness against the TPI, TPI-A, and TPI-D baskets for the period April to May 2016. This developed as the nominal depreciation of the peso offset the impact of widening inflation differential, resulting to a decrease in the REER index of the peso by 3.4 percent, 7.1 percent, and 0.7 percent against the TPI, TPI-A, and TPI-D baskets, respectively.
III. Fiscal developments The National Government (NG) recorded a deficit of P57.5 billion for the period January - April 2016, 401.0 percent lower than what was incurred in the same period in 2015.
NG posts lower deficit as of
end-April 2016
Netting out the interest payments in NG expenditures, the primary deficit amounted to P59.9 billion, a reversal of the P135.4 billion primary surplus recorded in the same period a year ago. Table 16. National Government Fiscal Performance in billion pesos
Jan-Mar Jan-Apr Jan-Mar Jan-Apr Jan-Mar Jan-Apr
Surplus/(Deficit) -33.5 19.1 -112.5 -57.5 235.6 -401.2 -99.6 112.9
Revenues 470.5 679.6 479.0 725.6 1.8 6.8 573.7 83.5
Expenditures 504.0 660.6 591.5 783.1 17.3 18.5 673.3 87.8
Q1 2016
Program
Percentage
Share to
Q1 2016
Program
Growth Rate (in percent)
* Totals may not add up due to rounding
Source: Bureau of the Treasury (BTr)
20162015
Revenues increased by 6.8 percent to P725.6 billion for the period January - April 2016 compared to P679.6 billion in the same period in 2015. The Bureau of Internal Revenue contributed P507.86 billion, representing an increase of 8.5 percent. Meanwhile, the Bureau of the Treasury and the Bureau of Customs contributed P52.9 billion and P123.2 billion, which represented a year-on-year decrease of 6.9 percent and 2.3 percent, respectively, compared to their levels a year ago.
Expenditures for the quarter in review amounted to P783.1 billion, 18.5 percent higher than the expenditures in the same period in 2015. Excluding interest payments, expenditures went up by 22.3 percent to P665.7` billion. Meanwhile, interest payment was P1.1 billion higher compared to its year-ago level, reaching P117.4 billion in January - April 2016.

Q2 2016 Inflation Report | 32
IV. External Developments The JP Morgan Global All-Industry Output Index eased to 51.1 in May from 51.6 in April as output growth slowed in the service sector while manufacturing production stagnated.
Global economic growth
remains tepid
Most of the world’s major economies, including the US, China, and core euro area nations, registered mild increases in output. By contrast, economic activity eased further in Japan, while the severe downturn in Brazil continued.67 Chart 36. JP Morgan Global All-Industry Output Index index points
48
49
50
51
52
53
54
55
56
Q12013
Q2 Q3 Q4 Q12014
Q2 Q3 Q4 Q12015
Q2 Q3 Q4 Q12016
Q2(May)
Source: Markit Economics USA. Real GDP increased by 0.8 percent on a seasonally adjusted q-o-q basis in Q1 2016 after expanding by 1.4 percent in the previous quarter. On a y-o-y basis, real output growth was broadly steady at 2.0 percent in Q1 2016 from the same rate in Q4 2015. The slower q-o-q expansion during the quarter reflected a larger decrease in nonresidential fixed investment, a deceleration in personal consumption expenditures, and a downturn in federal government spending.68 67JP Morgan Global Manufacturing & Services PMI, http://www.markiteconomics.com/ 68US Bureau of Economic Analysis, “National Income and Product Accounts Gross Domestic Product: First Quarter 2016 (Second Estimate),” news release, 27 May 2016. http://www.bea.gov/newsreleases/national/gdp/2016/pdf/gdp1q16_2nd.pdf
Growth in the US economy
holds firm
Meanwhile, the manufacturing PMI rose to 51.3 in May from 50.8 in April as new orders and production continued to expand, albeit at a slightly slower pace.69 Panel respondents likewise continued to observe stable business conditions, with demand seen as broadly steady. Inflation on a y-o-y basis eased to 1.0 percent in May from 1.1 percent in April due to the decrease in the index for food. Meanwhile, unemployment declined to 4.7 percent in May from 5.0 percent in April. Total nonfarm payroll employment increased by only 38,000 during the month, with gains noted in health care. Job losses were recorded in mining, and employment in the information sector decreased due to a labor strike. Consumer confidence remained broadly buoyant, although consumers continued to be cautious about the outlook for business and labor market conditions. The Conference Board Consumer Confidence Index eased to 92.6 in May from 94.7 in April,70 while the Thomson-Reuters/University of Michigan Index of Consumer Sentiment rose to 94.7 in May from 89.0 in April.71 Euro Area. On a q-o-q basis, real GDP grew by 0.6 percent in Q1 2016, slightly faster than the 0.4-percent growth in Q4 2015. On a y-o-y basis, real GDP growth was broadly stable at 1.7 percent in Q1 2016 from the same rate in the previous quarter.72 Meanwhile, the composite PMI for the euro area eased to 52.8 in June from 53.1 in May amid signs of political and economic uncertainty. Nonetheless, demand was seen to be growing at a robust pace, with the rise in work backlogs prompting stronger rates of job creation.73 69Institute for Supply Management, “May Manufacturing ISM Report On Business”, 1 June 2016, https://www.instituteforsupplymanagement.org 70The Conference Board, “The Conference Board Consumer Confidence Declined Again in May.” 31 May 2016. http://www.conference-board.org/ 71University of Michigan Survey of Consumers, “Renewed strength in personal finances,” 27 May 2016. http://www.sca.isr.umich.edu/ 72Eurostat news release 111/2016 dated 7 June 2016. 73 Markit Flash Eurozone PMI, http://www.markiteconomics.com/
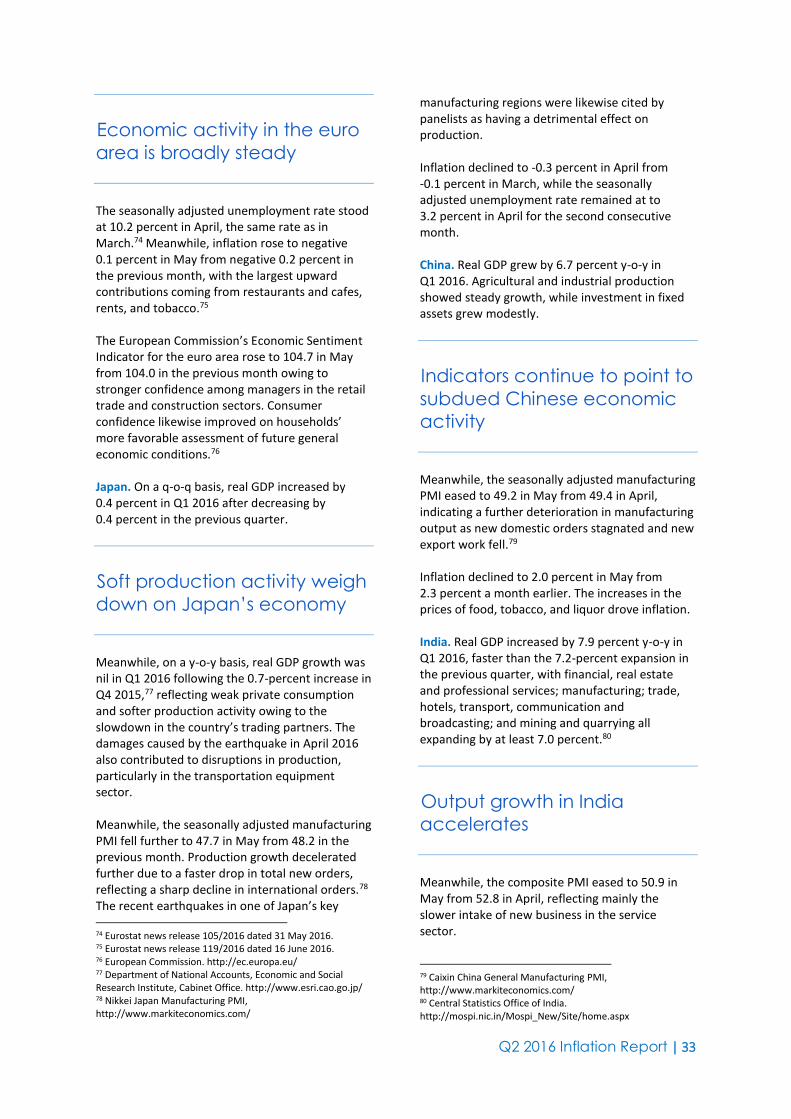
Q2 2016 Inflation Report | 33
Economic activity in the euro
area is broadly steady
The seasonally adjusted unemployment rate stood at 10.2 percent in April, the same rate as in March.74 Meanwhile, inflation rose to negative 0.1 percent in May from negative 0.2 percent in the previous month, with the largest upward contributions coming from restaurants and cafes, rents, and tobacco.75 The European Commission’s Economic Sentiment Indicator for the euro area rose to 104.7 in May from 104.0 in the previous month owing to stronger confidence among managers in the retail trade and construction sectors. Consumer confidence likewise improved on households’ more favorable assessment of future general economic conditions.76 Japan. On a q-o-q basis, real GDP increased by 0.4 percent in Q1 2016 after decreasing by 0.4 percent in the previous quarter.
Soft production activity weigh
down on Japan’s economy
Meanwhile, on a y-o-y basis, real GDP growth was nil in Q1 2016 following the 0.7-percent increase in Q4 2015,77 reflecting weak private consumption and softer production activity owing to the slowdown in the country’s trading partners. The damages caused by the earthquake in April 2016 also contributed to disruptions in production, particularly in the transportation equipment sector. Meanwhile, the seasonally adjusted manufacturing PMI fell further to 47.7 in May from 48.2 in the previous month. Production growth decelerated further due to a faster drop in total new orders, reflecting a sharp decline in international orders.78 The recent earthquakes in one of Japan’s key 74 Eurostat news release 105/2016 dated 31 May 2016. 75 Eurostat news release 119/2016 dated 16 June 2016. 76 European Commission. http://ec.europa.eu/ 77 Department of National Accounts, Economic and Social Research Institute, Cabinet Office. http://www.esri.cao.go.jp/ 78 Nikkei Japan Manufacturing PMI, http://www.markiteconomics.com/
manufacturing regions were likewise cited by panelists as having a detrimental effect on production. Inflation declined to -0.3 percent in April from -0.1 percent in March, while the seasonally adjusted unemployment rate remained at to 3.2 percent in April for the second consecutive month. China. Real GDP grew by 6.7 percent y-o-y in Q1 2016. Agricultural and industrial production showed steady growth, while investment in fixed assets grew modestly.
Indicators continue to point to
subdued Chinese economic
activity
Meanwhile, the seasonally adjusted manufacturing PMI eased to 49.2 in May from 49.4 in April, indicating a further deterioration in manufacturing output as new domestic orders stagnated and new export work fell.79 Inflation declined to 2.0 percent in May from 2.3 percent a month earlier. The increases in the prices of food, tobacco, and liquor drove inflation. India. Real GDP increased by 7.9 percent y-o-y in Q1 2016, faster than the 7.2-percent expansion in the previous quarter, with financial, real estate and professional services; manufacturing; trade, hotels, transport, communication and broadcasting; and mining and quarrying all expanding by at least 7.0 percent.80
Output growth in India
accelerates
Meanwhile, the composite PMI eased to 50.9 in May from 52.8 in April, reflecting mainly the slower intake of new business in the service sector.
79 Caixin China General Manufacturing PMI, http://www.markiteconomics.com/ 80 Central Statistics Office of India. http://mospi.nic.in/Mospi_New/Site/home.aspx
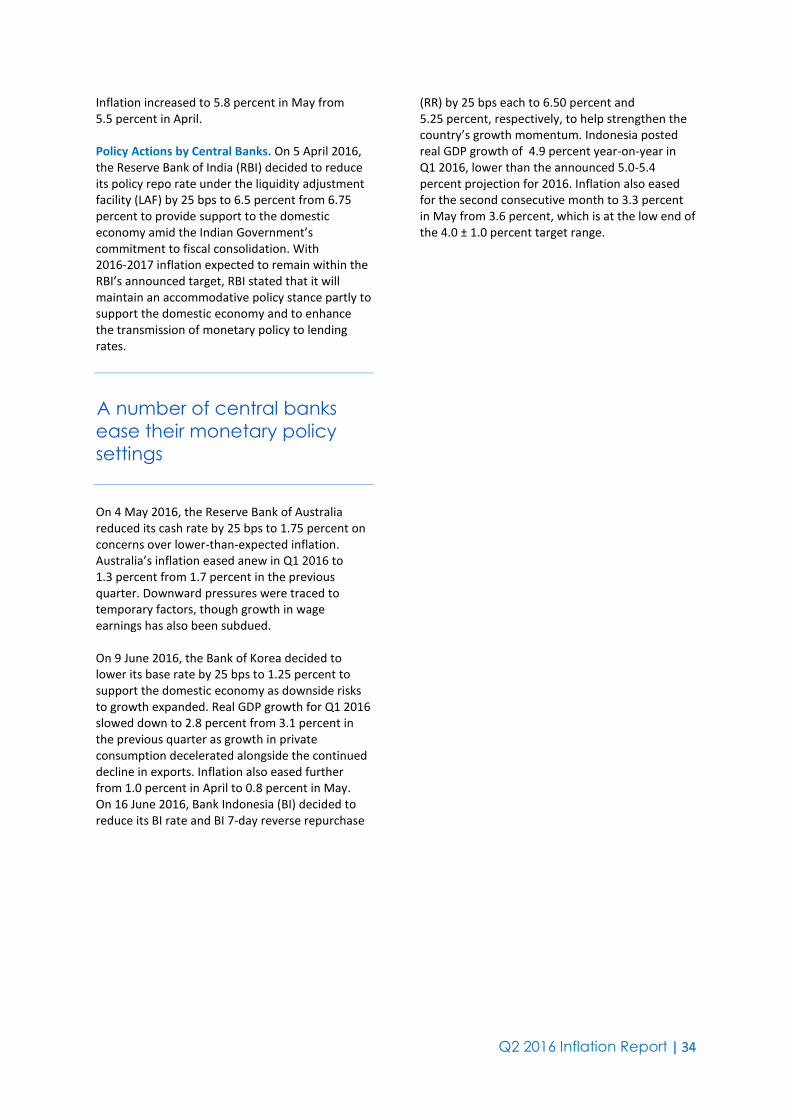
Q2 2016 Inflation Report | 34
Inflation increased to 5.8 percent in May from 5.5 percent in April. Policy Actions by Central Banks. On 5 April 2016, the Reserve Bank of India (RBI) decided to reduce its policy repo rate under the liquidity adjustment facility (LAF) by 25 bps to 6.5 percent from 6.75 percent to provide support to the domestic economy amid the Indian Government’s commitment to fiscal consolidation. With 2016-2017 inflation expected to remain within the RBI’s announced target, RBI stated that it will maintain an accommodative policy stance partly to support the domestic economy and to enhance the transmission of monetary policy to lending rates.
A number of central banks
ease their monetary policy
settings
On 4 May 2016, the Reserve Bank of Australia reduced its cash rate by 25 bps to 1.75 percent on concerns over lower-than-expected inflation. Australia’s inflation eased anew in Q1 2016 to 1.3 percent from 1.7 percent in the previous quarter. Downward pressures were traced to temporary factors, though growth in wage earnings has also been subdued. On 9 June 2016, the Bank of Korea decided to lower its base rate by 25 bps to 1.25 percent to support the domestic economy as downside risks to growth expanded. Real GDP growth for Q1 2016 slowed down to 2.8 percent from 3.1 percent in the previous quarter as growth in private consumption decelerated alongside the continued decline in exports. Inflation also eased further from 1.0 percent in April to 0.8 percent in May. On 16 June 2016, Bank Indonesia (BI) decided to reduce its BI rate and BI 7-day reverse repurchase
(RR) by 25 bps each to 6.50 percent and 5.25 percent, respectively, to help strengthen the country’s growth momentum. Indonesia posted real GDP growth of 4.9 percent year-on-year in Q1 2016, lower than the announced 5.0-5.4 percent projection for 2016. Inflation also eased for the second consecutive month to 3.3 percent in May from 3.6 percent, which is at the low end of the 4.0 ± 1.0 percent target range.

Q2 2016 Inflation Report | 35
V. Monetary Policy Developments At its monetary policy meetings during the quarter (on 23 June and 12 May), the BSP decided to maintain its key policy interest rate for the overnight reverse repurchase or RRP facility. The interest rates for other monetary policy instruments were also kept steady. Similarly, the reserve requirement ratios were left unchanged.
The BSP maintains monetary
policy settings in Q2 2016 but
undertook operational
adjustments in monetary
operations
At the same time, on 3 June 2016, the BSP also made a formal shift in its monetary operations to an interest rate corridor (IRC) system. The system for monetary operations was modified to consist of the following: overnight liquidity facilities, namely, the overnight lending facility (OLF) and the overnight deposit facility (ODF); the overnight RRP facility; and a term deposit facility (TDF). The interest rates for these facilities were recalibrated as follows:
3.5 percent in the overnight lending facility
(a reduction in the upper bound of the corridor from the overnight RP rate of 6.0 percent);
3.0 percent in the overnight RRP rate (an adjustment from 4.0 percent); and
2.5 percent in the overnight deposit facility (no change from the SDA rate).
The adjustments in the BSP’s key interest rates under the IRC reform were primarily operational in nature and were not expected to materially affect prevailing monetary policy settings. Nevertheless, the BSP’s policy decisions during the quarter were based on its assessment that the inflation environment continued to be manageable. Forecasts as of the 23 June and 12 May meetings indicate that average inflation is likely to settle near the lower edge of the 3.0 percent ± 1.0 percentage point target range in 2016 and rise toward the mid-point of the target
range in 2017 and 2018, while inflation expectations remain firmly within the inflation target band over the policy horizon. Chart 37. BSP Policy Rates in percent
0
1
2
3
4
5
6
7
Jan
20
12
Fe
bM
ar
Ap
rM
ay
Jun
Jul
Au
gS
ep
Oct
No
vD
ec
Jan
20
13
Fe
bM
ar
Ap
rM
ay
Jun
Jul
Au
gS
ep
Oct
No
vD
ec
Jan
20
14
Fe
bM
ar
Ap
rM
ay
Jun
Jul
Au
gS
ep
Oct
No
vD
ec
Jan
20
15
Fe
bM
ar
Ap
rM
ay
Jun
Jul
Au
gS
ep
Oct
No
vD
ec
Jan
20
16
Fe
bM
ar
Ap
rM
ay
Jun
Overnight RRP Rate Overnight RP Rate SDA rate
Source: BSP The BSP also noted that the risks surrounding the inflation outlook to be broadly balanced. With global oil prices recovering, the risk of second-round effects from lower oil prices is likely to recede in the period ahead. Nevertheless, slower global economic activity remains a key downside risk to the inflation outlook. Given improved rainfall conditions and the shift to neutral weather conditions in the May-July period, the upside risks to food and utility prices due to El Niño are also seen to recede in the coming months. However, pending petitions for adjustments in electricity rates remain an upside risk to inflation. The BSP observed that domestic economic activity are likely to stay firm, supported by solid private household consumption and investment, buoyant business and consumer sentiment, and adequate credit and domestic liquidity. Higher fiscal spending is also expected to further boost the domestic demand. On balance, therefore, the sum of new information, particularly on the emerging outlook for inflation and demand conditions, continues to support keeping monetary policy unchanged. At the same time, the continued uncertainty relating to monetary policy prospects in major advanced economies requires a steady hand on policy settings in order to retain flexibility in the period ahead.
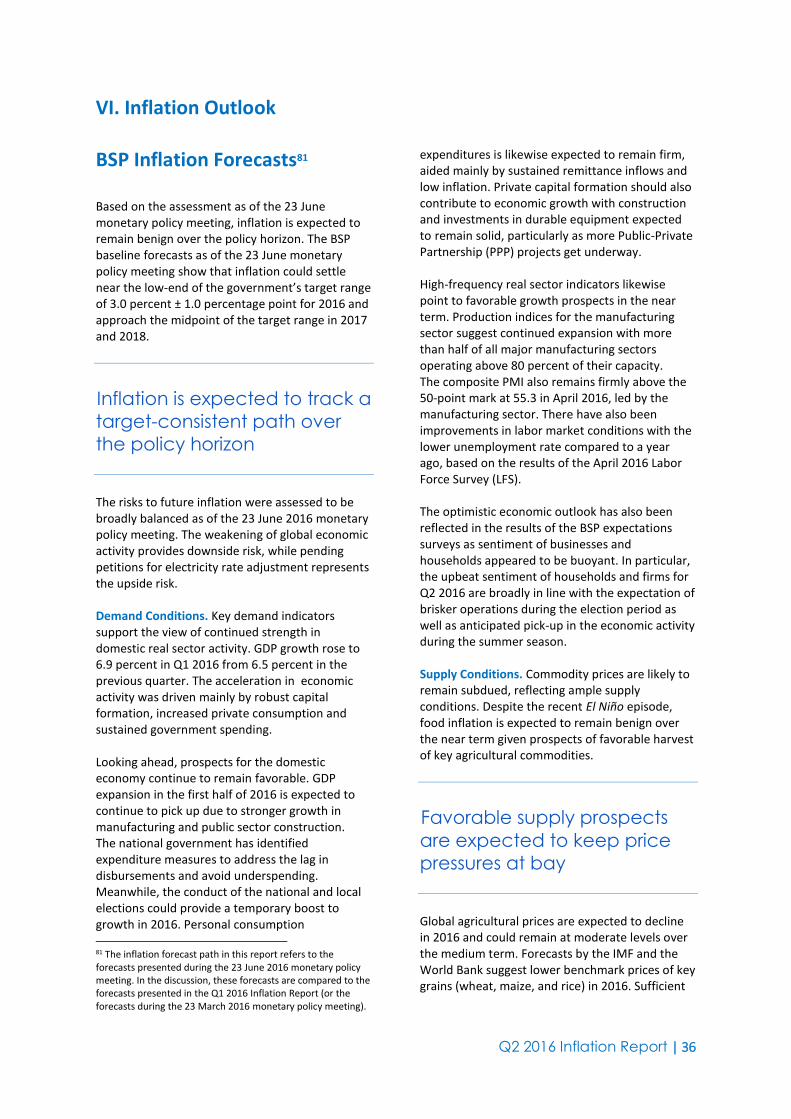
Q2 2016 Inflation Report | 36
VI. Inflation Outlook BSP Inflation Forecasts81 Based on the assessment as of the 23 June monetary policy meeting, inflation is expected to remain benign over the policy horizon. The BSP baseline forecasts as of the 23 June monetary policy meeting show that inflation could settle near the low-end of the government’s target range of 3.0 percent ± 1.0 percentage point for 2016 and approach the midpoint of the target range in 2017 and 2018.
Inflation is expected to track a
target-consistent path over
the policy horizon
The risks to future inflation were assessed to be broadly balanced as of the 23 June 2016 monetary policy meeting. The weakening of global economic activity provides downside risk, while pending petitions for electricity rate adjustment represents the upside risk. Demand Conditions. Key demand indicators support the view of continued strength in domestic real sector activity. GDP growth rose to 6.9 percent in Q1 2016 from 6.5 percent in the previous quarter. The acceleration in economic activity was driven mainly by robust capital formation, increased private consumption and sustained government spending. Looking ahead, prospects for the domestic economy continue to remain favorable. GDP expansion in the first half of 2016 is expected to continue to pick up due to stronger growth in manufacturing and public sector construction. The national government has identified expenditure measures to address the lag in disbursements and avoid underspending. Meanwhile, the conduct of the national and local elections could provide a temporary boost to growth in 2016. Personal consumption 81 The inflation forecast path in this report refers to the forecasts presented during the 23 June 2016 monetary policy meeting. In the discussion, these forecasts are compared to the forecasts presented in the Q1 2016 Inflation Report (or the forecasts during the 23 March 2016 monetary policy meeting).
expenditures is likewise expected to remain firm, aided mainly by sustained remittance inflows and low inflation. Private capital formation should also contribute to economic growth with construction and investments in durable equipment expected to remain solid, particularly as more Public-Private Partnership (PPP) projects get underway. High-frequency real sector indicators likewise point to favorable growth prospects in the near term. Production indices for the manufacturing sector suggest continued expansion with more than half of all major manufacturing sectors operating above 80 percent of their capacity. The composite PMI also remains firmly above the 50-point mark at 55.3 in April 2016, led by the manufacturing sector. There have also been improvements in labor market conditions with the lower unemployment rate compared to a year ago, based on the results of the April 2016 Labor Force Survey (LFS). The optimistic economic outlook has also been reflected in the results of the BSP expectations surveys as sentiment of businesses and households appeared to be buoyant. In particular, the upbeat sentiment of households and firms for Q2 2016 are broadly in line with the expectation of brisker operations during the election period as well as anticipated pick-up in the economic activity during the summer season. Supply Conditions. Commodity prices are likely to remain subdued, reflecting ample supply conditions. Despite the recent El Niño episode, food inflation is expected to remain benign over the near term given prospects of favorable harvest of key agricultural commodities.
Favorable supply prospects
are expected to keep price
pressures at bay
Global agricultural prices are expected to decline in 2016 and could remain at moderate levels over the medium term. Forecasts by the IMF and the World Bank suggest lower benchmark prices of key grains (wheat, maize, and rice) in 2016. Sufficient

Q2 2016 Inflation Report | 37
supply conditions should keep food price pressures at bay. 82,83 On the domestic front, palay and corn production could decline by 5.8 percent and 10.2 percent, respectively, in the second quarter of 2016 due to insufficient rainfall and dry spell conditions. However, palay and corn production in the third quarter of 2016 could expand by 24.7 percent and 10.4 percent, respectively, based on farmers’ planting intentions. 84 International oil prices inched up compared to the previous quarter’s level. The upward trend in crude oil prices could be traced mainly to prospects of pickup in global oil consumption, slowdown in crude oil production, and increase in oil supply outages. Nonetheless, international oil prices are likely to remain below the historical average as suggested by futures prices of oil and forecasts by multilateral agencies, with projected modest gains over the medium term. Forecast by the EIA suggests that Brent crude oil price could average at US$43.03 per barrel in 2016. Meanwhile, IMF and World Bank expect crude oil prices to average at US$43.92 per barrel and US$41.00 per barrel in 2016, respectively. However, there remains substantial uncertainty in the global oil price outlook. On the one hand, world oil supply could continue to outstrip demand in the near term given firm supply from OPEC countries and the impact of Iran’s additional production with its re-entry in the global oil market, combined with weak oil demand growth. On the other hand, potential agreement between several OPEC and major non-OPEC producers, such as Russia, to freeze production levels and the accelerating pace in the reduction of US rig counts could support a recovery in global crude oil prices. 85,86
The balance of demand and supply conditions as captured by the output gap (or the difference between actual and potential output), provides an 82 IMF, Commodity Price Outlook and Risks, May 2016, available online at http://www.imf.org 83 World Bank, Commodity Markets Outlook, April 2016, available online at http://www.worldbank.org 84 PSA, Rice and Corn Situation Outlook, April 2016, available online at http://www.agstat.psa.gov.ph 85 IMF, Commodity Price Outlook and Risks, 31 May 2016, available online at http://www.imf.org 86 EIA, Short-Term Energy Outlook, 7 June 2016, available online at http://www.eia.gov
indication of potential inflationary pressures in the near term. 87
Output gap estimate narrows
Based on the latest GDP data, preliminary estimates by the BSP show a lower positive output gap in Q1 2016 relative to the previous quarter. The output gap narrowed as the q‐o‐q expansion in estimated potential output outpaced actual output growth during the review period.88 Key assumptions used to generate the BSP’s inflation forecasts. The BSP's baseline inflation forecasts generated as of the 23 June 2016 monetary policy meeting from the BSP’s single equation model (SEM) and the multi‐equation model (MEM) are based on the following assumptions: 1) BSP’s overnight RRP rate at 3.00 percent from
July 2016 to December 2018; 2) BSP’s reserve requirement at 20.0 percent
from July 2016 to December 2018; 3) NG fiscal deficits for 2016 to 2018, which are
consistent with the DBCC-approved estimates; 4) Dubai crude oil price assumptions, the trend
of which is consistent with the trend of futures prices of oil in the international market;
5) Increase in nominal wage in June 2017 and June 2018 based on historical wage increases;
6) Real GDP growth is endogenously determined; and
7) Foreign exchange rate is endogenously determined through the purchasing power parity and interest rate parity relationships.
87 Inflation tends to rise (fall) when demand for goods and services exert pressure on the economy’s ability to produce goods and services, i.e., when the output gap is positive (negative). 88 Based on the seasonally-adjusted GDP growth

Q2 2016 Inflation Report | 38
Risks to the Inflation Outlook The risks to the inflation outlook may be presented graphically through a fan chart. The fan chart depicts the probability of different inflation outcomes based on the central projection (corresponding to the baseline forecast of the BSP) and the risks surrounding the inflation outlook.
Compared with the previous
report, the latest projected
inflation path is slightly lower
for 2016 and 2017
Compared to the previous inflation report, the latest fan chart presents a slight downward shift in the inflation projections for 2016 and 2017, and extends up to 2018. For the latest forecast round, the uptick in international and domestic oil prices during the quarter was offset by the lower world growth assumptions as well as the stronger peso. The BSP’s review of current price trends suggests that the risks surrounding the inflation outlook appear to be broadly balanced. This assessment is depicted in the latest fan chart wherein the projection bands below the central projection are equal to the bands above it. Slower global economic activity poses a downside risk. Meanwhile, pending petitions for adjustments in electricity rates is the upside risk to inflation. The possibility of a further slowdown in global economic growth could imply weaker demand-related price pressures as well as further uncertainties in the global oil market. The disorderly capital outflows in emerging markets, international spillovers from the rebalancing in China, increased fiscal strain in oil-exporting countries, impact of tighter financial conditions and heightened volatility on confidence, prolonged recessions in key emerging markets, intensification of geopolitical risks, and the UK’s exit from the EU are potential sources of downside risks to global growth prospects.89 89 IMF, World Economic Outlook, April 2016, available online at http://www.imf.org
The risks to inflation outlook
appear to be broadly
balanced
Meanwhile, the pending petition of Meralco with regards to the December 2013 rate adjustment, which is still under the temporary restraining order of the Supreme Court, also continues to pose an upside risk to the inflation outlook. Chart 38. Inflation Projection Source: BSP estimates
The fan chart shows the probability of various outcomes for inflation over the forecast horizon. The darkest band depicts the central projection, which corresponds to the BSP’s baseline inflation forecast. It covers 25 percent of the probability distribution. Each successive pair of bands is drawn to cover a further 25 percent of probability, until 75 percent of the probability distribution is covered. Lastly, the lightest band covers the lower and upper90 percent of the probability distribution. The bands widen (i.e., “fan out”) as the time frame is extended, indicating increasing uncertainty about outcomes. The band in wire mesh depicts the inflation profile in the previous report. The shaded area, which measures the range of uncertainty, is based on the forecast errors from the past years. In greater detail, it can be enhanced by adjusting the level of skewness of the downside and upside shocks that could affect the inflationary process over the next two years in order to change the balance of the probability area lying above or below the central projection.

Q2 2016 Inflation Report | 39
VII. Implications for the Monetary Policy Stance
The prevailing inflation outlook supports keeping monetary policy settings unchanged. Based on the assessment as of the 23 June monetary policy meeting, inflation is still expected to average at the lower edge of the 3.0 percent + 1.0 percentage point target range for 2016 and approach the mid-point of the target range in 2017. The baseline inflation forecasts as of the 23 June monetary policy meeting are 1.98 percent (from 2.05 percent) for 2016 and 3.05 percent (from 3.12 percent) for 2017. The reduction in the baseline forecasts could be attributed mainly to the lower-than-expected minimum wage increase for NCR and the projected peso appreciation relative to the previous forecast path which are partially offset by the increase in global and domestic oil prices as well as the slightly higher-than-projected May 2016 inflation outturn. Meanwhile, the initial inflation forecast for 2018 is 2.62 percent, which is within the 3.0 percent + 1.0 percentage point target range.
Domestic demand continues
to be firm while external
prospects remain subdued
The risks to future inflation were considered to be broadly balanced as of the 23 June monetary policy meeting. With oil prices recovering, potential second-round effects coming from lower global oil prices are seen to abate in the period ahead. Nevertheless, slower global economic activity remains a significant downside risk to the inflation outlook. Meanwhile, given the improvement in rainfall conditions and the transition to neutral weather conditions in May-July season, the upside risk on food and utility prices due to El Niño are seen to decline in the coming months. However, pending petitions for adjustments in electricity rates remain as upside risks to inflation. Inflation expectations—based on forecast surveys of private sector economists by the BSP and by Consensus Economics—continue to be within target over the policy horizon while falling below the lower bound of the target range for 2016. Results of the BSP’s May 2016 survey of private
sector economists yielded a lower inflation forecast of 1.8 percent (from 1.9 percent in the previous survey) for 2016 while mean inflation forecasts were steady at 2.7 percent for 2017 and at 2.8 percent for 2018. Results of the May 2016 Consensus Economics survey showed lower mean inflation forecasts at 1.8 percent for 2016 (from 1.9 percent) and 2.8 percent for 2017 (from 3.0 percent).
In June, headline inflation increased to 1.9 percent year-on-year from 1.6 percent in May. Core inflation, which excludes certain volatile food and energy items to provide an indicator of underlying price pressures, also rose to 1.9 percent in June from 1.6 percent in the previous month. The higher June headline inflation was driven mainly by higher prices of food items. Non-food inflation went up due to price increases for clothing, furnishings, and household equipment as well as service-related CPI components (such as education, health, and catering services) which offset declines in electricity rates and petroleum prices.
Recent demand indicators affirm the view that domestic demand conditions remain firm. The economy grew by 6.9 percent in Q1 2016, faster than the quarter- and year-ago growth rates of 6.5 percent and 5.0 percent, respectively. GDP growth supported by household spending, capital formation, and public spending on the expenditure side. On the production side, the services and industry recorded solid gains, with services and industry contributing 4.4 percentage points and 2.9 percentage points, respectively. On a seasonally-adjusted basis, GDP expanded by 1.1 percent quarter-on-quarter in Q1 2016 from 2.1 percent in Q4 2015.
NG expenditures in Q1 2016 amounted to P591.5 billion, 17.0 percent higher than the expenditures in the same period in 2015. Excluding interest payments, expenditures went up by 21.0 percent. However, notwithstanding the increase in NG spending in the first quarter, it remains below the target level and accounts for about 87.9 percent of the Q1 fiscal program. Meanwhile, the Philippine composite PMI remained above the 50-point expansion threshold, reaching 55.3 in April due to the faster rate of
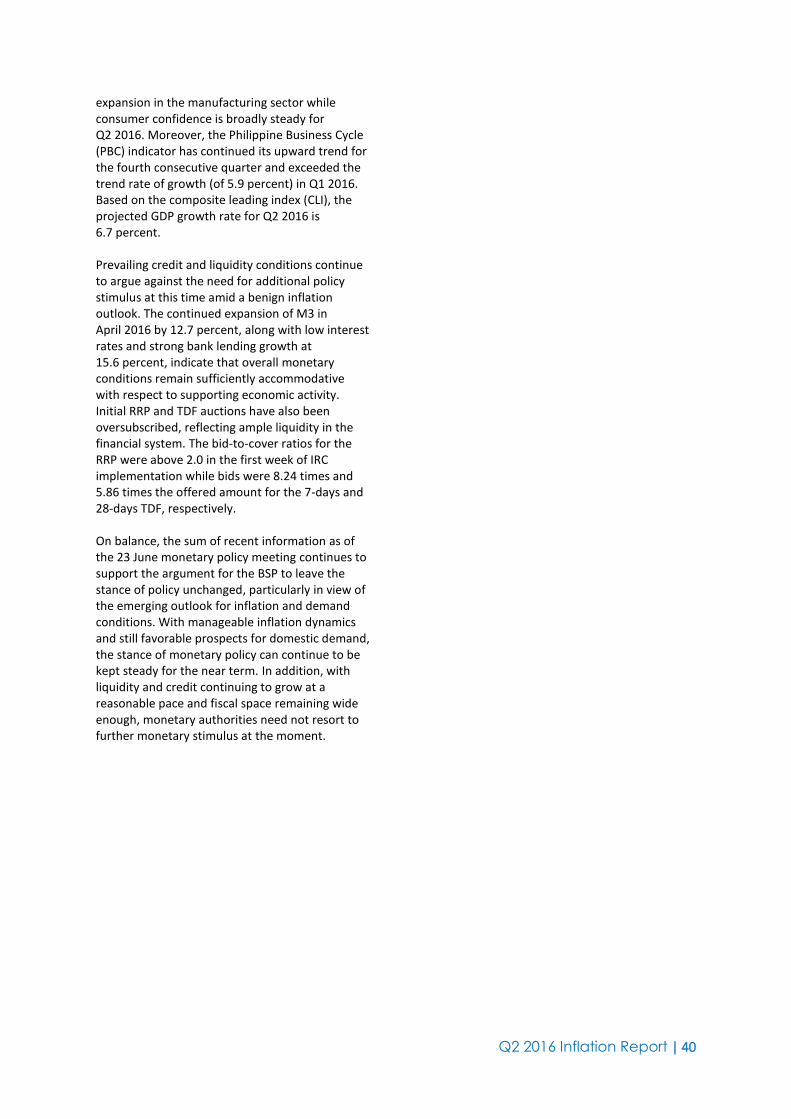
Q2 2016 Inflation Report | 40
expansion in the manufacturing sector while consumer confidence is broadly steady for Q2 2016. Moreover, the Philippine Business Cycle (PBC) indicator has continued its upward trend for the fourth consecutive quarter and exceeded the trend rate of growth (of 5.9 percent) in Q1 2016. Based on the composite leading index (CLI), the projected GDP growth rate for Q2 2016 is 6.7 percent. Prevailing credit and liquidity conditions continue to argue against the need for additional policy stimulus at this time amid a benign inflation outlook. The continued expansion of M3 in April 2016 by 12.7 percent, along with low interest rates and strong bank lending growth at 15.6 percent, indicate that overall monetary conditions remain sufficiently accommodative with respect to supporting economic activity. Initial RRP and TDF auctions have also been oversubscribed, reflecting ample liquidity in the financial system. The bid-to-cover ratios for the RRP were above 2.0 in the first week of IRC implementation while bids were 8.24 times and 5.86 times the offered amount for the 7-days and 28-days TDF, respectively. On balance, the sum of recent information as of the 23 June monetary policy meeting continues to support the argument for the BSP to leave the stance of policy unchanged, particularly in view of the emerging outlook for inflation and demand conditions. With manageable inflation dynamics and still favorable prospects for domestic demand, the stance of monetary policy can continue to be kept steady for the near term. In addition, with liquidity and credit continuing to grow at a reasonable pace and fiscal space remaining wide enough, monetary authorities need not resort to further monetary stimulus at the moment.

Q2 2016 Inflation Report | 41
Summary of Monetary Policy Decisions
Effectivity Date
Levels (in percent)
Monetary Policy Decisions RRP Overnight
RP Overnight
2 0 0 8
31 Jan 2008 5.00 7.00
The Monetary Board (MB) decided to reduce by 25 basis points (bps) the BSP’s key policy interest rates to 5 percent for the overnight borrowing or reverse repurchase (RRP) facility and 7 percent for the overnight lending or repurchase (RP) facility. The interest rates on term RRPs, RPs, and special deposit accounts (SDAs) were also reduced accordingly. In its assessment of macroeconomic conditions, the MB noted that the latest inflation forecasts indicated that inflation would fall within the 4.0 percent ± 1 percentage point target range in 2008 and the 3.5 ± 1 percentage point target range in 2009.
13 Mar 2008 5.00 7.00
The MB decided to keep the BSP’s key policy interest rates at 5 percent for the overnight borrowing or RRP facility and 7 percent for the overnight lending or RP facility. The MB also decided to implement immediately the following refinements in the SDA facility: (1) the closure of existing windows for the two-, three-, and six-month tenors; and (2) the reduction of the interest rates on the remaining tenors. The interest rates on term RRPs and RPs were also left unchanged.
24 Apr 2008 5.00 7.00
The MB kept the BSP’s key policy interest rates at 5.0 percent for the overnight borrowing or RRP facility and 7.0 percent for the overnight lending or RP facility. The interest rates on term RRPs and RPs were also left unchanged.
5 Jun 2008 5.25 7.25
The MB decided to increase by 25 bps the BSP’s key policy interest rates to 5.25 percent for the RRP facility and 7.25 percent for RP facility as emerging baseline forecasts indicate a likely breach of the inflation target for 2008 along with indications that supply-driven pressures are beginning to feed into demand. Given the early evidence of second-round effects, the MB recognized the need to act promptly to rein in inflationary expectations. The interest rates on term RRPs, RPs, and SDAs were also increased accordingly.
17 Jul 2008 5.75 7.75
The MB increased by 50 bps the BSP’s key policy interest rates to 5.75 percent for the overnight borrowing or RRP facility and 7.75 percent for the overnight lending or RP facility. The interest rates on term RRPs, RPs, and SDAs were also increased accordingly.
28 Aug 2008 6.00 8.00
The MB increased by 25 bps the BSP’s key policy interest rates to 6.0 percent for the overnight borrowing or reverse repurchase (RRP) facility and 8.0 percent for the overnight lending or repurchase (RP) facility. The interest rates on term RRPs, RPs, and SDAs were also increased accordingly.

Q2 2016 Inflation Report | 42
Summary of Monetary Policy Decisions
Effectivity Date
Levels (in percent)
Monetary Policy Decisions RRP Overnight
RP Overnight
6 Oct 2008 6.00 8.00
The MB kept the BSP’s key policy interest rates unchanged at 6.0 percent for RRP facility and 8.0 percent for the RP facility. The interest rates on term RRPs, RPs, and SDAs were also left unchanged.
6 Nov 2008 6.00 8.00
The MB decided to keep the BSP’s key policy interest rates steady at 6 percent for the overnight borrowing or RRP facility and 8 percent for the overnight lending or RP facility. The interest rates on term RRPs, RPs, and SDAs were also left unchanged.
18 Dec 2008 5.50 7.50
The MB decided to reduce the BSP’s key policy interest rates by 50 bps to 5.5 percent for the overnight borrowing or RRP facility and 7.5 percent for the overnight lending or RP facility. The interest rates on term RRPs, RPs, and SDAs were also adjusted accordingly. Latest baseline forecasts showed a decelerating inflation path over the policy horizon, with inflation falling within target by 2010. This outlook is supported by the downward shift in the balance of risks, following the easing of commodity prices, the moderation in inflation expectations, and the expected slowdown in economic activity.
2 0 0 9
29 Jan 2009 5.00 7.00
The MB decided to reduce the BSP’s key policy interest rates by another 50 bps to 5 percent for the overnight borrowing or RRP facility and 7 percent for the overnight lending or RP facility. The interest rates on term RRPs, RPs, and SDAs were also adjusted accordingly. Latest baseline forecasts showed a decelerating inflation path over the policy horizon, with inflation falling within target by 2010. The MB based its decision on the latest inflation outlook which shows inflation falling within the target range for 2009 and 2010. The Board noted that the balance of risks to inflation is tilted to the downside due to the softening prices of commodities, the slowdown in core inflation, significantly lower inflation expectations, and moderating demand.
5 Mar 2009 4.75 6.75
The MB decided to reduce the BSP’s key policy interest rates by 25 bps to 4.75 percent for the overnight borrowing or RRP facility and 6.75 percent for the overnight lending or RP facility. The interest rates on term RRPs, RPs, and SDAs were also reduced accordingly. Given possible upside risks to inflation, notably the volatility in oil prices and in exchange rates, increases in utility rates, and potential price pressures coming from some agricultural commodities, the MB decided that a more measured adjustment of policy rates was needed.
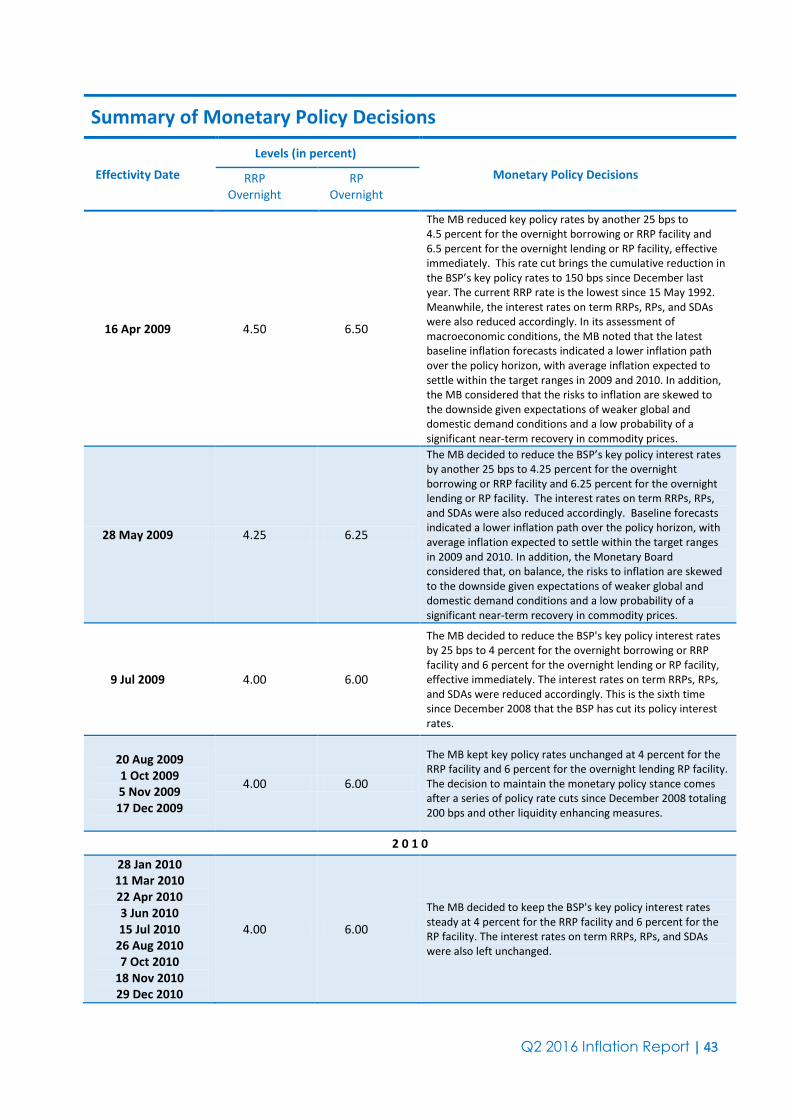
Q2 2016 Inflation Report | 43
Summary of Monetary Policy Decisions
Effectivity Date
Levels (in percent)
Monetary Policy Decisions RRP Overnight
RP Overnight
16 Apr 2009 4.50 6.50
The MB reduced key policy rates by another 25 bps to 4.5 percent for the overnight borrowing or RRP facility and 6.5 percent for the overnight lending or RP facility, effective immediately. This rate cut brings the cumulative reduction in the BSP’s key policy rates to 150 bps since December last year. The current RRP rate is the lowest since 15 May 1992. Meanwhile, the interest rates on term RRPs, RPs, and SDAs were also reduced accordingly. In its assessment of macroeconomic conditions, the MB noted that the latest baseline inflation forecasts indicated a lower inflation path over the policy horizon, with average inflation expected to settle within the target ranges in 2009 and 2010. In addition, the MB considered that the risks to inflation are skewed to the downside given expectations of weaker global and domestic demand conditions and a low probability of a significant near-term recovery in commodity prices.
28 May 2009 4.25 6.25
The MB decided to reduce the BSP’s key policy interest rates by another 25 bps to 4.25 percent for the overnight borrowing or RRP facility and 6.25 percent for the overnight lending or RP facility. The interest rates on term RRPs, RPs, and SDAs were also reduced accordingly. Baseline forecasts indicated a lower inflation path over the policy horizon, with average inflation expected to settle within the target ranges in 2009 and 2010. In addition, the Monetary Board considered that, on balance, the risks to inflation are skewed to the downside given expectations of weaker global and domestic demand conditions and a low probability of a significant near-term recovery in commodity prices.
9 Jul 2009 4.00 6.00
The MB decided to reduce the BSP's key policy interest rates by 25 bps to 4 percent for the overnight borrowing or RRP facility and 6 percent for the overnight lending or RP facility, effective immediately. The interest rates on term RRPs, RPs, and SDAs were reduced accordingly. This is the sixth time since December 2008 that the BSP has cut its policy interest rates.
20 Aug 2009 1 Oct 2009 5 Nov 2009 17 Dec 2009
4.00 6.00
The MB kept key policy rates unchanged at 4 percent for the RRP facility and 6 percent for the overnight lending RP facility. The decision to maintain the monetary policy stance comes after a series of policy rate cuts since December 2008 totaling 200 bps and other liquidity enhancing measures.
2 0 1 0
28 Jan 2010 11 Mar 2010 22 Apr 2010 3 Jun 2010 15 Jul 2010
26 Aug 2010 7 Oct 2010
18 Nov 2010 29 Dec 2010
4.00 6.00
The MB decided to keep the BSP's key policy interest rates steady at 4 percent for the RRP facility and 6 percent for the RP facility. The interest rates on term RRPs, RPs, and SDAs were also left unchanged.
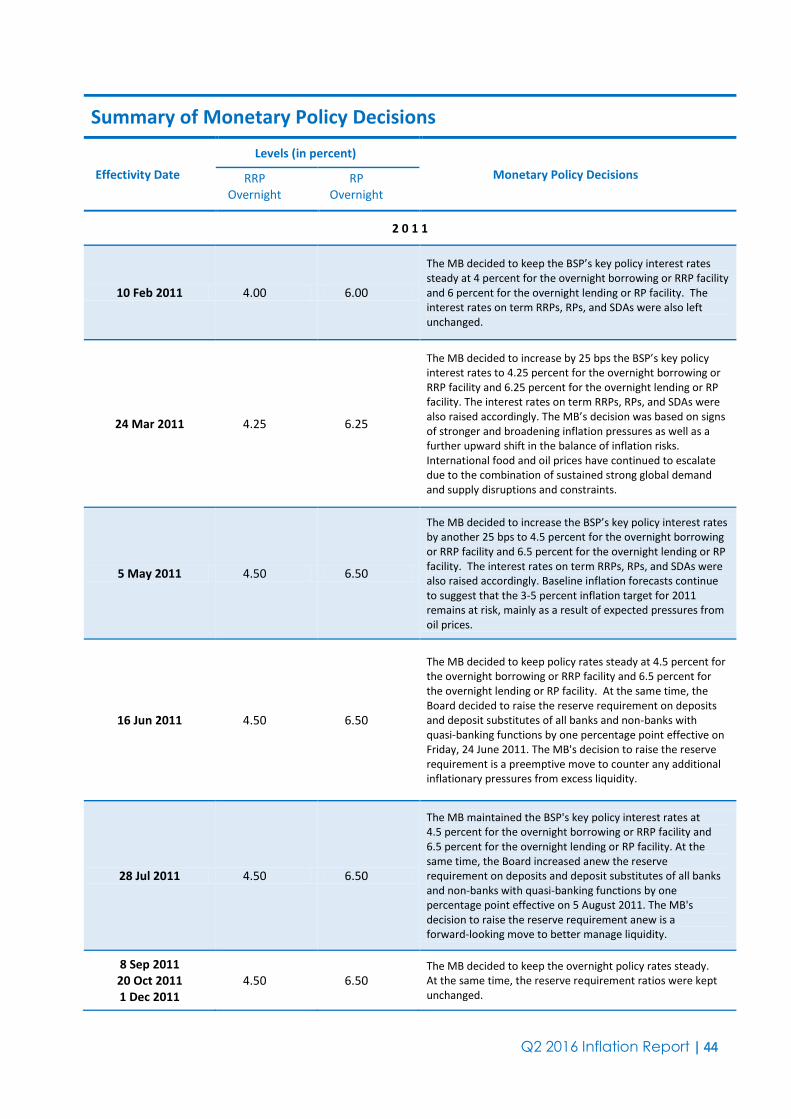
Q2 2016 Inflation Report | 44
Summary of Monetary Policy Decisions
Effectivity Date
Levels (in percent)
Monetary Policy Decisions RRP Overnight
RP Overnight
2 0 1 1
10 Feb 2011 4.00 6.00
The MB decided to keep the BSP’s key policy interest rates steady at 4 percent for the overnight borrowing or RRP facility and 6 percent for the overnight lending or RP facility. The interest rates on term RRPs, RPs, and SDAs were also left unchanged.
24 Mar 2011 4.25 6.25
The MB decided to increase by 25 bps the BSP’s key policy interest rates to 4.25 percent for the overnight borrowing or RRP facility and 6.25 percent for the overnight lending or RP facility. The interest rates on term RRPs, RPs, and SDAs were also raised accordingly. The MB’s decision was based on signs of stronger and broadening inflation pressures as well as a further upward shift in the balance of inflation risks. International food and oil prices have continued to escalate due to the combination of sustained strong global demand and supply disruptions and constraints.
5 May 2011 4.50 6.50
The MB decided to increase the BSP’s key policy interest rates by another 25 bps to 4.5 percent for the overnight borrowing or RRP facility and 6.5 percent for the overnight lending or RP facility. The interest rates on term RRPs, RPs, and SDAs were also raised accordingly. Baseline inflation forecasts continue to suggest that the 3-5 percent inflation target for 2011 remains at risk, mainly as a result of expected pressures from oil prices.
16 Jun 2011 4.50 6.50
The MB decided to keep policy rates steady at 4.5 percent for the overnight borrowing or RRP facility and 6.5 percent for the overnight lending or RP facility. At the same time, the Board decided to raise the reserve requirement on deposits and deposit substitutes of all banks and non-banks with quasi-banking functions by one percentage point effective on Friday, 24 June 2011. The MB's decision to raise the reserve requirement is a preemptive move to counter any additional inflationary pressures from excess liquidity.
28 Jul 2011 4.50 6.50
The MB maintained the BSP's key policy interest rates at 4.5 percent for the overnight borrowing or RRP facility and 6.5 percent for the overnight lending or RP facility. At the same time, the Board increased anew the reserve requirement on deposits and deposit substitutes of all banks and non-banks with quasi-banking functions by one percentage point effective on 5 August 2011. The MB's decision to raise the reserve requirement anew is a forward-looking move to better manage liquidity.
8 Sep 2011 20 Oct 2011 1 Dec 2011
4.50 6.50 The MB decided to keep the overnight policy rates steady. At the same time, the reserve requirement ratios were kept unchanged.

Q2 2016 Inflation Report | 45
Summary of Monetary Policy Decisions
Effectivity Date
Levels (in percent)
Monetary Policy Decisions RRP Overnight
RP Overnight
2 0 1 2
19 Jan 2012 4.25 6.25
The MB decided to reduce the BSP's key policy interest rates by 25 bps to 4.25 percent for the overnight borrowing or RRP facility and 6.25 percent for the overnight lending or RP facility. The interest rates on term RRPs, RPs, and SDAs were also reduced accordingly The MB's decision is based on its assessment that the inflation outlook remains comfortably within the target range, with expectations well-anchored and as such, allowed some scope for a reduction in policy rates to help boost economic activity and support market confidence.
1 Mar 2012 4.00 6.00
The MB decided to reduce the BSP's key policy interest rates by another 25 bps to 4.0 percent for the overnight borrowing or RRP facility and 6.0 percent for the overnight lending or RP facility. The interest rates on term RRPs, RPs, and SDAs were also reduced accordingly. The MB is of the view that the benign inflation outlook has allowed further scope for a measured reduction in policy rates to support economic activity and reinforce confidence.
19 Apr 2012 4.00 6.00
The MB decided to keep the BSP’s key policy interest rates steady at 4 percent for the overnight borrowing or RRP facility and 6 percent for the overnight lending or RP facility. The interest rates on term RRPs, RPs, and SDAs were also left unchanged.
14 Jun 2012 4.00 6.00
The MB decided to keep the BSP’s key policy interest rates steady at 4 percent for the overnight borrowing or RRP facility and 6 percent for the overnight lending or RP facility. The interest rates on term RRPs, RPs, and SDAs were also left unchanged. The MB’s decision was based on its assessment that the inflation environment remains manageable. Baseline forecasts continue to track the lower half of the 3-5 percent target range for 2012 and 2013, while inflation expectations remain firmly anchored. At the same time, domestic macroeconomic readings have improved significantly in Q1 2012.
26 Jul 2012 3.75 5.75
The MB decided to reduce the BSP’s key policy interest rates by 25 bps to 3.75 percent for the overnight borrowing or RRP facility and 5.75 percent for the overnight lending or RP facility. The interest rates on term RRPs, RPs, and SDAs were also reduced accordingly. This is the third time in 2012 that the BSP has cut its policy rates. The MB’s decision was based on its assessment that price pressures have been receding, with risks to the inflation outlook slightly skewed to the downside. Baseline forecasts indicate that inflation is likely to settle within the lower half of the 3-5 percent target for 2012 and 2013, as pressures on global commodity prices are seen to continue to abate amid weaker global growth prospects. At the same time, the MB is of the view that prospects for global economic activity are likely to remain weak.
13 SEP 2012 3.75 5.75
The MB decided to keep the BSP’s key policy interest rates steady at 3.75 percent for the overnight borrowing or RRP facility and 5.75 percent for the overnight lending or RP facility. The interest rates on term RRPs, RPs, and SDAs were also left unchanged. The MB’s decision was based on its assessment that the inflation environment remains benign,
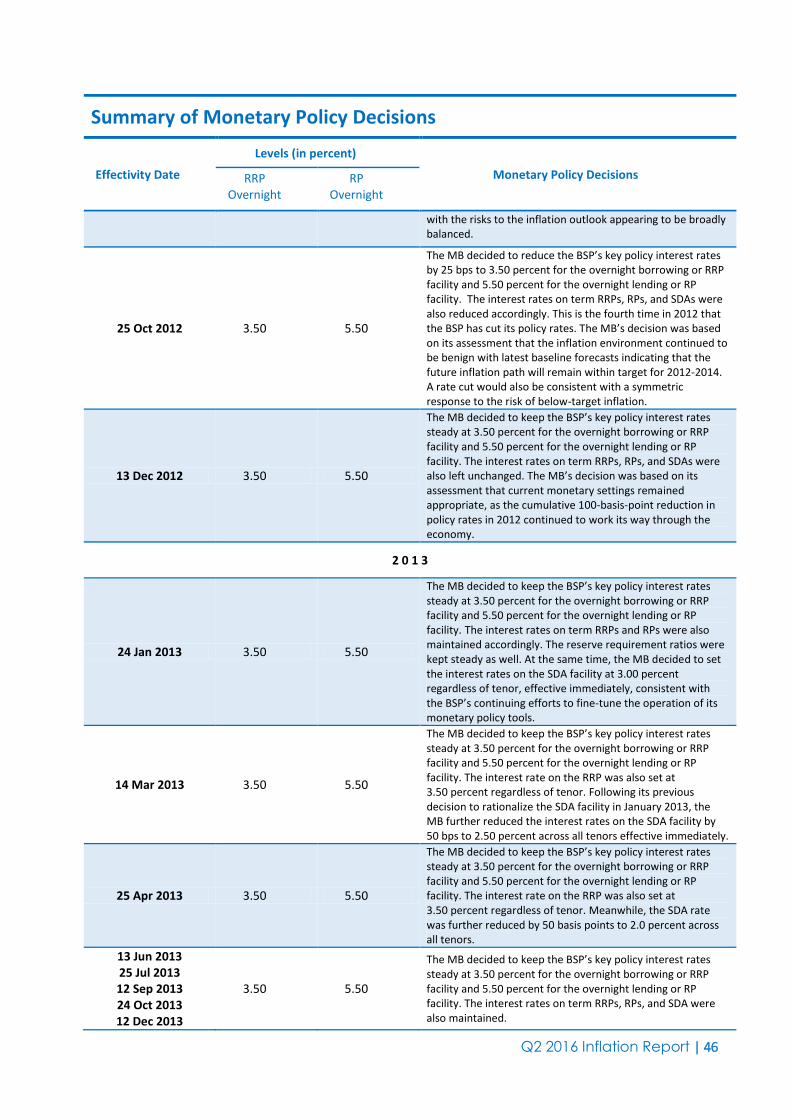
Q2 2016 Inflation Report | 46
Summary of Monetary Policy Decisions
Effectivity Date
Levels (in percent)
Monetary Policy Decisions RRP Overnight
RP Overnight
with the risks to the inflation outlook appearing to be broadly balanced.
25 Oct 2012 3.50 5.50
The MB decided to reduce the BSP’s key policy interest rates by 25 bps to 3.50 percent for the overnight borrowing or RRP facility and 5.50 percent for the overnight lending or RP facility. The interest rates on term RRPs, RPs, and SDAs were also reduced accordingly. This is the fourth time in 2012 that the BSP has cut its policy rates. The MB’s decision was based on its assessment that the inflation environment continued to be benign with latest baseline forecasts indicating that the future inflation path will remain within target for 2012-2014. A rate cut would also be consistent with a symmetric response to the risk of below-target inflation.
13 Dec 2012 3.50 5.50
The MB decided to keep the BSP’s key policy interest rates steady at 3.50 percent for the overnight borrowing or RRP facility and 5.50 percent for the overnight lending or RP facility. The interest rates on term RRPs, RPs, and SDAs were also left unchanged. The MB’s decision was based on its assessment that current monetary settings remained appropriate, as the cumulative 100-basis-point reduction in policy rates in 2012 continued to work its way through the economy.
2 0 1 3
24 Jan 2013 3.50 5.50
The MB decided to keep the BSP’s key policy interest rates steady at 3.50 percent for the overnight borrowing or RRP facility and 5.50 percent for the overnight lending or RP facility. The interest rates on term RRPs and RPs were also maintained accordingly. The reserve requirement ratios were kept steady as well. At the same time, the MB decided to set the interest rates on the SDA facility at 3.00 percent regardless of tenor, effective immediately, consistent with the BSP’s continuing efforts to fine-tune the operation of its monetary policy tools.
14 Mar 2013 3.50 5.50
The MB decided to keep the BSP’s key policy interest rates steady at 3.50 percent for the overnight borrowing or RRP facility and 5.50 percent for the overnight lending or RP facility. The interest rate on the RRP was also set at 3.50 percent regardless of tenor. Following its previous decision to rationalize the SDA facility in January 2013, the MB further reduced the interest rates on the SDA facility by 50 bps to 2.50 percent across all tenors effective immediately.
25 Apr 2013 3.50 5.50
The MB decided to keep the BSP’s key policy interest rates steady at 3.50 percent for the overnight borrowing or RRP facility and 5.50 percent for the overnight lending or RP facility. The interest rate on the RRP was also set at 3.50 percent regardless of tenor. Meanwhile, the SDA rate was further reduced by 50 basis points to 2.0 percent across all tenors.
13 Jun 2013 25 Jul 2013 12 Sep 2013 24 Oct 2013 12 Dec 2013
3.50 5.50
The MB decided to keep the BSP’s key policy interest rates steady at 3.50 percent for the overnight borrowing or RRP facility and 5.50 percent for the overnight lending or RP facility. The interest rates on term RRPs, RPs, and SDA were also maintained.

Q2 2016 Inflation Report | 47
Summary of Monetary Policy Decisions
Effectivity Date
Levels (in percent)
Monetary Policy Decisions RRP Overnight
RP Overnight
2 0 1 4
6 Feb 2014 3.50 5.50
The MB decided to keep the BSP’s key policy interest rates steady at 3.50 percent for the overnight borrowing or RRP facility and 5.50 percent for the overnight lending or RP facility. The interest rates on term RRPs, RPs, and SDA were also maintained.
27 Mar 2014 3.50 5.50
The MB decided to keep the BSP’s key policy interest rates steady at 3.50 percent for the overnight borrowing or RRP facility and 5.50 percent for the overnight lending or RP facility. The interest rates on term RRPs, RPs, and SDA were also maintained. Meanwhile, the MB decided to increase the reserve requirement by one percentage point effective on 11 April 2014.
8 May 2014 3.50 5.50
The MB decided to keep the BSP's key policy interest rates steady at 3.50 percent for the overnight borrowing or RRP facility and 5.50 percent for the overnight lending or RP facility. The interest rates on term RRPs, RPs, and SDA were also maintained. Meanwhile, the MB decided to increase the reserve requirements for U/KBs and TBs by a further one percentage point effective on 30 May 2014.
19 Jun 2014 3.50 5.50
The MB decided to keep the BSP's key policy interest rates steady at 3.50 percent for the overnight borrowing or RRP facility and 5.50 percent for the overnight lending or RP facility. The interest rates on term RRPs and RPs were also maintained. The reserve requirement ratios were left unchanged as well. Meanwhile, the MB decided to raise the interest rate on the SDA facility by 25 basis points from 2.0 percent to 2.25 percent across all tenors effective immediately.
31 Jul 2014 3.75 5.75
The MB decided to increase the BSP's key policy rates by 25 bps to 3.75 percent for the overnight borrowing or RRP facility and 5.75 percent for the overnight lending or RP facility. The interest rates on term RRPs and RPs were also raised accordingly. The rate on special deposit accounts (SDA) was left unchanged. Meanwhile, the reserve requirement ratios were also kept steady.
11 Sep 2014 4.00 6.00
The MB decided to increase the BSP's key policy rates by 25 bps to 4.0 percent for the overnight borrowing or RRP facility and 6.0 percent for the overnight lending or RP facility. The interest rates on term RRPs, RPs, and SDA were also raised accordingly. Meanwhile, the reserve requirement ratios were left unchanged.
23 Oct 2014 11 Dec 2014
4.00 6.00
The MB decided to maintain the BSP’s key policy interest rates at 4.0 percent for the overnight borrowing or reverse repurchase (RRP) facility and 6.0 percent for the overnight lending or repurchase (RP) facility. The interest rates on term RRPs, RPs, and special deposit accounts were also kept steady. The reserve requirement ratios were left unchanged as well.

Q2 2016 Inflation Report | 48
Summary of Monetary Policy Decisions
Effectivity Date
Levels (in percent)
Monetary Policy Decisions RRP Overnight
RP Overnight
2 0 1 5
12 Feb 2015 26 Mar 2015 14 May 2015 25 Jun 2015 13 Aug 2015 24 Sep 2015 12 Nov 2015 17 Dec 2015
4.00 6.00
The MB decided to maintain the BSP’s key policy interest rates at 4.0 percent for the overnight borrowing or reverse repurchase (RRP) facility and 6.0 percent for the overnight lending or repurchase (RP) facility. The interest rates on term RRPs, RPs, and special deposit accounts were also kept steady. The reserve requirement ratios were left unchanged as well.
2 0 1 6
11 Feb 2016 23 Mar 2016 12 May 2016
23 Jun 2016
4.00
3.00
6.00 3.50
The MB decided to maintain the BSP’s key policy interest rates at 4.0 percent for the overnight borrowing or reverse repurchase (RRP) facility and 6.0 percent for the overnight lending or repurchase (RP) facility. The interest rates on term RRPs, RPs, and special deposit accounts were also kept steady. The reserve requirement ratios were left unchanged as well. The BSP formally adopted an interest rate corridor (IRC) system as a framework for conducting its monetary operations. The shift to IRC is an operational adjustment and not a change in the monetary policy stance. The IRC is a system for guiding short-term market rates towards the BSP policy interest rate which is the overnight reverse repurchase (RRP) rate. The IRC system consists of the following instruments: standing liquidity facilities, namely, the overnight lending facility (OLF) and the overnight deposit facility (ODF); the overnight RRP facility; and a term deposit auction facility (TDF). The interest rates for the standing liquidity facilities form the upper and lower bound of the corridor while the overnight RRP rate is set at the middle of the corridor. The repurchase (RP) and Special Deposit Account (SDA) windows will be replaced by standing overnight lending and overnight deposit facilities, respectively. Meanwhile, the reverse repurchase (RRP) facility will be modified to a purely overnight RRP. In addition, the term deposit facility (TDF) will serve as the main tool for absorbing liquidity. The interest rates for these facilities will be set as follows starting 3 June 2016: 3.5 percent in the overnight lending facility (a reduction of the interest rate for the upper bound of the corridor from the current overnight RP rate of 6.0 percent); 3.0 percent in the overnight RRP rate (an adjustment from the current 4.0 percent); and 2.5 percent in the overnight deposit facility (no change from the current SDA rate).

Q2 2016 Inflation Report | 49
The BSP Inflation Report is published every quarter by the Bangko Sentral ng Pilipinas. The report is available as a complete document in pdf format, together with other general information about inflation targeting and the monetary policy of the BSP, on the BSP’s website:
www.bsp.gov.ph/monetary/inflation.asp If you wish to receive an electronic copy of the latest BSP Inflation Report, please send an e-mail to [email protected]. The BSP also welcomes feedback from readers on the contents of the Inflation Report as well as suggestions on how to improve the presentation. Please send comments and suggestions to the following addresses:
By post: BSP Inflation Report
c/o Department of Economic Research Bangko Sentral ng Pilipinas
A. Mabini Street, Malate, Manila Philippines 1004
By e-mail: [email protected]