Industrial Define Problem (Idp)
76
A PROJECT REPORT ON “EMPOYEES MORALE SURVY AT SIEMENSE INDIA LTD.”
-
Upload
ranasiddharth -
Category
Documents
-
view
218 -
download
0
Transcript of Industrial Define Problem (Idp)

7/30/2019 Industrial Define Problem (Idp)
http://slidepdf.com/reader/full/industrial-define-problem-idp 1/76
A PROJECT REPORT ON “EMPOYEESMORALE SURVY AT SIEMENSE INDIA
LTD.”

7/30/2019 Industrial Define Problem (Idp)
http://slidepdf.com/reader/full/industrial-define-problem-idp 2/76
About he industry
About major companies in industries
Product profile Introduction of the study
Research methodology
Hypothesis framework
Data analysis and interpretation
My observation
Limitation
Conclusion/suggestion
Agenda of presentation
7/30/2019 Industrial Define Problem (Idp)
http://slidepdf.com/reader/full/industrial-define-problem-idp 3/76
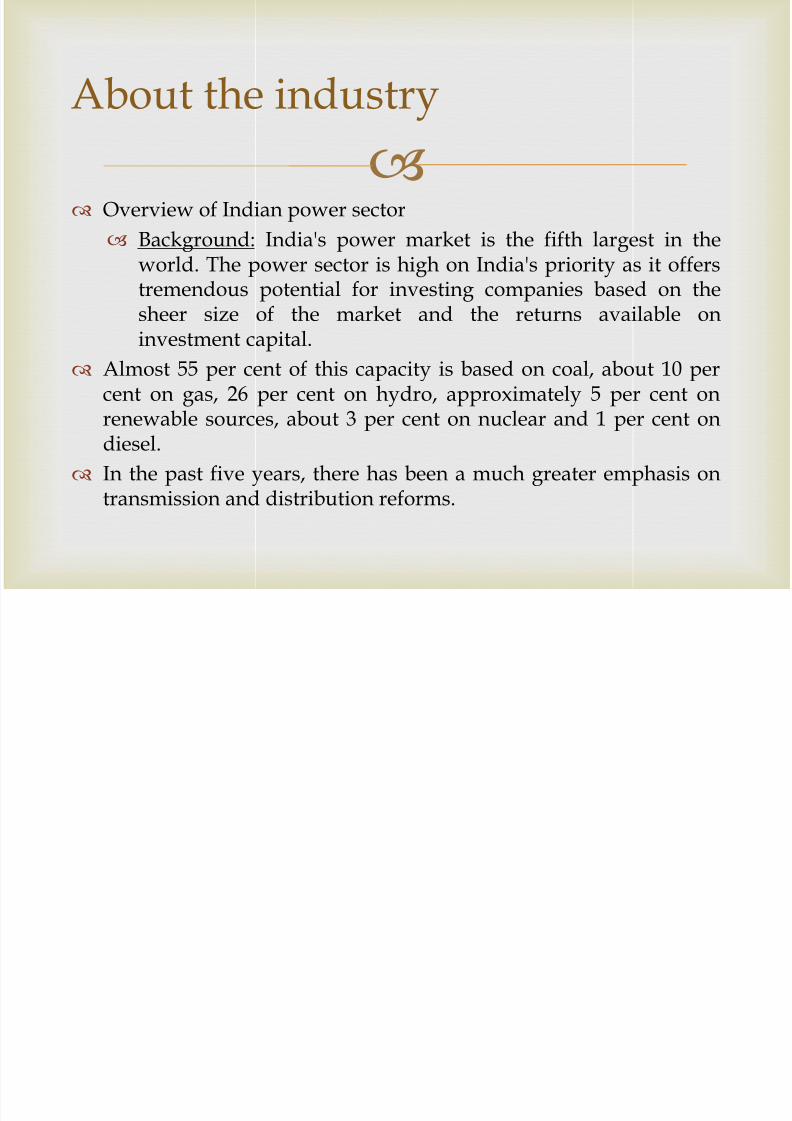
Overview of Indian power sector
Background: India's power market is the fifth largest in the
world. The power sector is high on India's priority as it offerstremendous potential for investing companies based on thesheer size of the market and the returns available oninvestment capital.
Almost 55 per cent of this capacity is based on coal, about 10 percent on gas, 26 per cent on hydro, approximately 5 per cent on
renewable sources, about 3 per cent on nuclear and 1 per cent ondiesel.
In the past five years, there has been a much greater emphasis ontransmission and distribution reforms.
About the industry
7/30/2019 Industrial Define Problem (Idp)
http://slidepdf.com/reader/full/industrial-define-problem-idp 4/76
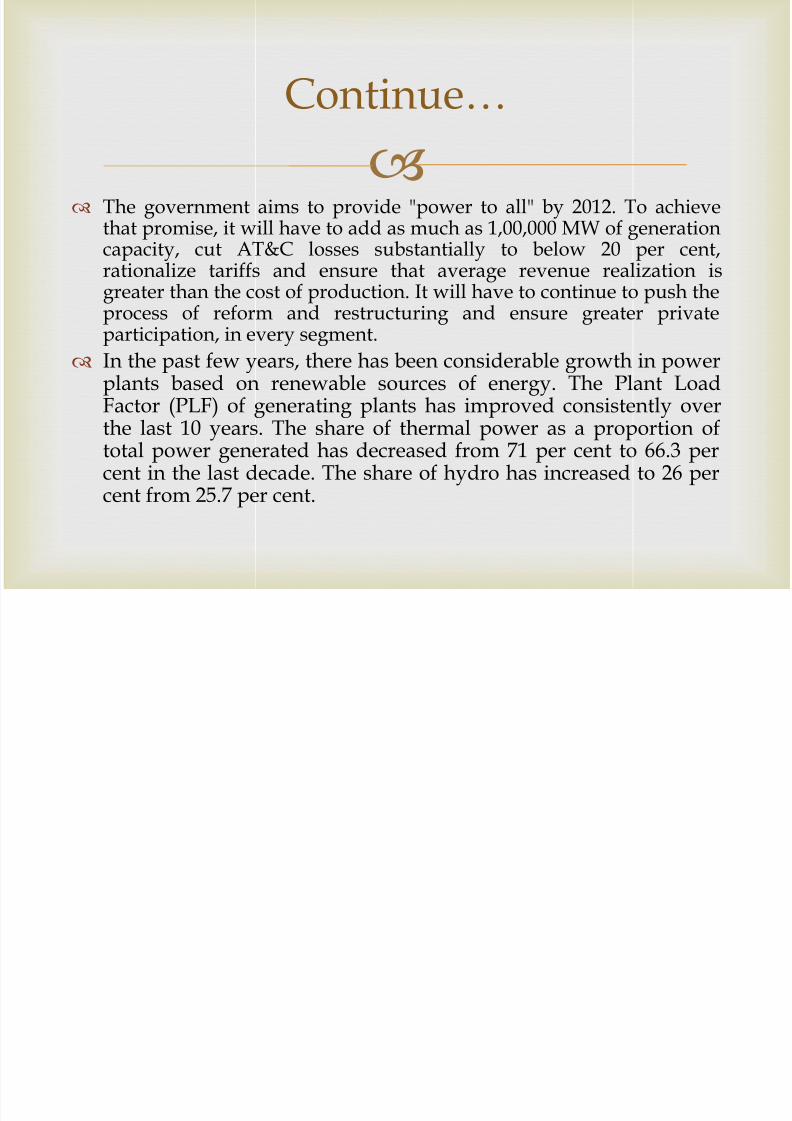
The government aims to provide "power to all" by 2012. To achieve
that promise, it will have to add as much as 1,00,000 MW of generationcapacity, cut AT&C losses substantially to below 20 per cent,
rationalize tariffs and ensure that average revenue realization isgreater than the cost of production. It will have to continue to push theprocess of reform and restructuring and ensure greater privateparticipation, in every segment.
In the past few years, there has been considerable growth in powerplants based on renewable sources of energy. The Plant Load
Factor (PLF) of generating plants has improved consistently overthe last 10 years. The share of thermal power as a proportion oftotal power generated has decreased from 71 per cent to 66.3 percent in the last decade. The share of hydro has increased to 26 percent from 25.7 per cent.
Continue…
7/30/2019 Industrial Define Problem (Idp)
http://slidepdf.com/reader/full/industrial-define-problem-idp 5/76
Siemens India Ltd.:
Suzlon Energy:
GE (General electrical):
Alstom power in India:
PROFILES OF MAJOR
PLAYERS
7/30/2019 Industrial Define Problem (Idp)
http://slidepdf.com/reader/full/industrial-define-problem-idp 6/76
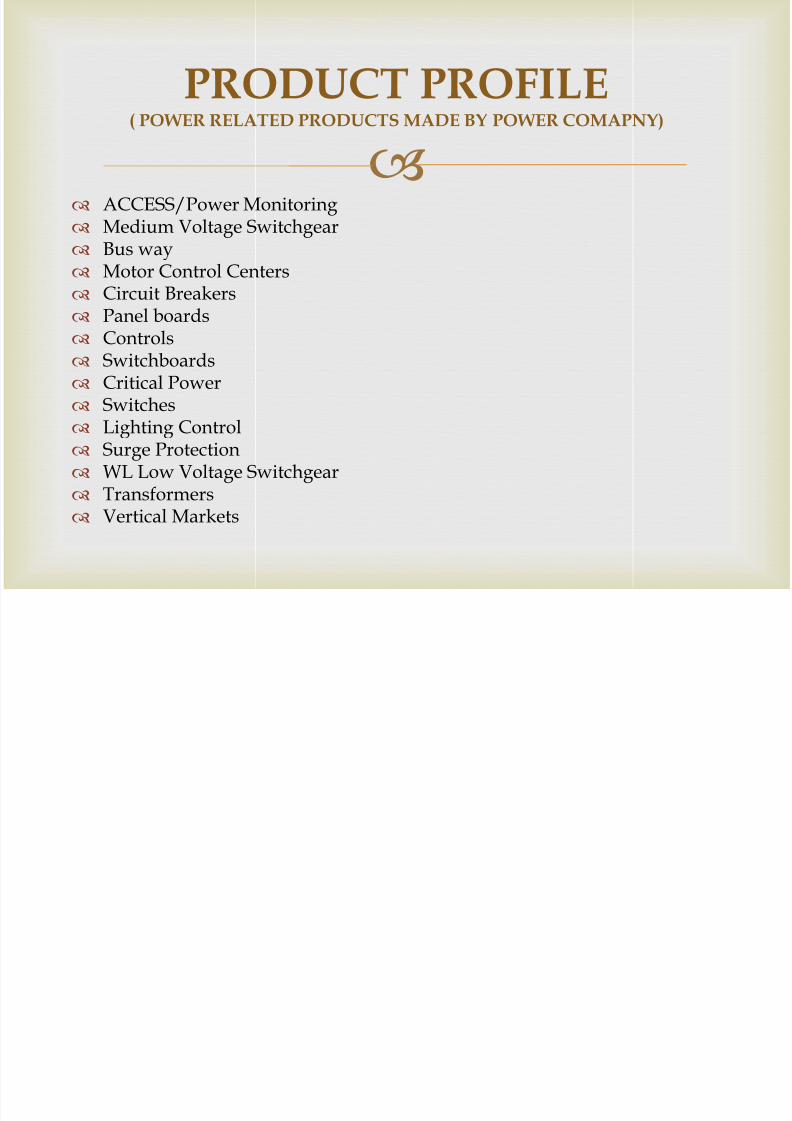
ACCESS/Power Monitoring Medium Voltage Switchgear Bus way
Motor Control Centers Circuit Breakers Panel boards Controls Switchboards Critical Power
Switches Lighting Control Surge Protection WL Low Voltage Switchgear Transformers Vertical Markets
PRODUCT PROFILE( POWER RELATED PRODUCTS MADE BY POWER COMAPNY)

7/30/2019 Industrial Define Problem (Idp)
http://slidepdf.com/reader/full/industrial-define-problem-idp 7/76
Early research into employee morale was generally directed
toward the fostering of group rapport or group solidarity and theinternalization of management goals by employees.
For "good" morale or a high level of morale to be maintained in awork group, some other conditions must be present. Among themost important of these are some measure of "success" in achievinggroup goals and some kind of individual and personal satisfaction.It therefore became necessary to study both the work group andthe individual. Studies of the individual have centered on his
prevailing needs, expectations’, attitudes, and motives. As a result, some of the most significant work in the area of human
motivation has been done in industrial settings (Baehr, Melany &Richard, Renck, 1958).
REVIEW OF LITERATURE
7/30/2019 Industrial Define Problem (Idp)
http://slidepdf.com/reader/full/industrial-define-problem-idp 8/76
one of man's strongest characteristics is to be continuously associated with his
fellows (Jackofsky & Ellen, 1984). The investigations at the Hawthorne plant ofthe Western Electric Company during the years 1927-1932 led to the conclusionthat overriding the effect of changes in physical working conditions (such as
levels of illumination, wage incentives, hours of work, length and position ofrest pauses) upon output were the feelings and sentiments attached to being anintegrated part of a special work group. The investigations made a verysignificant contribution in calling attention to the existence and importance ofthe "social" motives in industry and in showing the need to investigate thepattern of group activity.
. Among the most systematic approaches to a theory of motivation appliedto both individual and group patterns of behavior is the "field theory" as
formulated by Lewin. Author (2001) has summarized the findings ofindividual studies applying field theory which have helped establish theimportance of the view earlier formulated by the Hawthorne investigators.Levels of motivation and morale are not necessarily the end effects ofspecific incentives
Continue…

7/30/2019 Industrial Define Problem (Idp)
http://slidepdf.com/reader/full/industrial-define-problem-idp 9/76
In 1958 (Baehr, Melany & Richard, Renck) Levels of motivation and
morale are a result of the total work situation and of its manyoverlapping dynamic interrelations which involve both theindividual and the smaller groups in a larger social field
Continue…

7/30/2019 Industrial Define Problem (Idp)
http://slidepdf.com/reader/full/industrial-define-problem-idp 10/76

7/30/2019 Industrial Define Problem (Idp)
http://slidepdf.com/reader/full/industrial-define-problem-idp 11/76
Employee Morale refers to an attitude of satisfaction with a desire
to continue and strive for attaining the objectives of a factory.Morale is purely emotional. It is an attitude of an employee
towards his job, his superior and his organization. It is not staticthing, but it changes depending on working conditions, superiors,fellow workers pay and so on.
Morale may range from very high to very low. High Morale isevident from the positive feelings of employees such as
enthusiasm; desire to obey orders, willingness to co-operate withcoworkers. Poor or low Morale becomes obvious from the negativefeelings of employees such as dissatisfaction, discouragement ordislike of the job.
INTRODUCTION

7/30/2019 Industrial Define Problem (Idp)
http://slidepdf.com/reader/full/industrial-define-problem-idp 12/76
Morale is a fundamental psychological concept. It is not easy to define.
Morale is the degree of enthusiasm and willingness with which themembers of a group pull together to achieve group goal. It has been
defined differently by different authors. Different definition of Moralecan be classified into three major approaches.
1) Classical approach
2) Psychological approach
3) Social approach
1. Classical approach: According to this approach the satisfaction of basic needs is the
symbol of Morale. According to Robert M. Guion "Morale isdefined as the extent to which the individual perceives thatsatisfaction stemming from total job satisfaction".
Definitions

7/30/2019 Industrial Define Problem (Idp)
http://slidepdf.com/reader/full/industrial-define-problem-idp 13/76
2. Psychological Approach:
According to this approach Morale is psychological concept i.e.,state of mind. According to Jurious Fillipo “Morale is a mentalcondition or attitude of individual and groups whichdetermines their willingness to cooperate".
3. Social Approach:
According to some experts Morale is a social phenomenon.
According to Davis "Morale can be defined as the attitudes ofindividual and groups towards their work environment andtowards voluntary cooperation to the full extent of their abilityin the best interest at the organization".
Continue…
7/30/2019 Industrial Define Problem (Idp)
http://slidepdf.com/reader/full/industrial-define-problem-idp 14/76
Employee Morale plays vital role in the origination success. High
Morale leads to success and low Morale brings to defeat in itswake. The play of Morale is no less important for an industrial
undertaking. The success of failure of the industry much dependsup on the Morale of its employees.
Types of Morale:
High Morale:
Low Morale:
Importance of Employee Morale
7/30/2019 Industrial Define Problem (Idp)
http://slidepdf.com/reader/full/industrial-define-problem-idp 15/76
To know and analyze the employees' morale at Siemens India
Ltd.
Today, in human resources management, employees areconsidered as the main actors and valuable capitals oforganizations.
Morale is one of the outstanding dimensions of healthyorganization. High morale is associated with the job satisfaction,creativeness and innovation, job honorability, commitment to
organization, eagerness to satisfy group objective instead ofindividual objectives and finally improving the organizationalperformance.
Problem Statement

7/30/2019 Industrial Define Problem (Idp)
http://slidepdf.com/reader/full/industrial-define-problem-idp 16/76
To gauge the condition of employee morale at Siemens
To know how they feel about this organization & its workenforce.
To identify the areas where employees experience low morale.
Objective of the Study
7/30/2019 Industrial Define Problem (Idp)
http://slidepdf.com/reader/full/industrial-define-problem-idp 17/76
The following testable hypothesis was formulated to guide
attainment of the research objectives. By using statistical tool,researcher was interested to know whether there is relationship
between transparent culture and employees’ morale
H0: There is an association between transparent culture andemployee happiness for enhancing moral.
H1: There is no association between transparent culture andemployee happiness.
Hypothesis framework

7/30/2019 Industrial Define Problem (Idp)
http://slidepdf.com/reader/full/industrial-define-problem-idp 18/76

7/30/2019 Industrial Define Problem (Idp)
http://slidepdf.com/reader/full/industrial-define-problem-idp 19/76
I have undertaken Descriptive Research Design for my research
work. Descriptive Research survey and fact finding inquiries ofdifferent kind. The major purpose of descriptive research is
descriptive the state of affairs, as it exist at present. The maincontrol over the variable; he can only report what has to discoverthe even when there he cannot the variable.
Sources Of Data:
Primary source
Secondary Sources
Research design

7/30/2019 Industrial Define Problem (Idp)
http://slidepdf.com/reader/full/industrial-define-problem-idp 20/76
Quantitative Data Collection Method The Quantitative data collection methods rely on random sampling
and structured data collection instruments that fit diverse experiences
into predetermined response categories. They produce results that areeasy to summarize, compare, and generalize.
Interview Method The interview method of research, typically, involves a face-to-face meeting
in which a researcher (interviewer) asks an individual a series of questions.
Structured Questionnaire
A questionnaire is a research instrument consisting of series ofquestions, arranged in an order, aimed at gathering informationfrom respondents. A questionnaire is a series of written questionsa researcher supplies to the prospective respondents, requestingtheir response
Data collection
7/30/2019 Industrial Define Problem (Idp)
http://slidepdf.com/reader/full/industrial-define-problem-idp 21/76
Qualitative Data Collection Method
Qualitative data collection methods play an importantrole in impact evaluation by providing information usefulto understand the processes behind observed results andassess changes in people’s perceptions of their well-being.
The qualitative methods most commonly used inevaluation can be classified in three broad categories:
In-depth interview
Observation methods
Document review
Continue…

7/30/2019 Industrial Define Problem (Idp)
http://slidepdf.com/reader/full/industrial-define-problem-idp 22/76
Population A population can be defined as including all people or items
with the characteristic one wish to understand. Population for
my Research work is all the employees working at the bottomlevel at Siemens India Ltd. and its size comprise of is 85employees.
Sampling method The methods used in drawing samples from a population
usually in such a manner that the sample will facilitatedetermination of some hypothesis concerning the population.
It is quite difficult to conduct census study in terms of coveringall employees at Siemens. So I have relied on sample study byselecting samples through Convince Sampling Method whichwill be representative of census population.
Continue…

7/30/2019 Industrial Define Problem (Idp)
http://slidepdf.com/reader/full/industrial-define-problem-idp 23/76
Sampling frame
A sampling frame is the source material or device from whicha sample is drawn. A Sample frame of my study is bottom levelemployees working at Siemens India Ltd.
Sample size
A sample size of my study is 50 permanent bottom levelemployees working at Siemens India ltd.
Data collection instrument
I have relied on Questionnaire Method for collecting primarydata to carry out Research Work. The Questionnaire will becombination of both Close ended and open ended questions
Continue…

7/30/2019 Industrial Define Problem (Idp)
http://slidepdf.com/reader/full/industrial-define-problem-idp 24/76
7/30/2019 Industrial Define Problem (Idp)
http://slidepdf.com/reader/full/industrial-define-problem-idp 25/76
SCALE FREQUEN
CY PERCENTAGE
NEVER 0 0 RARELY 0 0
SOME TIMES BUT NOT
VERY OFTEN 10 20
OFTEN BUT NOT ALWAYS 22 44 ALWAYS 18 36 TOTAL 50 100
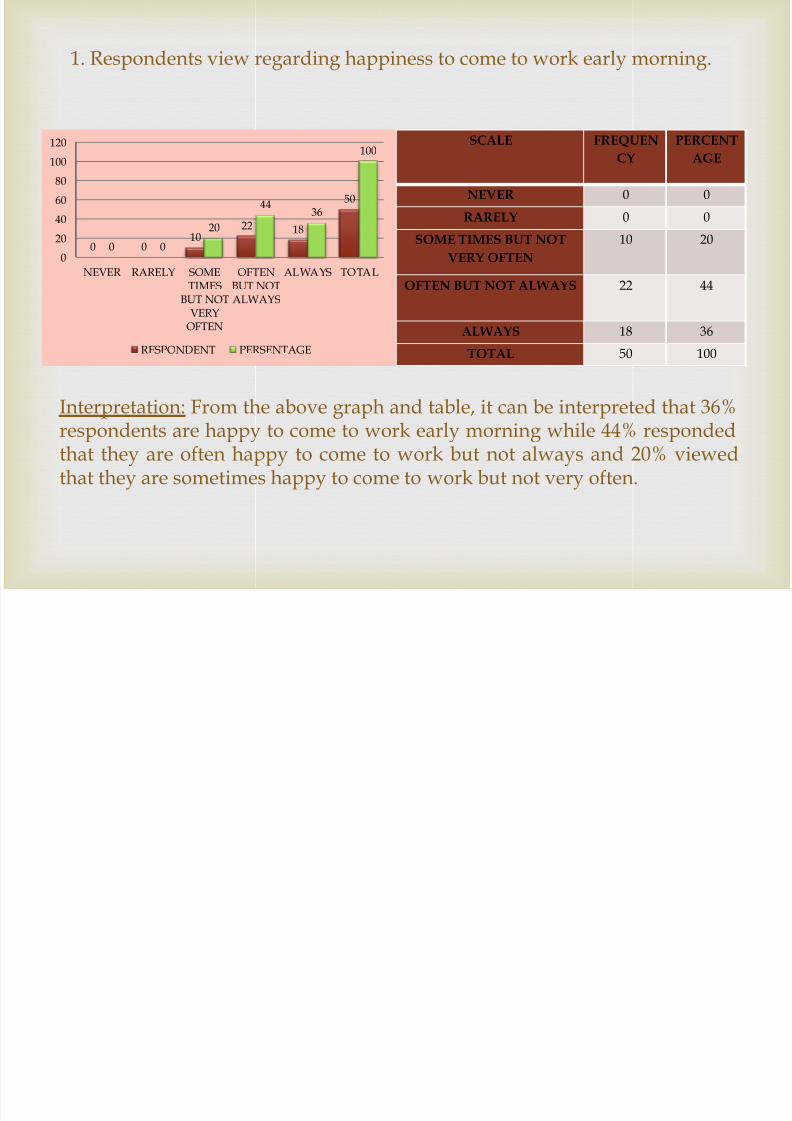
1. Respondents view regarding happiness to come to work early morning.
0 010
22 18
50
0 0
20
4436
100
0
20
40
60
80
100
120
NEVER RARELY SOMETIMES
BUT NOTVERY
OFTEN
OFTENBUT NOTALWAYS
ALWAYS TOTAL
RESPONDENT PERSENTAGE
Interpretation: From the above graph and table, it can be interpreted that 36%respondents are happy to come to work early morning while 44% respondedthat they are often happy to come to work but not always and 20% viewedthat they are sometimes happy to come to work but not very often.
7/30/2019 Industrial Define Problem (Idp)
http://slidepdf.com/reader/full/industrial-define-problem-idp 26/76
SCALE RESPOND
ENT PERCENTAGE
NEVER 0 0 RARELY 0 0
SOME TIMES BUT NOT
VERY OFTEN 10 20
OFTEN BUT NOT
ALWAYS 26 52
ALWAYS 14 28 TOTAL 50 100
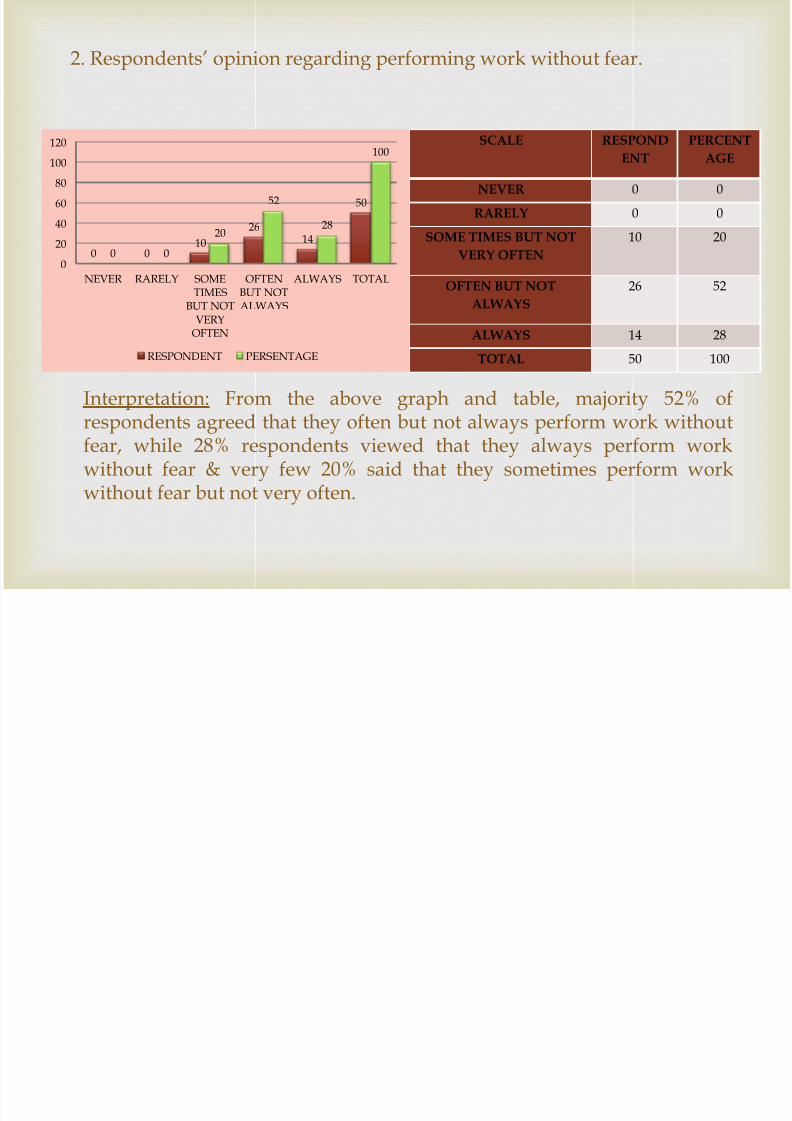
2. Respondents’ opinion regarding performing work without fear.
0 010
2614
50
0 0
20
52
28
100
0
20
40
60
80
100
120
NEVER RARELY SOMETIMES
BUT NOTVERY
OFTEN
OFTENBUT NOTALWAYS
ALWAYS TOTAL
RESPONDENT PERSENTAGE
Interpretation: From the above graph and table, majority 52% of
respondents agreed that they often but not always perform work withoutfear, while 28% respondents viewed that they always perform workwithout fear & very few 20% said that they sometimes perform workwithout fear but not very often.

7/30/2019 Industrial Define Problem (Idp)
http://slidepdf.com/reader/full/industrial-define-problem-idp 27/76
SCALE FREQUEN
CY PERCENTA
GE NEVER 0 0
RARELY 2 4 SOME TIMES BUT NOT
VERY OFTEN 14 28
OFTEN BUT NOTALWAYS 27 54 ALWAYS 7 14 TOTAL 50 100
3. Respondents view regarding security in employment.
0 214
27
7
50
0 4
28
54
14
100
0
20
40
60
80
100
120
NEVER RARELY SOME
TIMESBUT NOT
VERYOFTEN
OFTEN
BUT NOTALWAYS
ALWAYS TOTAL
RESPONDENT PERSENTAGE
Interpretation: From the above graph and table, 54% of the respondentsagreed that they often but not always feels secured about theiremployment, 28% respondents said that sometimes but not very oftenthey feel secured about their employment but very few 14% ofrespondents feel always secured about their employment
7/30/2019 Industrial Define Problem (Idp)
http://slidepdf.com/reader/full/industrial-define-problem-idp 28/76
SCALE FREQUENC
Y PERCENTA
GE NEVER 0 0
RARELY 6 12 SOME TIMES BUT NOT
VERY OFTEN 14 28
OFTEN BUT NOT ALWAYS 17 34
ALWAYS 13 26 TOTAL 50 100
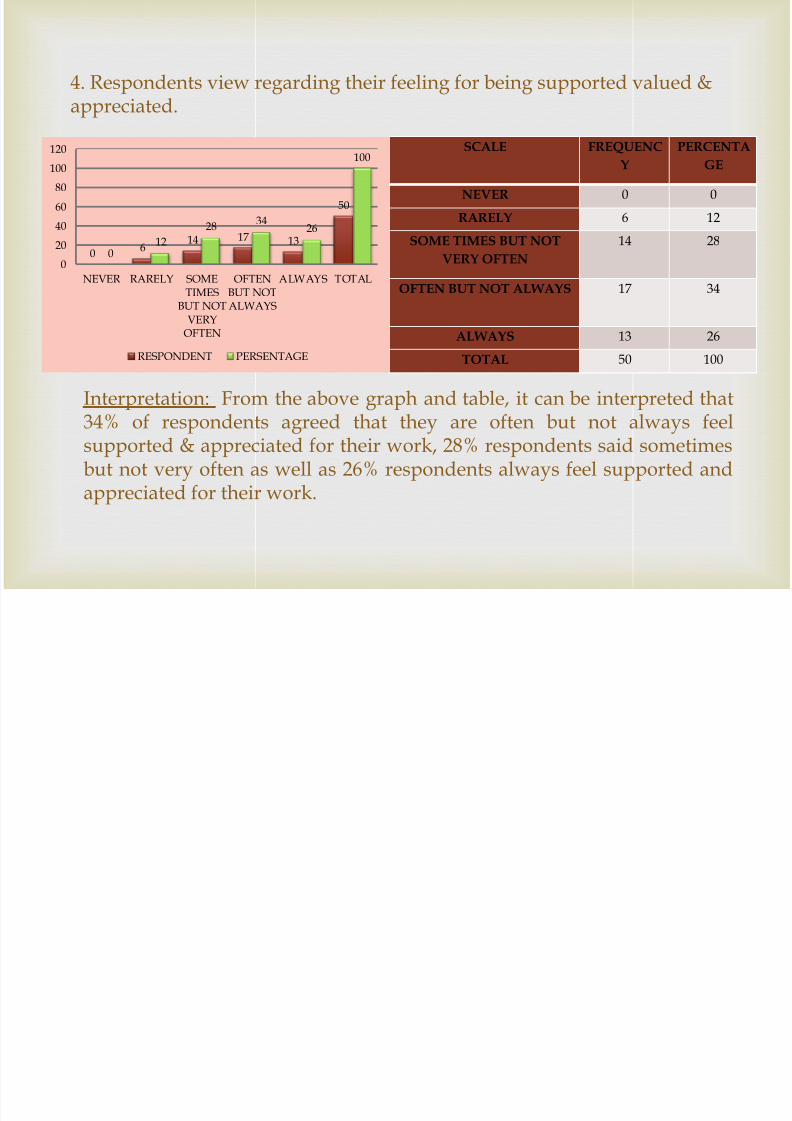
4. Respondents view regarding their feeling for being supported valued &appreciated.
06
14 17 13
50
012
2834
26
100
0
20
40
60
80
100
120
NEVER RARELY SOMETIMES
BUT NOTVERY
OFTEN
OFTENBUT NOTALWAYS
ALWAYS TOTAL
RESPONDENT PERSENTAGE
Interpretation: From the above graph and table, it can be interpreted that
34% of respondents agreed that they are often but not always feelsupported & appreciated for their work, 28% respondents said sometimesbut not very often as well as 26% respondents always feel supported andappreciated for their work.

7/30/2019 Industrial Define Problem (Idp)
http://slidepdf.com/reader/full/industrial-define-problem-idp 29/76
SCALE FREQUENC
Y PERCENT
AGE NEVER 0 0
RARELY 7 14 SOME TIMES BUT NOT
VERY OFTEN 19 38
OFTEN BUT NOT
ALWAYS 21 42
ALWAYS 3 6 TOTAL 50 100
5. Respondents’ opinion for having access to manager/supervisor whenneeded for making decision.
07
19 21
3
50
014
38 42
6
100
0
20
40
60
80
100
120
NEVER RARELY SOMETIMES
BUT NOTVERY
OFTEN
OFTENBUT NOTALWAYS
ALWAYS TOTAL
RESPONDENT PERSENTAGE
Interpretation: From the above graph and table, 42% of respondentsagreed that often but not always they have an access tomanager/supervisor when needed for making decision, when 38% ofrespondents that they sometimes but not very often have an access tomanager/supervisor when needed for making decision.

7/30/2019 Industrial Define Problem (Idp)
http://slidepdf.com/reader/full/industrial-define-problem-idp 30/76
SCALE FREQUENC
Y PERCENT
AGE NEVER 0 0
RARELY 2 4 SOME TIMES BUT NOT
VERY OFTEN 16 32
OFTEN BUT NOT
ALWAYS 15 30
ALWAYS 17 34 TOTAL 50 100
6. Respondents view regarding their awareness of expectation in job.
0 216 15 17
50
0 4
32 30 34
100
0
20
40
60
80
100
120
NEVER RARELY SOMETIMES
BUT NOTVERY
OFTEN
OFTENBUT NOTALWAYS
ALWAYS TOTAL
RESPONDENT PERSENTAGE
Interpretation: From the above graph and table, it can be interpreted thatmajority 34% respondents always knows what is expected from them.Whereas 32% of respondents agreed that some time but not very oftenthey are aware of what is expected from them. 30% agreed that often butnot always they are aware of what is expected from them.

7/30/2019 Industrial Define Problem (Idp)
http://slidepdf.com/reader/full/industrial-define-problem-idp 31/76
SCALE FREQUENC
Y PERCENT
AGE NEVER 0 0
RARELY 2 4 SOME TIMES BUT NOT
VERY OFTEN 9 18
OFTEN BUT NOT
ALWAYS 20 40
ALWAYS 19 38 TOTAL 50 100
7. Respondents’ opinions regarding adequate training, authority &resources given to them for doing their job.
0 29
20 19
50
0 4
18
40 38
100
0
20
40
60
80
100
120
NEVER RARELY SOMETIMES
BUT NOTVERY
OFTEN
OFTENBUT NOTALWAYS
ALWAYS TOTAL
RESPONDENT PERSENTAGE
Interpretation: From the above graph and table showed that 40% ofrespondents viewed that they are often but not always given the training& resources to perform the job, Where 38% of respondents agreed thatthey are always getting training, authority as well as resources to performthe job. Only 18% responded that they sometimes but not very often getadequate training, authority & resources for doing their job.
7/30/2019 Industrial Define Problem (Idp)
http://slidepdf.com/reader/full/industrial-define-problem-idp 32/76
SCALE FREQUENC
Y PERCENT
AGE NEVER 3 6
RARELY 4 8 SOME TIMES BUT NOT
VERY OFTEN 20 40
OFTEN BUT NOT
ALWAYS 9 18
ALWAYS 14 28 TOTAL 50 100
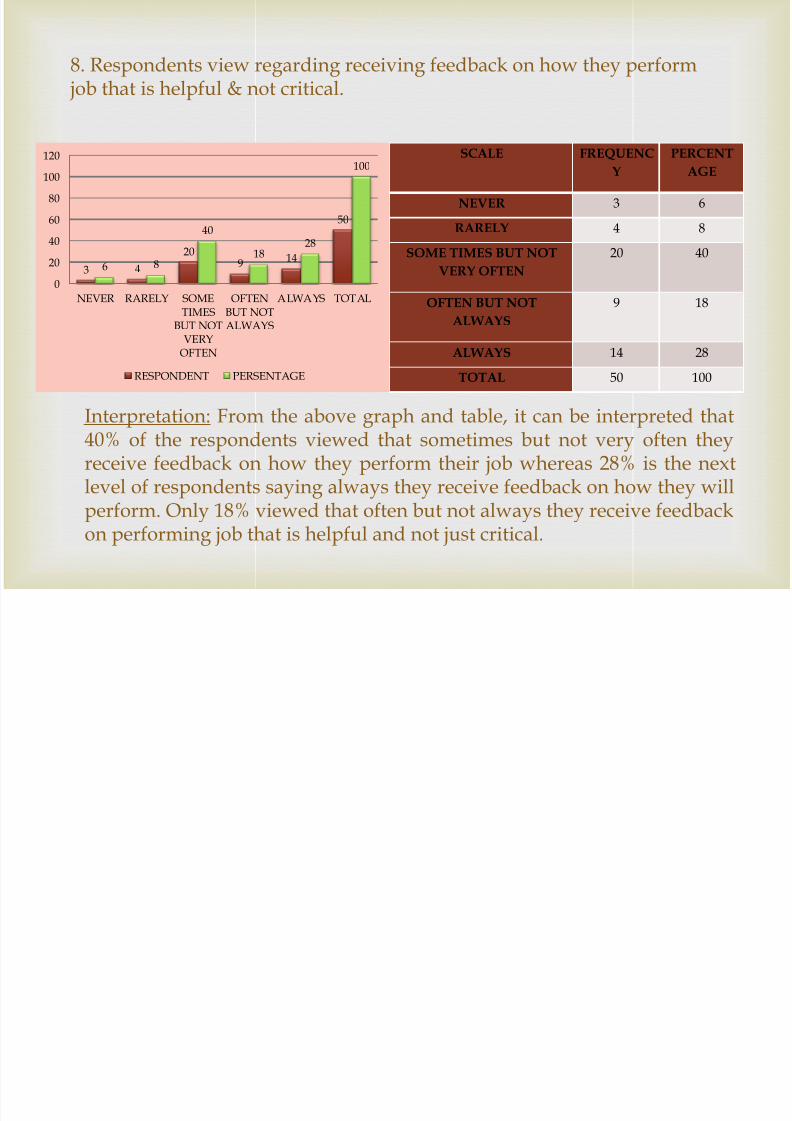
8. Respondents view regarding receiving feedback on how they perform job that is helpful & not critical.
3 4
209 14
50
6 8
40
1828
100
0
20
40
60
80
100
120
NEVER RARELY SOMETIMES
BUT NOTVERY
OFTEN
OFTENBUT NOTALWAYS
ALWAYS TOTAL
RESPONDENT PERSENTAGE
Interpretation: From the above graph and table, it can be interpreted that40% of the respondents viewed that sometimes but not very often theyreceive feedback on how they perform their job whereas 28% is the nextlevel of respondents saying always they receive feedback on how they willperform. Only 18% viewed that often but not always they receive feedbackon performing job that is helpful and not just critical.
7/30/2019 Industrial Define Problem (Idp)
http://slidepdf.com/reader/full/industrial-define-problem-idp 33/76
SCALE FREQUEN
CY PERCENTAGE
NEVER 0 0 RARELY 6 12
SOME TIMES BUT NOT
VERY OFTEN 15 30
OFTEN BUT NOT
ALWAYS 24 48
ALWAYS 5 10 TOTAL 50 100
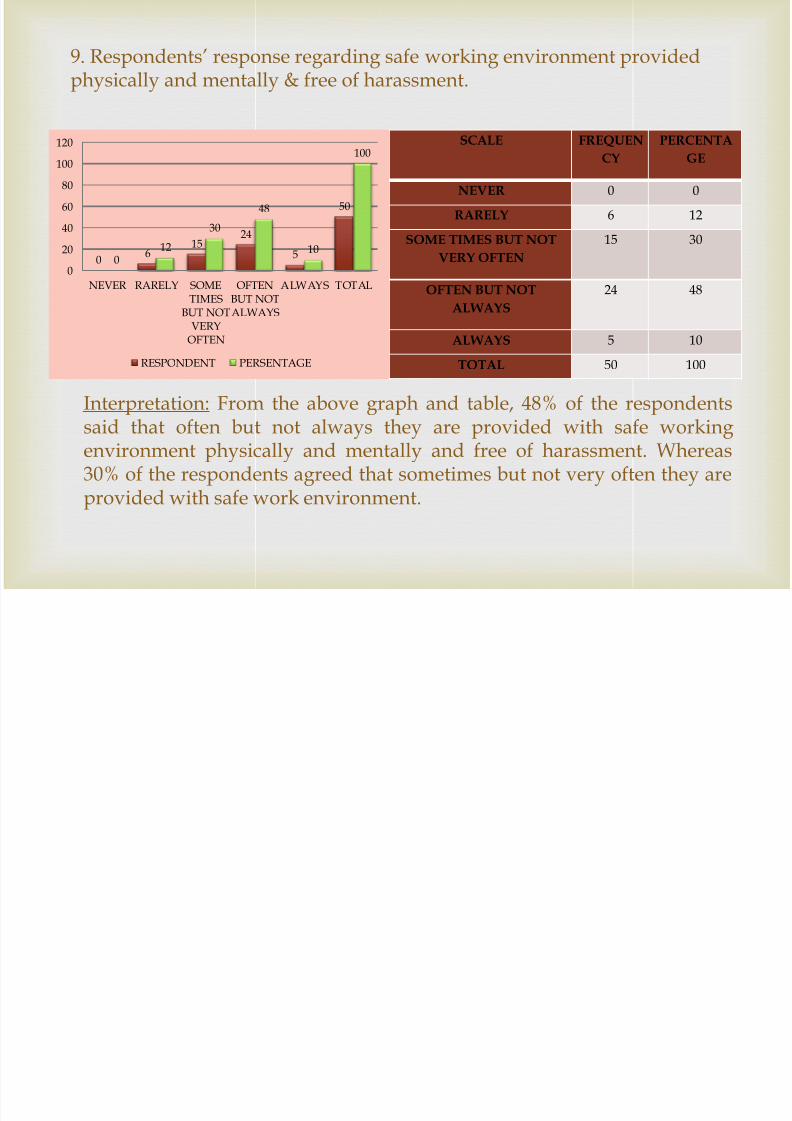
9. Respondents’ response regarding safe working environment providedphysically and mentally & free of harassment.
06
1524
5
50
012
30
48
10
100
0
20
40
60
80
100
120
NEVER RARELY SOMETIMES
BUT NOTVERY
OFTEN
OFTENBUT NOTALWAYS
ALWAYS TOTAL
RESPONDENT PERSENTAGE
Interpretation: From the above graph and table, 48% of the respondentssaid that often but not always they are provided with safe workingenvironment physically and mentally and free of harassment. Whereas30% of the respondents agreed that sometimes but not very often they areprovided with safe work environment.

7/30/2019 Industrial Define Problem (Idp)
http://slidepdf.com/reader/full/industrial-define-problem-idp 34/76
SCALE FREQUENCY PERCENTAGE NEVER 0 0
RARELY 7 14 SOME TIMES BUT
NOT VERY OFTEN 20 40
OFTEN BUT NOTALWAYS 20 40 ALWAYS 3 6 TOTAL 50 100
10. Response showing feeling of respondents for their accomplishment &pride.
07
20 20
3
50
014
40 40
6
100
0
20
40
60
80
100
120
NEVER RARELY SOMETIMES
BUT NOTVERY
OFTEN
OFTENBUT NOTALWAYS
ALWAYS TOTAL
RESPONDENT PERSENTAGE
Interpretation From the above graph and table, 40% of same level
respondents that are sometimes but not very often as well as often but notalways have feeling of accomplishments and pride, only 14% ofrespondents rarely having feeling of accomplishments.

7/30/2019 Industrial Define Problem (Idp)
http://slidepdf.com/reader/full/industrial-define-problem-idp 35/76
SCALE FREQUENC
Y PERCENTAGE
NEVER 0 0 RARELY 6 12
SOME TIMES BUT NOT
VERY OFTEN 23 46
OFTEN BUT NOTALWAYS 15 30 ALWAYS 6 12 TOTAL 50 100
11. Respondents’ views showing sufficient responsibility given to them intheir job.
06
2315
6
50
012
46
30
12
100
0
20
40
60
80
100
120
NEVER RARELY SOMETIMES
BUT NOTVERY
OFTEN
OFTENBUT NOTALWAYS
ALWAYS TOTAL
RESPONDENT PERSENTAGE
Interpretation: From the above graph and table, 46% of the respondents
agreed that sometimes but not very often they have sufficientresponsibility in their job, also 30% of the respondents often but notalways viewed that sufficient responsibility given to them, and 12%respondents in same level rarely and always have sufficient responsibilityin their job.

7/30/2019 Industrial Define Problem (Idp)
http://slidepdf.com/reader/full/industrial-define-problem-idp 36/76
SCALE FREQUENC
Y PERCENTAGE
NEVER 0 0 RARELY 4 8
SOME TIMES BUT NOT
VERY OFTEN 20 40
OFTEN BUT NOT
ALWAYS 19 38
ALWAYS 7 14 TOTAL 50 100
12. Respondents view regarding whether duties of their position areclearly defined or not.
0 4
20 197
50
08
40 38
14
100
0
20
40
60
80
100
120
NEVER RARELY SOMETIMES
BUT NOTVERY
OFTEN
OFTENBUT NOTALWAYS
ALWAYS TOTAL
RESPONDENT PERSENTAGE
Interpretation: From the above graph and table, 40% respondents said thatthey sometimes but not very often know duties of their position is clearlydefined, 38% respondents said that they often but not always know dutiesof their position in clearly defined, and 14% respondents said that theyalways know his duties of their position is clearly defined.
7/30/2019 Industrial Define Problem (Idp)
http://slidepdf.com/reader/full/industrial-define-problem-idp 37/76
SCALE FREQUENC
Y PERCENTAGE
NEVER 0 0 RARELY 2 4
SOME TIMES BUT NOT
VERY OFTEN 25 50
OFTEN BUT NOT
ALWAYS 14 28
ALWAYS 9 18 TOTAL 50 100
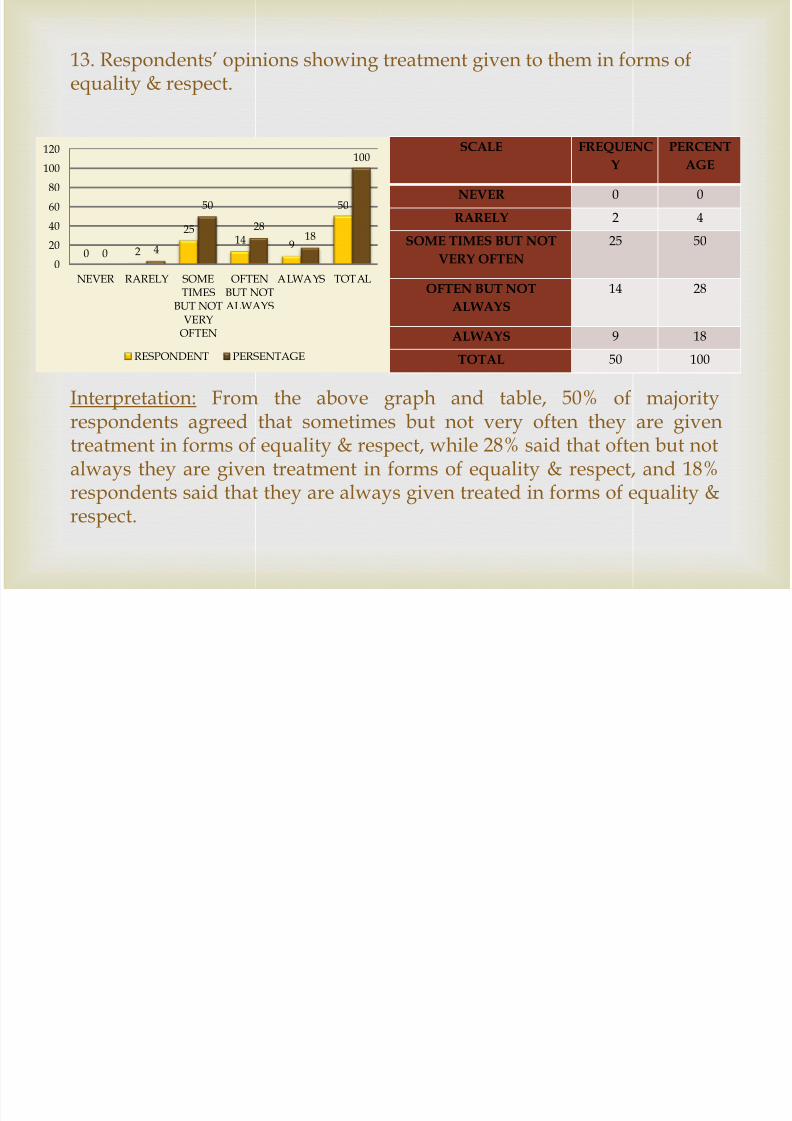
13. Respondents’ opinions showing treatment given to them in forms ofequality & respect.
0 2
2514 9
50
0 4
50
2818
100
0
20
40
60
80
100
120
NEVER RARELY SOMETIMES
BUT NOTVERY
OFTEN
OFTENBUT NOTALWAYS
ALWAYS TOTAL
RESPONDENT PERSENTAGE
Interpretation: From the above graph and table, 50% of majority
respondents agreed that sometimes but not very often they are giventreatment in forms of equality & respect, while 28% said that often but notalways they are given treatment in forms of equality & respect, and 18%respondents said that they are always given treated in forms of equality &respect.

7/30/2019 Industrial Define Problem (Idp)
http://slidepdf.com/reader/full/industrial-define-problem-idp 38/76
SCALE FREQUENC
Y PERCENTAGE
NEVER 0 0 RARELY 4 8
SOME TIMES BUT NOT
VERY OFTEN 15 30
OFTEN BUT NOT
ALWAYS 23 46
ALWAYS 8 16 TOTAL 50 100
14. Opinion showing respondents ability to maintain reasonable balancebetween their family life and work life.
0 415
23
8
50
08
30
46
16
100
0
20
40
60
80
100
120
NEVER RARELY SOMETIMES
BUT NOTVERY
OFTEN
OFTENBUT NOTALWAYS
ALWAYS TOTAL
RESPONDENT PERSENTAGE
Interpretation: From the above graph and table, 46% respondents said that
often but not always they are able to maintain balance between family andwork life, and 30% of them said that sometimes only the balance can bemaintained but not very often, and 16% can always maintain the equality.

7/30/2019 Industrial Define Problem (Idp)
http://slidepdf.com/reader/full/industrial-define-problem-idp 39/76
SCALE FREQUEN
CY PERCENT
AGE NEVER 0 0
RARELY 5 10 SOME TIMES BUT NOT
VERY OFTEN 19 38
OFTEN BUT NOT
ALWAYS 17 34 ALWAYS 9 18 TOTAL 50 100
15. Respondents’ views showing fair & equal opportunity to air grievancesin safe environment without fear of persecution.
0 5
19 179
50
010
38 34
18
100
0
20
40
60
80
100
120
NEVER RARELY SOMETIMES
BUT NOTVERY
OFTEN
OFTENBUT NOTALWAYS
ALWAYS TOTAL
RESPONDENT PERSENTAGE
Interpretation: From the above graphical analysis we can depict that 38%respondents feel that there is an equality opportunity to air grievanceswithout any fear, 34% of them said that often but not always and 18%agreed that always they have fair & equal opportunity to air grievances insafe environment without fear of persecution

7/30/2019 Industrial Define Problem (Idp)
http://slidepdf.com/reader/full/industrial-define-problem-idp 40/76
SCALE FREQUENC
Y PERCENTAGE
NEVER 0 0 RARELY 5 10
SOME TIMES BUT NOT
VERY OFTEN 15 30
OFTEN BUT NOT
ALWAYS 28 56
ALWAYS 2 4 TOTAL 50 100
16. Respondents’ views showing their happiness with pay levels.
0 515
28
2
50
010
30
56
4
100
0
20
40
60
80
100
120
NEVER RARELY SOMETIMES
BUT NOTVERY
OFTEN
OFTENBUT NOTALWAYS
ALWAYS TOTAL
RESPONDENT PERSENTAGE
Interpretation From the above graph it can concluded that 56%respondents are often but not always happy with the pay level and 30% ofthem said sometimes but not very often they are happy with the paylevels.
7/30/2019 Industrial Define Problem (Idp)
http://slidepdf.com/reader/full/industrial-define-problem-idp 41/76
SCALE
FREQUENC
Y PERCENTAGE
NEVER 1 2 RARELY 7 14
SOME TIMES BUT NOT
VERY OFTEN 13 26
OFTEN BUT NOT
ALWAYS 19 38
ALWAYS 10 20 TOTAL 50 100
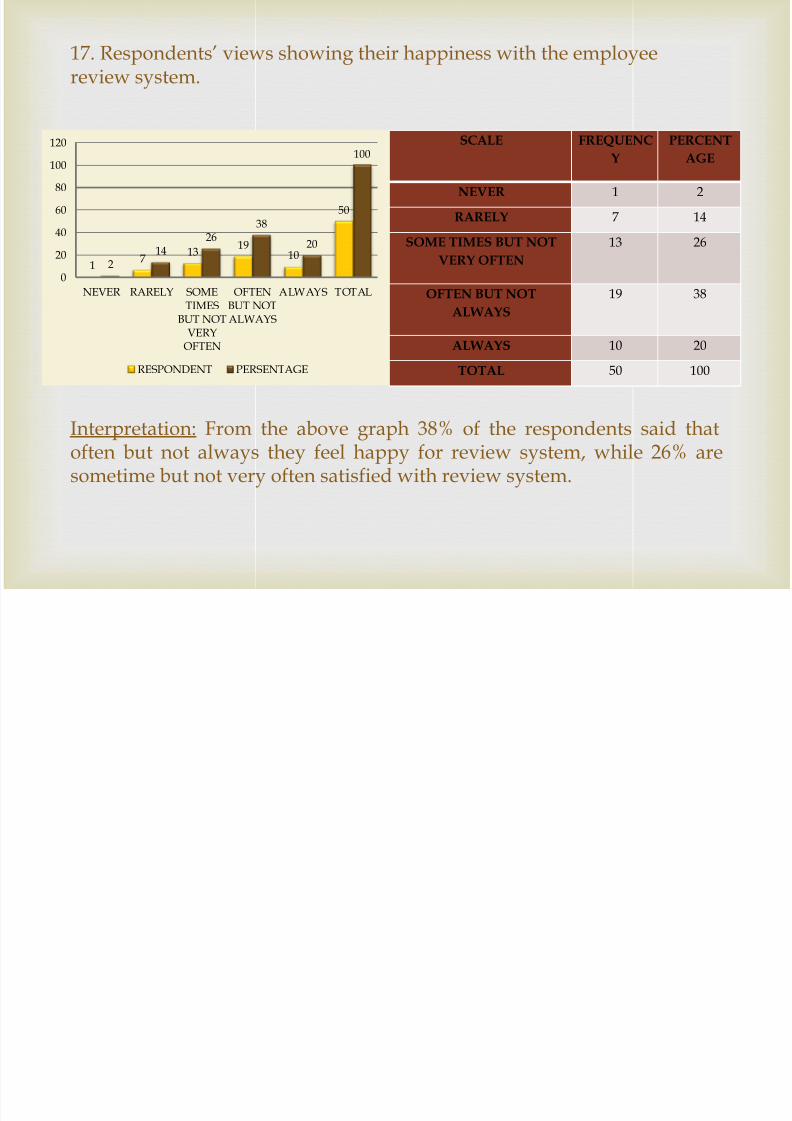
17. Respondents’ views showing their happiness with the employeereview system.
17
1319
10
50
214
2638
20
100
0
20
40
60
80
100
120
NEVER RARELY SOMETIMES
BUT NOTVERY
OFTEN
OFTENBUT NOTALWAYS
ALWAYS TOTAL
RESPONDENT PERSENTAGE
Interpretation: From the above graph 38% of the respondents said thatoften but not always they feel happy for review system, while 26% aresometime but not very often satisfied with review system.

7/30/2019 Industrial Define Problem (Idp)
http://slidepdf.com/reader/full/industrial-define-problem-idp 42/76
SCALE
FREQUENC
Y PERCENTAGE
NEVER 1 2 RARELY 9 18
SOME TIMES BUT NOT
VERY OFTEN 18 36
OFTEN BUT NOT
ALWAYS 18 36
ALWAYS 4 8 TOTAL 50 100
18. Respondents’ opinions regarding their involving and decisionsaffecting their work.
19
18 18
4
50
2
18
36 36
8
100
0
20
40
60
80
100
120
NEVER RARELY SOMETIMES
BUT NOTVERY
OFTEN
OFTENBUT NOTALWAYS
ALWAYS TOTAL
RESPONDENT PERSENTAGE
Interpretation: From the above graph and table 36% of respondentsopined some times and often they are involved and decision affecting theirwork but not very often and always, where 18% of respondents rarelytheir involving and decision affecting their work.

7/30/2019 Industrial Define Problem (Idp)
http://slidepdf.com/reader/full/industrial-define-problem-idp 43/76
SCALE FREQUENC
Y PERCENTAGE
NEVER 1 2 RARELY 11 22
SOME TIMES BUT NOT
VERY OFTEN 20 40
OFTEN BUT NOT
ALWAYS 13 26
ALWAYS 5 10 TOTAL 50 100
19. Opinion showing employee participation in problem solving.
111
2013
5
50
2
22
40
26
10
100
0
20
40
60
80
100
120
NEVER RARELY SOMETIMES
BUT NOTVERY
OFTEN
OFTENBUT NOTALWAYS
ALWAYS TOTAL
RESPONDENT PERSENTAGE
Interpretation: From the above graph and table, 40% of respondents said
that sometimes but not very often they participate in problem solving, 26%of respondents opined that often but not always participate in problemsolving, while 22% respondents say that rarely they participate in problemsolving.
7/30/2019 Industrial Define Problem (Idp)
http://slidepdf.com/reader/full/industrial-define-problem-idp 44/76
SCALE FREQUENC
Y PERCENTAGE
NEVER 1 2 RARELY 10 20
SOME TIMES BUT NOT
VERY OFTEN 28 56
OFTEN BUT NOT
ALWAYS 8 16
ALWAYS 3 6 TOTAL 50 100
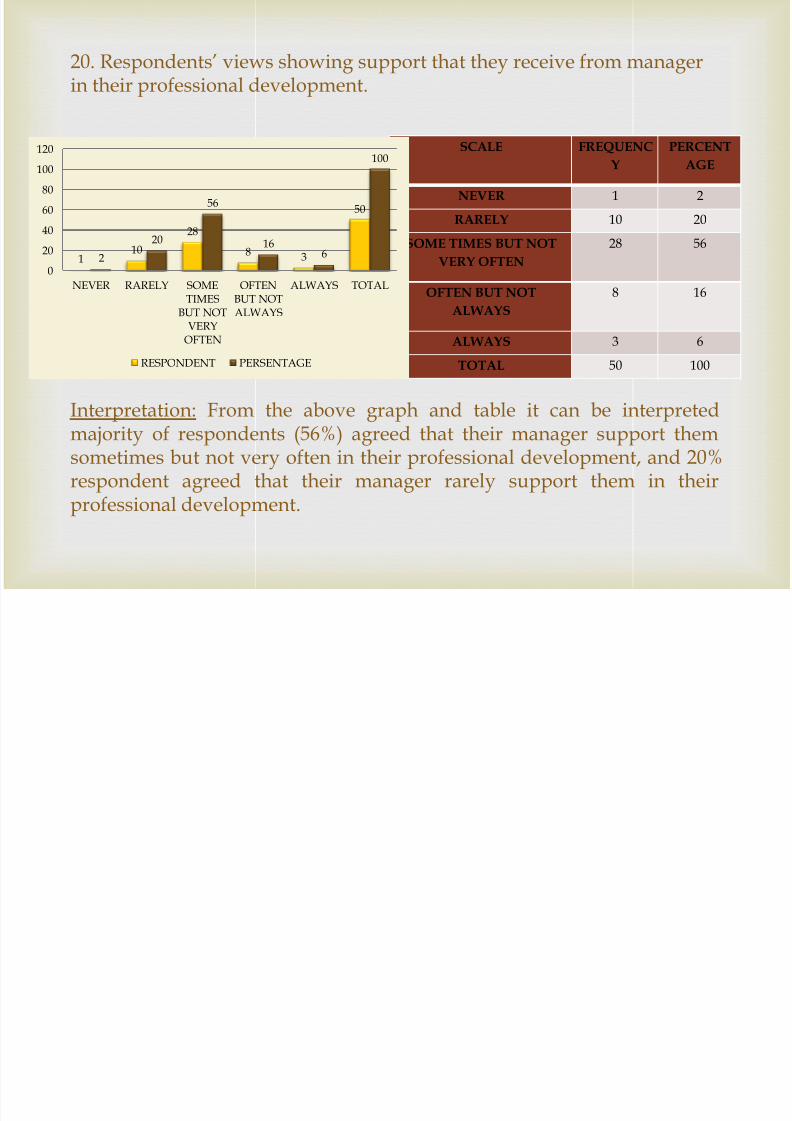
20. Respondents’ views showing support that they receive from managerin their professional development.
110
28
8 3
50
2
20
56
166
100
0
20
40
60
80
100
120
NEVER RARELY SOMETIMES
BUT NOTVERY
OFTEN
OFTENBUT NOTALWAYS
ALWAYS TOTAL
RESPONDENT PERSENTAGE
Interpretation: From the above graph and table it can be interpretedmajority of respondents (56%) agreed that their manager support themsometimes but not very often in their professional development, and 20%respondent agreed that their manager rarely support them in theirprofessional development.

7/30/2019 Industrial Define Problem (Idp)
http://slidepdf.com/reader/full/industrial-define-problem-idp 45/76
RESPOSES RESPON
DENT PERSEN
TAGE NEVER 0 0
RARELY 6 12 SOME TIMES BUT NOT
VERY OFTEN 22 44
OFTEN BUT NOT
ALWAYS 17 34
ALWAYS 5 10 TOTAL 50 100
21. Opinion regarding whether manager ensures that employees arerecognized and appreciated for they are efforts.
06
2217
5
50
012
4434
10
100
0
20
40
60
80
100
120
NEVER RARELY SOMETIMES
BUT NOTVERY
OFTEN
OFTENBUT NOTALWAYS
ALWAYS TOTAL
RESPONDENT PERSENTAGE
Interpretation: From the above graph and table, 44% respondents says thattheir manager sometimes but not very often ensure that employees arerecognized and appreciated for there are effort, 34% respondents believesthat their manager often but not always ensure that employees arerecognized and appreciated for there are effort.

7/30/2019 Industrial Define Problem (Idp)
http://slidepdf.com/reader/full/industrial-define-problem-idp 46/76
SCALE
FREQUENC
Y PERCENTAGE
NEVER 0 0 RARELY 10 20
SOME TIMES BUT NOT
VERY OFTEN 15 30
OFTEN BUT NOTALWAYS 13 26 ALWAYS 12 24 TOTAL 50 100
22. Respondents’ feeling regarding fair opportunity for advancement inthe company.
010 15 13 12
50
0
2030 26 24
100
0
20
40
60
80
100120
NEVER RARELY SOMETIMESBUT NOT
VERYOFTEN
OFTENBUT NOTALWAYS
ALWAYS TOTAL
RESPONDENT PERSENTAGE
Interpretation: From the above graph and table, it can be interpreted 32%
of respondents believe that sometimes but not very often workload isfairly allocated, 26% of respondents believes that always the load of workis being allocated.

7/30/2019 Industrial Define Problem (Idp)
http://slidepdf.com/reader/full/industrial-define-problem-idp 47/76
SCALE FREQUENC
Y PERCENTAGE
NEVER 1 2 RARELY 10 20
SOME TIMES BUT NOT
VERY OFTEN 16 32
OFTEN BUT NOT
ALWAYS 10 20
ALWAYS 13 26 TOTAL 50 100
23. Respondents’ opinions showing whether work load is fairly allocatedamong them.
110
1610 13
50
2
2032
2026
100
0
20
40
60
80
100
120
NEVER RARELY SOMETIMES
BUT NOTVERY
OFTEN
OFTENBUT NOTALWAYS
ALWAYS TOTAL
RESPONDENT PERSENTAGE
Interpretation: From the above graph and table, it can be interpreted 32%of respondents believe that sometimes but not very often workload isfairly allocated, 26% of respondents believes that always the load of workis being allocated.

7/30/2019 Industrial Define Problem (Idp)
http://slidepdf.com/reader/full/industrial-define-problem-idp 48/76
SCALE FREQUENC
Y PERCENT
AGE NEVER 1 2
RARELY 7 14 SOME TIMES BUT NOT
VERY OFTEN 19 38
OFTEN BUT NOT
ALWAYS 9 18
ALWAYS 14 28 TOTAL 50 100
24. Opinion showing whether employees are enjoying their job and beliefthat they have secure future in the company.
17
199 14
50
214
38
1828
100
0
20
40
60
80
100
120
NEVER RARELY SOMETIMES
BUT NOTVERY
OFTEN
OFTENBUT NOTALWAYS
ALWAYS TOTAL
RESPONDENT PERSENTAGE
Interpretation:From the above graph and table, 38% of the employeebelieves that they enjoy what they do and they find job security and 28%of the people feel as always.

7/30/2019 Industrial Define Problem (Idp)
http://slidepdf.com/reader/full/industrial-define-problem-idp 49/76
SCALE FREQUENC
Y PERCENTAGE
NEVER 6 12 RARELY 11 22
SOME TIMES BUT NOT
VERY OFTEN 19 38
OFTEN BUT NOT
ALWAYS 7 14 ALWAYS 7 14 TOTAL 50 100
25. Opinion showing whether new employees are given through oriented.
6 1119
7 7
50
1222
38
14 14
100
0
20
40
60
80
100
120
NEVER RARELY SOMETIMESBUT NOT
VERYOFTEN
OFTENBUT NOTALWAYS
ALWAYS TOTAL
RESPONDENT PERSENTAGE
Interpretation: From the above graph and table, show that 38% of the
respondents feel that orientation is given quite often and 22% feel thatrarely orientation is given to them, 14% off them feel that orientations isgiven to them always

7/30/2019 Industrial Define Problem (Idp)
http://slidepdf.com/reader/full/industrial-define-problem-idp 50/76
SCALE FREQUENC
Y PERCENTAGE
NEVER 0 0 RARELY 7 14
SOME TIMES BUT NOT
VERY OFTEN 25 50
OFTEN BUT NOT
ALWAYS 10 20
ALWAYS 8 16 TOTAL 50 100
26. Respondents’ views showing satisfaction with the professionalismshown by there are fellow peers and management.
07
25
10 8
50
0
14
50
20 16
100
0
20
40
60
80
100
120
NEVER RARELY SOMETIMES
BUT NOTVERY
OFTEN
OFTENBUT NOTALWAYS
ALWAYS TOTAL
RESPONDENT PERSENTAGE
Interpretation: From the above graph and table, 50% of the employeebelieve that a professional them sprit prevails among them and 20% feel itas quite often.

7/30/2019 Industrial Define Problem (Idp)
http://slidepdf.com/reader/full/industrial-define-problem-idp 51/76
SCALE FREQUENC
Y PERCENTAGE
NEVER 1 2 RARELY 11 22
SOME TIMES BUT NOT
VERY OFTEN 16 32
OFTEN BUT NOT
ALWAYS 15 30
ALWAYS 7 14 TOTAL 50 100
27. Views showing employee turnover in the company.
111
16 157
50
2
2232 30
14
100
0
20
40
60
80
100
120
NEVER RARELY SOMETIMES
BUT NOTVERY
OFTEN
OFTENBUT NOTALWAYS
ALWAYS TOTAL
RESPONDENT PERSENTAGE
Interpretation: From the above graph and table, the level of turnover is30% of the employee feels it as quite often and 22% of employee feel theturnover is rarely.
7/30/2019 Industrial Define Problem (Idp)
http://slidepdf.com/reader/full/industrial-define-problem-idp 52/76
SCALE
FREQUENCY PERCENTAGE
NEVER 4 8 RARELY 7 14
SOME TIMES BUT NOT
VERY OFTEN 24 48
OFTEN BUT NOT
ALWAYS 10 20
ALWAYS 5 10 TOTAL 50 100
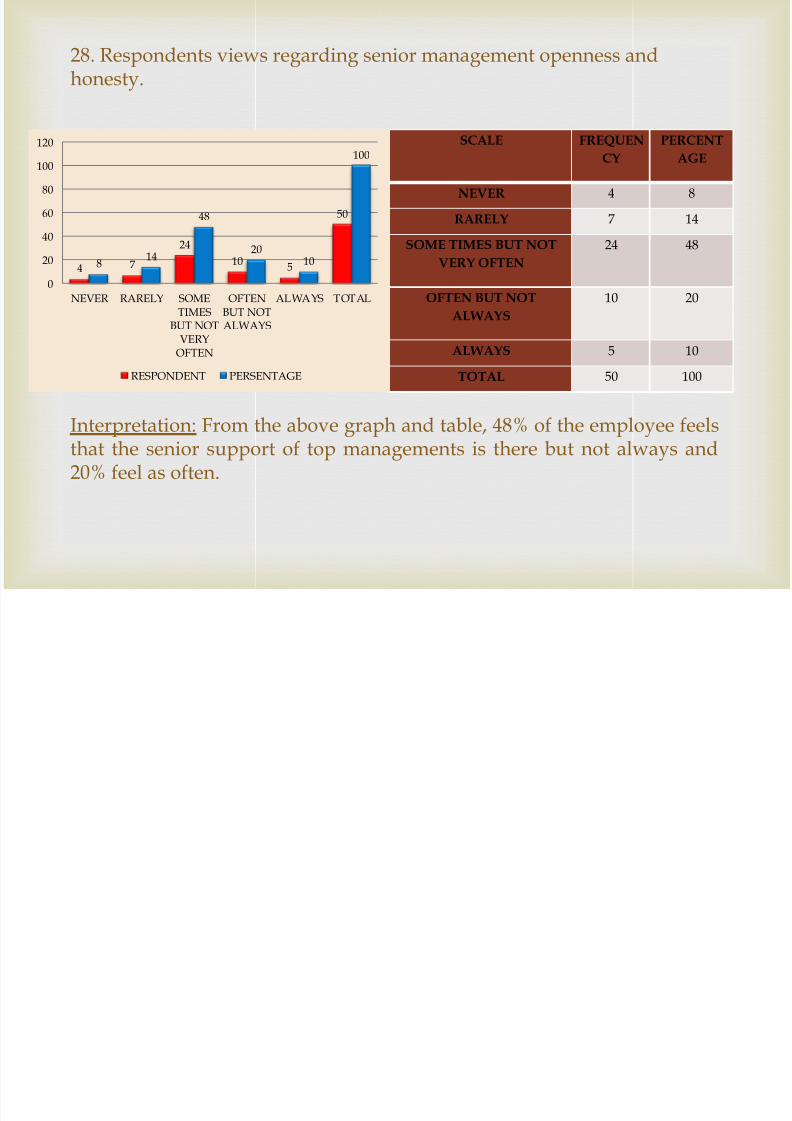
28. Respondents views regarding senior management openness andhonesty.
4 7
24
105
50
814
48
2010
100
0
20
40
60
80
100
120
NEVER RARELY SOMETIMES
BUT NOTVERY
OFTEN
OFTENBUT NOTALWAYS
ALWAYS TOTAL
RESPONDENT PERSENTAGE
Interpretation: From the above graph and table, 48% of the employee feelsthat the senior support of top managements is there but not always and20% feel as often.

7/30/2019 Industrial Define Problem (Idp)
http://slidepdf.com/reader/full/industrial-define-problem-idp 53/76
SCALE
FREQUENCY PERCENTAGE
NEVER 0 0 RARELY 5 10
SOME TIMES BUT NOT
VERY OFTEN 18 36
OFTEN BUT NOT
ALWAYS 24 48
ALWAYS 3 6 TOTAL 50 100
29. Respondents views showing presence of internal communicationsystem in the company.
0 518
24
3
50
010
3648
6
100
0
20
40
60
80
100120
NEVER RARELY SOMETIMES
BUT NOTVERY
OFTEN
OFTENBUT NOTALWAYS
ALWAYS TOTAL
RESPONDENT PERSENTAGE
Interpretation: From the above graph and table, the flow ofcommunication is often but not always for 48% of communication, and36% feel that sometimes the communication is there but not very often.

7/30/2019 Industrial Define Problem (Idp)
http://slidepdf.com/reader/full/industrial-define-problem-idp 54/76
SCALE FREQUENC
Y PERCENTAGE
NEVER 0 0 RARELY 3 6
SOME TIMES BUT NOT
VERY OFTEN 19 38
OFTEN BUT NOT
ALWAYS 19 38
ALWAYS 9 18 TOTAL 50 100
30. Respondents’ opinion regarding how well the company is managedand their trust on leadership.
0 3
19 199
50
06
38 38
18
100
0
20
40
60
80
100
120
NEVER RARELY SOMETIMES
BUT NOTVERY
OFTEN
OFTENBUT NOTALWAYS
ALWAYS TOTAL
RESPONDENT PERSENTAGE
Interpretation: From the above graph and table, good quality of leadershipprevails accordingly 38% of the employed and 18% of them feel thatleadership is always.

7/30/2019 Industrial Define Problem (Idp)
http://slidepdf.com/reader/full/industrial-define-problem-idp 55/76
SCALE FREQUENC
Y PERCENT
AGE NEVER 0 0
RARELY 5 10 SOME TIMES BUT NOT
VERY OFTEN
17 34
OFTEN BUT NOT
ALWAYS 20 40
ALWAYS 8 16 TOTAL 50 100
31. Respondents’ opinion showing employee benefits provided by thecompany.
0 5
17 20
8
50
0 10
3440
16
100
0
20
40
60
80
100
120
NEVER RARELY SOMETIMES
BUT NOTVERY
OFTEN
OFTENBUT NOTALWAYS
ALWAYS TOTAL
RESPONDENT PERSENTAGE
Interpretation: From the above graph and table, Employee benefits areoften accordingly to 40% of employee and 34% feel that sometimes theemployee benefits are there.

7/30/2019 Industrial Define Problem (Idp)
http://slidepdf.com/reader/full/industrial-define-problem-idp 56/76
SCALE FREQUENC
Y PERCENTAGE
NEVER 1 2 RARELY 2 4
SOME TIMES BUT NOT
VERY OFTEN 14 28
OFTEN BUT NOT
ALWAYS 20 40
ALWAYS 13 26 TOTAL 50 100
32. Respondents’ views regarding moral that they enjoy in the company.
1 214
2013
50
2 4
2840
26
100
0
20
40
60
80
100
120
NEVER RARELY SOMETIMES
BUT NOTVERY
OFTEN
OFTENBUT NOTALWAYS
ALWAYS TOTAL
RESPONDENT PERSENTAGE
Interpretation: From the above graph and table, Employee morale is oftenseen accordingly to 40% of employee and 28% feel sometimes and 26% asalways.

7/30/2019 Industrial Define Problem (Idp)
http://slidepdf.com/reader/full/industrial-define-problem-idp 57/76
SCALE FREQUENC
Y PERCENTAGE
NEVER 0 0 RARELY 4 8
SOME TIMES BUT NOT
VERY OFTEN 21 42
OFTEN BUT NOT
ALWAYS 19 38
ALWAYS 6 12 TOTAL 50 100
33. Respondents’ opinions whether company consistently fosters goodemployee relations and morale.
0 4
21 196
50
08
42 38
12
100
0
20
40
60
80
100
120
NEVER RARELY SOMETIMES
BUT NOTVERY
OFTEN
OFTENBUT NOTALWAYS
ALWAYS TOTAL
RESPONDENT PERSENTAGE
Interpretation: From the above graph and table, there is a good employeerelation accordingly to 42% of employees as sometimes and accordingly to38% of them it is often.

7/30/2019 Industrial Define Problem (Idp)
http://slidepdf.com/reader/full/industrial-define-problem-idp 58/76
SCALE FREQUENC
Y PERCENTAGE
NEVER 0 0 RARELY 2 4
SOME TIMES BUT NOT
VERY OFTEN 16 32
OFTEN BUT NOT
ALWAYS 15 30
ALWAYS 17 34 TOTAL 50 100
34. Respondents’ opinion showing their commitment to the company’ssuccess and pride they take in their success.
0 2
16 15 17
50
0 4
32 30 34
100
0
20
40
60
80
100
120
NEVER RARELY SOMETIMES
BUT NOTVERY
OFTEN
OFTENBUT NOTALWAYS
ALWAYS TOTAL
RESPONDENT PERSENTAGE
Interpretation: From the above graph and table, organizationcommitments is consistently seen in 34% of employees 32% feel assometimes 30% as often.
7/30/2019 Industrial Define Problem (Idp)
http://slidepdf.com/reader/full/industrial-define-problem-idp 59/76
SCALE FREQUENC
Y PERCENTAGE
NEVER 0 0 RARELY 0 0
SOME TIMES BUT NOT
VERY OFTEN 19 38
OFTEN BUT NOT
ALWAYS 18 36
ALWAYS 13 26 TOTAL 50 100
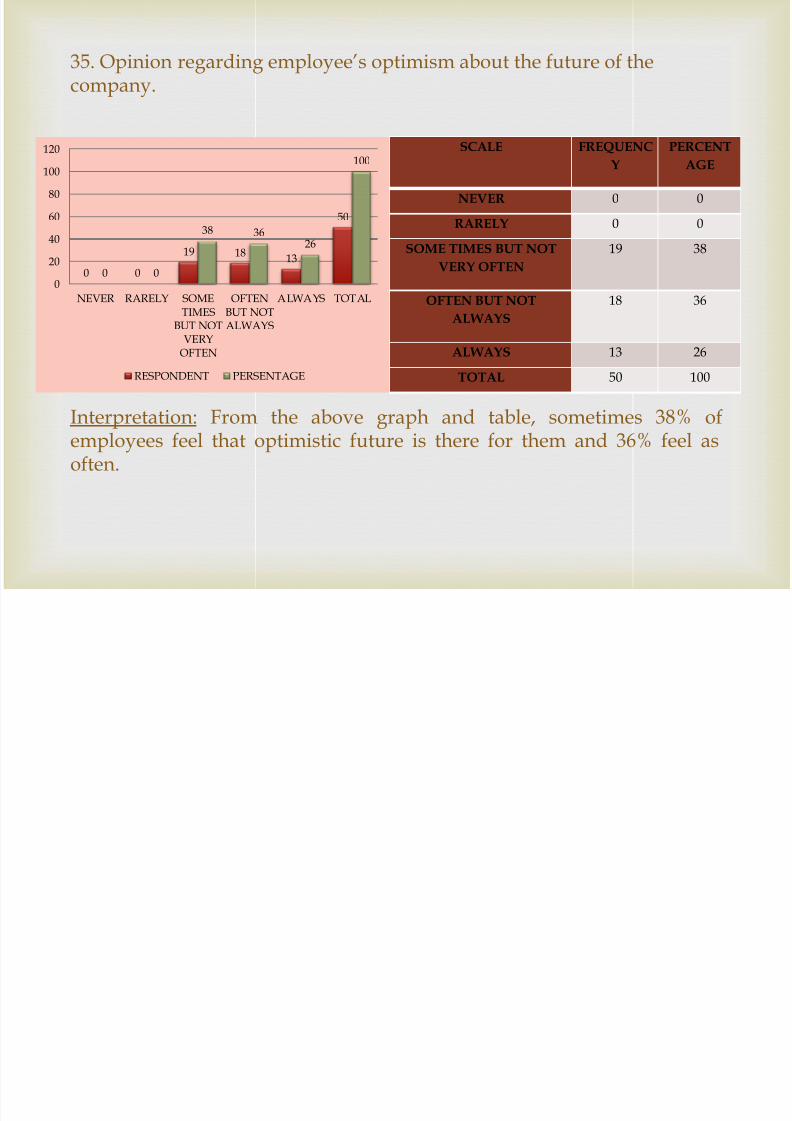
35. Opinion regarding employee’s optimism about the future of thecompany.
0 0
19 1813
50
0 0
38 3626
100
0
20
40
60
80
100
120
NEVER RARELY SOMETIMES
BUT NOTVERY
OFTEN
OFTENBUT NOTALWAYS
ALWAYS TOTAL
RESPONDENT PERSENTAGE
Interpretation: From the above graph and table, sometimes 38% ofemployees feel that optimistic future is there for them and 36% feel asoften.

7/30/2019 Industrial Define Problem (Idp)
http://slidepdf.com/reader/full/industrial-define-problem-idp 60/76
SCALE
FREQUENCY PERCENTAGE
NEVER 0 0 RARELY 0 0
SOME TIMES BUT NOT
VERY OFTEN 10 20
OFTEN BUT NOT
ALWAYS 22 44
ALWAYS 18 36 TOTAL 50 100
36. Opinion showing overall happiness with job and place in the company.
0 010
22 18
50
0 0
20
4436
100
0
20
40
60
80
100120
NEVER RARELY SOME
TIMESBUT NOTVERY
OFTEN
OFTEN
BUT NOTALWAYS
ALWAYS TOTAL
RESPONDENT PERSENTAGE
Interpretation: From the above graph and table, happiness is seen in 44%
of employed as often and 36% of them as always.

7/30/2019 Industrial Define Problem (Idp)
http://slidepdf.com/reader/full/industrial-define-problem-idp 61/76
Employees at Siemens are often happy to come to work but not always
Maximum employees agreed that they often but not always perform work without
fear; very few said that they sometimes perform work without fear but not veryoften.
Employees agreed that they often but not always feels secured about theiremployment and very few feel always secured about their employment.
Employees at Siemens are often but not always feel supported, valued andappreciated for their work, and they have often but not always an access tomanager/supervisor when needed for making decision
Employees are always aware of their expectation in job.
In Siemens, employees are often but not always given the training & resources toperform their job, and few no. of employees said that the sometimes but not veryoften they get adequate training, authority and resources for doing their job.
Employees are viewed that sometimes but not very often they receive feedback onhow they perform their job, and few of them viewed that often but not always they
receive feedback on performing job that is helpful and not just critical. Employee often but not always is provided with safe working environment
physically and mentally and free of harassment, and few of them said they alwaysget safe working environments physically and mentally & free of harassment.
In Siemens employees same level respondents that are sometimes but not very oftenas well as often but not always have feeling of accomplishments and pride, and fewof them rarely have any feeling of accomplishments.
Result & Findings
Employees agreed that sometimes but not very often they have sufficient

7/30/2019 Industrial Define Problem (Idp)
http://slidepdf.com/reader/full/industrial-define-problem-idp 62/76
responsibility in their job, and few of them rarely and always have sufficientresponsibility in their job.
Siemens employee sometimes but not very often knows duties of their position, andfew of them rarely know this duty of their position and it is clearly defined.
Employees in company sometimes but not very often are given treatment in forms ofequality & respect, and few of them rarely given treatment in forms of equality &respects.
In Siemens Company majority employees often but not always are able to maintainbalance between family and work life, and few of them rarely are able to maintainthe balance.
Siemens employees feel that there is a quality opportunity to air grievances without
any fear, and few of them rarely have fair and equal opportunity to air grievances insafe environment without fear of persecution.
In company employees are often but not always happy with the pay level, and few ofthem are always happy with the pay levels.
In Siemens company employees that their often but not always feel happy for reviewsystem, and few of them are never satisfied with review systems.
Employees of Siemens are sometimes opened and often they are involved indecisionaffecting their work, and few of them said that they are never involved in decisionaffecting their work.
Employees said that sometimes but not very often they participate in problemsolving, and few of them never participate in problem solving.
In company employees agreed that their manager support them sometimes but notvery often in their professional development and few no. of people said that they
rarely support them in their professional development.
In Siemens Company Employee says that their manager sometimes but not very

7/30/2019 Industrial Define Problem (Idp)
http://slidepdf.com/reader/full/industrial-define-problem-idp 63/76
often ensure that employees are recognized and appreciated for there are effort, andfew no. of employees says always manager recognized and appreciate their effort.
Siemens Employees agreed that they are sometimes but not very often provided fairopportunity for advancements, and few of them rarely agreed that they are providedfair opportunity advancement in the company.
In Siemens Company employees believe that sometimes but not very often workloadis fairly allocated, and few of them rarely believe in.
In Siemens company employees believes that they enjoy what they do and they find job security, and few of them rarely believes in.
Siemens company employees feel that orientation is given quite often, but few no. ofemployees never feel that.
Employees believe that a professional spirit prevails among them, and few of themfeel is as quite often.
It is found that sometimes but not very often there is employee turnover in thecompany.
In Siemens company employees sometimes but not very often feels that seniormanagements exhibit openness & honesty.
Employees viewed that often but not always there is a presence of internalcommunication in the company.
Majority of the employees has the same view that often but not always andsometimes but not very often company is able to manage well and they have trust onleadership
Employees benefits are often but not always provided by the company
In the company employee often but not always enjoy good morale, and few said they
always enjoy good morale in the company.
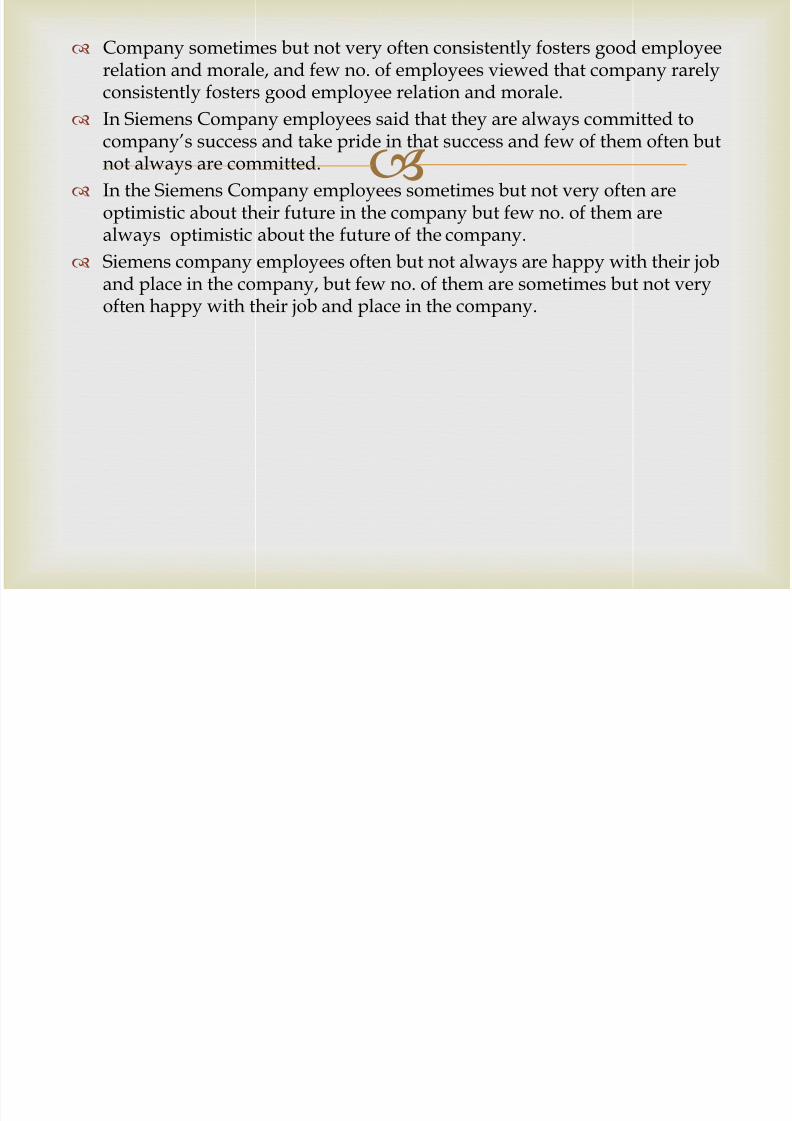
Company sometimes but not very often consistently fosters good employee
7/30/2019 Industrial Define Problem (Idp)
http://slidepdf.com/reader/full/industrial-define-problem-idp 64/76
Company sometimes but not very often consistently fosters good employeerelation and morale, and few no. of employees viewed that company rarelyconsistently fosters good employee relation and morale.
In Siemens Company employees said that they are always committed to
company’s success and take pride in that success and few of them often butnot always are committed.
In the Siemens Company employees sometimes but not very often areoptimistic about their future in the company but few no. of them arealways optimistic about the future of the company.
Siemens company employees often but not always are happy with their job
and place in the company, but few no. of them are sometimes but not veryoften happy with their job and place in the company.

7/30/2019 Industrial Define Problem (Idp)
http://slidepdf.com/reader/full/industrial-define-problem-idp 65/76
Step 1: Set up hypothesis:
H0: There is an association between transparent culture and employee happinessfor enhancing moral.
H1: There is no association between transparent culture and employeehappiness.
Step 2: set up suitable significant level. We will test the validity of Ho against that H1 at a certain level of significant. For my research work and hypothesis, I will take 95% significance level
Step 3: Test Statistic: For the hypothesis testing I have relied on non-parametric test because the
properties are matching with non-parametric test.
Properties:- It not the normal distribution The sample size is more than 30. So I have to rely upon the non-parametric test. The test which can be used to
compare hypothesis chi-square to check.
Hypothesis testing andinterpretation
Step 4: Calculation:
7/30/2019 Industrial Define Problem (Idp)
http://slidepdf.com/reader/full/industrial-define-problem-idp 66/76
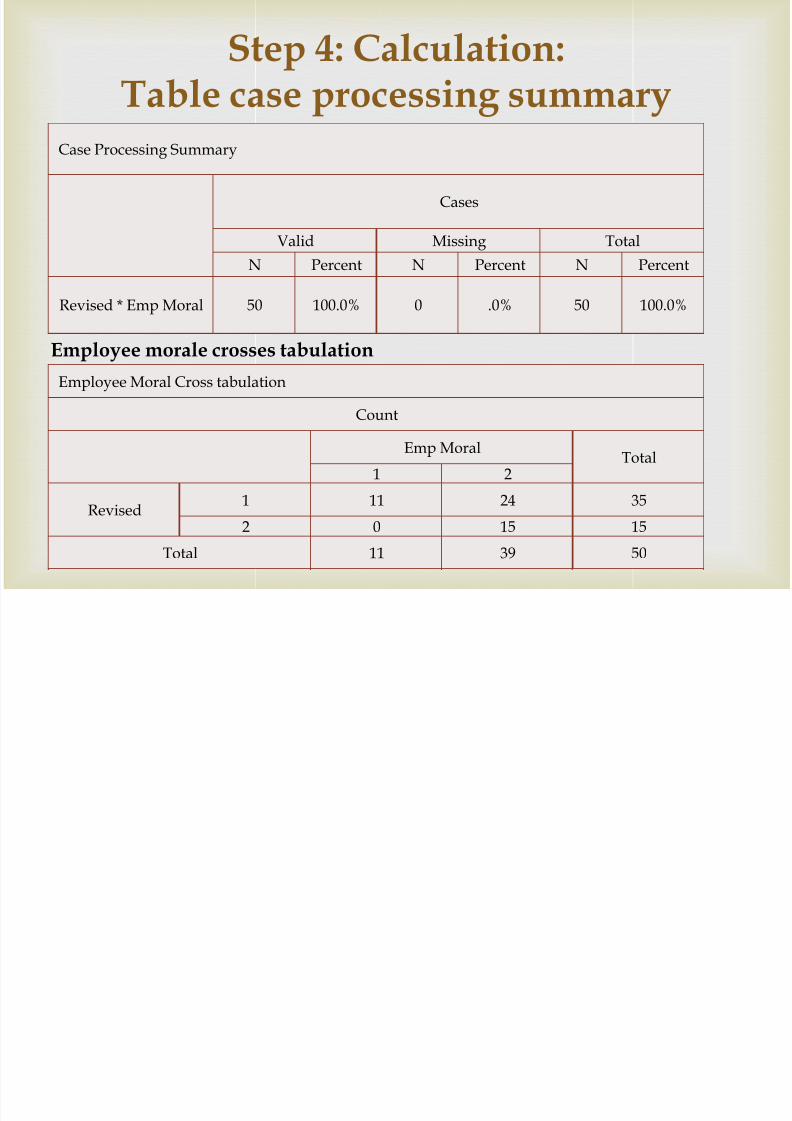
Case Processing Summary
Cases Valid Missing Total
N Percent N Percent N Percent Revised * Emp Moral 50 100.0% 0 .0% 50 100.0%
Step 4: Calculation: Table case processing summary
Employee morale crosses tabulation
Employee Moral Cross tabulation Count
Emp Moral Total
1 2 Revised 1 11 24 35
2 0 15 15 Total 11 39 50

7/30/2019 Industrial Define Problem (Idp)
http://slidepdf.com/reader/full/industrial-define-problem-idp 67/76
Chi-Square Tests Value Df Asymp. Sig.
(2-sided) Exact Sig.(2-sided) Exact Sig.
(1-sided) Pearson Chi-Square 6.044a 1 .014
ContinuityCorrectionb 4.351 1 .037
Likelihood Ratio 9.117 1 .003 Fisher's Exact Test .021 .011 Linear-by-Linear
Association 5.923 1 .015 N of Valid Cases 50
Chi-square test
Step 5: Making Decision: The table provides required information of Chi-Square test. Thevalue of Pearson Chi-Square is 6.044 and associated significance
value is .o14 (which is less than 0.05). Therefore, the nullhypothesis is rejected
Conclusion:We say there is association between open & transparent cultureand employee happiness for enhancing Employee Morale.

7/30/2019 Industrial Define Problem (Idp)
http://slidepdf.com/reader/full/industrial-define-problem-idp 68/76
The study is only limited at Siemens India Ltd.
The study was on 50 selected employees, so their
need not be the universal opinion.Workers are always busy in their work. It may not
have given clear answer.
The study is to taken up for the academic purpose.
Data arrangement and calculation in SPSS software. The report made under company rules and policies.
Limitation Of study

7/30/2019 Industrial Define Problem (Idp)
http://slidepdf.com/reader/full/industrial-define-problem-idp 69/76
CONCLUSION
Morale is psychological concept. Morale is not a cause but ratherthe effect or result of many going away. Morale drifters fromperson to person, industry to industry, level of education age,nature of work etc. Morale may be range from very high to verylow.
By this study it is clear that various factors which influencesmorale and productivity of the employees each as Social Securitymeasures, welfare facilities, salary status, Bonus, heath condition,shift system and recognition of work are getting much importance.
To conclude employee morale plays very important role in everyorganization. Good employee morale helps to success of theorganization. Unless an employee has poor morale if always apossibility of employee disharmony and also affect smoothrunning of the organization.
Conclusion And Suggestion

7/30/2019 Industrial Define Problem (Idp)
http://slidepdf.com/reader/full/industrial-define-problem-idp 70/76
SUGGESTION To improve Better teamwork with your colleagues, Better employee
relations if you’re a manager, more satisfied customers if you’re in aservice job, improved sales if you’re a sales person.
We don’t just take the easy road when it comes to making change forpeople, we do whatever it takes. We work with people from allbackgrounds, religious beliefs, cultures and races. We treat all people withrespect and without discrimination.
Employees need emotional security above everything else to prosper orreally be that productive at work place.
Recognize hard work / good work done in a transparent manner. Rewardsuch people. If the work done is appreciated and rewarded in a transparent
manner, that itself goes a long way to making an employee feel moresecure. Employees expect their boss to be human. Owning up to your mistakes is
perhaps the best way of connecting with employees. "The management canalso ensure that senior employees don't get away with mistakes, andensure the rules are the same for everybody, irrespective of rank”.
Continue…
7/30/2019 Industrial Define Problem (Idp)
http://slidepdf.com/reader/full/industrial-define-problem-idp 71/76
Though expectations vary among individuals, three basic needs are common to
most people: To engage in work that is interesting and that provides a sense of
accomplishment.
To feel that the job offers economic stability. To grow toward personal potential.
You can impact training and development significantly through theresponsibilities in an employee’s current job. Expand the job to include new, higher level responsibilities. Reassign responsibilities that the employee does not like or that are
routine.
Provide more authority for the employee to self-manage and makedecisions. Professionals in the industry of employee research say offering general
feedback opportunities are important — open-office policies or meeting withmanagers — but specific targeting of issues can help guide your companythrough difficult times.
Continue…
Occupational health and safety (the physical work environment) encompasses

7/30/2019 Industrial Define Problem (Idp)
http://slidepdf.com/reader/full/industrial-define-problem-idp 72/76
Occupational health and safety (the physical work environment) encompassesthe promotion and maintenance of the physical, mental and social well-being ofworkers. It includes reducing work-related injury, illness and disability byaddressing the hazards and risks of the physical environment. Reducingphysical job hazards can also reduce stress employees may feel in the
workplace. Guidelines to improve employee sufficient responsibility: (1) determine
whether a worksite problem can be solved by training; (2) determine whattraining, if any, is needed; (3) identify goals and objectives for the training; (4)design learning activities; (5) conduct training; (6) determine the effectivenessof the training; and (7) revise the training program based on feedback from
employees, supervisors, and others. A decade back, employees used to have fixed working hours or rather a 9 to 5
job from Monday to Friday. The boundary between the work and home hasdisappeared with time. But with globalization and people working acrosscountries, the concept of fixed working hours is fading away. Instead of just 7or 8 a day, people are spending as much as 12-16 hours every day in office.
It must set a pay policy stipulating how well it will pay its employees relative tothe market (i.e., what competitors pay for similar jobs). The determination of apay policy is a crucial step in the design of a pay system. If pay rates are set toolow, the organization is likely to experience recruitment and turnoverproblems. If set too high, however, the organization is likely to experiencebudget problems that ultimately may lead to higher prices, pay freezes, andlayoffs.
7/30/2019 Industrial Define Problem (Idp)
http://slidepdf.com/reader/full/industrial-define-problem-idp 73/76
Develop 360 degree feedback is to assist each individual to understand his orher strengths and weaknesses, and to contribute insights into aspects of his or
her work needing professional development. Participating in the design process, employees begin to act in ways that go
beyond their narrow job descriptions in order to contribute to organizationaleffectiveness. They begin to apply a wider range of ability, knowledge andexpertise to organizational problems. Hence, employees gain experience indevoting more effort, knowledge and time to the organization. Over time, theself-design process normalizes these behaviors, generating a climate of high
employee engagement.
Managers must:
Support the development and training of their subordinates.
Determine the job-related knowledge, skills, abilities and experiencesemployees need to effectively accomplish the work of the organization.
Counsel, coach and guide employees in their professional developmentplanning.
Help the employee define the short- and long-term development and trainingneeds.
Organizations must:
Assure an organizational structure exists that supports the required knowledge,
7/30/2019 Industrial Define Problem (Idp)
http://slidepdf.com/reader/full/industrial-define-problem-idp 74/76
g pp q gskills, abilities and experience development of its employees.
Provide resource money and time for development to occur.
Revise the company mission statement to include all employees and departments toensure each employee feels as though they are an integral part of the company’s
future. A company provides just like most important factor in considering a job offer is
salary. For others, job security is of primary importance. Also high on the list ofconsiderations are benefits and perks. When considering perks, the desire to work ina comfortable, casual environment where employees can set their own workschedule, have an option to telecommute, and where there is a a casual dress code,are all important.
There are also a number of ways to ensure your employees enjoy a healthy senseof high morale in the workplace.
Use variety. What motivates one employee won’t necessarily motivate another.Employees have different ideas and expectations for their jobs, so offering variedmorale boosters is the best way to impact employee morale across the board.
Allow employees a sense of ownership in their jobs. Invite and encourage their
ideas and input. Let them know that you value them and their opinions. Implementtheir suggestions when feasible, and if you’re unable to do so, explain why you can’t.Treat your employees with respect and it will go a long way in helping them to do abetter job and remain loyal to your company.
Recognize their efforts. A simple thank you note or card for a job well done, abirthday card, get well card or company anniversary card are simple, inexpensiveways to acknowledge your employees and let them know how much you appreciate
them and they work they do.

7/30/2019 Industrial Define Problem (Idp)
http://slidepdf.com/reader/full/industrial-define-problem-idp 75/76
Help them improve. Most employees want to do a good job. You can
offer them training opportunities in a variety of subject areas related tospecific tasks, customer service, leadership and more. Helpingemployees feel better about them will help them feel better about thecompany. ELearning courses can easily be taken online for littleexpense, yet they will still give a tremendous boost to morale and jobsatisfaction.
Make it fun! Sure, you have a job to get done, but making workfun will build morale quicker than almost anything else you cando. Allow for interaction. Provide activities outside work. Host acompany picnic, or a barbecue at your home. Hold a “bring your
kids to work day” or a visitors day where family members arewelcome to come in and view what your employees do. Rememberthat your employees are people first and workers second. Treatthem as such and morale will naturally remain high.

7/30/2019 Industrial Define Problem (Idp)
http://slidepdf.com/reader/full/industrial-define-problem-idp 76/76