Economic Analysis of Indira Awaas Yojana (IAY) in District ...
Upload
daniel-gilbertCategory
view
222download
2
Indira Awaas YojanaPerformance Review
Group 206th June. 2014

Annual allocation and target• Annual allocation 2014-15
– No. of rural houseless and dilapidated houses - Census 2011 - 75% weightage
– Poverty estimates - 2004-05 - 25% weightage – Category wise targets distributed in proportion to their respective
populations ( as done in 2013-14)
• Earmarking of targets – – SC (35.3%), ST (24.7%) & Minorities (15%) reckoned at National level– Interchange of SC/ST targets is permitted– Diversion of targets from earmarked targets to general category is not
permissible under guideline

Change in fund flow
• Ministry to release funds to Consolidated Fund of States
• Central share must be released to DRDAs/ZPs (dedicated IAY
bank accounts) within 3 days of receipt
• State share should be released within 15 days of release of
Central share
• States liable to pay interest @12% per annum on central share
for the period of delay

Release of fundsDistrict wise targets for 2014-15
Processed for release – Assam, Haryana, Tripura, Uttar Pradesh Observations raised – Jharkhand, Jammu & Kashmir, Madhya Pradesh,
Manipur, Tamil Nadu Awaited from – Gujarat, Kerala, Mizoram, Punjab
Releases being made • Committed liabilities - Second instalments, 2013-14 of districts that submitted
complete proposals by 31st March, 2014• Special project - Second instalments of proposals sanctioned in 2012-13 are
being released (Details in State wise slides)
Total Central release – Rs.829.47 crore (as of 31.05.2014)

Progress on Operationalising Guideline Provisions• IEC Plan awaited from States • Social Audit Calendar awaited from States • Facilitation for design options for houses and toilets
– Identification, certification and use of local, cost effective eco-friendly technologies
– Use RHKN Portal• Capacity Building Plan
– State Govts to organise trainings for PRIs, Masons, beneficiaries, govt. functionaries involvved in implementation
• Translation of Guidelines into local official language• Suggestions on revival of Building Centres

Convergence• With NBA
– Mandatory but not being implemented– Every sanction of IAY house should have a mandatory sanction of toilet.
Reports to this effect are not forthcoming– Reports for 2013-14
• On AwaasSoft – 0.17 lakh• Online MPR – 2.18 lakh• NBA MIS – 0.28 lakh
• With MGNREGA– Unskilled wage component in construction of IAY houses is now permitted
(Notification dated 20.12.2013 )– Amount and modalities – yet to be worked out
• With RGGVY, DRI, RSBY, AABY and reporting to be encouraged

Other programme issuesBank accounts
– Use of a dedicated Savings bank account for receipt of IAY funds at district and block levels – Use of PL/Suspense/Treasury accounts not permitted
– CPSMS registration of bank accounts– Compile list of bank accounts at districts and blocks – prerequisite for
transfer of funds through AwaasSoft
Minorities – ‘Jains’ included as sixth community in the list of Minorities– Community wise reporting of progress enabled in AwaasSoft
Grievance Redressal – Time bound action on NLM reports and complaints (Updated list
circulated)– Mechanism and personnel to be identified for the purpose – Monitoring through AwaasSoft

Monitoring and Reporting• All proposals and sanctions should be issued from AwaasSoft. If post dated
entries to be done within 15 days of actual work
• Module for booking administrative expenses operational and manual uploaded
• Monitoring State scheme through AwaasSoft
– Guidelines of State scheme should be shared with NIC
– State to take ownership of Data for State schemes
• Details of State MIS Nodal officers to be registered on AwaasSoft
immediately
• Reporting of Convergence with NBA and MGNREGA is mandatory

2012-13 - Progress reported on AwaasSoft
State Total Target Sanction Per cent
sanctions1st Inst
released1st
Inspectn 2nd Inst released
2nd Inspectn
3rd Inst released
Completed
% achieve
d to target
ASSAM 184408 145295 78.79 120758 86266 76942 57523 48678 30519 16.55
GUJARAT 136470 107351 78.66 104047 49259 44013 19327 16855 18611 13.64
HARYANA 19854 18414 92.75 17252 12535 10917 6029 0 5947 29.95
JAMMU AND KASHMIR 19476 4273 21.94 2890 638 312 113 0 110 0.56
JHARKHAND 69503 116200 167.19 98446 32559 24885 5846 596 5526 7.95
KERALA 59620 45300 75.98 43654 35928 34967 20246 19332 20074 33.67
MADHYA PRADESH 84358 80168 95.03 62120 26526 2848 7891 0 5563 6.59
MANIPUR 7238 2465 34.06 0 0 0 0 0 0 0.00
MIZORAM 2687 1627 60.55 1287 828 660 625 0 607 22.59
PUNJAB 23696 Not reporting
TAMIL NADU 111410 111218 99.83 85772 57919 8452 65645 3388 62585 56.18
TRIPURA 16245 7542 46.43 4944 2439 2209 1670 1483 1669 10.27
UTTAR PRADESH 368322 227546 61.78 172014 81449 49319 24760 1 24198 6.57
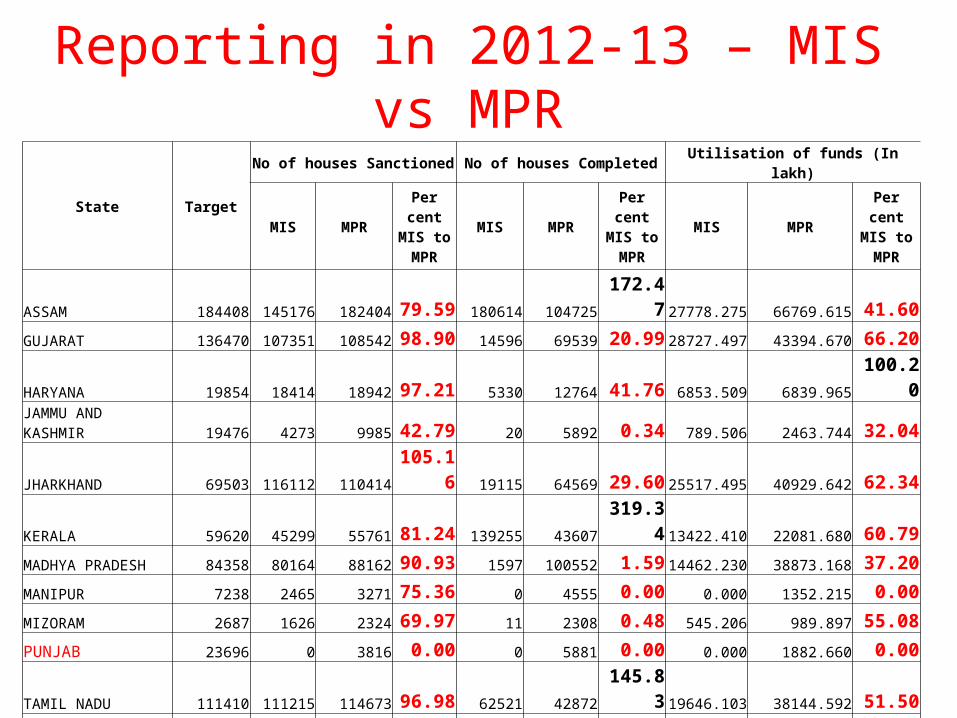
Reporting in 2012-13 – MIS vs MPR
State Target
No of houses Sanctioned No of houses Completed Utilisation of funds (In lakh)
MIS MPRPer cent MIS to MPR
MIS MPRPer cent MIS to MPR
MIS MPRPer cent MIS to MPR
ASSAM 184408 145176 182404 79.59 180614 104725 172.47 27778.275 66769.615 41.60
GUJARAT 136470 107351 108542 98.90 14596 69539 20.99 28727.497 43394.670 66.20
HARYANA 19854 18414 18942 97.21 5330 12764 41.76 6853.509 6839.965 100.20
JAMMU AND KASHMIR 19476 4273 9985 42.79 20 5892 0.34 789.506 2463.744 32.04
JHARKHAND 69503 116112 110414 105.16 19115 64569 29.60 25517.495 40929.642 62.34
KERALA 59620 45299 55761 81.24 139255 43607 319.34 13422.410 22081.680 60.79
MADHYA PRADESH 84358 80164 88162 90.93 1597 100552 1.59 14462.230 38873.168 37.20
MANIPUR 7238 2465 3271 75.36 0 4555 0.00 0.000 1352.215 0.00
MIZORAM 2687 1626 2324 69.97 11 2308 0.48 545.206 989.897 55.08
PUNJAB 23696 0 3816 0.00 0 5881 0.00 0.000 1882.660 0.00
TAMIL NADU 111410 111215 114673 96.98 62521 42872 145.83 19646.103 38144.592 51.50
TRIPURA 16245 7541 1628 463.21 4564 0 0.00 904.731 0.000 0.00
UTTAR PRADESH 368322 227475 251357 90.50 28377 163301 17.38 60253.863 101103.436 59.60
Total 1103287 867111 951279 91.15 456000 620565 73.48 198900.825 364825.283 54.52

2013-14 - Progress reported on AwaasSoft
State Total Target Sanction Per cent
sanctions1st Inst
released1st
Inspectn 2nd Inst released
2nd Inspectn
3rd Inst released
Completed
% achieve
d to target
ASSAM 138695 80380 57.95 58971 20616 15224 2991 1484 1381 1.00
GUJARAT 107880 94103 87.23 75435 18951 16291 1875 1489 1774 1.64
HARYANA 18029 19063 105.74 18472 14829 13579 4472 2680 4244 23.54
JAMMU AND KASHMIR 15952 4505 28.24 3169 237 26 11 2 11 0.07
JHARKHAND 67153 45250 67.38 31604 3689 2406 149 50 143 0.21
KERALA 45738 42063 91.97 39426 25243 24474 7149 6431 7108 15.54
MADHYA PRADESH 112936 88251 78.14 71813 11106 4137 847 0 760 0.67
MANIPUR 9689 2281 23.54 1214 1122 1055 0 0 0 0.00
MIZORAM 3661 2859 78.09 2375 2082 2004 1416 0 1404 38.35
PUNJAB 19531 Not reporting
TAMIL NADU 88436 88375 99.93 77722 65964 37572 46638 12484 19048 21.54
TRIPURA 13368 12246 91.61 7118 175 7 0 0 0 0.00
UTTAR PRADESH 297223 282770 95.14 275362 108763 83548 9765 0 9538 3.21

Reporting in 2013-14 – MIS vs MPR
State Target
No of houses Sanctioned No of houses Completed Utilisation of funds (In lakh)
MIS MPRPer cent MIS to MPR
MIS MPR Per cent MIS to MPR MIS MPR
Per cent MIS to MPR
ASSAM 138695 78687 94021 83.69 6488 62390 10.40 31327.015 50580.411 61.94
GUJARAT 107880 93658 100531 93.16 3609 37125 9.72 22206.401 37809.466 58.73
HARYANA 18029 19090 15052 126.83 10528 4532 232.30 9763.035 7794.250 125.26
JAMMU AND KASHMIR 15952 4505 306 1472.22 19 429 4.43 796.375 123.304 645.86
JHARKHAND 67153 44996 50129 89.76 279 45347 0.62 12019.522 24990.218 48.10
KERALA 45738 42065 44031 95.53 52023 55996 92.90 23020.584 27283.871 84.37
MADHYA PRADESH 112936 87713 95459 91.89 1322 46896 2.82 26574.593 43338.504 61.32
MANIPUR 9689 2281 2800 81.46 0 369 0.00 374.212 1211.778 30.88
MIZORAM 3661 2212 1545 143.17 3157 521 605.95 1336.500 608.272 219.72
PUNJAB 19531 0 3088 0.00 0 2120 0.00 0.000 356.588 0.00
TAMIL NADU 88436 88371 88362 100.01 73405 69955 104.93 32318.043 43611.736 74.10
TRIPURA 13368 12244 3209 381.55 0 0 0.00 1372.312 0.000 0.00
UTTAR PRADESH 297223 282756 203760 138.77 33467 147742 22.65 127007.672 117357.246 108.22
Total 938291 758578 702293 108.01 184297 473422 38.93 288116.264 355065.644 81.14

Role of State MIS Nodal Officers Role to be strengthened
Entries to be made immediately Number and proportion of instalments and details in State login
District targets and funds released
Bank accounts of districts and blocks with full details
Privileges to be assigned to state MIS nodal officer Editing bank account details
Editing financial transactions from lower levels
Synchronisation of data from NREGASoft All mails related to technical issues to be routed through MIS nodal
officer to [email protected]

Checks in AwaasSoft• Parameters that cannot be changed and should be strictly uniform in all districts
during a financial year • No. of installments• Amount to be given in the installment• Inspection levels• Top up IAY amount over and above State share
• Sanction of houses should be done latest by 15th July, 2014• Minimum of two inspections and uploading of photographs is mandatory • Wherever materials are supplied – required customisation to be made to capture
such transactions• Deletion / alteration of sanction and beneficiary data will not be allowed once
funds are released• Edit options for financial transactions will not be available• Opening Balance can be edited only twice in a financial year and only before
audit reports are submitted • Change in beneficiaries between schemes will not be possible once sanctions
are issued

Special Projects• Proposals to cover Manual Scavengers may be prepared on priority and
submitted by 31st July, 2014 for EC’s approval
• States to submit proposals for deserving categories after careful examination
– Ascertain availability of eligible beneficiaries
– Inter district transfer of targets will not be accommodated
• Special Projects to be audited separately for settlement of accounts and
completion of houses to be ensured
• 2nd instalment proposals for special projects sanctioned in 2012-13 due from
last year may be consolidated at State level & submitted on priority
• Consolidated proposals for 2nd instalment for projects sanctioned in 2013-14
may be submitted once 60% utilisation is achieved

Pendency of Complaints/NLM (Updated list circulated)
StateComplaints NLM
2012-13 2013-14 2011-12 2012-13
Assam 4 3 1 0Gujarat 2 0 0 1Haryana 0 2 Jharkhand 3 1 0 1Jammu & Kashmir 2 0 Kerala 0 0 Madhya Pradesh 2 1 2 0Punjab 0 1Uttar Pradesh 1 17 Tripura 1 0

Targets for 2014-15 received and processed for release
Committed liabilities released to 4 dists
Assam
Rs. In lakh
Hailakandi Rs. 4053.500
Nagaon 4353.102
Kamrup rural 106.906
Karbi anglong 2094.716

Year Target No of houses sanctioned No of houses completed
SC ST MIN OTH TOT SC ST MIN OTH TOT2012-13 184408 22696 37482 30461 54537 145176 3388 8699 6709 11723 30519
Completions from houses sanctioned in previous years 29737 31416 24638 64304 150095
Completions reported in 2012-13 33125 40115 31347 76027 180614
2013-14
138695 11651 19934 19275 27827 78687 98 271 621 391 1381
Completions from houses sanctioned in 2012-13 479 678 2305 1645 5107
Completions reported in 2013-14 577 949 2926 2036 6488
Year Total Available
Fund
Utilisation Rs. In lakh
SC ST MIN OTH TOT %
2013-14 117270.385 4399.654 7829.275 7029.462 12068.624 31327.015 26.71
State share due : 30630.614 State share released : 4450.365 Shortfall : 26180.249
Physical progress
Financial progress
Assam - Progress in MIS

Gujarat
Year Target No of houses sanctioned No of houses completed
SC ST MIN OTH TOT SC ST MIN OTH TOT2012-13 136470 5491 57855 13589 31316 107351 999 8838 3025 5749 18611
2013-14 107880 7087 34812 2239 49520 93658 196 514 81 983 1774
Completions from houses sanctioned in 2012-13 210 731 132 762 1835
Completions reported in 2013-14 406 1245 213 1745 3609
Year Total Available
Fund
Utilisation (Rs in Lakh)
SC ST MIN OTH TOT %2013-14 62572.282 1746.350 8131.532 785.854 11542.665 22206.401 35.49State share due : 9586.111 State share released : 10016.151 Shortfall : 0
Physical progress
Financial progress
District wise targets 2014-15 is awaited

Haryana
Year Target No of houses sanctioned No of houses completed
SC ST MIN OTH TOT SC ST MIN OTH TOT2012-13 19854 9555 3 2946 5910 18414 3283 1 1015 1648 5947
2013-14 18029 14629 17 1980 2464 19090 3363 1 401 479 4244
Completions from houses sanctioned in 2012-13 3265 6 1281 1732 6284
Completions reported in 2013-14 6628 7 1682 2211 10528
Year Total Available
Fund
Utilisation (rs in Lakh)
SC ST MIN OTH TOT %
2013-14 13433.541 7535.030 3.900 990.805 1233.300 9763.035 72.68State share due : 3303.123 State share released : 3028.854 Shortfall : 274.269
Physical progress
Financial progress
District wise targets for 2014-15 received and processed for release

Targets for 2014-15 received Targets from earmarked categories cannot be transferred to general category Allocation to IAP districts has to be made with unit cost of Rs. 75,000 – overall
financial allocation cannot be enhanced
Committed liabilities released to 1dists• Bokaro – Rs. 845.032 lakh• Garwah, Pakur & Sahebkanj – submitted to IFD
Special project sanctioned in 2012-13 – Homestead Incentive Reporting for this project on AwaasSoft needs to be ensured
Jharkhand

Year Target No of houses sanctioned No of houses completed
SC ST MIN OTH TOT SC ST MIN OTH TOT2012-13 69503 23870 47051 13710 31481 116112 1505 1194 756 2071 5526
Completions from houses sanctioned in previous years 3052 2507 1941 6089 13589
Completions reported in 2012-13 4557 3701 2697 8160 19115
2013-14 67153 8521 27124 3075 6276 44996 59 51 13 20 143
Completions from houses sanctioned in 2012-13 45 53 15 23 136
Completions reported in 2013-14 104 104 28 43 279
Year Total Available
Fund
Utilisation (Rs in Lakh)
SC ST MIN OTH TOT %
2013-14 73219.737 2586.204 5795.733 1146.610 2490.975 12019.522 60.42
State share due : 11433.514 State share released : 5846.570 Shortfall : 5586.944
Physical progress
Financial progress
Jharkhand - Progress in MIS

Targets for 2014-15 received Targets for ST cannot be transferred to general category
Committed liabilities released to 6 dists
Jammu & Kashmir
Rs. In lakh
Jammu 332.652
Kupwara 325.553
Kishtwar 169.104
Kulgam 83.070
Ramban 94.697
Reasi 175.500

Year Target No of houses sanctioned No of houses completed
SC ST MIN OTH TOT SC ST MIN OTH TOT2012-13 19476 895 494 95 1899 4273 47 11 6 46 110
2013-14 15952 1833 1188 482 1002 4505 3 1 4 3 11
Completions from houses sanctioned in 2012-13 3 3 2 0 8
Completions reported in 2013-14 6 4 6 3 19
Year Total Available
Fund
Utilisation Rs. In lakh
SC ST MIN OTH TOT %
2013-14 6704.703 360.940 225.970 53.985 155.480 796.375 11.88
State share due : 1965.409 State share released : 302.105 Shortfall : 1663.305
Physical progress
Financial progress
Jammu & Kashmir - Progress in MIS

Year Target No of houses sanctioned No of houses completed
SC ST MIN OTH TOT SC ST MIN OTH TOT2012-13 59620 19671 3057 9946 12625 45299 7683 677 5295 6419 20074
Completions from houses sanctioned in previous years 35412 5735 38055 39979 119181
Completions reported in 2012-13 43095 6412 43350 46398 139255
2013-14 45738 18243 3484 9283 11055 42065 2031 103 2255 2719 7108
Completions from houses sanctioned in 2012-13 12906 874 15214 15921 44915
Completions reported in 2013-14 14937 977 17469 18640 52023
Year Total Available
Fund
Utilisation (Rs in Lakh)
SC ST MIN OTH TOT %
2013-14 40713.011 9256.099 1394.589 5608.63 6761.253 23020.584 56.54
State share due : 7542.007 State share released : 7247.287 Shortfall : 294.72
Physical progress
Financial progress
• District wise targets for 2014-15 is awaited• Committed liabilities released to Kozhikode – Rs. 948.948 lakh
Kerala

Targets for 2014-15 received Retaining funds and targets at the State level is not permissible Allocation to IAP districts has to be made with unit cost of Rs. 75,000 –
overall financial allocation cannot be enhanced
Committed liabilities released to 16 districts
Madhya Pradesh
Rs. In lakh
Ratlam 739.830 Bhopal 171.990
Bhind 431.068 Khandwa 677.314
Sheopur 301.304 Raisen 489.018
Mandasaur 74.051 Rewa 793.064
Chindwara 1245.464 Sagar 718.808
Hosangabad 435.436 Tikamgarh 419.874
Alirajpur 846.557 Umaria 528.256
Balaghat 732.372 Gwalior 272.728
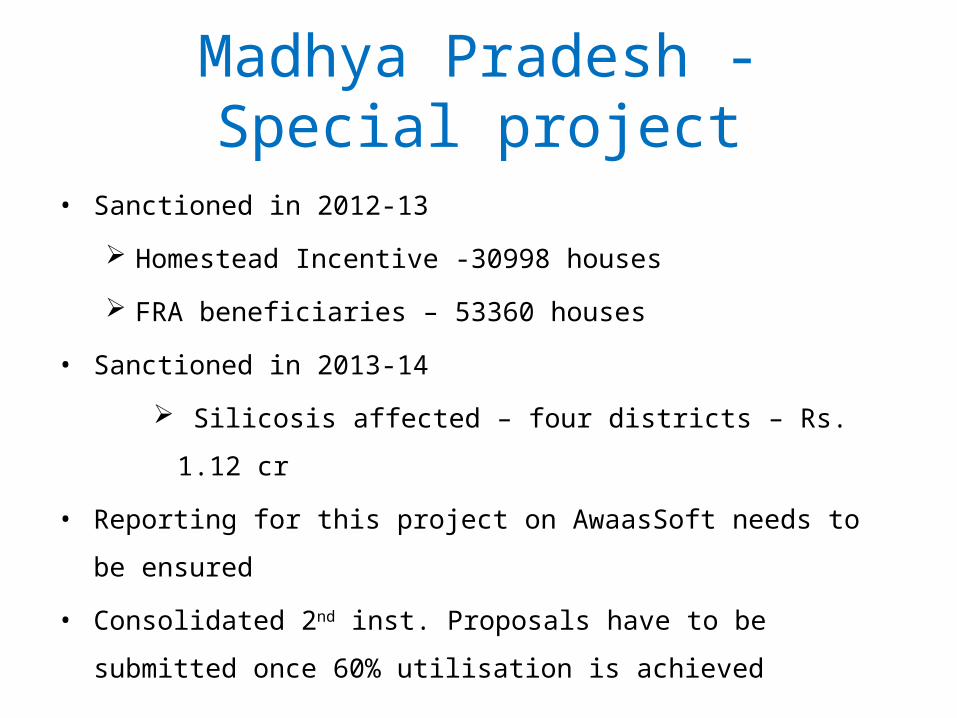
Madhya Pradesh - Special project
• Sanctioned in 2012-13
Homestead Incentive -30998 houses
FRA beneficiaries – 53360 houses
• Sanctioned in 2013-14
Silicosis affected – four districts – Rs. 1.12 cr
• Reporting for this project on AwaasSoft needs to be ensured
• Consolidated 2nd inst. Proposals have to be submitted once 60% utilisation
is achieved

Year Target No of houses sanctioned No of houses completed
SC ST MIN OTH TOT SC ST MIN OTH TOT2012-13 84358 19419 29517 8389 22839 80164 1107 2396 635 1425 5563
2013-14 112936 21394 46885 4717 14717 87713 202 375 37 146 760
Completions from houses sanctioned in 2012-13 190 197 40 135 562
Completions reported in 2013-14 392 572 77 281 1322
Year Total Available
Fund
Utilisation (Rs in Lakh)
SC ST MIN OTH TOT %
2013-14 80508.800 6175.903 14244.623 1569.515 4584.552 26574.593 33.01
State share due : 16084.585 State share released : 14198.780 Shortfall : 1885.805
Physical progress
Financial progress
Madhya Pradesh - Progress in MIS

Year Target No of houses sanctioned No of houses completed
SC ST MIN OTH TOT SC ST MIN OTH TOT2012-13 2687 0 1184 442 0 1626 0 503 104 0 607
2013-14 3661 0 1957 255 0 2212 0 1176 228 0 1404
Completions from houses sanctioned in 2012-13 0 1345 408 0 1753
Completions reported in 2013-14 0 2521 636 0 3157
Year Total Available
Fund
Utilisation Rs. In lakh
SC ST MIN OTH TOT %
2013-14 3191.774 0 1147.500 189.00 0 1336.500 41.87
State share due : 970.046 State share released : 274.573 Shortfall : 695.473
Physical progress
Financial progress
MizoramDistrict wise targets for 2014-15 is awaited

Allocation for 2014-15 has been done objectively using a prescribed formula and data from Census 2011
Earmarking for categories has been reckoned at the National level
Committed liabilities released to Ukhrul – Rs.256.408 lakh
Special project sanctioned in 2013-14
Insurgency affected – Churachandpur – Rs. 8.38 cr
Reporting for this project on AwaasSoft needs to be ensured
2nd inst. Proposals have to be submitted once 60% utilisation is
achieved
Manipur
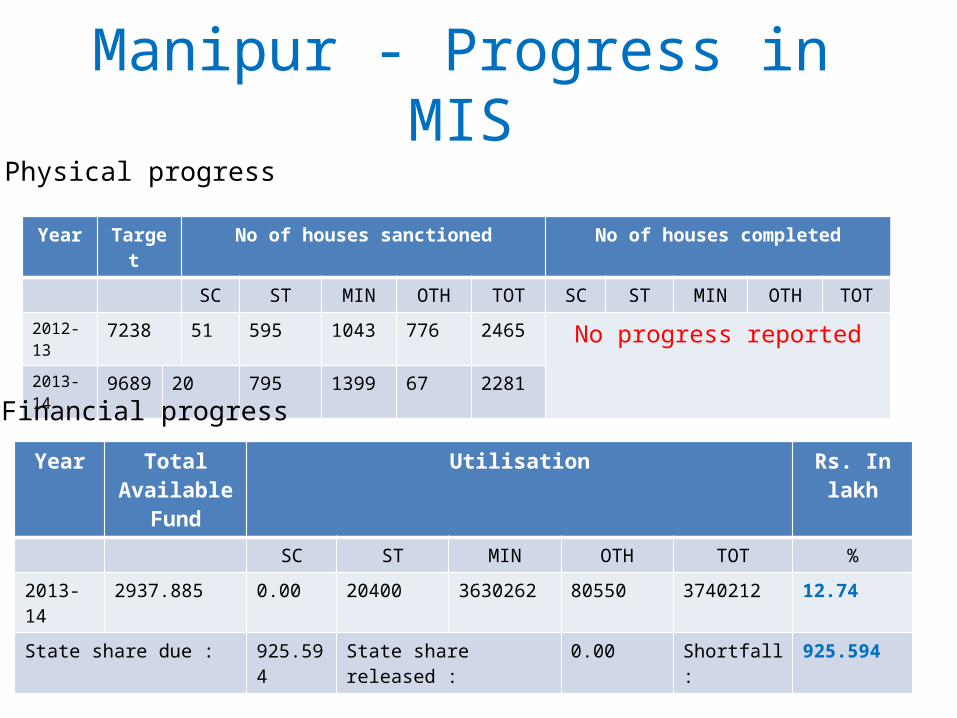
Year Target No of houses sanctioned No of houses completed
SC ST MIN OTH TOT SC ST MIN OTH TOT2012-13 7238 51 595 1043 776 2465 No progress reported2013-14 9689 20 795 1399 67 2281
Year Total Available
Fund
Utilisation Rs. In lakh
SC ST MIN OTH TOT %2013-14 2937.885 0.00 20400 3630262 80550 3740212 12.74State share due : 925.594 State share released : 0.00 Shortfall : 925.594
Physical progress
Financial progress
Manipur - Progress in MIS

District wise targets for 2014-15 is awaited
Issues in reporting
No reporting on MIS
MPR – online and hard copies are not being received
Progress of Special projects has not been reported
Punjab

District wise targets received and processed for release
Special project sanctioned in 2013-14 to all districts
Surrendered militants - Rs. 6.92 cr
FRA beneficiaries – Rs. 8.38 cr
Reporting for this project on AwaasSoft needs to be ensured
Consolidated 2nd inst. roposals have to be submitted once 60%
utilisation is achieved
Tripura

Year Target No of houses sanctioned No of houses completed
SC ST MIN OTH TOT SC ST MIN OTH TOT2012-13 16245 927 5286 258 1070 7541 131 1233 65 240 1669
Completions from houses sanctioned in previous years 468 1087 77 1263 2895
Completions reported in 2012-13 599 2320 142 1503 4564
2013-14 13368 2444 7186 772 1842 12244 0 0 0 0 0
Year Total Available
Fund
Utilisation (Rs in Lakh)
SC ST MIN OTH TOT %
2013-14 7443.256 235.650 838.238 99.862 198.562 1372.312 18.44
State share due : 2219.228 State share released : 378.1121 Shortfall : 1841.116
Physical progress
Financial progress
Tripura - Progress in MIS
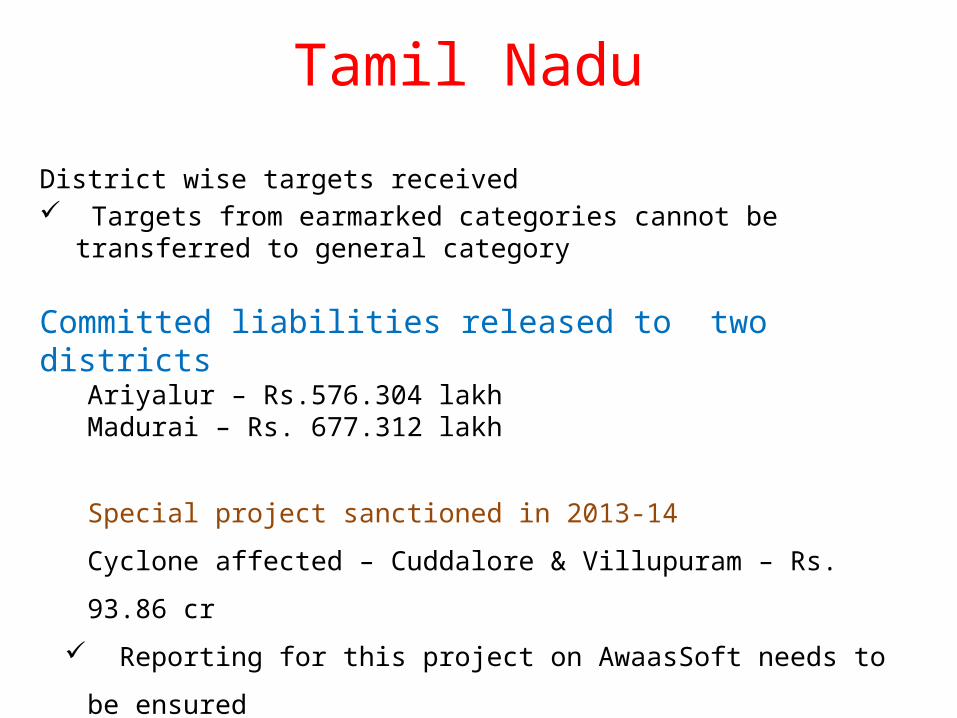
District wise targets received Targets from earmarked categories cannot be transferred to general category
Committed liabilities released to two districtsAriyalur – Rs.576.304 lakhMadurai – Rs. 677.312 lakh
Special project sanctioned in 2013-14
Cyclone affected – Cuddalore & Villupuram – Rs. 93.86 cr
Reporting for this project on AwaasSoft needs to be ensured
Consolidated 2nd inst. Proposals have to be submitted once 60%
utilisation is achieved
Tamil Nadu

Year Target No of houses sanctioned No of houses completed
SC ST MIN OTH TOT SC ST MIN OTH TOT2012-13 111410 54526 2775 10624 43290 111215 30155 1727 5725 24978 62585
2013-14 88436 50806 3070 2989 31506 88371 10880 248 516 7404 19048
Completions from houses sanctioned in 2012-13 28106 804 3267 22180 54357
Completions reported in 2013-14 38986 1052 3783 29584 73405
Year Total Available
Fund
Utilisation Rs. In lakh
SC ST MIN OTH TOT %
2013-14 71070.895 18513.280 1104.348 1220.978 11479.437 32318.043 45.47
State share due : 16880.892 State share released : 12522.320 Shortfall : 4358.572
Physical progress
Financial progress
Tamil Nadu - Progress in MIS
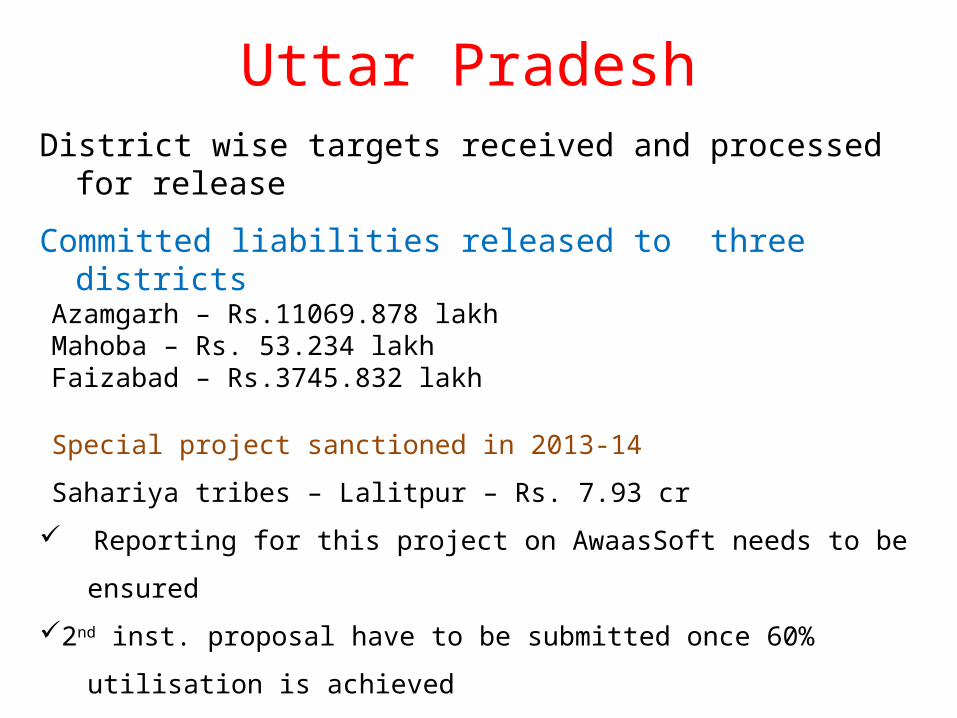
District wise targets received and processed for release
Committed liabilities released to three districtsAzamgarh – Rs.11069.878 lakhMahoba – Rs. 53.234 lakhFaizabad – Rs.3745.832 lakh
Special project sanctioned in 2013-14
Sahariya tribes – Lalitpur – Rs. 7.93 cr
Reporting for this project on AwaasSoft needs to be ensured
2nd inst. proposal have to be submitted once 60% utilisation is achieved
Uttar Pradesh

Year Target No of houses sanctioned No of houses completed
SC ST MIN OTH TOT SC ST MIN OTH TOT2012-13 368322 114952 2797 21574 88152 227475 10684 311 2463 10740 24198
2013-14 297223 192265 6857 47787 35847 282756 5380 14 2772 1372 9528
Completions from houses sanctioned in 2012-13 9308 99 9383 5139 23929
Completions reported in 2013-14 14688 113 12155 6511 33467
Year Total Available
Fund
Utilisation
SC ST MIN OTH TOT %
2013-14 206057.505 82648.896 3337.552 23306.317 17714.907 127007.672 61.64
State share due : 51331.187 State share released : 30478.490 Shortfall : 20852.697
Physical progress
Financial progress
Uttar Pradesh - Progress in MIS

Thank you