Independent Market Research on the Paint and Coating ... › image › 201812 ›...
80
Independent Market Research on the Paint and Coating Industry in Selected Southeast Asian Countries Final Report May 2017
Transcript of Independent Market Research on the Paint and Coating ... › image › 201812 ›...

Independent Market Research on the Paint and
Coating Industry in Selected Southeast Asian
Countries Final Report
May 2017

2
© May 2017 Frost & Sullivan
The market research process for this study has been undertaken through secondary/desktop research as well as
primary research, which involves discussing the status of the industry with leading participants and experts. The
research methodology used is the Expert Opinion Consensus Methodology.
Quantitative market information is subject to fluctuations due to possible changes in the business and industry
climate. Frost & Sullivan‟s estimates and assumptions are based on varying levels of quantitative and
qualitative analyses, including industry journals, company reports and information in the public domain.
Forecasts, estimates, predictions, and other forward-looking statements contained in this report are inherently
uncertain because of changes in factors underlying their assumptions, or events or combinations of events that
cannot be reasonably foreseen. Actual results and future events could differ materially from such forecasts,
estimates, predictions, or such statements.
This study has been prepared for inclusion in the English language offering circular and Thai language
prospectus (collectively, the „‟Offering Documents”) of TOA Paint (Thailand) Public Company Limited (“the
Company”) in relation to an initial public offering in connection with its listing on the stock exchange of
Thaiiland (“the Listing”).
Save for the inclusion of this study in the Offering Documents issued by the Company and in such presentation
materials prepared by or on behalf of the Company (reviewed by Frost & Sullivan) in relation to the Listing, no
part of it, except in connection with any due diligence or similar defense which the company or the underwriters
partcipating in the listing may wish to advance, may be otherwise given, lent, resold, or disclosed to non-
customers without our written permission.
Frost & Sullivan has prepared this study in an independent and objective manner, and it has taken adequate care
to ensure its accuracy and completeness. We believe that this study presents a true and fair view of the paint and
coating industry in select countries in Southeast Asia within the limitations of, among others, secondary
statistics and primary research, and it does not purport to be exhaustive. Our research has been conducted with
an “overall industry” perspective, and it may not necessarily reflect the performance of individual companies in
the industry. Frost & Sullivan shall not be liable for any loss suffered because of reliance on the information
contained in this study, except as provided in our separate engagement letter with the company dated 2nd
February, 2017. This study should also not be considered as a recommendation to buy or not to buy the shares
of any company or companies as mentioned in it or otherwise.
Authorized Signatory
Sanjay Singh
Vice President
Frost & Sullivan (S) Pte Ltd
100 Beach Road #29-01/11 Shaw Tower
Singapore 189702

3
Table of Contents
1. EXECUTIVE SUMMARY .......................................................................................................................... 4
1.1.1. BRIEF MACROECONOMIC OVERVIEW OF SOUTHEAST ASIA (SEA) ........................................................................... 4
1.1.2. INDUSTRY SEGMENTATION AND DEFINITIONS ..................................................................................................... 5
1.1.3. VALUE CHAIN AND DISTRIBUTION CHAIN ANALYSIS ............................................................................................. 6
1.1.4. MARKET SIZING AND FORECASTS ..................................................................................................................... 8
1.1.5. COMPETITIVE LANDSCAPE ............................................................................................................................. 12
1.1.6. INDUSTRY OUTLOOK .................................................................................................................................... 17
2. THE PAINT AND COATING INDUSTRY IN THAILAND .................................................................... 19
2.1.1. BRIEF ECONOMIC OVERVIEW OF THAILAND...................................................................................................... 19
2.1.2. MACRO-ECONOMIC OVERVIEW OF THAILAND .................................................................................................. 20
2.1.3. SOCIO-ECONOMIC OVERVIEW OF THAILAND .................................................................................................... 24
2.1.4. OVERVIEW OF THE PAINT AND COATING INDUSTRY IN THAILAND .......................................................................... 29
2.1.5. VALUE CHAIN AND DISTRIBUTION CHAIN ANALYSIS ........................................................................................... 32
2.1.6. DRIVERS OF THE PAINT AND COATING INDUSTRY ............................................................................................... 34
2.1.7. BARRIERS TO ENTRY .................................................................................................................................... 41
2.1.8. KEY REGULATIONS GOVERNING THE INDUSTRY ................................................................................................. 42
2.1.9. MARKET SIZING AND FORECASTS ................................................................................................................... 44
2.1.10. COMPETITIVE LANDSCAPE ANALYSIS ............................................................................................................... 47
2.1.11. MARKET SHARE ESTIMATES AND PROFILES OF RETAIL DECORATIVE AND RETAIL NON-DECORATIVE PAINT AND COATING
COMPANIES IN THAILAND ............................................................................................................................................... 48
2.1.12. INDUSTRY PROSPECTS & OUTLOOK ................................................................................................................ 52
3. THE PAINT AND COATING INDUSTRY IN VIETNAM ...................................................................... 53
3.1.1. OVERVIEW OF THE PAINT AND COATING INDUSTRY IN VIETNAM ........................................................................... 53
3.1.2. VALUE CHAIN AND DISTRIBUTION CHAIN ANALYSIS ........................................................................................... 56
3.1.3. MARKET SIZING AND FORECASTS ................................................................................................................... 57
3.1.4. COMPETITIVE LANDSCAPE ANALYSIS ............................................................................................................... 59
3.1.5. MARKET SHARE ESTIMATES AND PROFILES OF RETAIL DECORATIVE AND NON-DECORATIVE PAINT AND COATING
COMPANIES IN VIETNAM ................................................................................................................................................ 59
3.1.6. INDUSTRY PROSPECTS & OUTLOOK ................................................................................................................ 63
4. BRIEF OVERVIEW OF THE PAINT AND COATING INDUSTRY IN CAMBODIA, LAOS,
MYANMAR, MALAYSIA, AND INDONESIA ................................................................................................ 64
4.1.1. OVERVIEW OF THE PAINT AND COATING INDUSTRY ............................................................................................ 64
4.1.1.1. VALUE CHAIN AND DISTRIBUTION CHAIN ANALYSIS ........................................................................................... 68
4.1.2. MARKET SIZING AND FORECASTS ................................................................................................................... 69
4.1.3. COMPETITIVE LANDSCAPE ............................................................................................................................. 73
4.1.4. INDUSTRY PROSPECTS & OUTLOOK ................................................................................................................ 76
5. BRIEF OVERVIEW OF THE SOUTHEAST ASIA NON-DECORATIVE PAINT AND COATING
INDUSTRY ........................................................................................................................................................ 77
6. OVERVIEW OF PROSPECTS FOR THE COMPANY IN THE INDUSTRY........................................ 79

4
1. EXECUTIVE SUMMARY
1.1.1. Brief Macroeconomic Overview of Southeast Asia 1(SEA)
The selected Southeast Asian countries, combined, accounted for approximately 76.0% of ASEAN‟s total GDP in
2016E. Most of the selected Southeast Asian economies had been on a growth track during the last two decades
(1990-2010) on the backdrop of factors such as economic liberalization, urbanization, increasing domestic
consumption and government spending, among many others. During the same period, both Thailand and Vietnam
catapulted themselves from low-income countries to upper-middle income and middle-income countries,
respectively, while at the same time transforming into industrial and services-based economies from economies that
were once largely dependent on agriculture. The industrial and services sectors combined contributed to more than
60.0% of Thailand‟s GDP between 2011 and 2016. During this period, the country was affected by various factors
such as floods, political unrests and decline in global commodity prices, among many others. But the economy
remained resilient owing to increased government spending, rising private consumption and a steady source of
revenue from tourism. Thailand‟s economic growth in the forecast period will largely depend on steady growth in
private consumption, implementation of the government‟s long term strategic plan, stable inflation rates and the
possibility of return to democratic rule.
Vietnam‟s growth, on the other hand, was driven by a holistic socioeconomic development. This resulted in
improved living standards including availability of electricity, clean water and sanitation, and access to basic
education and healthcare. Trade and investments with regional and global economies also fueled growth. Many
social and economic indicators in Vietnam such as maternal mortality rates, access to basic education and
infrastructure, availability of electricity, access to clean water, and sanitation have shown substantial improvements
in the past three decades from 1986 to 2016. Over this period, Vietnam has achieved many of its Millennium
Development Goals ahead of time. Economic integration with regional and global participants has also boosted trade
and investment in the country. With the current Socio-Economic-Development Strategy 2011-2020 being
implemented through development of infrastructure, establishment and improvisation of market institutions and
nurturing of proper human resource required for modern industries, the economy of Vietnam can be expected to
reach new heights during the forecast period of 2016 to 2021.
Economic growth in the other Southeast Asian countries is expected to be driven by urbanization (Indonesia,
Malaysia, Laos), government spending on infrastructure (Myanmar, Indonesia, Malaysia), foreign trade and
investments (Myanmar, Cambodia), to name a few. The Indonesian president is currently pursuing an ambitious
five-year billion-dollar plan to upgrade roads, ports, water and power plants. Indonesia is the second largest car
manufacturer in Asia after Thailand with the production of passenger vehicles forecast to reach approximately 2.6
million by 2020, and this is expected to provide an impetus to the economic growth in the country. Similarly, the
Malaysian government also plans to develop the country‟s infrastructure under the 11th Malaysia Plan 2016–2020
which in turn is likely to improve the overall economic activity. Myanmar is also set to grow economically
following the 12-point policy declaration by the government, targeted at broad social and economic reforms in the
country. While Cambodia‟s signing up of the Sustainable Development Investment Partnership (SDIP)2 is expected
to unlock the funding of infrastructure projects through PPPs, Laos‟ economic growth is likely to be determined by
increased disposable incomes in the country.
1 For the purpose of this report, Southeast Asia refers to the following countries – Thailand, Vietnam, Malaysia, Cambodia, Indonesia, Laos and
Myanmar. 2 http://www.phnompenhpost.com/business/cambodia-joins-global-infrastructure-fund-davos

5
1.1.2. Industry Segmentation and Definitions
The study focuses on the retail market for decorative paints and coatings in Thailand, Vietnam, Malaysia, Indonesia,
Myanmar, Cambodia and Laos; and on the retail market for non-decorative paints and coatings in Thailand and
Vietnam.
Industry Segmentation, Paint and Coating industry, Select Southeast Asian countries, 2016
Source: Frost & Sullivan Note: Paints and coatings classified under ‘Others’: Not included as a part of this study.
The definitions of each category and further sub-categories are described below.
Retail Paints and Coatings: This refers to paints and coatings sold through retail dealers which include traditional
retail dealers and modern trade distributors.
Decorative Paints and Coatings: Otherwise known as architectural coatings, this segment includes all those
coatings applied on new and existing buildings, be it residential or commercial or industrial or any other type of
building, for decorative purposes.
Non-Decorative Paints and Coatings: For the purpose of this study, non-decorative paints and coatings comprise
three segments - non-decorative wood coatings, non-decorative waterproofing and non-decorative protective
coatings. The categories and their uses are described below.
Non-Decorative Wood Coatings: Used for on-site paint jobs of woodwork in small to medium scale projects
(mainly housing). Some examples of application areas are doors, window frames, trims, wooden floors, cabinets,
etc. This category doesn‟t include off-site furniture paints and coatings.
Non-Decorative Waterproofing: Waterproofing chemicals/membranes that are used for preventing water seepage.
These are typically of 4 types –
Cementitious - cement based
Liquid applied acrylic, Polyurethane - resin based
Liquid applied bituminous - bitumen based
Sheet membrane
Retail Paints and
Coatings
Decorative Non-Decorative
Waterproofing Protective Coatings
(Metal and Concrete) Wood Coatings
Others
(Automotive Coatings, Construction
Chemicals and other
paints and coatings)

6
Non-Decorative Protective Coatings (Metal and Concrete): Also known as heavy duty or high-performance
coatings, these coatings are applied on steel structures (construction and small to medium scale industries), steel
bridges, piping, and other structures where anti-corrosive coatings or other coatings with high resistance to wear-
and-tear are required. Protective coatings have a much thicker film than decorative coatings, typically 3-4mm.
Examples: heat resistant coatings for pipes and flares, heavy-duty floor paint for factories, warehouses, or airport
hangars, and high-performance coatings for oil rigs and related equipment. These types of coatings are also used for
protecting window frames from exposure to oxidization and concrete structures from bacterial, fungal and other
kinds of organic infestations.
1.1.3. Value Chain and Distribution Chain Analysis
Paint and coating manufacturers in the selected Southeast Asian countries generally rely on large international
chemical manufacturers such as Dow and BASF for the majority of their raw material requirements. Paint and
coating manufacturers in countries like Thailand, Indonesia and Malaysia, which have presence of domestic
companies that produce petrochemical biproducts required for paint and coating manufacturing, also source some of
their raw materials locally. However, countries such as Vietnam, Cambodia, Laos and Myanmar largely rely on
imports from the neighbouring countries.
The sales channels in different countries depend on the available infrastructure and maturity of the local market. In
countries such as Thailand, Indonesia and Malaysia paint and coating manufacturers sell directly to modern trade
distributors as well as to traditional retail dealers, whereas in countries such as Vietnam, Indonesia, Cambodia,
Myanmar and Laos, the paint and coating manufacturers sell directly to traditional retail dealers or wholesale
distributors who in turn sell to the retail dealers. Most of these sales constitute decorative paints and coatings. Apart
from selling to retail dealers, wholesale distributors and modern trade distributors, paint and coating manufacturers
also sell their products directly to project owners and contractors.
Housing project owners and infrastructure contractors in Thailand, Malaysia and Indonesia procure decorative paints
and coatings directly from the manufacturers, while inVietnam, Myanmar, Cambodia and Laos wholesale
distributors act as third parties between paint and coating manufacturers and project owners.
Non-decorative paints and coatings are sold mostly through non-retail channels in all of the Southeast Asian
countries. Majority of non-retail customers include project owners, contractors, OEMs and large scale industries.
The retail customers for non-decorative paints and coatings in these countries include real-estate developers, small
and medium scale enterprises, small-time painters, architects and individuals.
Presence of large networks of retail dealers in Thailand, Malaysia and Indonesia ensure relatively higher sales of
non-decorative paints and coatings through retail channels whereas lack of established sales networks in the other
countries results in bulk purchases being done directly through manufacturers and third parties. Lack of DIY
activities, which is a result of availability of cheap labour, is also one of the major factors restraining retail sales of
non-decorative paints and coatings.

7
Value Chain, Paint and Coating industry, Select Southeast Asian countries, 2016
Source: Frost & Sullivan
Note: * Wholesale distributors/Third parties are applicable for Vietnam, Indonesia, Cambodia, Myanmar and Laos.
**Sales of Non-Decorative Protective Coatings through Retailers are comparatively less in Vietnam as compared to the other countries in the study.
**

8
1.1.4. Market Sizing and Forecasts
The retail market for decorative paints and coatings in the key countries in Southeast Asia experienced a steady
growth historically. The retail decorative paint and coating market in Thailand registered a CAGR of 6.9% between
2011 and 2016, growing from THB13.7 billion in 2011 to THB19.2 billion in 2016, while the market in Vietnam
recorded a CAGR of 9.0% between 2011 and 2016, growing from VND4,224.8 billion in 2011 to VND6,500.0
billion in 2016. Similarly, the markets in the other countries of Southeast Asia such as Malaysia, Indonesia,
Myanmar, Cambodia and Laos registered a combined CAGR of 6.4% between 2011 and 2016, growing from
USD898.1 million in 2011 to USD1,224.0 million in 2016.
Growth in these markets were driven by urbanization, increase in disposable incomes, new house constructions and
repainting activities. Increased consumer preferences towards high priced paints and coatings in countries such as
Thailand and Vietnam were also responsible for the historical growth rates. Government housing schemes and
affordable-house building programs in Thailand, Indonesia and Malaysia also provided impetus to the market during
times of economic slowdown and natural disasters. Other factors such as emergence of services-sectors in Myanmar
and increased tourism activities in other Southeast Asian countries such as Thailand, Cambodia and Laos helped the
retail market for decorative paints and coatings grow.
In 2016, the retail market for decorative paints and coatings in Thailand was dominated by TOA Paint (Thailand)
Public Company Limited which also had a market share of approximately 14.0% in the retail market for decorative
paints and coatings in the select SEA countries. Whereas, in 2016, 4 Oranges Co., Ltd, a Vietnam based company
was the market leader for retail decorative paints and coatings in Vietnam. Some of the major paint and coating
manufacturers in Cambodia, Laos, Myanmar, Malaysia and Indonesia in 2016, were the respective regional
subsidiaries of multinational companies such as Nippon Paint Holdings Co., Ltd., Akzo Nobel N.V., TOA Paint
(Thailand) Public Company Limited, United Paints Group Co., Ltd. and the Jotun Group.
Frost & Sullivan expects the retail market for decorative paints and coatings in Thailand to register a CAGR of
approximately 5.1% between 2016 and 2021, growing from THB19.2 billion in 2016 to THB24.6 billion in 2021. Its
counterpart in Vietnam is expected to register a CAGR of 9.9%, growing from VND6,500.0 billion in 2016 to
VND10,421.0 billion in 2021. Whereas, the markets in Malaysia, Indonesia, Myanmar, Cambodia and Laos
combined are expected to register a CAGR of 7.7%, growing from USD1,224.0 million in 2016 to USD1772.4
million in 2021. Urbanization, construction of new houses and repainting activities are likely to be the major factors
driving growth of the market in this region. Growth in Thailand is also likely to be driven by various other factors
such as increased retail spending, shortened repainting cycles, preference towards premium paint and coating
products, among many others. The market in Vietnam is likely to benefit from the ongoing construction projects in
urban areas of the country. Government housing initiatives and demand for better quality housing is also expected to
provide impetus to the growth in this market. The retail market for decorative paints and coatings in Malaysia is also
likely to reap the benefits of the government‟s development expenditure plans, while growth in Indonesia is
expected to be mainly driven by its‟ relatively higher population and urbanization trends. On the other hand, the
markets in Myanmar, Cambodia and Laos are likely to rely on improvements in overall economy. Paint and coating
manufacturers are also expected to boost the growth in these markets by introducing new products and expanding
their sales networks.

9
Retail Market Size of the Decorative Paints and Coatings in Thailand, THB, 2011-2021F
Source: Primary interviews with industry participants, desktop research and forecast by Frost & Sullivan Note: All figures are rounded. Base year is 2016.
Retail Market Size of Decorative Paints and Coatings in Vietnam, VND, 2011-2021F
Source: Primary interviews with industry participants, desktop research and forecast by Frost & Sullivan
Note: All figures are rounded. Base year is 2016
13.7 15.6 16.7 17.8 18.7 19.2 20.1 21.0 22.1 23.3 24.6
0.0
5.0
10.0
15.0
20.0
25.0
30.0
2011 2012 2013 2014 2015 2016 2017F 2018F 2019F 2020F 2021F
Deco
ra
tive p
ain
t a
nd
co
ati
ng
ma
rk
et
size (
TH
B b
illi
on
s)
4,224.8 4,571.2 4,964.4 5,421.1 5,925.3 6,500.0 7,115.8 7,628.8 8,252.9 9,228.8
10,421.0
0.0
2,000.0
4,000.0
6,000.0
8,000.0
10,000.0
12,000.0
2011 2012 2013 2014 2015 2016 2017F 2018F 2019F 2020F 2021F
Deco
ra
tive p
ain
t a
nd
co
ati
ng
ma
rk
et
size (
VN
D b
illi
on
s)

10
Retail Market Size of Decorative Paints and Coatings in Indonesia, Malaysia, Myanmar, Cambodia and Laos,
USD, 2011-2021F
Source: Primary interviews with industry participants, desktop research and forecast by Frost & Sullivan
Note: All figures are rounded. Base year is 2016
The retail market for non-decorative paints and coatings (for wood coatings, waterproofing and protective coatings
combined) in Thailand registered a CAGR of approximately 5.9% between 2011 and 2016, growing from
THB4,780.0 million in 2011 to THB6,376.9 million in 2016. Similarly, the market in Vietnam also followed a
steady growth trajectory, registering a CAGR of 5.7% between 2011 and 2016, growing from VND1,367.3 billion in
2011 to VND1,800.7 billion in 2016. Frost & Sullivan expects increased growth in both these markets in the forecast
period, between 2016 and 2021. The retail market for non-decorative paints and coatings in Thailand is expected to
register a CAGR of 6.8% between 2016 and 2021, increasing from THB6,376.9 million in 2016 to THB8,852.7
million in 2021, whereas the market in Vietnam is expected to register a CAGR of 7.3%, growing from VND1,800.7
billion in 2016 to VND2,558.2 billion in 2021.
Growth in Thailand is expected to be driven by increased FDI inflow, growth in the number of medium and small
scale industries, government spending on transport related infrastructures, increased consumer awareness about
protective coatings as well as house repainting and renovating activities. Other factors such as increased renovation
and repainting of wooden furniture as a result of declined domestic furniture consumption, shorter renovation cycles,
use of cement fiber, growth in tourism and demand for high-end, luxury condominiums are also expected to
contribute towards increase in market size. The retail market for non-decorative paints and coatings in Vietnam is
likely to benefit from an increase in housing construction activities, increased public investments towards
infrastructure projects related to transport and increased wood furniture manufacturing activities supported by its
domestic consumption. Since the retail market in Vietnam for non-decorative paints and coatings is not as
widespread as compared to Thailand, efforts by various paint and coating manufacturers are also expected to provide
stimulus to the growth in the forecast period.
2011 2012 2013 2014 2015 2016 2017F 2018F 2019F 2020F 2021F
Laos 15.6 15.9 16.2 16.5 16.9 17.2 17.8 18.4 19.1 19.7 20.4
Cambodia 24.7 25.6 26.7 27.7 28.8 30.0 31.6 33.3 35.1 37.0 39.0
Myanmar 24.8 26.6 28.5 30.5 32.7 35.0 37.2 39.5 41.9 44.5 47.3
Malaysia 279.0 293.0 307.7 323.3 339.5 356.5 374.7 394.2 415.0 436.6 459.3
Indonesia 554.0 594.0 626.3 670.1 723.7 785.3 853.6 929.5 1016.0 1107.1 1206.3
0
200
400
600
800
1,000
1,200
1,400
1,600
1,800
2,000
To
tal
Deco
ra
tive P
ain
t a
nd
Co
ati
ng
M
ark
et
( U
SD
mil
lio
ns)
Indonesia Malaysia Myanmar Cambodia Laos

11
Retail Market Size of Non-Decorative Paints and Coatings in Thailand, THB, 2011-2021F
Source: Primary interviews with industry participants, desktop research and forecast by Frost & Sullivan
Note: All figures are rounded. Base year is 2016.
Retail Market Size of Non- Decorative Paints and Coatings in Vietnam, VND, 2011-2021F
Source: Primary interviews with industry participants, desktop research and forecast by Frost & Sullivan
Note: All figures are rounded. Base year is 2016
3,010.6 3,332.7 3,522.6 3,670.6 3,799.1 3,901.6 4,056.2 4,268.0 4,522.6 4,857.8 5,244.3 781.7 820.8 878.2 929.2 971.0 1,000.1 1,049.3 1,102.1 1,165.1
1,253.3 1,358.6
987.8 1,075.7 1,185.4 1,292.1 1,386.4 1,475.1 1,586.5 1,707.6
1,854.8 2,037.0
2,249.8
0.0
2,000.0
4,000.0
6,000.0
8,000.0
10,000.0
2011 2012 2013 2014 2015 2016 2017F 2018F 2019F 2020F 2021F
No
n-D
eco
ra
tive p
ain
t a
nd
co
ati
ng
ma
rk
et
size (
TH
B
mil
lio
ns)
Wood Coatings Waterproofing Protective Coatings
691.3 724.1 760.4 799.4 844.9 894.8 958.6 1,012.2 1,075.4 1,157.8 1,250.1
565.9 601.5 640.6 683.8 731.7
782.9 836.5
885.5 943.7
1,025.8 1,123.7
110.2 111.5
112.9 115.2
118.2 123.0
130.4 138.7
148.9
164.9
184.4
0.0
500.0
1,000.0
1,500.0
2,000.0
2,500.0
2011 2012 2013 2014 2015 2016 2017F 2018F 2019F 2020F 2021F
No
n-D
eco
ra
tive p
ain
t a
nd
co
ati
ng
ma
rk
et
size (
VN
D b
illi
on
s)
Wood Coatings Waterproofing Protective Coatings

12
1.1.5. Competitive Landscape
Decorative and Non-Decorative Paint and Coating Retail Market Landscape in Thailand and Vietnam, 2016
Country Parent
Company Headquarters
Domestic
Subsidiaries Segments present
Estimated
Retail Market
Share, 2016
Thailand
TOA Paint
(Thailand)
Public
Company
Limited
Thailand
TOA Paint
(Thailand) Public
Company Limited
Decorative Paints
Wood Coatings
Metal Coatings
Protective Coatings
Waterproofing
Decorative:
48.7%
Wood
Coatings:
28.2%
Waterproofing:
20.0%
Protective
Coatings:
28.0%
Akzo Nobel
N.V., Netherlands
Akzo Nobel Paints
(Thailand) Limited
Decorative Paints
Metal Coatings
Protective Coatings
Automotive Paints
Decorative:
13.8%
Wood
Coatings: NA
Waterproofing:
NA
Protective
Coatings: NA
Beger Co.,
Ltd. Thailand Beger Co., Ltd.
Decorative Paints
Wood Coatings
Metal Coatings
Protective Coatings
Decorative:
13.3%
Wood
Coatings:
32.8%
Waterproofing:
NA
Protective
Coatings: NA
Jotun Norway Jotun Thailand
Limited
Decorative Paints
Wood Coatings
Metal Coatings
Protective Coatings
Automotive Paints
Decorative:
8.1%
Wood
Coatings: NA
Waterproofing:
NA
Protective
Coatings:
30.0%

13
Nippon Paint
Holdings Co.,
Ltd.
Japan Nippon Paints
Thailand Co., Ltd
Decorative Paints
Metal Coatings
Protective Coatings
Automotive Paints
Decorative:
5.2%
Wood
Coatings: NA
Waterproofing:
NA
Protective
Coatings: NA
Sika AG Switzerland Sika (Thailand) Ltd.
Decorative Paints
Metal Coatings
Protective Coatings
Waterproofing
Decorative: NA
Wood
Coatings: NA
Waterproofing:
28.0%
Protective
Coatings: NA
ParexGroup
(Thailand)
Co., Ltd.
Thailand ParexGroup
(Thailand) Co., Ltd.
Metal Coatings
Protective Coatings
Waterproofing
Decorative: NA
Wood
Coatings: NA
Waterproofing:
10.0%
Protective
Coatings: NA
Vietnam
4 Oranges
Co., Ltd Vietnam 4 Oranges Co., Ltd
Decorative Paints
Decorative:
23.0%
Wood
Coatings: NA
Waterproofing:
NA
Protective
Coatings: NA
Akzo Nobel
N.V., Netherlands
International Paint
Singapore Pte Ltd
(Vietnam branch)
Decorative Paints
Metal Coatings
Protective Coatings
Wood Coatings
Waterproofing
Decorative:
18.0%
Wood
Coatings:
10.0%
Waterproofing:
10.0%
Protective
Coatings:
40.0%

14
TOA Paint
(Thailand)
Public
Company
Limited
Thailand TOA Paint
(Vietnam) Co,.Ltd.
Decorative Paints
Wood Coatings
Metal Coatings
Protective Coatings
Waterproofing
Decorative:
9.8%
Wood
Coatings: 8.0%
Waterproofing:
6.0%
Protective
Coatings: NA
Nippon Paint
Holdings Co.,
Ltd.
Japan Nippon Paint
(Vietnam) Co. Ltd
Decorative Paints
Wood Coatings
Metal Coatings
Protective Coatings
Waterproofing
Decorative:
9.0%
Wood
Coatings: NA
Waterproofing:
NA
Protective
Coatings: NA
Jotun Norway Jotun Paints
(Vietnam) Co. Ltd.
Decorative Paints
Metal Coatings
Protective Coatings
Waterproofing
Decorative:
8.0%
Wood
Coatings: NA
Waterproofing:
10.0%
Protective
Coatings:
50.0%
Oseven
Corporation Vietnam Oseven Corporation Wood Coatings
Decorative: NA
Wood
Coatings:
45.0%
Waterproofing:
NA
Protective
Coatings: NA
Adora Paints
(M) Sdn Bhd Malaysia
Adora Paints
(Vietnam) Co., Ltd Wood Coatings
Decorative: NA
Wood
Coatings:
15.0%
Waterproofing:
NA
Protective
Coatings: NA
15
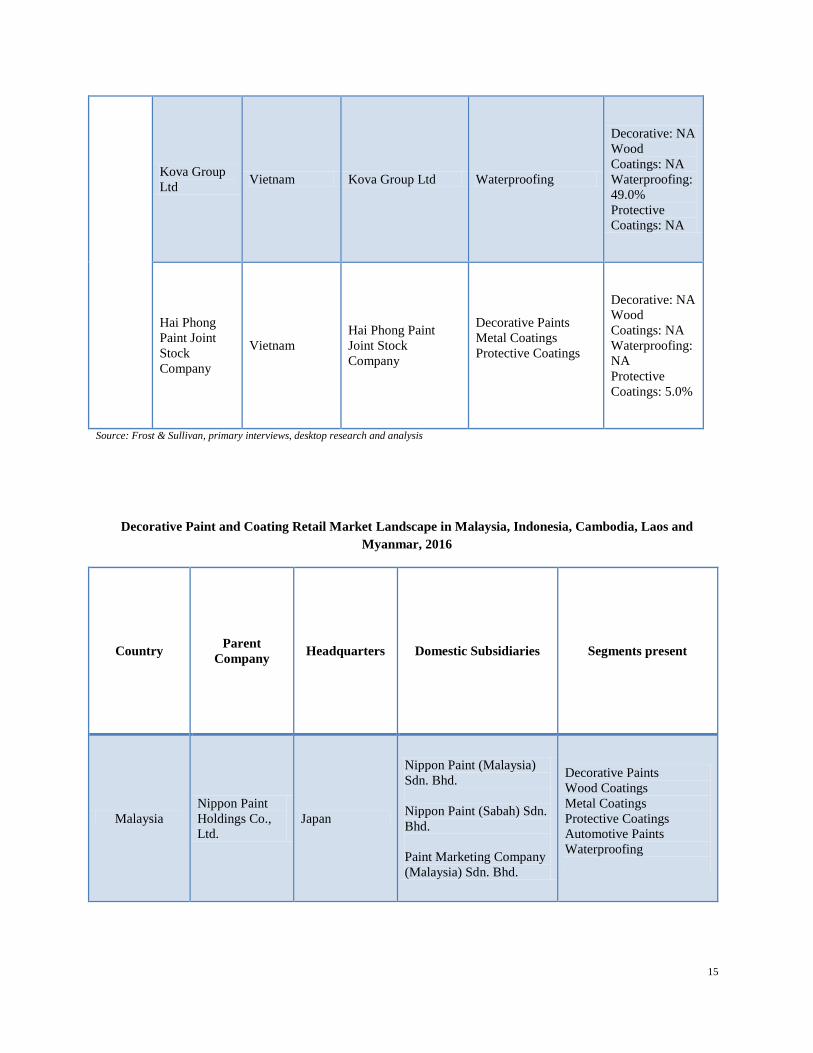
Kova Group
Ltd Vietnam Kova Group Ltd Waterproofing
Decorative: NA
Wood
Coatings: NA
Waterproofing:
49.0%
Protective
Coatings: NA
Hai Phong
Paint Joint
Stock
Company
Vietnam
Hai Phong Paint
Joint Stock
Company
Decorative Paints
Metal Coatings
Protective Coatings
Decorative: NA
Wood
Coatings: NA
Waterproofing:
NA
Protective
Coatings: 5.0%
Source: Frost & Sullivan, primary interviews, desktop research and analysis
Decorative Paint and Coating Retail Market Landscape in Malaysia, Indonesia, Cambodia, Laos and
Myanmar, 2016
Country Parent
Company Headquarters Domestic Subsidiaries Segments present
Malaysia
Nippon Paint
Holdings Co.,
Ltd.
Japan
Nippon Paint (Malaysia)
Sdn. Bhd.
Nippon Paint (Sabah) Sdn.
Bhd.
Paint Marketing Company
(Malaysia) Sdn. Bhd.
Decorative Paints
Wood Coatings
Metal Coatings
Protective Coatings
Automotive Paints
Waterproofing

16
Akzo Nobel
N.V., Netherlands
Akzo Nobel Paints
(Malaysia) Sdn. Bhd.
DGL International
(Malaysia) Sdn Bhd
Decorative paints
Automotive paints Metal
coatings Marine coatings
Protective coatings
Waterproofing
Wood Coatings
Jotun Norway
Jotun (Malaysia) Sdn.
Bhd.
Jotun Paints Sdn. Bhd.,
Nilai - (sales and
production)
Decorative Paints Marine
Coatings Protective Paints
Metal Coatings
Powder Coatings
Wood Coatings
Indonesia
Nippon Paint
Holdings Co.,
Ltd.
Japan
PT Nipsea Paint and
Chemicals
Nippon Paint PT. NP Auto
Refinishes
Decorative Paints
Wood Coatings
Metal Coatings
Protective Coatings
Automotive Paints
Waterproofing
PT. Avia Avian Indonesia ---
Decorative paints
Wood coatings
Metal coatings
Automotive paints
Akzo Nobel
N.V., Netherlands PT ICI Paints Indonesia
Decorative paints
Automotive paints Metal
coatings Marine coatings
Protective coatings
Waterproofing
Wood Coatings
Myanmar
United Paints
Group Co., Ltd. Myanmar ---
Decorative paints
Architecture paints
Wood coatings
Marine paints Industrial
paints Protective coatings
Akzo Nobel
N.V., Netherlands
Akzo Nobel Co.,Ltd.
(Yangon)
Decorative paints
Automotive paints
Protective coatings
Waterproofing
Wood Coatings
TOA Paint
(Thailand) Co.,
Ltd
Thailand TOA Paint (Myanmar) Co.
Ltd
Decorative
Wood paint
Protective Coatings
Waterproofing
Cambodia United Paints
Group Co., Ltd. Myanmar ---
Decorative paints
Architecture paints
Wood coatings
Industrial paints Protective
coatings

17
Jotun Norway Jotun (Cambodia) Ltd.,
Phnom Penh (Sales)
Decorative Paints
Protective Paints
Metal Coatings
Powder Coatings
Wood Coatings
Akzo Nobel
N.V., Netherlands ---
Decorative paints Metal
coatings
Marine coatings
Protective coatings
Waterproofing
Wood Coatings
Laos
United Paints
Group Co., Ltd. Myanmar ---
Decorative paints
Architecture paints
Wood coatings
Marine paints
Industrial paints Protective
coatings
Jotun Norway ---
Decorative Paints
Marine Coatings
Protective Paints
Metal Coatings
Powder Coatings
Wood Coatings
Beger Co., Ltd. Thailand ---
Decorative paints
Wood coatings
Construction Chemicals
Heavy Duty Coating
Special Paints
Source: Frost & Sullivan, primary interviews, desktop research and analysis
1.1.6. Industry Outlook
The growth of paint and coating industries in select Southeast Asian countries are subject to a variety of factors such
as urbanization, new constructions, repainting, purchasing power, retail spending, government initiative towards
housing, government expenditure towards infrastructure, tourism, change in consumer preferences and many others.
Government incentives in the housing market bode well for both the decorative and non-decorative paint and
coating markets. In relatively developed countries such as Thailand, Malaysia and Indonesia repainting activities are
expected to be the major growth drivers for the paint and coating industry. Long term government plans which
would focus expenditures on housing, infrastructure and industries are also likely to spur the growth. Apart from
that, a gradual shift in consumer preferences towards better quality paint and coating products, which is a result of
both introduction of premium products into the market by multinational paint companies and digitization of buying
processes, presents better growth prospects for the industry. In Thailand, the retail paint and coating industry which
is a significant channel of sales for the manufacturers is likely to see increased off-take as consumers become more
aware of the choices offered to them. This segment is also expected to see moderate to high-growth in the forecast
period, driven by an increased demand for new housing and repainting, government incentives and rising retail
spending to name a few. Large manufacturers with expansive retail dealer reach are likely to be better equipped to
capture changing consumer preferences and translate them into product features thereby enabling them to stay
current in changing times. This in-turn is expected to give them an edge over other manufacturers who may not have
the ability to innovate and adapt. On the other hand, the non-decorative retail segment, in particular, is likely to be
benefitted by a continued increase in tourism resulting in new demand and constant interior-upkeeps by the
hospitality sector in the country.

18
Growth in the retail paints and coatings in Vietnam post 2017 is likely to be driven by large housing construction
projects in urban areas of the country. Increase in the number of foreign developers in this sector and rising income
levels of the population are gradually increasing demand for better quality housing. This in turn is expected to boost
the sales of decorative paints and coatings and shift consumer preferences towards premium category products.
Growing awareness among customers about the origins of products, safety of ingredients, and their environmental
friendliness is also likely to influence the paint and coating industry in Vietnam. Companies that are able to cater to
the evolving tastes and preferences of retail and B2B consumers are likely to reap significant benefits in the forecast
period.
The outlook for the decorative paint and coating market in Malaysia is expected to remain fairly positive, driven by
the change in consumer demands with high standard of living and rapid development of commercial and residential
buildings supported by the significant increases in development expenditure (approximately 16.2% increase from
previous plan) in the 11th Malaysia Plan (2016-2020). Growth in the Indonesian decorative paint and coating market
is expected to continue on its upward trajectory owing to the rapid infrastructure developments, increased FDI and
increased tourism, coupled with establishment of economic development zones. With the opening up of Myanmar,
Laos and Cambodia‟s economies in recent years and the expected construction boom that is likely to be a result of
this liberalization, the near-term (2016-2018) outlook for the paint and coating markets in these countries is
expected to be positive.
In conclusion, a combination of aforementioned factors is expected to drive the growth in the retail market for paints
and coatings in selected countries in SEA in the forecast period 2016-2021.
The rest of the page is intentionally left blank

19
2. THE PAINT AND COATING INDUSTRY IN THAILAND
2.1.1. Brief Economic Overview of Thailand
Thailand is the second largest economy in ASEAN in terms of GDP, accounting for approximately 16.2% of
ASEAN‟s3 total GDP in 2015
4. Thailand is widely cited as a model of economic and social developmental success,
transforming into an upper middle-income5 economy in 2011. Thailand‟s Gross Domestic Product (Nominal GDP)
grew at a CAGR of approximately 14.8% between 1986 and 1996 on the back of political stability, economic
liberalization, and strong domestic consumption. In the years following the Asian financial crisis of 1997-1998,
nominal GDP moderated to an average of approximately 8.0%, between 1999 and 2005. Despite a series of
economic shocks post-2006 including periods of political instability and devastating floods, strong macroeconomic
fundamentals have enabled Thailand‟s economy to remain resilient. Thailand‟s nominal GDP grew at a CAGR of
approximately 5.9% during the period 2005 to 2015. Accounting for inflation (highest of 5.4% in 2008), real GDP
CAGR was approximately 3.3% during the same period. Over this period, a large number of jobs were created in the
country drastically reducing poverty levels from approximately 67.0% in 1986 to just 10.9% in 2016.
Rapid economic progress has fueled Thailand‟s transition from an agrarian to an industrial (including
manufacturing) and services-based economy. The industrial sector dominated the economy between 2011 and 2016
contributing to approximately 38.0% to 40.0% of GDP, followed by the services sector which contributed
approximately 25.0% to 27.0%. Traditional sectors such as agriculture played a smaller role in the economy,
contributing approximately 8.0% to 10.0% of the GDP. The focus on manufacturing led by automotive, electronics,
and consumer goods segments present significant growth prospects for the paint and coating industry since many of
these industries require the use of paints and coatings (especially non-decorative). The country is also a major hub
for agro-based industries. These industries would also generate demand for non-decorative paints and coatings.
Apart from promoting industrial growth, Thailand also maintains friendly relations with neighboring countries and
has about 22 free trade agreements with countries such as China, India, Japan, Australia and New Zealand among
others, boosting the nation‟s trade activity in both domestic and international markets. In 2016, the World Bank
Doing Business indicator ranked the country as fourth in the East Asia and Pacific Region6 and 46
th worldwide in
terms of Ease of Doing Business7 above other Asian countries in the region such as the Philippines, Indonesia and
China. On an average, the country attracted investments of approximately USD9.78 billion per year in net Foreign
Direct Investments (FDI) between 2010 and 2016. To stimulate further economic activity and achieve the status of a
developed economy from a currently developing economy status, the government of Thailand has embarked on a
20-year strategic plan to be executed during the period of 2017 to 2037, with the support of the World Bank,
incorporating broad-based reforms that seek to address economic stability, human capital development, business
competitiveness, government bureaucracy, infrastructure improvements, and environmental sustainability.
3 ASEAN includes Brunei, Cambodia, Indonesia, Laos, Malaysia, Myanmar, the Philippines, Singapore, Thailand and Vietnam 4 International Monetary Fund (IMF), World Economic Outlook, October 2016 revision 5 Economies with a GNI per capita between $4,036 and $12,475 are defined as upper middle-income economies, World Bank 6 This refers to 25 countries in the East Asia and Pacific region including the likes of China, Singapore, Malaysia, Indonesia, Philippines,
Thailand, Vietnam , Cambodia, Hong Kong and other smaller nations 7 http://www.doingbusiness.org/rankings 8 The Board of Investment of Thailand

20
2.1.2. Macro-Economic Overview of Thailand
GDP and GDP Growth Rates
During the early phase of this decade, the country achieved GDP growth rates of approximately 9.3% and 4.5% in
2012 and 2013, respectively. Weak GDP growth rates of approximately 1.8% and 3.1% in 2014 and 2015 following
the years of higher growth can be attributed to several factors. These include a fall in the prices of commodities
(e.g., rice, sugar, rubber and oil), slowdown in global trade; decrease in state spending; decline in foreign direct
investment (FDI); fall in demand from a major export market; failure of the first car policy (the government‟s short
–term economic stimulus policy) costing the Thai government approximately THB2.1 billion; and volatile political
situation arising from protests starting during the end of 2013 until mid-2014 followed by the Thai military coup in
the same year, amongst others. Despite such setbacks, GDP grew at a CAGR of approximately 4.5% between 2011
and 2016, growing from approximately THB11,300.5 billion in 2011 to approximately THB14,105.5 billion in
2016.
Thailand‟s year-on-year (YOY) GDP growth declined to 4.6% in 2011 from 11.9% in 2010 as a result of natural
disasters both inside and outside the country adversely impacting economic growth. The tsunami that hit Japan, one
of Thailand‟s major trading partners, following the strong Tohoku earthquake in March 2011, disrupted the supply
chains of several Japanese-owned manufacturers operating in Thailand. During the second half of 2011, severe
flooding hit Thailand causing losses of approximately THB400.0 billion. Subsequently the Ministry of Commerce
Thailand reported a contraction in shipment volumes by 15.5% in the last quarter of 2011 as many industrial estates
halted operations during the floods. The industrial production index also fell by 35.8% as compared to 2010. In
2012, GDP growth bounced back to 9.3% driven by a 10.3% increase in public spending, 8.3% rise in household
consumption, and 15.5% increase in overall investments. However, owing to the overall social unrest in the country
in 2013, both household consumption and public spending registered slow growth rates of 1.9% and 5.5% in
comparison to 2012. Protests and strikes resulting from political and social unrests also resulted in low industrial
capacity utilizations reducing output in the manufacturing sector (declined by 10.6% YOY as of November 2013).
Given the overall economic scenario in 2013, the GDP growth rate decreased to 4.5%. GDP growth further declined
to1.8% in 2014 as a result various internal and external factors. Social unrest during the early months of 2014
followed by military intervention negatively impacted the flow of foreign investments into the country (FDI fell by
approximately 10.0% as compared to 2013). State spending decreased while the tourism sector reported a significant
setback. Decrease in demand from one of the major export markets, China, and the fall in global commodity prices,
especially rubber, also contributed to the slowdown in growth. However, indications for a positive outlook emerged
in the later months of 2014 resulting from moderate inflation levels throughout (an indirect result of falling oil
prices), rise in the consumer confidence index, and speculation in the market that the Bank of Thailand (BoT) would
cut down key interest rates in 2015 to boost consumer spending in the country. The Board of Investment (BoI)
Thailand also registered an increase in the number of new project applications in late 2014, indicating strengthening
investor sentiment in the country.
In 2015, Thailand‟s GDP growth rate increased significantly, from 1.8% in 2014 to 3.1%. Government stimulus
package programs towards industrial growth and public welfare schemes resulting in increased factory production
and higher levels of public spending (government final consumption expenditure increased by 4.4% between 2014
and 2015), respectively, helped spur growth. However, a cautious outlook prevailed over the general economic
conditions resulting from the droughts caused by El-Nino, decrease in rice production, fall in oil and other
commodity prices, weaker demand from export markets in Asia and sluggish household spending (household final
consumption expenditure fell by 6.7% between 2014 and 2015) as well as lagging consumer confidence index over
the later months of the year. All these resulted in negative inflation in 2015. However, the announcement by the
government to reduce corporate taxes permanently to 20.0% and decrease real estate transfer tax from 2.0% to
0.01% has boosted sentiments in various industries such as automotive, technology, and construction.
21
In 2016, the passing of Thailand‟s monarch after a 70-year reign added to political and economic uncertainties in the
country. However, the expected recovery of private consumption from negative growth of 6.7% in 2015 to a positive
growth of 2.7% in 2016, growth in public investment by 9.5%, and the return of inflation to positive territory of
0.3% after key interest rates held steady at 1.5%, are forecast to boost the GDP growth rate to 4.2% in 2016
compared to 3.1% in 2015. Public investment in large infrastructure projects, growth in the agriculture sector and
higher tourist arrivals (13.1% rise compared to 2015) continue to stimulate the economy. Global geopolitical shifts
such as Brexit, the change in the US administration followed by its‟ subsequent withdrawal from the Trans-Pacific
Partnership (TPP), and economic uncertainties prevailing in emerging markets in Southeast Asia could heighten
economic volatility. However, improvements in private consumption, public investments in infrastructure, consumer
confidence, and government stimulus in various sectors, steady interest rates, and increased tourism activities are set
to position Thailand on a growth path toward improved economic performance during the forecast period of 2016 to
2021. Furthermore, the International Monetary Fund (IMF) expects the GDP of Thailand to grow at CAGR of
approximately 5.3% between 2016 and 2021, increasing from approximately THB14,105.5 billion in 2016 to
approximately THB18,264.9 billion by 2021.
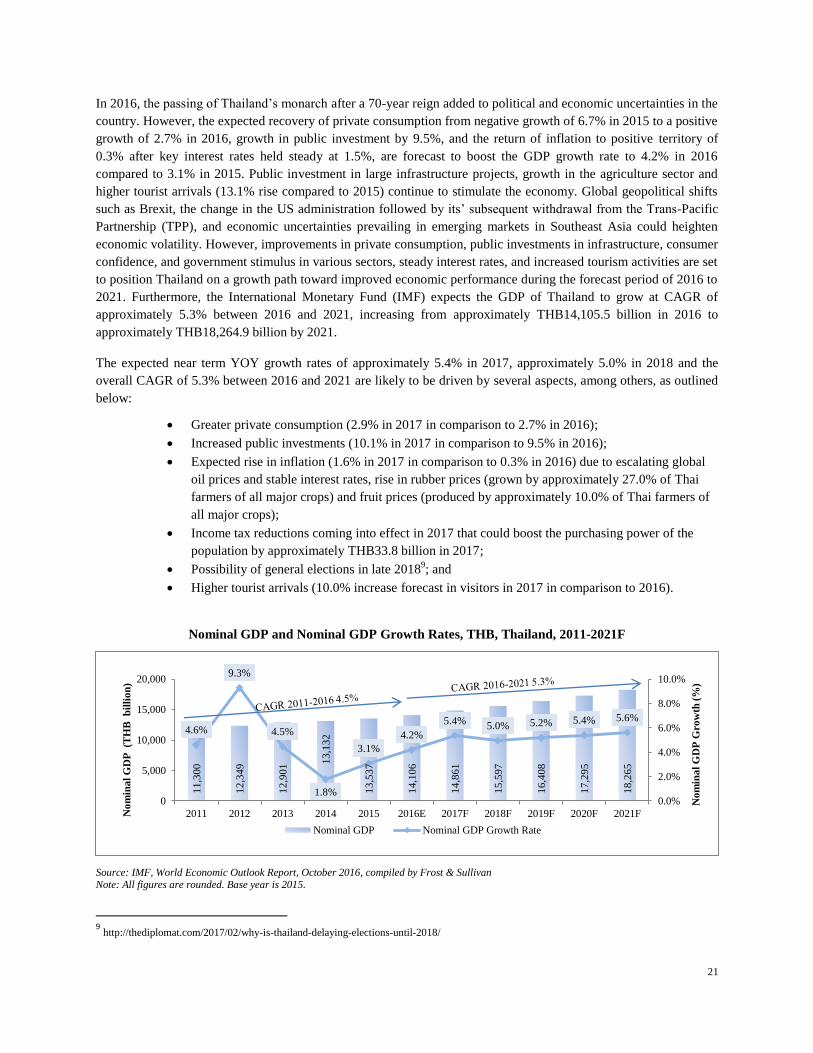
The expected near term YOY growth rates of approximately 5.4% in 2017, approximately 5.0% in 2018 and the
overall CAGR of 5.3% between 2016 and 2021 are likely to be driven by several aspects, among others, as outlined
below:
Greater private consumption (2.9% in 2017 in comparison to 2.7% in 2016);
Increased public investments (10.1% in 2017 in comparison to 9.5% in 2016);
Expected rise in inflation (1.6% in 2017 in comparison to 0.3% in 2016) due to escalating global
oil prices and stable interest rates, rise in rubber prices (grown by approximately 27.0% of Thai
farmers of all major crops) and fruit prices (produced by approximately 10.0% of Thai farmers of
all major crops);
Income tax reductions coming into effect in 2017 that could boost the purchasing power of the
population by approximately THB33.8 billion in 2017;
Possibility of general elections in late 20189; and
Higher tourist arrivals (10.0% increase forecast in visitors in 2017 in comparison to 2016).
Nominal GDP and Nominal GDP Growth Rates, THB, Thailand, 2011-2021F
Source: IMF, World Economic Outlook Report, October 2016, compiled by Frost & Sullivan Note: All figures are rounded. Base year is 2015.
9 http://thediplomat.com/2017/02/why-is-thailand-delaying-elections-until-2018/
11
,30
0
12
,34
9
12
,90
1 13
,13
2
13
,53
7
14
,10
6
14
,86
1
15
,59
7
16
,40
8
17
,29
5
18
,26
5
4.6%
9.3%
4.5%
1.8%
3.1%
4.2%
5.4% 5.0% 5.2% 5.4% 5.6%
0.0%
2.0%
4.0%
6.0%
8.0%
10.0%
0
5,000
10,000
15,000
20,000
2011 2012 2013 2014 2015 2016E 2017F 2018F 2019F 2020F 2021F
No
min
al
GD
P G
row
th (
%)
No
min
al
GD
P (T
HB
b
illi
on
)
Nominal GDP Nominal GDP Growth Rate

22
GDP Per Capita
As an indicator of a country‟s economic performance and standard of living, GDP per capita takes into account the
value of all the goods and services produced in the country per person. Growth in GDP per capita also tends to
reflect an overall increase in incomes and spending power. GDP per capita increased by 13.1% between 2011 and
2013, from THB167,073.0 in 2011 to THB188,902.9 in 2013. However, the YOY growth moderated to
approximately 1.3% after 2013 resulting in a GDP per capita of THB191,274.4 in 2014. As the economy stabilized
post the political unrest in 2014, the YOY GDP per capita growth rate in Thailand gradually increased to 2.8% and
4.0% in 2015 and 2016, respectively, achieving a robust CAGR of approximately 4.1% over the period of 2011 to
2016. Against the backdrop of heightened economic activities10
, the International Monetary Fund expects GDP per
capita between 2016 and 2021 to record a CAGR of approximately 5.2% between 2016 and 2021, increasing from
THB204,483.7 in 2016 to THB263,391.3 by 2021. This is likely to serve as an impetus to the paint and coating
industry as people with higher incomes are more inclined to invest and maintain real-estate assets.
Per Capita GDP and Per Capita GDP Growth Rates, (Nominal GDP), THB, Thailand, 2011-2021F
Source: World Economic Outlook Report, October 2016, compiled by Frost & Sullivan
Note: All figures are rounded. Base year is 2014 (Population actuals is 2014 while GDP actuals is 2015).
The rest of the page is intentionally left blank
10 Faster GDP growth vis a vis population growth
16
7,0
73
18
1,7
22
18
8,9
03
19
1,2
74
19
6,6
57
20
4,4
84
21
5,0
87
22
5,4
54
23
6,9
37
24
9,5
45
26
3,3
91
4.2%
8.8%
4.0%
1.3% 2.8%
4.0%
5.2% 4.8% 5.1% 5.3% 5.5%
0.0%
2.0%
4.0%
6.0%
8.0%
10.0%
0
50,000
100,000
150,000
200,000
250,000
300,000
2011 2012 2013 2014 2015E 2016E 2017F 2018F 2019F 2020F 2021F
GD
P p
er c
ap
ita
Gro
wth
(%
)
GD
P p
er c
ap
ita
(T
HB
)
GDP per capita GDP per capita growth

23
Inflation
Inflation measures the percentage changes in the Consumer Price Index (CPI) and is a key indicator of the overall
prices of goods and services in a country. In Thailand, the CPI represents changes in the prices of a basket of 427
goods and services purchased by consumers. The Bureau of Trade and Economic Indices under the Ministry of
Commerce collects, summarizes, and reports CPI data on a monthly basis. Inflation rates declined from 3.8% in
2011 to approximately a negative 0.9% in 2015 especially due to the steep decline in global crude oil prices11
from
approximately USD100.0/barrel in 2013 to approximately USD38.0/barrel by 2015, triggering negative inflation12
in
the short-term. However, the Bureau of Trade and Economic Indices, Thailand measured the rate of YOY inflation
at a nominal value of approximately 0.2% in 2016 (estimates by IMF were at 0.3% in 2016). Inflation figures for
January and February 2017 are estimated at approximately 1.5% and 1.4% respectively.
The IMF expects Thailand to continue on a path of sustained inflation from 2016 to 2021, along with continuous
increase in nominal GDP growth rates, anticipating it to increase from approximately 1.6% in 2017 to approximately
2.5% by 2021, below the forecast GDP CAGR of 5.3% over the same period. However, the Bank of Thailand‟s
medium-term inflation target for 2017 is between 1.0% and 4.0%13
. An excess of growth in GDP per capita over
inflation is indicative of a higher disposable income which is in turn, is expected to increase buyer sentiments
toward high-value purchases including housing. An increase in housing driven on the backdrop of strong economic
conditions is likely to fuel demand for paints and coatings in the forecast period.
Inflation, Thailand, 2011-2021F
Source: IMF, World Economic Outlook Report, October 2016 and Bureau of Trade and Economic Indices, Ministry of Commerce, Thailand;
compiled by Frost & Sullivan
Note: All figures are rounded. Base year is 2015 (Population actuals is 2014 while GDP and inflation actuals are 2015).
11 This refers to West Texas Intermediate (WTI or NYMEX) crude oil prices per barrel 12
https://www.wsj.com/articles/thai-consumer-prices-end-2015-in-negative-zone-1451882290 13
http://www.bangkokpost.com/business/finance/1216145/local-stocks-charmed-by-dovish-fed
3.8% 3.0%
2.2% 1.9%
-0.9% 0.3%
1.6% 1.9% 2.1% 2.2% 2.5%
4.2%
8.8%
4.0%
1.3%
2.8%
4.0%
5.2% 4.8% 5.1% 5.3% 5.5%
-2.0%
0.0%
2.0%
4.0%
6.0%
8.0%
10.0%
2011 2012 2013 2014 2015E 2016E 2017F 2018F 2019F 2020F 2021F
Infl
ati
on
an
d G
DP
per c
ap
ita
gro
wth
(%)
Inflation GDP per capita growth

24
2.1.3. Socio-Economic Overview of Thailand
Population Growth
With YOY growth rates as low as approximately 0.3% between 2011 and 2015, Thailand‟s population was range-
bound between approximately 66.0 million and 68.0 million people. Over this period, the total population of the
country grew from 66.9 million people in 2011 to 68.0 million in 2015. The population was estimated to increase to
68.1 million in 201614
, resulting in a modest CAGR of 0.4% from 2011 to 2016. Also, between 2010 and 2015,
working age15
group population as a percentage of total population increased from 64.8% in 2010 to 65.3% in
201516
. According to the United Nation‟s World Population Prospects, the population of Thailand is forecast to
increase to 68.6 million by 2021 from 68.1 million in 2016, signifying a CAGR of only 0.1%, less than half the rate
achieved from 2011 to 2016.
Population and Population Growth Rates, Thailand, 2011-2021F
Source: UN, World Population Prospects, 2015 revision, compiled by Frost & Sullivan Note: All figures are rounded. Base year is 2014.
The rest of the page is intentionally left blank
14 Actual numbers were not available at the time of this report, March 2017 15
Defined as population between 20 years and 64 years 16
World Population Prospects, United Nations
66.9 67.2 67.5 67.7 68.0 68.1 68.3 68.4 68.5 68.6 68.6
0.3%
0.4%
0.4% 0.4%
0.3%
0.3%
0.2%
0.2%
0.1% 0.1%
0.1% 0.0%
0.1%
0.2%
0.3%
0.4%
0.5%
0.0
15.0
30.0
45.0
60.0
75.0
2011 2012 2013 2014 2015E 2016E 2017F 2018F 2019F 2020F 2021F
Po
pu
lati
on
Gro
wth
(%
)
Po
pu
lati
on
(m
illi
on
s)
Population Population growth
CAGR 2011-2016 0.4% CAGR 2016-2021 0.1%

25
Human Development Indicators
Various indices reveal the economic development and welfare of a country‟s population. Thailand fares well in the
Human Development Index17
(HDI), a summary measure for assessing long-term progress in three aspects of human
development, healthy life, access to knowledge, and a decent standard of living. In 2014, the HDI value in Thailand
was measured at 0.726 (HDI was at 0.502 in 1980) which was better than countries such as Indonesia, the
Philippines and Vietnam which had HDI values of 0.684, 0.668 and 0.666, respectively in the same year. A major
contributor to this growth is the GNI18
of the country, which increased by 277.4% from 1980 to 2014.
Multidimensional Poverty Index19
(MPI), which identifies multiple deprivations within the same households in
terms of education, health, and living standards. Thailand stood at 0.004, rating ahead of neighbors such as the
Philippines and Vietnam, which scored 0.033 and 0.026 MPI rates respectively. A combination of the
aforementioned socio-economic factors is indicative of better standards of living in Thailand compared to
neighboring countries. The paint and coating industry, in turn is expected to reap the benefits of better living
standards in the forecast period of 2016 to 2021 as the latter is linked directly to consumer expenditure.
The rest of the page is intentionally left blank
17 The Human Development Index (HDI) is a summary measure of human development. It measures the average achievements in a country in
three basic dimensions of human development: a long and healthy life, access to knowledge and a decent standard of living. HDI values fall between 0 and 1 with higher values indicating at better development 18 Gross national income (GNI) is defined as the sum of value added by all producers who are residents in a nation, plus any product taxes (minus
subsidies) not included in output, plus income received from abroad such as employee compensation and property income 19 MPI complements monetary measures of poverty by considering overlapping deprivations suffered by individuals at the same time. The index
identifies deprivations across the same three dimensions as the HDI and shows the number of people who are multi-dimensionally poor (suffering
deprivations in 33% or more of the weighted indicators) and the number of weighted deprivations with which poor households typically contend with. A typical MPI value falls between 0 and 1 where higher values indicate at less prevalence of poverty

26
Household Characteristics
Distribution of households based on region (Urban vs Rural)
Majority of Thailand‟s population resides in the rural rice-growing areas of northern, northeastern, and central
regions, while the urban population is concentrated primarily in the greater Bangkok region20
. The number of urban
households (including both Bangkok and vicinity areas) increased from 4.6 million in 2011 to 5.3 million in 2016
registering a CAGR of 3.1% between 2011 and 2016. Over the same five-year period, the number of rural
households increased from 17.7 million in 2011 to 19.9 million in 2016 recording a marginally lesser CAGR of
2.4% between 2011 and 2016. Frost & Sullivan expects the number of rural and urban households to reach 6.2
million and 22.4 million by 2021, respectively. Increase in the number of urban households holds growth prospects
for the retail market of decorative paints and coatings in Thailand owing to the fact that the urban population earns
more than their rural counterpart and are likely to spend more on home improvements, whereas growth in the
number of rural households coupled with the narrowing income gap between urban and rural households is
indicative of a potential market for decorative paints and coatings in the forecast period.
Distribution of Households based on regions, Thailand, 2011-2016 and 2021F
Source: Official Statistics Registration Systems, Department of Provincial Administration, Ministry of Interior, Thailand, compiled by Frost & Sullivan
Note: Forecasts by Frost & Sullivan
The rest of the page is intentionally left blank
20 Referred to as Bangkok and vicinity areas of Nonthaburi, Samut Prakan, Pathum Thani, Samut Sakhon and Nakorn Pathom
2011 2012 2013 2014 2015 2016 2021F
Urban: Bangkok Area 2.5 2.6 2.6 2.7 2.8 2.8 3.2
Urban: Vicinity Area 2.1 2.2 2.3 2.3 2.4 2.5 3.0
Rural 17.7 18.1 18.6 19.1 19.5 19.9 22.4
0.0
5.0
10.0
15.0
20.0
25.0
Nu
mb
er o
f h
ou
seh
old
s (m
illi
on
s)
Urban: Bangkok Area Urban: Vicinity Area Rural

27
Household income
The average monthly household income for urban areas in Thailand increased by a CAGR of approximately 1.1%,
from THB30,218.0 in 2009 to THB32,350.0 in 2015 vis-a-vis a a CAGR of approximately 5.1% for rural areas over
the same period, from THB16,287.0 in 2009 to THB21,994.0 in 2015. Higher growth of average monthly income in
rural households was driven by the growth in exports of vegetables (registered CAGR of 13.3% between 2009 and
2015) internationally. The narrowing gap between rural and urban incomes suggest possible improvements in living
standards in rural areas. Additionally, the rising average incomes in both types of households is also indicative of an
increased ability to spend on household improvements including repainting jobs.
Household Average Monthly Incomes, 2009-2015
Source: National Statistics Office, Thailand, compiled by Frost & Sullivan Note: All figures are rounded.
The rest of the page is intentionally left blank
30,218 31,695 31,939 32,350
16,287
18,439
21,377 21,994
15,000
20,000
25,000
30,000
35,000
2009 2011 2013 2015Avera
ge m
on
thly
in
co
me (
TH
B)
Urban Rural

28
Household Sizes
Household sizes have decreased in 2015 in comparison to 2009. In 2009, a significant portion households in
Thailand (42.5%) consisted of 3 to 4 persons in 2009. Nuclear households (those consisting of 1-2 persons)
accounted for 34.4% of the total number of households, followed by households composed of 5-7 persons which
made up 21.2%. However, between 2013 and 2015, nuclear households recorded a steep rise to 66.5% in 2015, from
39.4% in 2013 driven by moderated GDP growth rates and decreased inflation which resulted in lower living costs
and thus helped spur the growth of nuclear households. Going forward, the combination of nuclear households
coupled with rising household incomes is likely to trigger demand for, among other things, new houses, as well as
aesthetic home improvement solutions including paints and coatings.
Distribution of Households, by household Size, 2009-2015
Source: National Statistics Office, Thailand, compiled by Frost & Sullivan
Note: All figures are rounded. Base year is 2015.
The rest of the page is intentionally left blank
2009 2011 2013 2015
8 Persons or more 1.9% 1.1% 1.1% 0.4%
5-7 Persons 21.2% 19.1% 17.8% 6.6%
3-4 Persons 42.5% 41.9% 41.7% 26.5%
1-2 Persons 34.4% 37.9% 39.4% 66.5%
0%
20%
40%
60%
80%
100%
Ho
use
ho
lds
by
siz
e (
as
a %
of
tota
l n
um
ber o
f h
ou
seh
old
s)
1-2 Persons 3-4 Persons 5-7 Persons 8 Persons or more

29
2.1.4. Overview of the Paint and Coating industry in Thailand
Paint and Coating Industry
The retail market for decorative paints and coatings in Thailand increased from approximately THB13,727.2 million
in 2011 to approximately THB19,201.3 million in 2016 driven by construction activities, repainting, retail spending
and changing consumer preferences. There were several major setbacks in the market during this period as a result
of political instability which in turn had an adverse impact on the overall economy. Frost & Sullivan expects the
retail market for decorative paints and coatings in Thailand to reach approximately THB24,603.2 million in 2021 on
the back of increased repainting activities, higher demand for premium paint and coating products, and greater
consumer purchasing power.
The retail market for non-decorative paints and coatings (wood coatings, waterproofing and protective coatings
combined) increased from approximately THB4,780.0 million in 2011 to approximately THB6,376.9 million in
2016 primarily driven by greater retail spending and urbanization. Frost & Sullivan forecasts the retail market for
non-decorative paints and coatings in Thailand to reach approximately THB8,852.7 million by 2021 due to
increasing consumer awareness, robust tourism activity and shorter renovation cycles for furniture and
industrialization.
Rising exports to other regions, especially ASEAN countries, is also expanding the paint and coating industry in
Thailand. Thai paint and coating exports to ASEAN countries accounted for 67.8% of the total paint and coating
exports in 2015, with Myanmar being the largest market (share of 13.5% of total paint and coating exports in 2015).
The other large export markets for the Thai paint and coating industry were India (8.3%), Australia (3.4%), and
China (2.7%). From 2011 to 2015, the export of paints and related products from Thailand recorded a CAGR of
6.5% from USD100.2 million in 2011 to USD120.8 million in 201521
.
Decorative Paints and Coatings
Retail sales of decorative paints and coatings in Thailand are significantly influenced by the housing market. These
include repainting of existing houses that consume approximately 75.0%-80.0% of total decorative paint and coating
sales and new housing constructions that make up the rest of the sales (approximately 20.0%-25.0%)22
. Increased
awareness and consumer knowledge about decorative paints and coatings, consumer preferences for premium
decorative paint and coating products and decrease in average repainting cycles of private household from 7-10
years in 2011 to 5-7 years in 2016 are other factors driving retail sales growth. However, for new commercial and
large-scale residential projects, repainting for the first time is done after an average of 9-10 years, while subsequent
repainting activities are conducted after every 5-7 years. The rapid pace of urbanization giving rise to the number of
urban households, growth in the number of apartments, retail spending, government spending on infrastructure, the
flow of FDI into the country are also some of the driving factors behind the growth in retail sales of decorative
paints and coatings. Both new housing constructions and permission for land development in Thailand declined
considerably between 2014 and 2016. However, its impact on retail sales in the decorative paint and coating market
were partially offset by an increase in repainting activities, urbanization, and higher demand of premium decorative
paint and coating products, resulting in lower growth rate from 2014 to 2016, rather than a decline in absolute
market size. Growth in the decorative paint and coating market is expected to pick up pace from 2017 onward on the
back of repainting cycles in private households which are expected to reduce from 5-7 years in 2016 to 3-5 years by
2021. Consequently, repainting and the sale of premium decorative paint and coating products are likely to be key
growth drivers for the retail decorative paint and coating market in the forecast period.
21 United Nations Comtrade, International Trade Statistics Database 22 Interviews with industry participants and Frost & Sullivan analysis

30
Non-decorative Paints and Coatings
Growth in the retail sales of non-decorative paints and coatings is contingent on several factors such as domestic
sales of wooden furniture, industrialization, natural disasters, extreme weather conditions, consumer awareness
about the structural integrity of houses, sales of metallic consumer products such as furniture, hardware equipment,
as well as overall economic activity. The retail market for non-decorative wood coatings is mainly related to the
wooden furniture industry and furniture repainting activities which are mainly DIY in nature; whereas sales of non-
decorative protective coatings such as concrete protective coatings and waterproofing depend mainly on repainting
activities and consumer awareness about housing protection (protection of floors from damage and walls from
dampness). The manufacturing sector led by the automotive, electronics, and consumer goods segment are also set
to drive demand in the paint and coating industry, primarily in the non-decorative segment. Automotive production
in Thailand is likely to get a much-needed boost from falling production costs and favorable macroeconomic
indicators in the forecast period.
Market Participants
Large companies such as TOA Paint (Thailand) Public Company Limited, Jotun Thailand Limited, Beger Co., Ltd,
Nippon Paint (Thailand) Co., Ltd and Akzo Nobel Paints (Thailand) Co., Ltd dominate the paint and coating
industry in Thailand, supplying the market with decorative and non-decorative paints and coatings used on metal,
concrete, wood and for waterproofing. Most of these manufacturers use state-of-the-art production systems that
include material mixing machines, filling machines as well as tinting and dosing systems. Use of automated
software to control and monitor production is a common practice among Thailand paint manufacturers. Continued
investments in research and development are also likely to enable manufacturers to develop new product
formulations and cost-effective alternatives in the forecast period.
In Thailand, large paint and coating manufacturers have extensive reach in the country through traditional
distributor-retail dealers, modern trade distributors and company-owned or franchised retail dealers. Most of the
retail dealers are located in urban areas such as Bangkok and the Bangkok Metropolitan region. Major paint and
coating companies such as Nippon Paint (Thailand) Co., Ltd. and TOA Paint (Thailand) Public Company Limited
also have paint mixing machines installed with many of their associated retail dealers and modern trade distributors.
Key Inputs
The paint and coating industry in Thailand sources raw materials from large multinational as well as domestic
chemical companies. Consequently, production costs are highly sensitive to price fluctuations of raw materials used
in the production of pigments, binders, extenders, solvents, and additives which are procured from both domestic
and international suppliers. Approximately 15.0%-20.0% of raw material costs are attributed to oil derivatives, costs
of which are based on global crude oil prices and susceptible to foreign exchange rates.
Any increase in raw materials costs is likely to be passed on to the end consumer. For example, titanium dioxide, a
naturally occurring mineral sourced mainly from the ilmenite ore is also a key ingredient to enhance the brightness
and opacity of paint and coating products, with China being one of the biggest producers of this chemical. Global
titanium dioxide prices spiked in 2010, forcing Sherwin-Williams, a major paint and coating manufacturer, to revise
its‟ decorative paint pricing three times resulting in an overall increase of 16.0%. However, prices declined in 2015,
providing some respite to the paint and coating industry. The chemical also attracts significant demand from the
solar power generation industry for use in photovoltaic devices, owing to growing interest globally in renewable
energy sources. The Energy Regulatory Commission of Thailand reported an installed capacity of 2,021 MW as of
2017. The latest Alternative Development Plan 2015-2036 by the same agency aims at increasing the solar output to
6,000 MW by 2036, heightening demand for photovoltaic cells. Competition for titanium oxide sources from the
solar power generation industry is likely to put pressure on its availability for the paint and coating industry, placing
a cap on production quantities for paint and coating manufacturers.

31
Per Capita Paint and Coating Consumption
Per capita paint and coating consumption can also be used to compare market maturities of the paint and coating
industry across different countries. As seen from the chart below, the average per capita paint and coating
consumption in the Asia-Pacific region in 2015 was 4.7 liters whereas the same for Thailand in 2016 was almost
double at 8.0 liters. However it was less as compared to other countries in the Asia-Pacific region such as Singapore
(15.0 liters), Japan (10.5 liters) and Malaysia (9.0 liters). It was also less than half of that of Norway23
which had
consumption per capita of paints and coatings of 20.0 liters in 2016. Frost & Sullivan believes that the current pace
of residential and commercial developments in the country including the opening up of trade channels on the
backdrop of AEC is likely to drive paint and coating consumption in the forecast period.
Per capita paint and coating consumption, litres, 2016
Source: Coatings World, Primary interviews with industry participants, desktop research and forecast by Frost & Sullivan.
Note: All figures are rounded. Base year is 2015 for APAC Overall Average and 2016 for the rest. APAC Developed Average is the average per
capita paint and coating consumption for Singapore, Japan, Malaysia, Thailand and Indonesia.
The rest of the page is intentionally left blank
23 Norway has been mentioned in this study as the country has one of the highest per capita paint and coating consumptions in the world
20.0
15.0
10.5 10.0 9.0
8.0
6.0
3.0 1.5 1.5 1.0
0.0
2.0
4.0
6.0
8.0
10.0
12.0
14.0
16.0
18.0
20.0
Norway Singapore Japan USA Malaysia Thailand Indonesia Vietnam Cambodia Laos Myanmar
Per c
ap
ita
pa
int
an
d c
oa
tin
g
co
nsu
mp
tio
n (
litr
es)
Per Capita paint and coating consumption APAC Overall Average APAC Developed Average
4.7
9.7
32
2.1.5. Value Chain and Distribution Chain Analysis
The paint and coating industry relies heavily on the petrochemical and mining industries for basic raw materials and
intermediates to produce inorganic and fine chemicals, monomers, polymers, solvents, and additives. Monomers and
polymers are used to manufacture resins that make up the major components of binders while chemicals are used to
create pigments. Most paints and coatings are made up of three elements: the pigment, the binder, and the solvent.
The solvents and additives derived from petrochemical products are mixed with the binders (collectively known as
the vehicle) to formulate paint.
The upstream flow of raw materials for the paint and coating industry starts with the production of petrochemical
derivatives and mining of minerals, generally manufactured by large corporations that cater to various other sectors
of the economy. The raw materials (petrochemical derivatives and mined minerals) are used by major chemical
companies such as Dow to produce resins and intermediates for the paint and coating industry in Thailand. Other
resin manufacturers in the country are mostly multinationals as well. Paint and coating manufacturers enter the
picture post-resin manufacturing. There is minimal integration between resin manufacturers and the paint and
coating producers in Thailand.
Independent paint and coating companies in Thailand produce different variants including decorative and non-
decorative, water based and solvent based and domestic and industrial categories which are supplied in the market
using different channels. Retail channel dominates the decorative paint and coating sales in the country. Here, the
goods move from the manufacturer to the retail dealers24
either directly or through distributors and ultimately to the
end-user (i.e. individuals, project owners and contractors). In addition, sales through modern trade channel are also
gaining prominence wherein paint and coating manufacturers sell their products directly to modern trade
distributors25
. Project owners and contractors also source their requirements directly from distributors where they
can secure discounts by placing bulk orders. Many large paint and coating manufacturers in Thailand also own retail
outlets or franchises. In terms of non-decorative paint and coating sales, paint and coating manufacturers tend to sell
their products directly to OEMs. Additionally on a project by project basis, contractors and developers handling
large-scale projects prefer to procure paints and coatings directly from paint and coating manufacturers. According
to Frost & Sullivan, Thailand has roughly 30,000 to 40,000 contractor companies operating in the building
construction industry and approximately 2,500 to 3,000 infrastructure contractors. Thailand also has about 150 to
200 off-site furniture manufacturers driving significant demand for both decorative and non-decorative paint and
coating sales.
The rest of the page is intentionally left blank
24 Retail dealers are defined as standalone retail shops with expansive distribution network 25 Modern trade distributors refer to large home building and home improvement chain stores

33
Value Chain, Paint and Coating industry, Thailand, 2016
Source: Frost & Sullivan
The rest of the page is intentionally left blank

34
2.1.6. Drivers of the Paint and Coating Industry
Continued Urbanization and decreasing household sizes
The increasing urban population along with decreasing household sizes drives demand for more housing in city
centers. The consequent increase in houses and formation of households, both in terms of new builds or renovations
and relocation of households from rural to urban areas, continues to impact the paint and coating industry positively.
Urbanization also boosts paint and coating sales by creating demand for retail and entertainment spaces such as
malls, multiplexes and theme parks. The urban population in Thailand registered a CAGR of 2.9% from 2011 to
2016, increasing from 30.2 million inhabitants in 2011 to 34.8 million inhabitants in 2016. The urban population in
2016 was 51.1% of the country‟s total population, from 45.2% in 2011. The urban population is projected to expand
at a CAGR of 2.1% from 2016 to 2021, reaching 38.6 million inhabitants by 2021 and accounting for 56.2% of
Thailand‟s total population due to increasing industrialization. According to Frost & Sullivan, as a result of the
increase in urban population and decrease in size of households, number of urban households in Thailand grew from
9.8 million in 2010 to approximately 11.3 million in 2015 and is forecasted to reach approximately 12.9 million by
2021. This increase in urban population is expected to continue to be a significant driver for decorative and non-
decorative paint and coating sales in the future.26
Demand for new housing and repainting
The number of new built homes27
completed in Thailand (for Bangkok and surrounding provinces) recorded CAGR
of approximately 2.4% from 106, 893 units in 2010 to 123,383 units in 2016 (CAGR of 8.6% between 2011 and
2016), resulting in a consequential rise in the demand for decorative paints and coatings. Growth was more
pronounced between 2011 and 2016 when the number of new houses (in Bangkok and surrounding provinces)
increased from 81,856 units to 123, 383 units in 2016, at a CAGR of 8.6%. The decline (by 23.4%) in new housing
between in 2011 from 2010 was mainly due to the country being hit by devastating floods. However, in 2012, the
number of new housing increased by an impressive rate of 52.7%, spearheaded by a rise (approximately 125.7%) in
the number of apartments. Between 2011 and 2016, the CAGR for housing projects, apartments and condominiums
and self-built houses recorded 3.3%, 14.9% and 1.7%, respectively. The Japan International Cooperation Agency
(JICA)28
estimates that Bangkok and the surrounding provinces require approximately 3.3 million new houses from
2010 to 2020, of which only 25.1% or 827,000 are built to date. The growth in sales of paints and coatings,
especially in decorative paints and coatings, is a lagging indicator to the growth in the housing market.
According to Frost & Sullivan, approximately 20.0%-25.0% of decorative paint and coating sales to the housing
market relates to the painting of new houses while the rest (approximately 75.0%-80.0%) is used for repainting
purposes. Higher sales of decorative paints and coatings for repainting purposes is mainly due to the fact that in
Thailand the number of new housing constructions as a percentage of total housing stock has historically varied
between 1.4% and 2.0%29
. With new houses added to the total housing stock every year, the demand for decorative
paints and coatings is expected to be primarily driven by shorter cycles of repainting activities such as repainting of
interior and exterior walls. Moreover, high-end condominiums in Thailand, which cost approximately
THB100,000.0 per square meter, use imported wood materials for flooring. These are likely to generate demand for
non-decorative paints and coatings in the forecast period. Waterproofing in newly constructed houses and existing
26 World Urbanization Prospects, United Nations 27 Includes housing projects, apartments and condominiums and self-build houses 28
The Japan International Cooperation Agency is a governmental agency that coordinates official development assistance for the government of
Japan 29
The Japan International Cooperation Agency (JICA)

35
houses that require repairing are also expected to stimulate demand for the sale of non-decorative waterproofing in
the retail market, as buildings and their structural components require protection from moisture, dampness and rust.
New Housing Constructions in Bangkok and Vicinity, Thailand, 2011-2016P
Source: Bank of Thailand, compiled by Frost & Sullivan
Note: All figures are rounded. The values given in the chart above for 2015 and 2016 are projections by Bank of Thailand. Actual data not
available
The rest of the page is intentionally left blank
2011 2012 2013 2014 2015P 2016P
CAGR
2011-2016
Total 81,856 125,002 132,302 133,479 124,139 123,383 8.6%
Self-built housing 20,128 23,437 23,285 24,896 22,731 21,914 1.7%
Apartments and Condominium 34,734 78,391 71,440 75,058 67,628 69,696 14.9%
Housing Project 26,994 23,174 37,577 33,525 33,780 31,773 3.3%
0.0
20,000.0
40,000.0
60,000.0
80,000.0
100,000.0
120,000.0
140,000.0N
um
ber o
f n
ew
ho
usi
ng
co
nsu
trcti
on
s
Housing Project Apartments and Condominium Self-built housing

36
Government Incentives
Government incentives have fueled growth in the construction sector in Thailand since 2012. New housing
developments increased significantly in 2012 from 2011 due to the government‟s property stimulus package (as a
response to the devastating effects of the floods in 2011) which included a 5-year tax break for new houses priced at
less than THB5.0 million. The package also included a 10.0% tax reimbursement over five years applicable to new
homebuyers. Between 2015 and 2016, the government successfully implemented another stimulus plan to disburse
THB10.0 billion worth of housing loans through the Government Housing Bank of Thailand for people with low-
incomes and those whose mortgage applications with other financial institutions were previously rejected. In 2016,
the government also approved a financial package to support lower-income people to buy houses. A budget of
THB70.0 billion is being provided in the form of soft loans to developers of Pracha Rath housing projects as pre-
finance loans, and to home buyers as post-finance loans. Both the government stimulus packages almost offset the
decline in new constructions growth in the housing sector despite increases in the average housing price index.
Greater government incentives in the housing market bode well for the decorative and non-decorative paint and
coating market.
Average Housing Price Index, 2011-201630
Source: Bank of Thailand and Frost & Sullivan Analysis, compiled by Frost & Sullivan Note: All figures are rounded.
The rest of the page is intentionally left blank
30 Combined index for Single detached house, Town house and Condominium
110.1 115.2 123.0
133.0 139.9 144.9
-23.4%
52.7%
5.8% 0.9%
-7.0% -0.6%
-30.0%
-20.0%
-10.0%
0.0%
10.0%
20.0%
30.0%
40.0%
50.0%
60.0%
0.0
20.0
40.0
60.0
80.0
100.0
120.0
140.0
160.0
180.0
200.0
2011 2012 2013 2014 2015 2016
Yea
r o
n Y
ea
r g
ro
wth
in
New
Ho
usi
ng
(p
ercen
tag
e)
Ho
usi
ng
Pric
e I
nd
ex, (2
01
0 =
10
0)
Average Housing Price Index Growth in New Housing
Onset of floods
Housing growth
after Government
Stimulus package

37
Rise in retail spending
Robust retail spending continues to spur demand for textiles, consumer durables, and food and beverages, to name a
few. The ongoing demand and construction of new retail spaces that require extensive decoration are likely to result
in a greater need for decorative paints and coatings. The retail sales index for Thailand saw a significant growth
from 185.6 in 2011 to 220.8 in 2012 driven by increased household consumption31
and rising consumer
confidence32
. This steep increase was a major driving factor for growth in the retail market for decorative and non-
decorative paints and coatings, especially wood coatings. The retail sales index dropped to 206.9 in 2014, while
increasing marginally to 207.7 in 2015 before bouncing back to 216.8 in November 2016 driven by consumer
optimism in the economy. The bright outlook for retail spending, in turn, is set to boost sales for both decorative and
non-decorative paints and coatings over the forecast period
Retail Sales Index, Thailand, 2011-2016 (November)
Source: Bank of Thailand and Frost & Sullivan Analysis, Compiled by Frost & Sullivan Note: Note: All figures are rounded. Base year for the index is 2002
Growth in purchasing power
As the purchasing power of people increases, they are likely to make more long-term investments rather than
spending on consumable and perishable goods. Total personal disposable incomes in Thailand grew from
THB6,339.9 billion in 2011 to THB7,579.4 billion in 2016 at a CAGR of 3.6%. It is forecast to increase at an even
higher CAGR of approximately 5.7% between 2016 and 2020 reaching approximately THB9,494.7 billion by
202033
.
Higher disposable incomes and increased purchasing power of the population is likely to fuel long-term investments
in real-estate and also drive repainting demand that was erstwhile deferred. Almost 75%-80.0% of paint and coating
sales across key segments are from repainting activities resulting in it being a key driver for this industry in the
forecast period.
While the retail decorative segment is likely to be driven by repainting of walls and interiors, the interior wood
furnishing segment that appeals to the upper-middle class of the society is likely to drive consumption of enamel
polish and lacquer to maintain the shine and to enhance the longevity of wood products.
31 https://www.thailand-business-news.com/business/46211-thailands-retail-sector-to-continue-expanding.html 32 Consumer Confidence Index increased from 22.3 in 2011 to 290 in 2012, Bureau of Trade and Economic Indices, Thailand 33 The Economist Intelligence Unit, EIU
185.6
220.8 220.2
206.9 207.1
216.8
160.0
170.0
180.0
190.0
200.0
210.0
220.0
230.0
2011 2012 2013 2014 2015 2016(Nov)
Reta
il S
ale
s In
dex
Increased growth observed in the retail
market for both decorative and non-
decorative paints and coatings
Provided resilience to the paint and
coating market during the period of
declining housing constructions

38
Increased demand for Premium products
The high-income group dominates the customer segment for premium decorative paints and coatings. Sales of this
category of decorative paints and coatings are mainly driven by the construction of high-end condominiums and
villas, and their repainting as well. While growth in the overall construction industry slowed in 2015 and 2016,
Bangkok had a burgeoning luxury condominium market in both years owing to the fact they are more affordable
than that of similar residences in other major ASEAN cities such as Singapore and Kuala Lumpur, offering higher
potential for capital appreciation. Average prices for high-end condominiums in Thailand are range bound between
USD3,000.0-USD5,400.0 per square meter34
, whereas prices of high-end condominiums in Kuala Lumpur generally
are priced at approximately USD4,900.0 per square meter35
and could be as high as USD10,000.0 in Singapore36
. In
2016, more than 3,500 high-end condominium units were constructed in Bangkok and its surrounding provinces
with approximately 70.0%-80.0% sold before their launch. The high-end condominiums generally use the best raw
materials from around the world for construction, interior design, and furniture. Growing demand for high-end,
luxury residences are expected to boost demand for premium decorative paints and coatings, used in the painting of
interior and exterior walls, and for non-decorative paints and coatings, which can be used for structural and furniture
protection purposes.
Tourism
The tourism industry in Thailand saw 8.4% growth in tourist arrivals from approximately 29.9 million international
visitors in 2015 to approximately 32.4 million in 2016. Revenues from tourism also increased by approximately
11.7% between 2015 and 2016, growing from THB1.5 trillion in 2015 to THB1.6 trillion in 2016. Higher tourism
spends are expected to boost growth in the hospitality sector, spurring the development of hotels. This in turn could
propel demand in the paint and coating industry, especially for non-decorative wood coatings since a large number
of hotels in Thailand use wooden furniture as well as natural wood and logwood products in their building
structures.
Renovation of Wooden Furniture and use of Fiber Cement
The increasing use of fiber cement in constructions, as a substitute for wood, mainly due to its strength, durability
and low cost37
, is pushing up demand for non-decorative emulsion wood coatings. Greater use of wooden floors in
apartments is also contributing to growth in non-decorative wood coating sales. The wooden furniture industry also
consumes non-decorative wood coatings for furniture manufacturing and refurbishment purposes. Non-decorative
wood coating used in wooden furniture repair is approximately two times that of non-decorative wood coating used
in furniture manufacturing. Domestic wooden furniture consumption in Thailand has declined in the past few years
(2014-2016), resulting in consumer preference for refurbishment over new purchases. This decrease in domestic
furniture sales is expected to result in shorter refurbishment cycles for wooden furniture over a longer period. Since
non-decorative wood coating consumption for refurbishment is twice that of new furniture manufacturing, shorter
repainting cycles are likely to add to the sales of non-decorative wood coatings.
34 https://whatsonsukhumvit.com/the-bangkok-condo-market-in-2016-its-all-about-luxury-and-foreign-buyers/ 35 http://www.thestar.com.my/business/business-news/2016/08/09/kl-high-end-condominium-market-lacklustre-report/ 36 http://www.todayonline.com/business/are-we-wrong-about-singapores-housing-market 37 The material cost for fiber cement is only less than 5 times of natural wood.

39
Strong economic activity and jobs growth
Overall economic growth is driven by multiple factors such as investments (both public and private), trade (both
foreign and domestic) and expenditure (both individual and government). The heightened economic activity also
leads to greater job opportunities and higher incomes. Total personal disposable incomes in Thailand grew from
THB6,339.9 billion in 2011 to THB7,579.4 billion in 2016 at a CAGR of 3.6%. It is forecast to increase at an even
higher CAGR of approximately 5.7% between 2016 and 2020 reaching approximately THB9,494.7 billion by 2020.
Increased employment opportunities stimulate demand for houses and increase the probability of people shifting
their spending toward premium products in general. The unemployment rate in Thailand has sharply decreased in
the past 16 years, falling from 2.4% in 2000 to 0.9% in 201438
. The latest labor force survey (2016) conducted by
the National Statistics Office Thailand, estimates an unemployment rate of only 0.7%39
. As unemployment in
Thailand continues its downward trend, more people are likely to opt for new houses and premium decorative and
non-decorative paints and coatings. This is expected to boost sales in the paint and coating industry both in terms of
volume and value during the forecast period.
Increased spending on infrastructure
Government efforts to improve and develop public infrastructure is one of the major market creators for the paint
and coating industry. Higher spending on infrastructure is expected to generate demand for both decorative and non-
decorative paints and coatings which contribute to the aesthetic and functional appeal, respectively, of public
infrastructure. The retail market for paints and coatings is also likely to benefit from this as many project owners and
contractors purchase paint and coating products through retail dealers. The government of Thailand plans to invest
THB1,411.6 billion between 2017 and 2022 towards 20 large infrastructure projects, mostly transport related,
including railways, airports, marine logistics, and air freight. As of March 2017, only 1.0% of the total amount had
been spent. The remaining 99.0% of the investment, an amount of THB1,397.5 billion expenditure towards
infrastructure development, is likely to present lucrative opportunities for the paint and coating industry in Thailand
over the forecast period. The Infrastructure Development Master Plan 2015-2022 states that investments are likely to
be sourced mostly from SOEs40
(73.0%) with almost negligible financing coming from Public Private Partnerships
(PPPs)41
.
FDI inflows and rapid industrialization
FDI inflows into the country benefit the development of primary, manufacturing and services sectors, stimulating
the need for non-decorative paints and coatings. This in turn increases demand for non-decorative paints and
coatings in the retail market since project owners and contractors in Thailand buy paint and coating products from
both retail dealers and manufacturers. In the first half of 2016, the Thailand Board of Investment reported
investments in 853 projects worth a total of USD9.2 billion spanning areas including Automotive (25 projects,
USD979.0 million), Electrical and Electronics (39 projects, USD685.0 million), Petrochemicals (28 projects,
USD292.0 million) and Agro-processing (31 projects, USD250.0 million). Of the 853 projects, 510 had foreign
investment, amounting to a total of USD3.8 billion. FDI inflows from Japan were highest, amounting to USD779.0
million for 151 projects, followed by China, with investments amounting to USD617.0 million for 55 projects.
Many investors are also actively investing in Special Economic Zones (SEZs) being developed in the five provinces
of Tak, Mukdahan, Sa Kaeo, Trat, and Song Kha. Greater spending in these zones that require the construction of
38 World Bank, based on International Labor Organization (ILO) estimates 39 National Statistics Office, Thailand 40 State Owned Enterprises 41 Bank of Thailand, National Economic and Social Development Board of Thailand (NESDB)

40
office spaces and factories is likely to drive demand in the non-decorative paint and coating market. An increase in
the number of small and medium scale factories which use non-decorative protective paints and coatings for
maintenance of machines, protecting construction materials made of steel, strengthening of factory structures,
among many other such activities, is likely to drive the consumption of metal protective coatings in the country.
Demand for non-decorative waterproofing and wood coatings are likely to be driven by the growth in the number of
office buildings which require adequate protection from moisture and dampness (waterproofing) and wooden
furniture and furnishings (wood coatings) which is a key end-use segment for industrial lacquer.
Membership in AEC
The ASEAN Economic Community (AEC) implemented on December 31, 2015, proposes the economic integration
of ASEAN countries by facilitating a single market and production base, equitable economic development,
integration in the globalized economy and formation of a competitive economic region42
. The major principles of
AEC are the free flow of goods, services, investments and skilled labor. Thailand‟s membership in the AEC is
beneficial to the paint and coating industry, primarily in aiding access to capital and labor from different ASEAN
countries with an easing of rules, regulations and tariffs. For instance, a reduction in import/export duties is expected
to help the paint and coating industry in Thailand to reassess their future investment locations (in terms of optimized
production costs). The free flow of goods is likely to open up new markets for the existing production facilities of
Thai paint and coating manufacturers within the ASEAN. Moreover, integration of ASEAN‟s trade with the global
economy is expected to boost competition among paint and coating companies across the value chain, making it
easier for paint and coating manufacturers from Thailand to procure raw materials as well as provide them with
access to skilled workforce globally.
Growth in Modern Trade Distribution
Paint and coating manufacturers in Thailand have predominantly operated through traditional sales channels
(through retail dealers) driven by a strong retailer dealer-producer/manufacturer relationship. Sometimes, mostly
during new product launches, this also allowed them to gain exclusivity (promotion of own paint and coating brand
only). However, with the rise of modern trade, paint and coating manufacturers are required to make additional
investments in tinting machines and deployment of personal consultants (PCs) with the modern trade distributors.
Frost & Sullivan opines that although the rise of modern trade channel is likely to result in a downward pressure on
margins in the short-term, this is also expected to result in greater retail consumer awareness and participation in the
painting process. This in-turn is likely to promote sales through the DIY channel as more consumers resort to
visiting the modern trade outlet and make personal choices in consultation with the painter who accompanies them.
Going forward, in the forecast period, a rise in DIY channel sales is gradually expected to offset the margin
pressures and is likely to augur well for paint and coating manufacturers.
The rest of the page is intentionally left blank
42 https://aseanup.com/benefits-asean-economic-community-aec/

41
2.1.7. Barriers to Entry
Brand Awareness
Existing leading paint and coating manufacturers have strong brand-recall status in the minds of the retail consumer
by way of their proven track record and established market presence. Traditional retailers also prefer to stock
products of established manufacturers as it gives them better margins by way of a relatively shorter shelf-time in
comparison to lesser known brands. Therefore, in order to create awareness and promote the brand name, a new
entrant has to engage in significant promotional activities, and also overcome retail dealer-resistance in stocking
their products which is in-turn likely to result in lower bargaining power. A combination of the aforementioned
factors is likely to put a downward pressure on margins serving as a key barrier to entry for a new entrant into the
paint and coating industry.
Long-standing and close supplier relationships
In an industry where raw materials comprise approximately 70.0%-80.0% of the costs of goods sold, a continuous
supply of resources is a primary driver of long-term growth. This is ensured by way of fostering long-standing and
close supplier relationships, a key advantage that is available to the existing large paint and coating manufacturers.
Additionally, these existing manufacturers also have pricing contracts driven by their history of association with the
participants in the value chain. For a new entrant, the absence of a robust network of suppliers and logistics service
providers, and challenges in setting up commercially viable and attractive terms with domestic suppliers are likely to
be time and money intensive serving as a significant barrier to entry in the paint and coating industry.
Ability to innovate and respond to consumer trends
Established paint and manufacturer companies by way of their expansive retail dealer reach are in touch with the
„pulse of the market‟ enabling them to innovate and make changes to rapidly evolving consumer demands. Rapid
innovation demands a strong research and development team to translate customer requirements into new
sustainable products. For example, an emerging trend in the Thailand paint and coating industry is the increasing
awareness of „environment friendly‟ paints and coatings especially in the premium segment. Leading established
companies are better equipped to cater to this segment of the market as against a new entrant who is likely to face
challenges in keeping pace with rapid changes and evolving consumer preferences.
Creating a robust distribution network
Thailand has a relatively low population density of 134 persons per square kilometer compared to regional
neighbors such as Vietnam (308) and Indonesia (146) 43
necessitating the importance of a robust distribution
network to cater to the wide-spread population. Existing large paint and coating manufacturers already have a
strong distribution network by virtue of their long-standing presence in the industry generating almost 75.0% to
80.0% sales from their retail dealer distribution channel. New entrants are likely to face significant challenges in
establishing a strong distribution network also impacted by lack of local market knowledge; cross-cultural issues and
many other such factors serving as strong barriers to entry into the Thai paint and coating industry.
43 The United Nations

42
Skilled workforce required for large-scale manufacturing
Hiring and retaining qualified workers as well as enhancing the skills of the workforce are essential requirements for
any large-scale manufacturer. Despite the labor cost index in Thailand falling from 103.9 in Q3 2015 to 102.67 in
Q3 2016, there have been changes to the minimum wages in various parts of the country. For example, the Samut
Prakan province introduced a new minimum wage effective January 2017, increasing the daily labor wages from
THB300.0 to THB310.0. The shortage of qualified local talent is also resulting in an influx of skilled foreign labor
into the country to meet the current demand. The ILO (International Labor Organization) anticipates a decline in the
working-age population (those aged from 15-64) until 2050, creating further shortage.The domestic labor shortage is
expected to affect production plans and costs in the paint and coating industry in the forecast period.
2.1.8. Key Regulations Governing the Industry
Restriction of lead and other heavy metal usage in paints
Thailand has adopted mandatory lead paint regulations, under the Industrial Products Standards Act, with effect
from January 2017. The country has issued compulsory legislation that seeks to control the amount of heavy metals
in enamel-based paints and coatings used for waterproofing, rot-proofing, and decorative and construction purposes.
Paints and coatings produced and sold in Thailand are now required to have no more than 0.01% of mercury, lead,
and cadmium, and no more than 0.1% hexavalent chromium in their dry weights. In addition, alkyd enamel paints
and coatings that are manufactured and sold in Thailand must bear warning labels informing about their potentials
dangers. Thailand is the fourth country during 2014-2016 to adopt the policy as part of the International POPs
(Persistent Organic Pollutants) Elimination Network‟s (IPEN) Global Lead Paint Elimination44
. Although the
restriction may add to the costs of paint and coating products, complying with environmental regulations is likely to
boost consumer trust as environmental activism keeps building momentum.
Industrial Products Standards Act
The Industrial Products Standards Act, B.E. 2511 (1968 and any amendments thereof) requires certain products to
bear specifications as established by the Minister of Industry and proposed by the Industrial Products Standards
Council. The stipulated standards may include dimensions, manufacturing procedures used, methods of experiment
and analysis, raw materials used, methods of packing, and testing mechanisms. The Industrial Products Standards
Act also requires various industries to display proper specifications of their products as labels on the product itself.
Certification marks can only be shown on the product upon thorough inspection by authorized officials or licenses
inspectors. The act applies to imported goods as well. The inspections include product inspection and quality control
systems inspection which apply to almost all stages of the paint and coating product‟s lifecycle since it involves a
long production chain comprising various chemicals as raw materials and industrial processes that require the use of
different types of heavy machinery.
44 http://www.ipen.org/news/thailand-institutes-lead-paint-regulation

43
Factory Acts
The Factory Act, B.E. 2535 (1992 and any amendments thereof) requires operators from various sectors using
machinery and manpower to notify or request for permission depending on the quantities of their production
enablers. Generally, factories with more than 20 HP of machinery or more than 20 workers but with not more than
50 HP of machinery or not more than 50 workers are expected to notify officials from the Ministry of Industry
before commencing operations. While, in general, factories having more than 50 of either parameters are required to
apply and receive written permission before starting operations. As the paint and coating industry relies largely on
heavy machinery and manpower, paint and coating manufacturers are expected to comply with the aforementioned
bureaucratic protocols before a plant becomes operational.
Certifications for paint and coating manufacturing procedures and their side effects
The paint and coating industry uses hazardous chemicals such as raw materials, intermediate products, and heavy
machinery in the production chain, posing risks to the environment and the health and safety of employees. The
production, procurement and import or export of certain hazardous chemicals requires permission under the
Hazardous Substances Act, B.E. 2535 (1992 and any amendments thereof). To ensure both environmental and health
and safety levels are not compromised, the industry participants generally try to obtain certain production
certifications reflecting overall implementation of such measures. ISO 14001 (certification for environment
management systems), ISO 50001 (certification for energy management systems), OHSAS 18001 (certification for
occupational health and safety), ISO 17025 (requirements for competence of testing and calibration laboratories) and
Certification for Carbon Footprint for Organization are several such certifications the paint and coating industry in
Thailand chooses to comply with to meet quality standards.
The rest of the page is intentionally left blank

44
2.1.9. Market Sizing and Forecasts
The retail market for decorative paints and coatings in Thailand recorded a CAGR of approximately 6.9% between
2011 and 2016, from approximately THB13.7 billion in 2011 to approximately THB19.2 billion in 2016. Extensive
growth was observed between 2011 and 2012 owing to the stimulus package provided by the Thai Government for
low-income housing projects. However, growth rates in the later years gradually decreased as a result of political
uncertainties leading to a slowdown in the overall economy, decline in the number of new housing constructions and
decrease in issuing permission for land development (number of fresh permissions for land development nationwide
declined by approximately 27.4%, falling from 120,657 units in 2011 to 87,570 units in 201645
), among many
others.
Despite a slowdown resulting from the factors discussed above, growth in sales of decorative paints and coatings
remained positive as the imminent decline was offset by the demand generated from repainting activities. The 2015
government stimulus package for low cost housings and higher revenues generated from sales of premium
decorative paints and coatings mainly driven by improvement in spending capabilities as evinced by rising
disposable incomes and greater awareness of quality. The future for decorative paint and coating market is expected
to be promising as it is likely to register relatively strong growth rates on the backdrop of changing political
environment (possible withdrawal of military rule and shift to a civilian run government), increased repainting
activities resulting from a continuously increasing housing stock, shorter repainting cycles, greater shift in consumer
preferences towards premium decorative paint and coating products and existing government subsidies towards the
housing sector, among many others. Driven by the various factors as discussed, the retail market for decorative
paints and coatings is expected to grow at a CAGR of 5.1%46
between 2016 and 2021, increasing from THB19.2
billion in 2016 to THB24.6 billion in 2021.
Retail Market Size of the Decorative Paints and Coatings in Thailand, THB, 2011-2021F
Source: Primary interviews with industry participants, desktop research and forecast by Frost & Sullivan Note: All figures are rounded. Base year is 2016.
The retail market for non-decorative paints and coatings in Thailand is comprised of three segments, non-decorative
wood coatings, non-decorative waterproofing and non-decorative protective coatings (comprising non-decorative
concrete protective coatings and non-decorative metal protective coatings). Between 2011 and 2016, the total retail
market for non-decorative paints and coatings registered a CAGR of approximately 5.9%, growing from
THB4,780.0 million in 2011 to THB6,376.9 million in 2016. The market is expected to grow at a higher CAGR of
6.8% between 2016 and 2021, growing from THB6,376.9 million in 2016 to THB8,852.7 million in 2021.
45 Bank of Thailand, https://www.bot.or.th/English/Statistics/EconomicAndFinancial/Pages/StatPropertyIndicators.aspx 46 Forecast CAGR of 5.1% is slightly less than the historical CAGR of 6.9% mainly because of the significant slump the market witnessed in 2011 and the pace of rebound historically.
13.7 15.6 16.7 17.8 18.7 19.2 20.1 21.0 22.1 23.3 24.6
0.0
5.0
10.0
15.0
20.0
25.0
30.0
2011 2012 2013 2014 2015 2016 2017F 2018F 2019F 2020F 2021F
Deco
ra
tive p
ain
t a
nd
co
ati
ng
ma
rk
et
size (
TH
B b
illi
on
s)

45
Among the three segments, highest growth was observed in the retail market for non-decorative protective coatings
mainly due to its demand in both construction and industrial activities. Sales in this segment grew at a CAGR of
8.4% between 2011 and 2016, growing from THB987.8 million in 2011 to THB1,475.1 million in 2016. Growth
between 2011 and 2013 was primarily driven by increased number of housing constructions. However, post-2013,
growth rates declined gradually between 2014 and 2016 due to a slowdown in overall economic activity. Going
forward, the market is expected to grow at a CAGR of 8.8%, growing from THB1,475.1 million in 2016 to
THB2,249.8 million in 2021. Increased FDI inflow, growth in the number of medium and small scale industries,
government spending on transport related infrastructures, increased consumer awareness about protective coatings
as well as house repainting and renovating activities are expected to drive growth in the forecast period.
The retail market for non-decorative wood coatings in Thailand increased at a CAGR of 5.3%, growing from
THB3,010.6 million in 2011 to THB3,901.6 million in 2016. The YOY growth rate between 2011 and 2012 was as
high as 10.7% mainly due to a surge in retail spending. However, the growth rates declined gradually between 2013
and 2016 owing to a decline in domestic furniture consumption as well as reduced overall economic activity
nationwide (also reflected in a dip in the retail sales index). However, the retail market for non-decorative wood
coatings is expected to grow at a CAGR of 6.1% between 2016 and 2021, growing from THB3,901.6 million in
2016 to THB5,244.3 million in 2021. Increased growth in the retail market for non-decorative wood coatings are
likely to be driven by increased renovation and repainting of wooden furniture, shorter renovation cycles, use of
cement fiber, growth in tourism and demand for high-end, luxury condominiums.
The retail non-decorative waterproofing market in Thailand grew at a CAGR of 5.1% between 2011 and 2016,
growing from THB781.7 million in 2011 to THB1,000.1 million in 2016. A slightly lower growth in the retail
market for non-decorative waterproofing was due to its negligible connection to the wooden furniture industry. Also,
due to its links with the construction sector and repainting, the market growth declined gradually between 2012 and
2016. However, Frost & Sullivan expects the retail market for non-decorative waterproofing in Thailand to grow at a
CAGR of 6.3% between 2016 and 2021, growing from THB1,000.1 million in 2016 to THB1,358.6 million in 2021.
Growth in the forecast period is likely to be primarily driven by repainting activities and increased consumer
awareness about housing structure protection. Industrialization due to FDI inflows is also expected to contribute to
the growth in this market.
Retail Market Size of Non-Decorative Paints and Coatings in Thailand, THB, 2011-2021F
Source: Primary interviews with industry participants, desktop research and forecast by Frost & Sullivan Note: All figures are rounded. Base year is 2016.
3,010.6 3,332.7 3,522.6 3,670.6 3,799.1 3,901.6 4,056.2 4,268.0 4,522.6 4,857.8 5,244.3 781.7 820.8 878.2 929.2 971.0 1,000.1 1,049.3 1,102.1 1,165.1
1,253.3 1,358.6
987.8 1,075.7 1,185.4 1,292.1 1,386.4 1,475.1 1,586.5 1,707.6
1,854.8 2,037.0
2,249.8
0.0
2,000.0
4,000.0
6,000.0
8,000.0
10,000.0
2011 2012 2013 2014 2015 2016 2017F 2018F 2019F 2020F 2021F
No
n-D
eco
ra
tive p
ain
t a
nd
co
ati
ng
ma
rk
et
size (
TH
B
mil
lio
ns)
Wood Coatings Waterproofing Protective Coatings

46
Growth Rates of Retail Market for Non-Decorative Paint and Coating segments in Thailand, (THB), 2011-
2021F
CAGR 2011-2016 CAGR 2016-2021F
Wood Coatings 5.3% 6.1%
Waterproofing 5.1% 6.3%
Protective Coatings 8.4% 8.8%
Total 5.9% 6.8%
Source: Primary interviews with industry participants, desktop research and forecast by Frost & Sullivan Note: All figures are rounded. Base year is 2016.
Price Band Analysis
For the purpose of this report, paints and coatings sold in Thailand is defined to comprise three segments based on
their prices. The segments are Premium (paints and coatings approximately priced above THB2,015.1 (USD57.1)
per 5 gallons and Medium to Economy (paints and coatings approximately priced below THB2,015.1 (USD57.1) per
5 gallons.
With increased brand awareness and wider exposure to prevailing paint and coating technologies, affluent customers
are demanding customizations and greater utility value from the paints and coatings used in their residences or office
spaces. Features such as Ultra-violet (UV) protection, washable paints and low odor are gaining prominence when
making a purchase decision. In addition to recommendations from painters on the value-addition provided by the
premium paints and coatings, the manufacturers of these paints and coatings also engage in marketing activities
promoting the unique-selling-proposition (USP) of these categories of paints and coatings. This market is also
driven by an increase in condominium sales which are the typical retail residential end-consumers while the
hospitality industry, comprising resorts, beach-villas, luxury hotels are also drivers of sales in this category.
For several large paint and coating manufacturers in Thailand, sales of the Premium category of paints and coatings
in 2016 were recorded at approximately 34.0%-42.0% of their total sales. The highest proportion of sales was
observed in the Medium to Economy category of paints and coatings amounting to approximately 52.0% -70.0% of
total sales in 2016.

47
2.1.10. Competitive Landscape Analysis
The retail decorative paint and coating market in Thailand was dominated by TOA Paint (Thailand) Public
Company Limited. Other leading companies having a significant presence in this market are the subsidiaries of
larger foreign paint and coating manufacturers such as Beger Co., Ltd, Akzo Nobel (Netherlands), Jotun (Norway)
and Nippon (Japan). A large number of other smaller Thailand based paint and coating manufacturers (both
decorative and non-decorative) such as Thai D.N.T. Paint Co., Ltd, Eason Paint Public Co., Ltd, Sinclair Pant
(Thailand) Co., Ltd, Hartford Paint Co., Ltd occupy rest of market. Most of these companies are inclined towards
industrial paint and coating manufacturing and have less presence in the retail decorative paint and coating market.
The retail non-decorative paint and coating market, on the other hand, has both domestic as well as international
paint and coating manufacturers as market leaders in different categories. Beger Co., Ltd and TOA Paint (Thailand)
Public Company Limited dominated the retail non-decorative wood coatings market in 2016 while Sika (Thailand)
Ltd., a subsidiary of the Swiss based Sika AG, led the retail non-decorative waterproofing market. Jotun, closely
followed by TOA Paint (Thailand) Public Company Limited were the market leaders for the retail non-decorative
protective coatings market in Thailand in 2016. Other large Thailand based companies in the retail non-decorative
paint and coating market are Precision Engineering Co., Ltd also known as Woodtect (for protective wood coating),
and ParexGroup (Thailand) Co., Ltd (for waterproofing).
The rest of the page is intentionally left blank

48
2.1.11. Market Share Estimates and Profiles of Retail Decorative and Retail Non-Decorative Paint
and Coating companies in Thailand
In 2016, TOA Paint (Thailand) Public Company Limited dominated the retail channel of decorative paint and
coating market holding a share of approximately 48.7% of the total market. The other market participants were Akzo
Nobel Paints (Thailand) Limited with a market share of approximately 13.8%, Beger Co., Ltd with a market share of
approximately 13.3%, Jotun Thailand Limited (Jotun), the Thai subsidiary of the Norwegian chemicals company
Jotun Group with a share of approximately 8.1% and Nippon Paints Thailand Co., Ltd. a subsidiary of Japan based
Nippon Group, with a market share of approximately 5.2% in 2016 in Thailand‟s retail market for decorative paints
and coatings.
Estimated Retail Market Share of Decorative Paints and Coatings, (THB), Thailand, 2016
Source: Frost & Sullivan, primary interviews, desktop research and analysis
Note: Since companies' 2016 revenue numbers, including segmental breakdown was not readily available through published
sources ,approximate market shares have been arrived at through a combination of: (i) Interviews with experts which includes current and past employees of leading paint and coating companies, (ii) year-on-year growth trends, company reports and other
presentation materials including but not limited to news articles, press releases, (iii) Frost & Sullivan’s desktop research on
sources including but not limited to databases of industry associations, trade bodies, government agencies etc.
The non-decorative retail wood coating market in Thailand, in 2016, was dominated by Beger Co., Ltd with a
market share of approximately 32.8% closely followed by TOA Paint (Thailand) Public Company Limited with a
market share of approximately 28.2%.
Estimated Retail Market Share of Non-Decorative Wood Coatings, (THB), Thailand, 2016
Source: Frost & Sullivan, primary interviews, desktop research and analysis Note: Since companies' 2016 revenue numbers, including segmental breakdown was not readily available through published
sources ,approximate market shares have been arrived at through a combination of: (i) Interviews with experts which includes
current and past employees of leading paint and coating companies, (ii) year-on-year growth trends, company reports and other presentation materials including but not limited to news articles, press releases, (iii) Frost & Sullivan’s desktop research on
sources including but not limited to databases of industry associations, trade bodies, government agencies etc.
.
48.7%
13.8% 13.3%
8.1%
5.2%
10.9%
TOA Paint (Thailand) Public
Company Limited
Akzo Nobel Paints (Thailand)
Limited
Beger Co., Ltd.
Jotun Thailand Limited
Nippon Paints Thailand Co., Ltd
Others
32.8%
28.2% 39.0%
Beger Co., Ltd.
TOA Paint (Thailand) Public
Company Limited
Others

49
Three major market participants for the Non-decorative retail waterproofing market in Thailand in 2016 were Sika
(Thailand) Ltd. (Sika), TOA Paint (Thailand) Public Company Limited, and ParexGroup (Thailand) Co., Ltd
(Parex). Sika was the market leader with a share of approximately 28.0% followed by TOA Paint (Thailand) Public
Company Limited with a market share of approximately 20.0%. Parex had the third highest market share of
approximately 10.0%.
Estimated Retail Market Share in Non-Decorative Waterproofing, (THB), Thailand, 2016
Source: Primary interviews, desktop research and Frost & Sullivan analysis
Note: Since companies' 2016 revenue numbers, including segmental breakdown was not readily available through published sources
,approximate market shares have been arrived at through a combination of: (i) Interviews with experts which includes current and past employees of leading paint and coating companies, (ii) year-on-year growth trends, company reports and other presentation
materials including but not limited to news articles, press releases, (iii) Frost & Sullivan’s desktop research on sources including but
not limited to databases of industry associations, trade bodies, government agencies etc.
Jotun Thailand Limited and TOA Paint (Thailand) Public Company Limited jointly accounted for over 50.0% of the
market for retail non-decorative protective coatings in Thailand in 2016. Jotun Thailand Limited was marginally
ahead of TOA Paint (Thailand) Public Company Limited with approximately 30.0% market share while TOA Paint
(Thailand) Public Company Limited was a close second at approximately 28.0% market share.
Estimated Retail Market Share of Non-Decorative Protective (Concrete and Metal) Coatings, (THB),
Thailand, 2016
Source: Frost & Sullivan, primary interviews, desktop research and analysis
Note: Since companies' 2016 revenue numbers, including segmental breakdown was not readily available through published sources
,approximate market shares have been arrived at through a combination of: (i) Interviews with experts which includes current and
past employees of leading paint and coating companies, (ii) year-on-year growth trends, company reports and other presentation materials including but not limited to news articles, press releases, (iii) Frost & Sullivan’s desktop research on sources including but
not limited to databases of industry associations, trade bodies, government agencies etc.
28.0%
20.0%
10.0%
42.0%
Sika (Thailand) Ltd.
TOA Paint (Thailand) Public
Company Limited
ParexGroup (Thailand) Co., Ltd.
Others
30.0%
28.0% 42.0% Jotun Thailand Limited
TOA Paint (Thailand) Public Company
Limited
Others

50
Profiles of Major Players
TOA Paint (Thailand) Public Company Limited
In 2016, TOA Paint (Thailand) Public Company Limited held the largest market share in the Thai retail decorative
paint and coating market. Frost & Sullivan estimates that TOA Paint (Thailand) Public Company Limited held a
share of approximately 48.7% of the retail market for decorative paints and coatings. In 2016, the company also held
market shares of approximately 28.2%, 20.0% and 28.0% in the retail markets for non-decorative wood coatings,
non-decorative waterproofing and non-decorative protective coatings, respectively. TOA Paint (Thailand) Public
Company Limited started off as a small family business importing paints and coatings from Japan to Thailand in
1964. The business set up its first production plant in 1972 in Samrong and was incorporated as a Company in 1977.
Currently, its main plant for emulsion and enamel paint and coating production is in Bangna, alongside 6 other
production plants in Malaysia, Vietnam, Myanmar and Laos. Popular TOA Paint (Thailand) Public Company
Limited‟s products include Supershield, Duraclean and Extrashield. In 2016, decorative paints and coatings
accounted for 69.5% of the Company47
‟s sales while non-decorative paints and coatings accounted for
approximately 27.4% of total sales. The former comprises 39 brands while the latter has 49 brands in the category.
Majority of the Company‟s revenues (approximately 76.0%) come through retail sales channels, 13.4% are from
modern trade distributors with the rest coming from projects and exports. TOA Paint (Thailand) Public Company
Limited has a presence in 77 provinces, 780 districts, and at more than 5,300 retail dealers, out of which more than
4,000 have TOA Color World tinting machines installed. Apart from holding the largest market share in Thailand,
the Company also has a 13.0% share of the AEC paint and coating market with production facilities in Vietnam,
Laos, Cambodia, Myanmar, and Indonesia.
Akzo Nobel Paints (Thailand) Ltd
Akzo Nobel Paints (Thailand) Ltd manufactures specialty chemicals, decorative paints and coatings, and
performance coatings. The company had a market share of 13.8% in the retail market for decorative paints and
coatings in Thailand in 2016. Formerly known as ICI Paints (Thailand) Ltd, the company changed its name to Akzo
Nobel Paints (Thailand) Ltd in January 2009. Akzo Nobel is based in Pakkred Nonthaburi, Thailand and a
subsidiary of Akzo Nobel NV, a multinational paint and coating company. To expand its capacity further, the
company invested 30.0 million Euros in 2015-2016 to set up a new manufacturing facility in Chonburi with a
capacity of producing 45,000 tons of paints and coatings per year.
Beger Co., Ltd
In 2016, Beger Co., Ltd. held a market share of 13.3% in the Thai retail decorative paint and coating market. This
was significantly lower than its competitor, TOA Paint (Thailand) Public Company Limited. The company,
established in 1961 in Thailand, specializes in producing decorative paints and wood coatings, available through
more than 4,000 dealers across the country. Among these dealers, there are more than 1,500 Beger Color Design
Centers throughout Thailand offering high-technology tinting machines able to produce more than 10,000 shades.
Beger uses modern systems to control the paint and coating production process and has a capacity of 40.0-50.0
million liters per year. It has also partnered with the Siam Cement Group to boost its sales channels. Approximately
four-fifths of Beger‟s customers are from the retail sector, 10.0% are in projects, while the rest are international
customers. The company is expected to profit from the AEC single market operations as it has a significant
47„The Company‟ refers to TOA Paint (Thailand) Public Company Limited

51
international customer base. Popular Beger brands sold in Thailand include Beger Shield Diamond, Platinum, and
Beger Super Deck.
Jotun Thailand Ltd
Based in Amata Nakorn Industrial Estate in Eastern Thailand, Jotun Thailand Ltd, a multinational paint and coating
company, held a market share of approximately 8.1% in retail decorative paint and coating and approximately
30.0% in retail non-decorative protective coatings industry Thailand in 2016. The company started its operations in
Thailand in 1968 and produces four different categories of paints – marine coatings (to prevent corrosion in vessels),
protective coatings (to protect steel and decoration of concrete) and interior and exterior decorative paints and
coatings. Jotun employs around 400 people and produces approximately 22.0 million liters of liquid based paints
and coatings and close to 9,000.0 tons of powdered coatings. The company has a strong presence in Singapore,
Malaysia and Indonesia and is looking to establish a long-term presence in Thailand by building a warehouse in
201748
.
Sika (Thailand) Ltd.
Sika (Thailand) Ltd., found in 1989, is based in Chonburi. The company manufactures and supplies paint and
coating products (predominantly non-decorative paints and coatings) to the construction, marine and automotive
industries. The company was the market leader in retail waterproofing in Thailand with approximately 28.0% share
in 2016. Sika also produces non-decorative metal protective coatings, construction chemicals, adhesives and sealant
products. The company has around 300 employees and two factories in Thailand. The one in Chonburi (total area of
17,000.0 square meters) has a 2,500 square meter production process area, a similar sized warehouse area and is
used for manufacturing non-decorative paints and coatings. The other factory in Saraburi produces mortars and other
cement based products.
The rest of the page is intentionally left blank
48 https://www.thebusinessyear.com/thailand-2017/painting-by-numbers/vip-interview

52
2.1.12. Industry Prospects & Outlook
Although Thailand experienced significant economic and political turmoil in the early part of this decade, the
country is on a growth trajectory since 2016. The key factors driving this growth include a general optimism among
Thais as evinced by increasing consumer confidence index against the backdrop of positive macro-economic factors
such as an increasing GDP growth rate, growth in disposable income per capita, rise in private consumption and
public expenditure, stable inflation rates and rising FDI reinforcing foreign investor confidence in the country‟s
growth story. The construction industry, a key indicator of economic progress is also reaping the benefits resulting
from the aforementioned macro-economic factors. Additionally, a combination of socio-economic factors such as an
increase in nuclear households driven by a reduction in size of the family, rising urban households due to
urbanization rates are promoting the growth of residential houses in the country.
The paint and coating industry is a direct beneficiary of the growth in construction and improvements in macro-
economic indicators in the country. The retail paint and coating industry which is a significant channel of sales for
the manufacturers is likely to see increased off-take as consumers become more aware of the choices offered to
them. This segment is also expected to see moderate to high-growth in the forecast period, driven by an increased
demand for new housing and repainting, government incentives and rising retail spending to name a few. Increasing
disposable income is also expected to result in greater discretionary spend including a preference for premium paint
and coating products which is likely to open up newer markets for existing paint and coating manufacturers.
Large manufacturers with expansive retail dealer reach are likely to be better equipped to capture changing
consumer preferences and translate them into product features thereby enabling them to stay current in changing
times. This in-turn will give them an edge over other manufacturers who may not have the ability to innovate and
adapt. Additionally, growth in modern trade channel is likely to result in a greater DIY market as consumers have
access to a wider variety of choices giving them greater control over decision making which was erstwhile the forte
of the painters.
The non-decorative retail segment, in particular, is likely to be benefitted by a continued increase in tourism
resulting in new demand and constant interior-upkeeps by the hospitality sector in the country. Repainting activities
which is a key driver to the paint and coating sales is likely to continue to account for over three-fourths of the paint
and coating industry in the forecast period. Renovation of buildings, both residential and commercial, repainting of
vehicles using premium paints as a reflection of status symbol and maintenance activities in small factories are all
expected to be key contributors of repainting demand in the forecast period driving the Thailand retail paint and
coating industry back on its growth trajectory.
The rest of the page is intentionally left blank

53
3. THE PAINT AND COATING INDUSTRY IN VIETNAM
3.1.1. Overview of the Paint and Coating industry in Vietnam
Following a plethora of political and economic reforms in 1986, economic growth and development have catapulted
the country from being one of the poorest in the world to a thriving middle-income economy49
. The country‟s GDP
increased consistently at a CAGR of more than 6.0% between 1990 and 2015. Going forward, Vietnam‟s GDP is
expected to register a CAGR of approximately 10.1% in during the forecast period of 2016 to 2021, from
approximately VND4,554.9 trillion in 2016 to approximately VND7,361.2 trillion by 2021. Population growth in
Vietnam is likely to record a CAGR of approximately 1.0% between 2016 and 2021. This is likely to result in a
higher GDP per capita of approximately VND75.7 million by 2021 compared to its estimated value of VND49.2
million in 2016, boosting the standard of living for the population.
Nominal GDP and Nominal GDP Growth Rates, (VND), Vietnam, 2011-2021F
Source: World Economic Outlook Report, October 2016, compiled by Frost & Sullivan
Note: All figures are rounded. Base year is 2015.
The rest of the page is intentionally left blank
49 Middle-income economies are those with a GNI per capita between USD1,026.0 and USD12,475.0, World Bank
2,7
80
3,2
45
3,5
84
3,9
38
4,1
93
4,5
55
4,9
89
5,4
87
6,0
50
6,6
69
7,3
61
28.8%
16.7% 10.4% 9.9%
6.5%
8.6% 9.5% 10.0% 10.3% 10.2% 10.4%
0.0%
5.0%
10.0%
15.0%
20.0%
25.0%
30.0%
0
1,000
2,000
3,000
4,000
5,000
6,000
7,000
8,000
2011 2012 2013 2014 2015 2016E 2017F 2018F 2019F 2020F 2021F
No
min
al
GD
P g
ro
wth
(%
)
No
min
al
GD
P
(VN
D t
ril
ion
)
Nominal GDP Nominal GDP growth
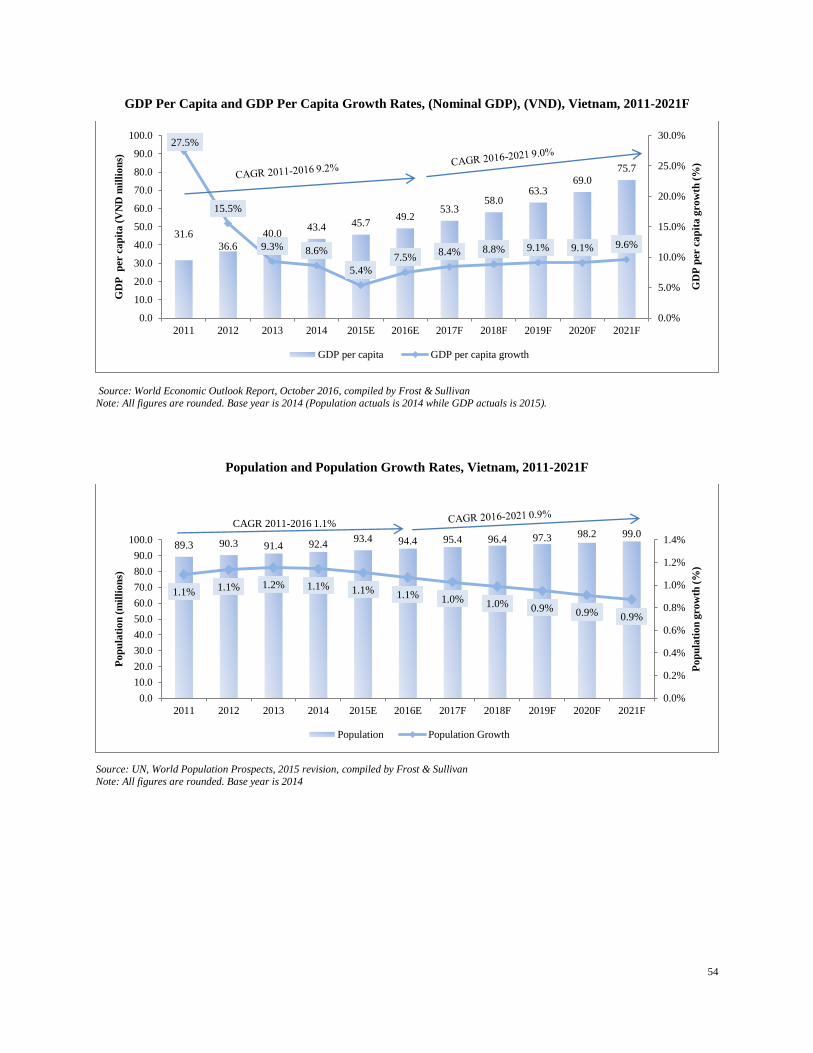
54
GDP Per Capita and GDP Per Capita Growth Rates, (Nominal GDP), (VND), Vietnam, 2011-2021F
Source: World Economic Outlook Report, October 2016, compiled by Frost & Sullivan
Note: All figures are rounded. Base year is 2014 (Population actuals is 2014 while GDP actuals is 2015).
Population and Population Growth Rates, Vietnam, 2011-2021F
Source: UN, World Population Prospects, 2015 revision, compiled by Frost & Sullivan
Note: All figures are rounded. Base year is 2014
31.6
36.6
40.0 43.4 45.7
49.2 53.3
58.0 63.3
69.0 75.7
27.5%
15.5%
9.3% 8.6%
5.4%
7.5% 8.4% 8.8% 9.1% 9.1% 9.6%
0.0%
5.0%
10.0%
15.0%
20.0%
25.0%
30.0%
0.0
10.0
20.0
30.0
40.0
50.0
60.0
70.0
80.0
90.0
100.0
2011 2012 2013 2014 2015E 2016E 2017F 2018F 2019F 2020F 2021F
GD
P p
er c
ap
ita
gro
wth
(%
)
GD
P p
er c
ap
ita
(V
ND
mil
lio
ns)
GDP per capita GDP per capita growth
89.3 90.3 91.4 92.4 93.4 94.4 95.4 96.4 97.3 98.2 99.0
1.1% 1.1% 1.2% 1.1% 1.1% 1.1% 1.0% 1.0% 0.9% 0.9% 0.9%
0.0%
0.2%
0.4%
0.6%
0.8%
1.0%
1.2%
1.4%
0.0
10.0
20.0
30.0
40.0
50.0
60.0
70.0
80.0
90.0
100.0
2011 2012 2013 2014 2015E 2016E 2017F 2018F 2019F 2020F 2021F
Po
pu
lati
on
gro
wth
(%
)
Po
pu
lati
on
(m
illi
on
s)
Population Population Growth
CAGR 2011-2016 1.1%

55
The country‟s success lies in the successful implementation of reforms and long-term planning. Many social and
economic indicators in Vietnam such as maternal mortality rates, access to basic education and infrastructure,
availability of electricity, access to clean water, and sanitation have shown substantial improvements in the past
three decades from 1986 to 2016. Over this period, Vietnam has achieved many of its Millennium Development
Goals ahead of time. Economic integration with regional and global participants has also boosted trade and
investment in the country. The government is currently following the Socio-Economic Development Strategy 2011-
2020 which focuses on broad structural reforms such as infrastructural development, improvisation of market
institutions and human resource development for modern industries, and innovation.
The fast-developing economy in Vietnam is a key driver of the paint and coating industry in the country. The
purchasing power of the Vietnamese population continues to expand with rising income levels. Consumer spending
in the retail industry is stimulating demand for various kinds of goods and services that have direct or indirect
linkages with the paint and coating industry. Construction and housing sectors, for example, are the primary buyers
of paints and coatings, especially decorative coatings. Growing domestic demand and export surplus in the furniture
industry also support the growth of the paint and coating industry. Public infrastructure and shipbuilding are other
sectors experiencing significant growth with the former securing loans and grants from international institutions
such as the World Bank, Asian Development Bank, and foreign governments, and the latter gaining support from the
government and foreign investors
Decorative Paint and Coating market
According to Vietnam‟s General Statistics Office, revenue for the country‟s construction sector grew by
approximately 8.8% to reach approximately VND456.0 trillion in the first six months of 2016 as compared to the
same period in 201550
.The construction industry in Vietnam, especially in Ho Chi Minh City, is currently
undergoing development of large-scale projects such as the Vinhome Central Park, consisting of approximately
10,000 apartments - one of the largest projects by Vietnam based Vin Group. Other large residential housing
projects in Ho Chi Minh City include a VND355.0 billion residential project in Nha Be Districts, a social housing
project worth VND1.1 trillion in District 12, a housing and commercial complex project worth VND1.7 trillion and
an apartment complex project worth VND869.0 billion in Phu Nhuan District and a low-rise housing project worth
VND531.0 billion in District 951
. Most of these projects are expected to be completed by 2018. Many low-cost
apartment projects are also under development in Ho Chi Minh City, with approximately 300 such apartments sold
in District 9 in 2016 and another 1,000 up for sale in 2017. In 2016, in Ho Chi Minh City, approximately 31.0% of
all apartments were categorized as high-end, 49.0% as medium-cost and rest 20.0% as low-cost52
. Foreign
developers such as Maeda Corporation and Kajima Corporation (Japan), Mirae Asset Securities Co. and Lotte Real
Estate Co., Ltd. (South Korea), Frasers Centrepoint Ltd and Mapletree Investments Pte Ltd (Singapore), among
others are also driving the growth in construction activities to tap into the rising income levels in the country, which
has in turn led to greater demand for better quality homes and commercial buildings53
. New housing laws introduced
by the government aimed at reducing restrictions on foreign ownership of residential and commercial buildings are
also spurring development activity. The potentially increasing expat home ownership and demand for better quality
homes are likely to further the demand for expensive apartments with plush interiors. This is likely to result in a
demand for premium paints and coatings in the forecast period.
50 Asia Pacific Coatings Journal (APCJ), October, 2016 51 http://en.nhandan.com.vn/business/economy/item/4268902-ho-chi-minh-city-approves-five-new-housing-projects.html 52 http://vneconomictimes.com/article/property/thousands-of-cheap-apartments-in-ho-chi-minh-city-will-be-launched-in-2017 53 http://hanoitimes.com.vn/economy/real-estate/2016/10/81e0a9db/foreign-real-estate-developers-keen-on-vietnamese-market/

56
Non-Decorative Paint and Coating market
Demand for non-decorative paints and coatings are likely to be driven by a number of factors. Firstly, the need for
industrial space is growing as well with an increase in industrial parks, warehouses, and logistics facilities.
Infrastructure is another area gaining momentum with investments in the energy and utilities and transport sectors,
mainly focusing on improvements in roads, railways, and ports. The government of Vietnam has also entered into
several PPPs with the goal of creating a less protectionist environment to attract more FDI into the country. From
2010 to 2020, a total investment of approximately USD200.0 billion is expected to be channeled toward
infrastructure development in Vietnam presenting lucrative opportunities in the country‟s paint and coating industry.
A second source of demand comes from Vietnam‟s furniture sector, which comprises more than 2,500 domestic
manufacturers and over 400 foreign enterprises. The country‟s wooden furniture exports earned more than
USD1,550.7 million in 2014, ranking 6th
in the world and 1st in SEA
54 for wooden furniture exports. Major
destinations for Vietnamese wood furniture exports in 2015 included the US (58.1% of total wooden furniture
exports), Japan (12.9%), UK (6.4%), China (5.1%) and South Korea (3.6%)55
. Leading furniture retail dealers such
as IKEA and SB Furniture also have a significant presence in the country.
Third, rapid infrastructural development in the country such as construction of roads, highways, bridges and the
MRT56
are expected to boost project sales of non-decorative paints and coatings.
3.1.2. Value Chain and Distribution Chain Analysis
Similar to the paint and coating industry in Thailand, raw materials for Vietnam‟s paint and coating industry are
sourced domestically as well as through imports (eg, silica). Raw materials (resins) used by the paint and coating
manufacturers in Vietnam are produced mostly by resin and other chemical manufactures, which are predominantly
MNCs such as the Dow Chemical Co., and BASF.
The distribution and supply chain for non-decorative paints and coatings in Vietnam is mostly inclined towards
direct sales from paint and coating manufacturers to industries and infrastructure development contractors. However,
for many of the non-decorative paint and coating categories, especially waterproofings and wood coatings, retail
sales constitues a sizeable portion. Furniture industries and small scale industries are also some of the large
customers for non-decorative paints annd coatings. Large furniture manufacturers procure directly from the paint
producers to gain competitive prices while smaller ones purchase through retail channels. Smaller infrastructure
contractors and sub-contractors also use the retail channel. Real-estate developers and construction contractors buy
most of their decorative paint and coating requirements from large retail dealers. Construction contractors are some
of the biggest consumers of decorative paints and coatings in the country. In Vietnam, the construction industry is
fragmented with contractor companies (roughly 40,000-60,000) of varying sizes.
Individual end users can purchase paints and coatings via retail, however, there are intermediaries in this channel.
Due to the low labor costs for painting – USD10.0-USD15.0 per square meter in suburban areas and USD20.0-
USD25.0 per square meter in city centers – end users prefer to employ painters, architects, and small contractors to
manage the entire process of paint procurement to application. As the third-parties typically decide on paint and
coating purchases, they can be considered as a major customer base for retail dealers. The absence of a DIY trend in
the country is reflected from the low retail to individual sales across all categories of paints and coatings in Vietnam.
54 This refers to the larger region of SEA and The Pacific 55 United Nations Comtrade International Trade Statistics Database 56 Refers to Metro Railway Trains

57
3.1.3. Market Sizing and Forecasts
Retail sales for decorative paints and coatings, which is approximately 50.0%-60.0% of total decorative paint and
coating sales in Vietnam, are mainly driven by the construction and furniture industries alongside demand from
public infrastructure developments. Among these, the construction industry is one of the primary consumers of
decorative paints and coatings sold through retail channels.
The retail decorative paint and coating market grew at a CAGR of 9.0% between 2011 and 2016, growing from
VND4,224.8 billion in 2011 to VND6,500.0 billion in 2016. The rapid growth over the years is likely to be
attributed to heightened activity in the housing market as well as an improvement in overall economic conditions in
the country. The retail market for decorative paints and coatings in Vietnam is forecast to record an even higher
CAGR of approximately 9.9% over the forecast period of 2016 to 2021, growing from approximately VND 6,500.0
billion in 2016 to approximately VND10,421.0 billion by 2021 as positive macroeconomic conditions continue to
drive construction activity in the country.
Retail Market Size of Decorative Paints and Coatings in Vietnam, VND, 2011-2021F
Source: Primary interviews with industry participants, desktop research and forecast by Frost & Sullivan Note: All figures are rounded. Base year is 2016
Wood coatings, among all the other categories of non-decorative paints and coatings had the highest sales through
the retail channel (approximately 15.0%-20.0% of total wood coatings sales). Waterproofing also has a considerable
portion (approximately 10.0%-20.0%) of sales through the retail channel. The major customers of waterproofing in
retail sales channel are small time painters and contractors. Between 2011 and 2016, the retail non-decorative wood
coatings market registered a CAGR of approximately 5.3%, growing from approximately VND691.3 billion in 2011
to approximately VND894.8 billion in 2016. The retail non-decorative waterproofing market posted a higher CAGR
of 6.7%, growing from VND565.9 billion in 2011 to VND782.9 billion in 2016. Higher growth rates observed in the
retail non-decorative waterproofing market as compared to the retail non-decorative wood coatings market can be
attributed to increase in housing construction activities during 2011-2016.
A distinct feature of the non-decorative protective coatings industry in Vietnam is the very limited presence of retail
dealers. Almost 95.0% of sales in the non-decorative protective coatings industry are project sales through channel
partners who are not retail dealers and are considered as an extended arm of the paint and coating manufacturer.
Significant product know-how and in-depth knowledge of specific end-user requirements are critical in this segment
which a majority of retail dealers are currently lacking. The market had very negligible growth rate historically as
paint and coating manufacturers had focused only on this channel to sell protective coatings products to the project
owners. As such, the retail non-decorative protective coatings market recorded a CAGR of approximately 2.2 %,
growing from approximately VND110.2 billion in 2011 to approximately VND123.0 billion in 2016.
Frost & Sullivan expects the retail non-decorative wood coatings market in Vietnam to expand at a higher (as
compared to the historical period 2011-2016) CAGR of approximately 6.9%, from approximately VND894.8 billion
in 2016 to approximately VND1,250.1 billion in 2021. The growth is likely to be driven by increased wood furniture
4,224.8 4,571.2 4,964.4 5,421.1 5,925.3 6,500.0 7,115.8 7,628.8 8,252.9 9,228.8
10,421.0
0.0
2,000.0
4,000.0
6,000.0
8,000.0
10,000.0
12,000.0
2011 2012 2013 2014 2015 2016 2017F 2018F 2019F 2020F 2021F
Deco
ra
tive p
ain
t a
nd
co
ati
ng
ma
rk
et
size (
VN
D b
illi
on
s)

58
manufacturing activities as well as its domestic consumption. The retail waterproofing market is expected to record
a higher CAGR of approximately 7.5%, as compared to the historical period 2011-2016, growing from
approximately VND782.9 billion in 2016 to approximately VND1,123.7 billion by 2021. The higher growth rate in
this market could be attributed to the increasing housing constructions and developments in the urban centers of the
country, most of which are expected to get completed by 2019. Going forward, in the forecast period, the retail non-
decorative protective coatings market is expected to register a CAGR of approximately 8.4%, growing from
approximately VND123.0 billion in 2016 to approximately VND184.4 billion by 2021 mainly driven by increased
focus on expanding retail dealer reach by educating them about technicalities and product-features.
Retail Market Size of Non- Decorative Paints and Coatings in Vietnam, VND, 2011-2021F
Source: Primary interviews with industry participants, desktop research and forecast by Frost & Sullivan
Note: All figures are rounded. Base year is 2016
Growth Rates of Retail Market for Non-Decorative Paint and Coating segments in Vietnam, (VND), 2011-
2021F
CAGR 2011-2016 CAGR 2016-2021F
Wood Coatings 5.3% 6.9%
Waterproofing 6.7% 7.9%
Protective Coatings 2.2% 8.4%
Total 5.7% 7.3%
Source: Primary interviews with industry participants, desktop research and forecast by Frost & Sullivan
Note: All figures are rounded. Base year is 2016.
691.3 724.1 760.4 799.4 844.9 894.8 958.6 1,012.2 1,075.4 1,157.8 1,250.1
565.9 601.5 640.6 683.8 731.7
782.9 836.5
885.5 943.7
1,025.8 1,123.7
110.2 111.5
112.9 115.2
118.2 123.0
130.4 138.7
148.9
164.9
184.4
0.0
500.0
1,000.0
1,500.0
2,000.0
2,500.0
2011 2012 2013 2014 2015 2016 2017F 2018F 2019F 2020F 2021F
No
n-D
eco
ra
tive p
ain
t a
nd
co
ati
ng
ma
rk
et
size (
VN
D b
illi
on
s)
Wood Coatings Waterproofing Protective Coatings

59
3.1.4. Competitive Landscape Analysis
The retail participant dominating the decorative paint and coating market in Vietnam is 4 Oranges Co Ltd, a
Vietnamese paint and coating manufacturer. Other major paint and coating manufacturers in the Vietnamese market
are mostly subsidiaries of multinational companies such as Akzo Nobel (Netherlands), Nippon Group (Japan), Jotun
Group (Norway) and TOA Paint (Thailand) Group. Some of these companies initially focused on importing paints
and coatings to Vietnam, however, most have their production facilities in the country today (2017). There is a lack
of large domestic paint and coating manufacturers in Vietnam. Several smaller domestic decorative paint and
coating manufacturers in the country include Hempel Vietnam Co Ltd, Vietnam Shyange Paint Co Ltd, and Hai
Phong Paint Company, mostly specializing in non-decorative paints and coatings.
The retail non-decorative wood coating market in Vietnam has two large domestic companies namely OSeven
Corporation and Adora Paints Vietnam Co., Ltd (Adora Paints). Kova Group Ltd (Kova) is one of the largest
domestic participants in the retail non-decorative waterproofing market. However, there are no larger domestic paint
and coating manufacturers in the retail non-decorative protective coatings market. Local subsidiaries of Jotun Group
(Japan) and Akzo Nobel (Netherlands) dominate this segment. The Vietnamese subsidiary of Akzo Nobel,
International Paint Singapore Pte Ltd, has a significant presence in all three retail non-decorative paint and coating
markets (wood coating, waterproofing, and protective coating), while Jotun Paints (Vietnam) Co Ltd is a key market
participant in the retail non-decorative protective coating and waterproofing markets. Sika Ltd (Vietnam), a
subsidiary of Sika Group (Switzerland) is a major market participant in the retail non-decorative waterproofing
market. Smaller domestic non-decorative paint and coating manufacturers include Dong Tam Co Ltd and Tison
Paint Co Ltd.
3.1.5. Market Share Estimates and Profiles of Retail Decorative and Non-Decorative Paint and
Coating companies in Vietnam
In 2016, the retail market for decorative paints and coatings in Vietnam was mainly dominated by 4 Oranges Co Ltd
(4 Oranges) and International Paint Singapore Pte Ltd (Akzo Nobel) with a combined share of approximately
41.0%, The former held a market share of approximately 23.0% while the latter had approximately 18.0% share in
the retail market for decorative paints and coatings. TOA Paint (Vietnam) Co., Ltd with approximately 9.8% market
share was closely followed by Nippon Paint (Vietnam) Ltd (Nippon Paint), a subsidiary of Japan-based Nippon
Group at approximately 9.0%. Jotun Paints (Vietnam) Co., Ltd (Jotun Paint) was also among the top five decorative
paint and coating manufacturers for the retail market with a share of approximately 8.0% in 2016.
Estimated Retail Market Share of Decorative Paints and Coatings, VND, Vietnam, 2016
Source: Frost & Sullivan, primary interviews, desktop research and analysis Note: Since companies' 2016 revenue numbers, including segmental breakdown was not readily available through published
sources ,approximate market shares have been arrived at through a combination of: (i) Interviews with experts which includes
current and past employees of leading paint and coating companies, (ii) year-on-year growth trends, company reports and other presentation materials including but not limited to news articles, press releases, (iii) Frost & Sullivan’s desktop research on
sources including but not limited to databases of industry associations, trade bodies, government agencies etc.
23.0%
18.0%
9.8%
9.0% 8.0%
32.2%
4 Oranges Co., Ltd
International Paint Singapore Pte Ltd
(Vietnam branch)
TOA Paint (Vietnam) Co,.Ltd.
Nippon Paint (Vietnam) Co. Ltd
Jotun Paints (Vietnam) Co. Ltd.
Others

60
Oseven Corporation, a Vietnam-based paint and coating manufacturer, had the highest share of approximately
45.0% followed by Adora Paints (Vietnam) Co., Ltd (Adora Paints) with approximately 15.0%. Other large players
in the retail market for non-decorative wood coatings in Vietnam in 2016 were International Paint Singapore Pte Ltd
(Vietnam branch) with a retail market share of approximately 10.0%, and TOA Paint (Vietnam) Co., Ltd with
approximately 8.0% share of the total wood coatings market.
Estimated Retail Market Share of Non-Decorative Wood Coatings, VND, Vietnam, 2016
Source: Frost & Sullivan, primary interviews, desktop research and analysis
Note: Since companies' 2016 revenue numbers, including segmental breakdown was not readily available through published
sources ,approximate market shares have been arrived at through a combination of: (i) Interviews with experts which includes
current and past employees of leading paint and coating companies, (ii) year-on-year growth trends, company reports and other presentation materials including but not limited to news articles, press releases, (iii) Frost & Sullivan’s desktop research on
sources including but not limited to databases of industry associations, trade bodies, government agencies etc.
The retail market for non-decorative waterproofing in Vietnam, in 2016, was largely dominated by Kova Group Ltd
with an approximately 49.0% market share. International Paint Singapore Pte Ltd (Vietnam Branch), Jotun Paints
(Vietnam) Co., Ltd at 10.0% market shares each and TOA Paints (Vietnam) Co., Ltd with approximately 6.0% was
the other participants in this segment in 2016.
Estimated Retail Market Share of Non-Decorative Waterproofing Coatings, VND, Vietnam, 2016
Source: Frost & Sullivan, primary interviews, desktop research and analysis
Note: Since companies' 2016 revenue numbers, including segmental breakdown was not readily available through published sources ,approximate market shares have been arrived at through a combination of: (i) Interviews with experts which includes
current and past employees of leading paint and coating companies, (ii) year-on-year growth trends, company reports and other
presentation materials including but not limited to news articles, press releases, (iii) Frost & Sullivan’s desktop research on sources including but not limited to databases of industry associations, trade bodies, government agencies etc.
45.0%
15.0% 10.0%
8.0%
22.0%
Oseven Corporation
Adora Paints (Vietnam) Co., Ltd
International Paint Singapore Pte Ltd
(Vietnam branch)
TOA Paint (Vietnam) Co., Ltd.
Others
49.0%
10.0% 10.0%
6.0%
25.0%
Kova Group Ltd
International Paint Singapore Pte
Ltd (Vietnam branch)Jotun Paints (Vietnam) Co. Ltd.
TOA Paints (Vietnam) Co., Ltd
Others

61
The retail market for non-decorative protective coatings in Vietnam, in 2016, was jointly dominated by Jotun Paints
(Vietnam) Co., Ltd with approximately 50.0% market share and International Paint Singapore Pte Ltd (Vietnam
branch) or Akzo Nobel (Vietnam) with an approximate share of 40.0%. Hai Phong Paint Joint Stock Company was
also a market participant with a negligible share of approximately 5.0% of this market in 2016.
Estimated Retail Market Share of Non-Decorative Protective (Concrete and Metal) Coatings, VND, Vietnam,
2016
Source: Frost & Sullivan, primary interviews, desktop research and analysis
Note: Since companies' 2016 revenue numbers, including segmental breakdown was not readily available through published sources ,approximate market shares have been arrived at through a combination of: (i) Interviews with experts which includes
current and past employees of leading paint and coating companies, (ii) year-on-year growth trends, company reports and other
presentation materials including but not limited to news articles, press releases, (iii) Frost & Sullivan’s desktop research on sources including but not limited to databases of industry associations, trade bodies, government agencies etc.
Profiles of Major Players
4 Oranges
Wholly owned by the Asia Leader International Investment Corporation, 4 Oranges entered the paint and coating
industry of Vietnam in 2004. The company currently has four production lines equipped with modern technologies
and a production capacity of 100 million liters of paint and 60,000.0 tons of plaster per year. Suppliers of raw
materials to 4 Oranges are leading global chemical corporations such as Degussa (US), ELIOKEM (France), Dow
Chemical (US), Rohm & Haas (USA), Cray Valley (Malaysia) and Nuplex (Australia). To provide high-quality
products to customers, the company invests in Research and Development and purchases inventions and licenses
from the European and American markets. Major products of 4 Oranges‟ are MYKOLOR, SPEC, BOSS and EXPO.
In 2016, 4 Oranges had the highest share of approximately 23.0% in the Vietnamese retail market for decorative
paints and coatings.
Akzo Nobel
Akzo Nobel stood second to 4 Oranges in terms of share of the retail market for decorative paints and coatings in
2016. The company had a share of approximately 18.0% of the retail market for decorative paints and coatings in
Vietnam. Akzo Nobel entered Vietnam in 1992 with its first plant in Ho Chi Minh City. It invested in another plant
in the expanding industrial areas outside Ho Chi Minh City in 2004 to boost the production of decorative paints and
coatings. The company also runs a production line for manufacturing powdered coatings. Dulux and Maxilite are
major brands under Akzo Nobel, were the first products in Vietnam to obtain the certification of compliance with
the nation‟s technical regulations by the Quality Assurance and Testing Center 3 (QUATEST 3), a science and
technology based center of the Directorate for Standards, Metrology and Quality (STAMEQ) under the Ministry of
50.0%
40.0%
5.0%
5.0%
Jotun Paints (Vietnam) Co., Ltd.
International Paint Singapore Pte
Ltd (Vietnam branch)
Hai Phong Paint Joint Stock
Company
Others

62
Science and Technology (MOST). The Dulux brand was also voted as the No 1 trustworthy paints brand over five
consecutive from 2009 to 2013.
TOA Paint (Vietnam) Co., Ltd
TOA Paint (Vietnam) Co., Ltd is a subsidiary of the much larger TOA Paint (Thailand) Public Company Limited. In
early 1990s, TOA Paint (Thailand) Public Company Limited used to import paints and coatings to Vietnam until
TOA Paint (Vietnam) Co., Ltd was incorporated in Vietnam in 1995. The company‟s first factory, at Tan Dinh
Industrial Park, became operational in 1998. Another factory producing decorative paints and coatings, industrial
coatings, wood coatings and construction chemicals, was set up in 2006 at the Tan Dong Hiep A Industrial Park, Di
An Town. In 2016, TOA Paint (Vietnam) Co., Ltd held a share of approximately 9.8% of the retail market for
decorative paints and coatings in Vietnam.
Nippon Paint
Nippon Paint is a subsidiary of the much larger Japanese Nippon Paint Holdings held a market share of
approximately 9.0% in the retail market for decorative paints and coatings in Vietnam. Established in Vietnam in
1994, Nippon is based in the Industrial Zone of Bien Hoa as well as in seven other locations across the country. It
also has Nippon Paint dealers throughout the country across 66 provinces and cities. Momento and Vatex are the
major brands of Nippon Paint in the decorative paint and coating category. The company also manufactures
industrial paints under brands such as Tilac, Bilac, Nippon PU and EP4 for the heavy industry. As the company has
access to technologies and management practices of its parent company in Japan, its products are considered to be
optimal choices in the industry including the automobiles, marine and house decoration segments.
Jotun Paint
Jotun Paint‟s global operations are present in seven regions across the globe such as North America, Europe, Middle
East and Asia Pacific. The company produces decorative as well as non-decorative paints and coatings. The Jotun
Group has 37 production facilities and 63 offices present in more than 100 countries. In Vietnam, the company is in
Ho Chi Minh City. It is a major producer of interior and exteriors paints and coatings, protective metal coatings and
wood coatings. Jotun Paint had a market share of approximately 8.0% in the Vietnamese retail market for decorative
paints and coatings in 2016. Established in Vietnam in 1994, Jotun set up its first production facility and started
operations in 1998. Currently Jotun Paint Vietnam has a production capacity of more than 25.0 million liters per
year. The company is licensed for operation in Vietnam for 30 years ending in 2026 and thus has a long-term
development strategy.
Kova Group Ltd
Kova Group Ltd dominated the retail market for non-decorative waterproofing in Vietnam in 2016. The company
launched its first waterproofing product lines in 1996 with outstanding features in waterproofing new, old as well as
decayed walls. The first Kova Paint Co., Ltd (Kova) factory was established in My Dinh Industrial zone, Tu Liem
district, Hanoi, in 1998. Another factory was set up in 2005 at Hanoi. In 2007 Kova also entered the non-decorative
protective coatings market with its metallic paint and coating products and in 2008 the company expanded to
Cambodia. Currently the Kova Group comprises 9 member companies and 5 high-capacity paint and coating
manufacturing plants; four are located in Vietnam and one in Cambodia. In 2016, researchers from Kova Group‟s
facilities invented bulletproof paints and coatings produced from rice husks.

63
3.1.6. Industry Prospects & Outlook
Vietnam has been on a growth trajectory since 2011 and is expected to continue the momentum in the forecast
period, mainly driven by stimulus from the government‟s long term growth strategies. The rapid growth of the
country‟s economy, coupled with the young and large population is also likely to be a key growth driver in the
forecast period.
Growth in the retail paints and coatings post 2017 is likely to be driven by large housing construction projects in
urban areas of Vietnam. Increase in the number of foreign developers in this sector and rising income levels of the
population are gradually increasing demand for better quality housing. This in turn is expected to boost the sales of
decorative paints and coatings and shift consumer preferences towards premium category products.
Demand for non-decorative paints and coatings is also expected to increase as a result of increased FDI inflow into
the country. Growth in Vietnam‟s furniture industry is likely to drive growth in the retail market for non-decorative
wood coatings, while increased public investments towards infrastructure projects related to transport is expected to
lead the growth in the retail market for non-decorative waterproofing. The retail market for non-decorative
protective coatings is relatively less prominent in Vietnam. However, it is expected to grow at much higher rates in
the forecast period as a result of foreign and domestic players increasing their retail distribution networks.
Digitization is set to stimulate growth in this industry as the country‟s young demographic increasingly leverages
technology to make purchase decisions including choosing the paint texture and special effects for their house
interiors. Growing awareness among customers about the origins of products, safety of ingredients, and their
environmental friendliness is also likely to influence the paint and coating industry in Vietnam. Companies that are
able to cater to the evolving tastes and preferences of retail and B2B consumers are likely to reap significant benefits
in the forecast period.
The rest of the page is intentionally left blank
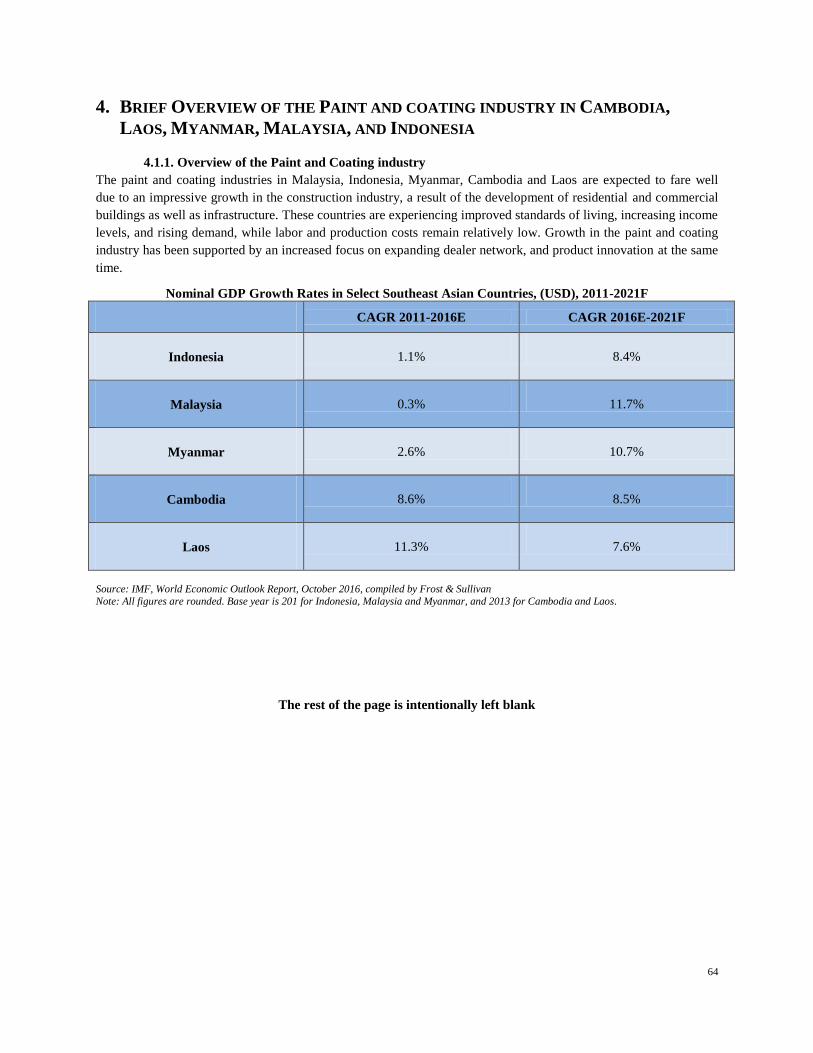
64
4. BRIEF OVERVIEW OF THE PAINT AND COATING INDUSTRY IN CAMBODIA,
LAOS, MYANMAR, MALAYSIA, AND INDONESIA
4.1.1. Overview of the Paint and Coating industry
The paint and coating industries in Malaysia, Indonesia, Myanmar, Cambodia and Laos are expected to fare well
due to an impressive growth in the construction industry, a result of the development of residential and commercial
buildings as well as infrastructure. These countries are experiencing improved standards of living, increasing income
levels, and rising demand, while labor and production costs remain relatively low. Growth in the paint and coating
industry has been supported by an increased focus on expanding dealer network, and product innovation at the same
time.
Nominal GDP Growth Rates in Select Southeast Asian Countries, (USD), 2011-2021F
CAGR 2011-2016E CAGR 2016E-2021F
Indonesia 1.1% 8.4%
Malaysia 0.3% 11.7%
Myanmar 2.6% 10.7%
Cambodia 8.6% 8.5%
Laos 11.3% 7.6%
Source: IMF, World Economic Outlook Report, October 2016, compiled by Frost & Sullivan
Note: All figures are rounded. Base year is 201 for Indonesia, Malaysia and Myanmar, and 2013 for Cambodia and Laos.
The rest of the page is intentionally left blank

65
Urban Population57
in Selected SEA Countries, (2011, 2016, 2021F)
Source: World Urbanization Prospects and World Population Prospects, United Nations, compiled by Frost & Sullivan Note: All figures are rounded.
Population in Select Southeast Asian Countries, (millions), 2011-2021F
2011 2016E 2021F
Indonesia 244.8 260.6 274.5
Malaysia 28.6 31.2 32.8
Myanmar 52.1 54.4 56.7
Cambodia 14.6 16.1 17.0
Laos 6.4 6.9 7.5
Source: UN, World Population Prospects, 2015 revision, compiled by Frost & Sullivan
Note: All figures are rounded. Base year is 2014.
57 As a percentage of total population
50.7%
71.7%
31.9%
20.0%
34.3%
54.5%
75.4%
34.7%
20.9%
39.7%
57.9%
78.3%
37.5%
22.3%
44.4%
10.0%
20.0%
30.0%
40.0%
50.0%
60.0%
70.0%
80.0%
90.0%
100.0%
Indonesia Malaysia Myanmar Cambodia Laos
urb
an
po
pu
lati
on
as
a p
ro
po
rti
on
of
tota
l
po
pu
lati
on
(%
)
2011 2016E 2021F

66
Indonesia
Indonesia‟s paint and coating industry is driven by the large population, increasing urbanization, and the rising
disposable income. Indonesia‟s GDP is forecast to record at a CAGR of approximately 8.4% between 2016 and
2021. The urban population as a percentage of total population in Indonesia is expected to increase from 54.5% in
2016 to reach approximately 57.9% by 2021 driving the demand for housing and growth of the infrastructure and
construction industry. This in turn is likely to stimulate demand for paints and coatings in Indonesia. In 2015, the
Indonesian government announced one million new housing units for low income earners and allocated USD782.0
million for the realization of the program. The Indonesian government‟s ambitious target of building 10.0 million
new houses by 2019 to provide adequate housing facilities to low income citizens is also expected to create
significant demand for paints and coatings in the forecast period. Government plans for increased spending in
infrastructure are also expected to have an impact on the paint and coating industry. The Indonesian president is
currently pursuing an ambitious five-year billion-dollar plan to upgrade roads, ports, water and power plants.
Indonesia is the second largest car manufacturer in Asia after Thailand with the production of passenger vehicles
forecast to reach approximately 2.6 million by 2020 resulting in growth for the non-decorative paint and coating
market. The decorative paint and coating segment holds a majority of the Indonesian paint and coating industry.
Growing consumption is set to continue in line with the growth of residential and commercial properties as well as
large infrastructure projects (related to rail, road, power, and port).
Malaysia
Malaysia‟s paint and coating industry is relatively mature as compared to its counterpart in Indonesia. Malaysia‟s
GDP is expected to register a CAGR of approximately 11.7% between 2016 and 2021. The urban population as a
percentage of total population is expected to increase marginally from approximately 75.4% in 2016 to
approximately 78.3% by 2021, driving the growth of the construction industry and boosting the demand for paints
and coatings in the country. The Malaysian government, with a view to providing people with the opportunity to
own their homes, is expected to complete 10.0 million new housing units under the 1Malaysia Housing Projects by
2018 spurring the demand for decorative paints and coatings in the forecast period. The Malaysian government also
plans to develop the country‟s infrastructure under the 11th Malaysia Plan 2016–2020. New investments in the
residential and non-residential construction sector are likely to enable the Malaysian construction industry to
contribute approximately 5.5% to the Malaysian GDP by 2020 with these investments positively impacting the paint
and coating industry in the country. Decorative paint and coating is the prominent segment in the Malaysian paint
and coating industry. To promote sustainability and environment friendly practices in the Malaysian construction
industry, the Malaysian Institute of Architects introduced the Green Building Index (GBI), appealing to owners
seeking “green building” certification through the use of environmentally friendly (low VOC) paints and coatings.
Another scheme, the SIRIM Eco-Labelling, recognized as the National Eco-labelling Program of Malaysia allows
paint and coating manufacturers to position their product as environment friendly, providing an edge over other
similar paint and coating products in a consumer market that is becoming increasingly environmentally-conscious.
The Malaysian paint and coating industry is concentrated, with a total of approximately 70.0%-80.0% market share
accounted for by top three players. Additionally, presence of paint and coating associations in Malaysia and
Indonesia provides a platform for paint and coating manufacturers to discuss current issues and understand the
collective needs of the industry whereas such industry associations are yet to be established in the developing
countries namely Myanmar, Cambodia and Laos.

67
Myanmar
Myanmar‟s GDP58
is set to register a CAGR of approximately 10.7% between 2016 and 2021. GDP growth was
7.3% during 2010-2014 owing to the various reform programs, with a focus on economic expansion. Urban
population as a percentage of total population was approximately 34.7% in 2016 and is expected to reach
approximately 37.5% in 2021. In 2016, Myanmar‟s government announced plans to build 18.0 million59
affordable
housing units throughout the country in the forecast period. Housing initiatives coupled with infrastructure projects
such as Hanthawaddy International Airport are expected to drive demand for paints and coatings in Myanmar. The
decorative paint and coating market in Myanmar is still at a developing stage with major cities such as Yangon and
Mandalay driving demand for several building projects. The paint and coating industry in Myanmar is relatively
consolidated60
with United Paints Group Co., Ltd. catering to the majority of the paint and coating needs in the
country.
Cambodia
Cambodia‟s GDP61
is expected to register a CAGR of approximately 8.5% between 2016 and 2021. Cambodia‟s
urban population as a percentage of total population is expected to increase from approximately 20.9% in 2016 to
approximately 22.3% by 2021. In January 2017, Cambodia signed to the Sustainable Development Investment
Partnership (SDIP)62
, to unlock the funding of infrastructure projects through PPPs. According to the Cambodian
construction investment data, there are more than 2,500 construction projects in progress with a total estimated63
construction cost of approximately USD5,500.0 million driving the demand for paints and coatings in the country.
The Ministry of Land Management, Urban Planning and Construction, suggests that the demand for housing in
Cambodia is likely to reach approximately one million64
units by 2030 which in turn is likely to result in a
heightened demand for paints and coatings.
Laos
Laos‟ GDP65
recorded a CAGR of approximately 11.3% between 2011 and 2016. However, the CAGR between
2016 and 2021 is likely to decline to 7.6% as the IMF predicts the country‟s economy in the short-term (2016-2018)
to be affected by external shocks, notably the regional growth slowdown and deterioration in trade and capital
inflows. The urban population as a proportion of total population for Laos is set to increase from approximately
39.7% in 2016 to approximately 44.4% by 2021. Going forward, although the country‟s GDP growth rate is
expected to register a marginal slowdown, Frost & Sullivan believes that on-going economic activities are likely to
result in higher disposable incomes in the forecast period. The rise in urban population as a proportion of total
population could also stimulate demand for residential structures in major cities of Laos, in turn, fueling demand for
decorative paints and coatings in the forecast period.
58 http://www.imf.org/external/datamapper/NGDP_RPCH@WEO/OEMDC/ADVEC/WEOWORLD/MMR 59 http://www.mmtimes.com/index.php/national-news/nay-pyi-taw/20732-govt-plans-to-build-180-000-affordable-housing-units.html 60 https://jessicamudditt.com/2014/11/28/paint-coatings-industry-myanmar-2014/ 61 http://www.imf.org/external/datamapper/NGDP_RPCH@WEO/OEMDC/ADVEC/WEOWORLD/KHM 62 http://www.phnompenhpost.com/business/cambodia-joins-global-infrastructure-fund-davos 63 http://www.cca.org.kh/ 64 http://www.akp.gov.kh/?p=69417 65 http://www.imf.org/external/datamapper/NGDP_RPCH@WEO/OEMDC/ADVEC/WEOWORLD/LAO

68
4.1.1.1. Value Chain and Distribution Chain Analysis
The value chain of the paint and coating industry in Indonesia and Malaysia is similar to that of Vietnam and
Thailand with raw materials (resins) for the industry being sourced domestically as well as through imports. Raw
material providers are mainly multinational companies such as BASF and Dow Chemical. The distribution of paint
and coating products in Indonesia and Malaysia is primarily through retail and project sales; retail sales also include
point-of-sale (POS) tinting machines. Paint and coating manufacturers also sell directly to construction companies
and project developers who are end-users of paints; whereas, under retail sales, distributors act as intermediaries that
distribute the paint and coating to retail stores that sell to end-users/consumers.
In Indonesia and Malaysia, distributors have excellent reach to retail dealers and well-established sales networks
across the country. Majority66
of sales happen through retail channel in both countries while sales through the direct
Business-to-Business (B2B) channel is less prominent. Retail sales through POS tinting machines installed at retail
stores is a new sales trend primarily practiced in major cities of Indonesia and Malaysia. Several large retail dealers
(e.g., Mitra10, Depo Bangunan), as well as major contractors in Indonesia and Malaysia are also focussing on
building strong relationships with paint and coating manufacturers as it helps them to make direct purchases at
special prices from producers based on their existing relationships with the manufacturer.
In the value chain of the paint and coating industry in Myanmar, Cambodia and Laos, the majority of raw materials
are imported as companies such as BASF have only representative offices67
in these regions and a lack of domestic
raw material (resin) producers. The main distribution channel in these countries involves the goods moving from the
manufacturer to the distributor and retail dealers, before reaching consumers which comprises of individuals, project
owners, contractors and sub-contractors. Big project owners and large contractors generally prefer to purchase
directly from manufacturers as they can secure discounts by placing bulk orders. Individual consumers buy paints
from retail dealers only. In Myanmar68
, Cambodia69
and Laos, the domestic as well as foreign paint and coating
manufacturers have a fairly established distribution network. However, most still lag with respect to retail dealer‟s
reach and an established sales network for paint and coating across the country. The demand for paints and coatings
in Myanmar, Cambodia and Laos is still in its infant stage and as the market size for paint and coating industry in
these countries increases, the accompanying logistics capabilities are expected to improve.
The rest of the page is intentionally left blank
66 http://swa.co.id/swa/trends/marketing/nippon-paint-hadirkan-tren-warna-asia 67 https://www.basf.com/hk/en/company/news-and-media/news-releases/th/2015/09/new-office-myanmar.html 68 http://www.upgpaint.com/index.php/company-profile 69 http://campaint-ccsc.com.kh/contact-us/?lang=en

69
4.1.2. Market Sizing and Forecasts
The decorative paint and coating markets in Malaysia, Indonesia, Myanmar, Cambodia and Laos show a positive
outlook on the backdrop of increasing urbanization, economic reforms, spending towards infrastructure, rising
disposable income, among many others. The decorative paint and coating market for these selected SEA countries
combined is expected to grow at a CAGR of approximately 7.7% between 2016 and 2021, growing from
approximately USD1,224.0 million in 2016 to approximately USD1,772.4 million in 2021.
Indonesia
Urbanization and rising disposable incomes are changing consumer preferences towards high-quality finishes. These
are some of the major factors driving growth in the Indonesian paint and coating industry. In 2016, the retail market
for decorative paints and coatings in Indonesia was valued at approximately USD785.3 million. Historically, the
market has grown at a CAGR of approximately 7.2% between 2011 and 2016 and is expected to reach USD1,206.3
million by 2021 registering a CAGR of approximately 9.0% over the period 2016 to 2021. Between 2011 and 2016,
large foreign companies, including Davies Paints from the Philippines and the Thailand-based TOA Paint (Thailand)
Public Company Limited entered the paint and coating market in Indonesia, signaling promising times for the
industry in the forecast period.
Malaysia
The retail market for decorative paints and coatings in Malaysia was approximately USD356.5 million in 2016
recording a CAGR of 5.0% over 2011-2016 mainly driven by an economic recovery70
, urbanization and increased
number of new housing project completions. However, the Malaysian paint and coating industry experienced slower
growth in the year 2015 (compared to the other years between 2011 and 2016) due to challenges faced by the Goods
and Services Tax (GST) implementation and a depreciation of Ringgit against the US dollar. The Malaysian
construction sector accounted for 4.5% of GDP in 201671
with residential housing projects, which are among the
major consumers of decorative paints and coatings72
, accounting for approximately 24.4% of total constructions.
The construction sector is forecasted to account for 5.5% in year 202073
, registering a CAGR of 5.0% over the
period 2016-2020. Analyzing the above factors, Frost & Sullivan expects the retail decorative paint and coating
market in Malaysia to grow at a CAGR of approximately 5.2%74
over the forecast period to reach approximately
USD459.3 million by 2021.
The rest of the page is intentionally left blank
70 From GDP growth rate of -12.4% in 2015 to 2.2% in 2016 71 http://www.epu.gov.my/sites/default/files/MEIF%202016.pdf 72 https://www.pressreader.com/malaysia/new-straits-times/20161212/282733406498677 73 www.citp.my/v2/wp-content/uploads/CITP-Public-Document.pdf 74 The growth in this market is expected to remain moderate as compared to the markets in other countries such as Vietnam and Myanmar. This is
due to the fact that Malaysia already has a high per capita paint and coating consumption of 9.0 liters as compared to Vietnam at 3.0 liters and Myanmar at 1.0 liters. Therefore, there is more scope for growth in the markets of Vietnam and Myanmar that that of Malaysia.

70
Myanmar
The retail market size of the decorative paints and coatings in Myanmar was valued at approximately USD24.8
million in 2011. It reached a value of approximately USD35.0 million in 2016, recording a CAGR of approximately
7.1% between 2011 and 2016. During the later years of this period huge investments were made in the services
sector, especially towards telecommunications75
, which resulted in its growth of 59.1%76
in 2015 as compared to
2014. Growth in the retail market for decorative paints and coatings in Myanmar was mainly driven by construction
of offices complexes, other commercial spaces and new houses developed around the previous two. However,
according to Asian Development Bank (ADB), the poor quality of and access to infrastructure is exacerbated in rural
areas, while basic urban infrastructure and services are insufficient to enable urban centers to serve as poles for
economic growth and weaknesses in urban planning were some of the major restraints for economic growth during
the same period. Therefore the main focus77
of the government is on macroeconomic policies and structural reforms
including access to finance. On the infrastructure development front, the key focus areas78
are on energy
transmission and distribution, transport infrastructure upgrading, and urban infrastructure and housing development.
Growth in the retail market for paints and coatings is expected to be moderate due to political concerns and civil
unrest in Myanmar. Frost & Sullivan expects the decorative paint and coating market in Myanmar to grow at a
CAGR of approximately 6.2% over the forecast period to reach approximately USD47.3 million by 2021. Factors
such as stagnant repainting cycles (average of 5 years79
), negligible portion of population spending on costlier and
imported paints and coatings, deceleration in development80
of commercial properties as well as the May 2016
decision by the Yangon City Development Corporation to suspended the construction of approximately 200 high
rise building projects due to concerns over constructions starting without the necessary permits and violation of
building standards are expected to affect the growth in the retail market for decorative paints and coatings in
Myanmar.
Cambodia
The retail market size for decorative paints and coatings in Cambodia was valued at approximately USD24.7 million
in 2011 and it reached a value of approximately USD30.0 million in year 2016; registering a CAGR of
approximately 4.0% from 2011 to 2016. It is further expected to reach USD39.0 million by 2021 recording a CAGR
of approximately 5.4% over the period 2016 to 2021. The country‟s proximity to Malaysia and Vietnam aiding in
raw material imports, the maturity of market and political stability in Cambodia are considered beneficial to the
country. Additionally, major infrastructure investment focus on areas such as irrigation and water management,
rural electrification, roads and water supply are expected to indirectly benefit the retail market for decorative paints
and coatings by serving as an impetus to rural household incomes. However, the construction sector in Cambodia,
which accounts to approximately one-sixth of the total GDP and is expected to decelerate in the forecast period due
to slowdown (2.3% YOY growth rate in 2015 as compared to 17.5% YOY in 2014) in the number of annual
construction permits81
and the government‟s policy for taxation on import of paints and coatings are likely to restrict
growth in the retail market for decorative paints and coatings in Cambodia.
75 http://www.themimu.info/sites/themimu.info/files/documents/Report_Inclusive_Growth_Diagnostic_DFID_Nov2015.pdf 76 https://www.adb.org/sites/default/files/institutional-document/237161/cps-mya-2017-2021.pdf 77 http://www.worldbank.org/en/news/press-release/2016/05/31/myanmar-growth-eases-slightly-but-remains-robust-in-2015-2016 78 https://www.adb.org/sites/default/files/institutional-document/237161/cps-mya-2017-2021.pdf 79 http://www.mmtimes.com/index.php/business/property-news/5685-painters-finding-more-work-beyond-yangon.html 80 http://documents.worldbank.org/curated/en/271301485510327677/pdf/112317-WP-MEM-Jan27-17-final-PUBLIC.pdf 81 http://documents.worldbank.org/curated/en/403961467989523939/pdf/104756-REVISED-PUBLIC-Final-CEU-April-2016-English.pdf

71
Laos
The retail market for decorative paints and coatings in Laos registered a CAGR of approximately 2.0% between
2011 and 2016, growing from USD15.6 million in 2011 to USD17.2 million in 2016. The historical growth rate of
retail market for decorative paints and coatings in Laos was considerably lower than Myanmar as Laos received
international support in the form of developmental aids from countries such as China and Vietnam. These aids were
mainly devoted towards social causes such as improving health and child nutrition and less focused towards
economic development. Whereas Myanmar received FDI from multinational companies in United States which
helped in catapulting its growth82
. According to Asian Development Bank (ADB) the major developmental focus83
of the government in Laos is towards access to safe water supply, sanitation, energy and infrastructure (construction
of hydropower plants and development in SEZs). One of the major upcoming infrastructure projects84
is the
Kunming – Singapore railway, which is expected to boost economic activities in the country and drive construction
activities along the railway network routes. Also, between 2003 and 2013, the number of people living in
brick/concrete houses has increased considerably, from 20.0%-25.0% of the total population in 2003 to
approximately 40.0%-50.0% of the total population in 2013 indicating a gradual shift towards better quality house
constructions. However, given that approximately 70.0%-80.0% of the population lived on less than USD2.5 per day
in 201385
, it is highly unlikely that consumer spending (at par with other countries in the SEA) is likely to be
directed towards painting and repainting activities. These are likely to moderate the growth rates in the retail market
for decorative paints and coatings in Laos. As a result of the aforementioned factors, Frost & Sullivan expects the
retail market for decorative paints and coatings in Laos to grow at a relatively slower pace (as compared to the other
countries in SEA) from 2016 to 2021, registering a CAGR of approximately 3.5% over the forecast period to reach
approximately USD20.4 million by 2021.
The rest of the page is intentionally left blank
82 FDI‟s propagate economic growth in the long term and build up a business ecosystem in the country whereas developmental aids are generally
focused towards social and infrastructural developments 83 https://www.adb.org/sites/default/files/institutional-document/202116/cobp-lao-2017-2019_0.pdf 84 http://thediplomat.com/2016/06/singapore-kunming-rail-link-a-belt-and-road-case-study/ 85 http://documents.worldbank.org/curated/en/515521468197368035/pdf/AUS17628-WP-OUO-9-Lao-Economic-Monitor-May-2016-has-been-approved-P157829.pdf

72
Retail Market Size of Decorative Paints and Coatings in Selected SEA Countries, USD, 2011-2021F
Source: Primary interviews with industry participants, desktop research and forecast by Frost & Sullivan
Note: All figures are rounded. Base year is 2016
Growth Rates of Retail Market for Decorative Paints and Coatings in Select Southeast Asian Countries,
(USD), 2011-2021F
CAGR 2011-2016 CAGR 2016-2021
Indonesia 7.2% 9.0%
Malaysia 5.0% 5.2%
Myanmar 7.1% 6.2%
Cambodia 4.0% 5.4%
Laos 2.0% 3.5%
Source: Primary interviews with industry participants, desktop research and forecast by Frost & Sullivan
Note: All figures are rounded. Base year is 2016.
2011 2012 2013 2014 2015 2016 2017F 2018F 2019F 2020F 2021F
Laos 15.6 15.9 16.2 16.5 16.9 17.2 17.8 18.4 19.1 19.7 20.4
Cambodia 24.7 25.6 26.7 27.7 28.8 30.0 31.6 33.3 35.1 37.0 39.0
Myanmar 24.8 26.6 28.5 30.5 32.7 35.0 37.2 39.5 41.9 44.5 47.3
Malaysia 279.0 293.0 307.7 323.3 339.5 356.5 374.7 394.2 415.0 436.6 459.3
Indonesia 554.0 594.0 626.3 670.1 723.7 785.3 853.6 929.5 1016.0 1107.1 1206.3
0
200
400
600
800
1,000
1,200
1,400
1,600
1,800
2,000
To
tal
Deco
ra
tive P
ain
t a
nd
Co
ati
ng
M
ark
et
( U
SD
mil
lio
ns)
Indonesia Malaysia Myanmar Cambodia Laos

73
4.1.3. Competitive Landscape
Key Competitors - Decorative Paint and Coating Retail Market in Malaysia
Name of the
company
Headquarters Subsidiaries Segments present Manufacturing
plants
Cater to
retail
channel
Nippon
Paint
Holdings
Co., Ltd.
Japan Nippon Paint
(Malaysia) Sdn. Bhd.
Nippon Paint (Sabah)
Sdn. Bhd.
Paint Marketing
Company (Malaysia)
Sdn. Bhd.
Decorative Paints
Wood Paints
Metal Coatings
Protective Coatings
Automotive Paints
Waterproofing
Plants in
Malaysia at Shah
Alam, Johor
Bahru and
Kolombong
(Sabah)
Yes
Akzo Nobel
N.V.,
Netherlands Akzo Nobel Paints
(Malaysia) Sdn. Bhd.
DGL International
(Malaysia) Sdn Bhd
Decorative paints
Automotive paints
Metal coatings Marine
coatings
Protective coatings
Waterproofing
Wood Paints
Manufacturing
facility at Johor
Bahru
Yes
Jotun Norway Jotun (Malaysia) Sdn.
Bhd.
Jotun Paints Sdn.
Bhd., Nilai - (sales
and production)
Decorative Paints
Marine Coatings
Protective Paints
Metal Coatings
Powder Coatings
Wood Paints
Manufacturing
plants in
Malaysia at Shah
Alam and Nilai
Yes
Source: Primary interviews with industry participants, and Frost & Sullivan analysis
The rest of the page is intentionally left blank

74
Key Competitors - Decorative Paint and Coating Retail Market in Indonesia
Name of the
company
Headquarters Subsidiaries Segments present Manufacturing
plants
Cater to
retail
channel
Nippon
Paint
Holdings
Co., Ltd.
Japan PT Nipsea Paint and
Chemicals
Nippon Paint PT. NP
Auto Refinishes
Decorative Paints
Wood Paints
Metal Coatings
Protective Coatings
Automotive Paints
Waterproofing
Nippon has
production plants
in Indonesia at
Jakarta, Medan,
Surabaya and
Purwakarta
Yes
PT. Avia
Avian
Indonesia --- Decorative paints
Wood coatings
Metal coatings
Automotive paints
Plants in
Indonesia at
locations:
Serang, Medan,
Sidoarjo and
Cirebon
Yes
Akzo Nobel
N.V.,
Netherlands PT ICI Paints
Indonesia
Decorative paints
Automotive paints
Metal coatings Marine
coatings
Protective coatings
Waterproofing
Wood Paints
Manufacturing
facility at Bekasi
(Cikarang) and
Bogor
Yes
Source: Primary interviews with industry participants, and Frost & Sullivan analysis
Key Competitors - Decorative Paint and Coating Retail Market in Myanmar
Name of the
company
Headquarters Subsidiaries Segments present Manufacturing
plants
Cater to
retail
channel
United
Paints Group
Co., Ltd.
Myanmar --- Decorative paints
Architecture paints
Wood coatings
Marine paints Industrial
paints Protective coatings
Yangon
(Myanmar)
Yes
Akzo Nobel
N.V.,
Netherlands Akzo Nobel
Co.,Ltd.
(Yangon)
Decorative paints
Automotive paints
Protective coatings
Waterproofing
Wood Paints
Imports products
from nearby
manufacturing
locations
Yes
TOA Paint
(Thailand)
Public
Company
Limited
Thailand TOA Paint
(Myanmar) Co.
Ltd
TOA Coating
(Myanmar) Co.
Ltd
Decorative
Wood paint
Protective Coatings
Waterproofing
Shwepyitha
Industrial Zone,
Yangon,
Thilawa SEZ,
Yangon,
Yes
Source: Primary interviews with industry participants, and Frost & Sullivan analysis

75
Key Competitors - Decorative Paint and Coating Retail Market in Cambodia
Name of
the
company
Headquarters Subsidiaries
Segments present Manufacturing
plants
Cater to
retail
channel
United
Paints
Group
Co., Ltd.
Myanmar --- Decorative paints
Architecture paints
Wood coatings
Industrial paints
Protective coatings
Imports products
from Myanmar
Yes
Jotun Norway Jotun
(Cambodia)
Ltd., Phnom
Penh (Sales)
Decorative Paints
Protective Paints
Metal Coatings
Powder Coatings
Wood Paints
Imports products
from nearby
manufacturing
locations
Yes
Akzo
Nobel
N.V.,
Netherlands --- Decorative paints Metal
coatings
Marine coatings
Protective coatings
Waterproofing
Wood Paints
Imports products
from nearby
manufacturing
locations
Yes
Source: Primary interviews with industry participants, and Frost & Sullivan analysis
Key Competitors - Decorative Paint and Coating Retail Market in Laos
Name of
the
company
Headquarters Subsidiaries
Segments present Manufacturing
plants
Cater to
retail
channel
United
Paints
Group
Co., Ltd.
Myanmar --- Decorative paints
Architecture paints
Wood coatings
Marine paints
Industrial paints Protective
coatings
Imports products
from Myanmar
Yes
Jotun Norway --- Decorative Paints
Marine Coatings Protective
Paints
Metal Coatings
Powder Coatings
Wood Paints
Imports products
from nearby
manufacturing
locations
Yes
Beger Co.,
Ltd.
Thailand --- Decorative paints
Wood coatings
Construction Chemicals
Heavy Duty Coating
Special Paints
Imports products
from Thailand
and
Indonesia
Yes
Source: Primary interviews with industry participants, and Frost & Sullivan analysis

76
4.1.4. Industry Prospects & Outlook
The retail decorative paint and coating market for Malaysia, Indonesia, Myanmar, Cambodia and Laos combined is
likely to surge from the 2016 level of approximately USD1,224.0 million to approximately USD1,772.4 million by
2021, witnessing a compound annual growth rate (CAGR) of approximately 7.7%. A rise in disposable income,
increasing urbanization, development of the construction and infrastructure industries and launches of new products
is expected fuel the paint and coating industry‟s growth in these five countries.
Multinational paint and coating companies such as AkzoNobel and Nippon Paints are playing an increasingly
important role in the Indonesian and Malaysian decorative paint and coating marketplace; whereas local
manufacturers such as UPG in Myanmar have a strong foothold in the decorative marketplace. Volatility of the local
currency and international oil prices are likely to continue to remain a challenge to the paint and coating industry. To
combat this, some paint and coating companies have adapted backward integration with an aim to achieve better
margins. For example, Akzo Nobel manufactures paints and coatings and at the same time, it is involved in the
production of raw materials, such as resins.
Increased regulatory pressure and rising public awareness of environmental and health issues have created a greater
demand for low-VOC (volatile organic compound) paints and coatings in recent years, leading to the development
of a new generation of low solvent or solvent-free decorative paints and coatings in the Malaysian and Indonesian
markets. Myanmar‟s investment commission currently requires the submission of environmental impact assessments
while there is no ban on paints and coatings which are harmful (high-VOC) to the environment or human health.
The outlook for the decorative paint and coating market in Malaysia is expected to remain fairly positive, driven by
the change in consumer demands with high standard of living and rapid development of commercial and residential
buildings supported by the significant increases in development expenditure (approximately 16.2% increase from
previous plan) in the 11th Malaysia Plan (2016-2020). Growth in the Indonesian decorative paint and coating market
is expected to continue on its upward trajectory owing to the rapid infrastructure developments, increased FDI and
increased tourism, coupled with establishment of economic development zones. With the opening up of Myanmar,
Laos and Cambodia‟s economies in recent years and the expected construction boom that is likely to be a result of
this liberalization, the near-term (2016-2018) outlook for decorative paint and coating market in these countries is
expected to be positive.
The rest of the page is intentionally left blank

77
5. BRIEF OVERVIEW OF THE SOUTHEAST ASIA NON-DECORATIVE PAINT AND
COATING INDUSTRY
Promising macro-economic conditions in a majority of SEA countries, especially Thailand, Indonesia and Vietnam,
are expected to result in buoyant growth prospects for the non-decorative paint and coating market in the forecast
period.
The SEA protective wood coating segment is driven by exports of locally made wooden furniture as well as low
production and low labor cost relative to its‟ Western counterparts. Vietnam and Indonesia are among the leading
markets for protective wood coatings in SEA. As the world‟s 6th largest wood furniture exporter, Vietnam is slated
to expand its furniture industry at a robust pace with exports of up to approximately USD10.0 billion86
by 2020;
increasing the demand for protective wood coatings. Protective wood coatings is expected to be a major end-user
segment in Vietnam in the forecast period, owing to the importance of the wood processing industry and the robust
demand for Vietnamese-made furniture from export markets around the world. Indonesia is the second largest
protective wood coatings market in SEA, also driven by furniture exports. With abundant natural resources, the
government of Indonesia plans to boost its promotion of wood furniture businesses at international fairs and
exhibitions. The export-oriented market is expected to fuel demand for protective wood coatings as the industry has
a goal to increase exports from approximately USD2.7 billion in 2013 to approximately USD5.0 billion87
by 2020.
The protective wood coatings market in Malaysia and Thailand is affected by the impact of lower-priced imported
furniture from neighboring countries, such as China and Vietnam; limiting the demand for protective wood coating.
Thailand, Malaysia and Indonesia account for a majority of protective (metal and concrete) coatings in SEA, with
the automotive industry acting as a major driver for metal protective coatings. Automotive production is rapidly
growing in Thailand, Indonesia, and Malaysia due to lower production costs and favorable macroeconomic
indicators resulting in a positive impact on the consumption of metal protective coatings. Thailand with a vehicle
production volume of approximately 1.9 million units (2016) is the leader in automotive production in SEA
followed by Indonesia and Malaysia. Thailand‟s automotive production is expected to grow at a CAGR of
approximately 4.2% between 2016 and 2020 and reach approximately 2.3 million units by 2020. Indonesia produced
approximately 1.08 million vehicles in year 2016 and the production is expected to reach approximately 1.29
million by 2020 with a CAGR of approximately 4.5% whereas Malaysia produced approximately 0.65 million
vehicles in year 2016 and is expected to reach nearly approximately 0.7 million by 2020 with a CAGR of
approximately 2.5%. The Malaysian Government also targets for Malaysia to become the regional hub for Energy
Efficient Vehicles (EEV) through strategic investments and adaptation of high technology for domestic market and
to penetrate regional and global markets by 2020. The increase in vehicle production volumes in Thailand, Indonesia
and Malaysia coupled with the Philippine‟s government‟s Comprehensive Automotive Resurgence Strategy (CARS)
to reach a production volume of approximately 0.5 million by 2020 is expected to give a boost to the demand for
automotive metal protective coatings in SEA.
The concrete protective coatings market in Indonesia is likely to expand over the next few years owing to increased
FDI and significant investments in developing transport, energy and utilities infrastructure totaling approximately
USD90.0 billion88
by 2018. Malaysia‟s concrete protective coatings market is driven by investments in developing
transport infrastructure, such as roads and railways and energy and utilities infrastructure, especially refineries and
petrochemical complexes. Investments in developing transport and energy and utilities infrastructure totaling
approximately to USD8.0 billion89
by 2018 are expected to propel the Malaysian concrete protective coatings
market. Thailand‟s concrete protective coatings market is spurred by investments in developing transport
86 http://www.saigon-gpdaily.com.vn/Business/2014/8/110236/ 87 http://kusnandarlaw.blogspot.in/2015/12/the-furniture-industry-still-fells.html 88 Central Bureau of Statistics Indonesia 89 Malaysia Economic Prospect, BMI

78
infrastructure by the government to shift the transport mode from road to rail. The concrete protective coatings
market in Thailand is expected to grow over the next few years supported by investments in developing transport
and energy and utilities infrastructure totaling more than USD70.0 billion90
by 2020. Similarly, Vietnam‟s concrete
protective coatings market is gaining support from investments in developing the transport infrastructure. With
infrastructure projects pursuing the PPP model totaling to investments worth approximately USD200.0 billion91
by
2020, the concrete protective paint and coating sector is anticipated to witness promising trends over the forecast
period.
The market for waterproofing coatings in SEA is driven by growth in high-rise building construction; increasing
public and private investments. Vietnam is one of the key consumers of waterproofing coatings in SEA, driven by
growth of the infrastructure and construction industries, especially in new residential buildings due to increasing
urbanization. Vietnam‟s waterproofing market is further supported by the rising awareness of waterproofing
coatings to ensure long-term sustainability of construction and preventing leakages and water settlement. Thailand‟s
overall retail sales in the waterproofing coatings market saw a slowdown in 2015, mainly due to price drops. As
construction activity speeds up, and more projects approach the waterproofing application stage, an improved
outlook is expected during the forecast period. Liquid-based waterproofing coatings (e.g., PU, Acrylic, Bituminous
based) account for majority of the total market for waterproofing coatings in Thailand. Bangkok and the East region
are prime markets for waterproofing coatings. Project sales are the preferred sales channel while residential
segments leads demand for waterproofing coatings in Thailand. Indonesia‟s waterproofing coatings market is
supported by growing construction activity in both non-residential and residential segments. The waterproofing
coating segment in Indonesia has the highest proportion of high-end products, and customers‟ willingness to pay
premium prices ensures a strong market for waterproofing coatings. Liquid-based waterproofing coatings account
for majority of the total market. The Java region is the focal center of the waterproofing coatings market. Project
sales are the preferred sales channel and non-residential segments leading the demand for the waterproofing coatings
in Indonesia. The outlook for non-decorative waterproofing in Malaysia is expected to be positive due to the rapid
development of commercial and residential buildings supported by the Government‟s plan to increase infrastructure
spending.
Market sizes of non-decorative paints and coatings in Myanmar, Cambodia and Laos are smaller than the markets in
the other SEA countries. However, with the increasing rate of urbanization, growing construction and infrastructure
projects coupled with increased foreign direct investments, the market for non-decorative paints and coatings in
these countries is expected to record positive growth rates in the forecast period.
The rest of the page is intentionally left blank
90 AECOM; Bank of Thailand 91 BMI; General Statistic Office, Vietnam

79
6. OVERVIEW OF PROSPECTS FOR THE COMPANY IN THE INDUSTRY
TOA Paint (Thailand) Public Company Limited is headquartered in Thailand, one of the largest economies in SEA.
The country is on a growth trajectory after temporary setbacks due to the floods, depreciating THB versus USD and
uncertainties in the political environment. Public investment in large infrastructure projects, growth in the
agriculture sector and higher tourist arrivals (13.1% rise compared to 2015) continue to stimulate the economy.
Consequently, an increase in GDP per capita registering a CAGR of 5.2% between 2016 and 2020, moderate
inflation and increase in disposable income are likely to augur well for increased discretionary spending in the
country. The construction industry in Thailand, a key indicator of economic revival, has also been the beneficiary of
the growth story with FDI inflows to the tune of approximately USD3.8 billion in the first half of 2016. Residential
construction activities have also been on the upswing with the government‟s stimulus package for low cost housing
and a steady rise in retail sales index.
As a result of the aforementioned factors, the Thailand retail decorative paint and coating industry has registered
growth rates (2016-2021) of nearly 5.1% in the decorative category to reach THB24.6 billion in 2021.
Vietnam is the largest market for the Company outside of Thailand. The fast-developing economy in Vietnam is a
key driver of the paint and coating industry in the country. The purchasing power of the Vietnamese population
continues to expand with rising income levels. Consumer spending in the retail industry is stimulating demand for
various kinds of goods and services that have direct or indirect linkages with the paint and coating industry.
Construction and housing sectors, for example, are the primary buyers of paints and coatings, especially decorative
coatings. Growing domestic demand and export surplus in the furniture industry also support the growth of the paint
and coating industry.
The Vietnam retail decorative paint and coating industry has registered a growth rate of nearly 9.9% over 2016-2021
mainly driven by heightened activity in the housing market as well as an improvement in overall economic
conditions in the country.
Competitive advantages for The Company
The Company was the market leader in Thailand retail decorative paint and coating industry with approximately
48.7% market share in 2016. The Company was also held second largest retail market share across each of the non-
decorative product categories. Key competitors in the SEA region are large global paint and coating manufacturers
such as Akzo Nobel, Nippon and Jotun among others. The competing domestic paint and coating manufacturers are
Beger in Thailand, 4 Oranges in Vietnam, UPG in Myanmar and Urai Panich in Laos.
To stay ahead of its competitors, the Company has invested in research and development over the years. The
Company was the first paint and coating manufacturer in Thailand and SEA to adopt Acrylic Technology in 1979
and used antimicrobial technology & odor control in its paints and coatings from 2002 before making a switch to
ultra-low VOCS (Volatile organic compound) technology in 2013. Some of the technological advancements such as
Nano Crystal Glass technology, Air Detoxify technology, Triple Nano Titanium technology, 3M Stain Resistance
technology and Micro-fiat Ceramic technology are found in various paint and coating products of The Company. In
addition to that, the Company has also collaborated with various industries such as The Chemours (Thailand)
Company, DOW Chemical Thailand Ltd., Wacker Chemie A.G., Ashland and Amazon Colours; and research
institutes and universities in Thailand such as King Mongkut‟s Institute of Technology Ladkrabang and Thonburi,
Kasetsart University and Naresuan University to co-develop technologies that are used in The Company‟s
production lines.*
Brand positioning and recognition
Existing leading paint and coating manufacturers have a strong brand-recall status in the minds of the retail
consumer by way of their proven track record and established market presence. Traditional retailers also prefer to
stock products of established manufacturers as it gives them better margins by way of a relatively shorter shelf-time
in comparison to lesser known brands.
During the two consecutive years of 2015 and 2016, the Company has earned recognition from the BrandAge
magazine as Thailand‟s Most Admired Company. The Company was also recognized every year by the same
80
magazine as Thailand‟s Most Admired Brand between 2011 and 2016. The Marketeer Magazine also recognized
the Company as the No. 1 Brand Thailand for five consecutive years starting from 2011 to 2016. The Baramizi
Trend and Design Research Lab also named the Company as The Most Powerful Brand in 2015. In the same year,
the Company also received Best Practices Awards from both Frost & Sullivan and the World Branding Awards.*
A strong brand name and recognition not only helps in driving sales of existing products but also gives the Company
an edge over its competitors in terms of launching new products in existing markets effectively.
Distribution channel advantages
Thailand has a relatively low population density of 134 persons per square kilometer compared to regional
neighbors such as Vietnam (308) and Indonesia (146)92
, necessitating the importance of a robust distribution
network to cater to the wide-spread population. Existing large paint and coating manufacturers already have a
strong distribution network by virtue of their long-standing presence in the industry generating approximately 75.0%
to 80.0% sales from their retail dealer distribution channel.
The Company has an extensive distribution channel in Thailand and the SEA. The four major distribution channels
of the Company are retail dealers, modern trade distributors, projects and exports. There are a total of approximately
5,300 retailers across 77 provinces in Thailand that sell the Company‟s paints and coatings as compared to the
second largest retail market share holder of decorative paints and coatings in Thailand, Beger Co., Ltd, which has
access to approximately 4,000 retail dealers. Apart from this, the Company also has access to approximately 2,400
retail dealers across the different countries in the AEC region*.
In its modern trade distribution channel, the Company sells to large chain stores such as HomeWorks, Thai
Watsadu, Global House and Boonthavorn in Thailand, HomePro in Thailand and Malaysia, Asia Center and Pro1 in
Myanmar, and Mitra 10, Depo Bagunan, Istana Bagunan Nusantara and Tirta Bagunan Baru in Indonesia. The
Company‟s projects distribution channel comprises of projects for governments, and with property developers and
real estate companies such as Sansiri, Land & Houses, Q House, Property Perfect and Golden Land Property in
Thailand, Cowell Development, Tamara Land, SpringHill Group and AKR Land in Indonesia, Hoang Anh Gia Lai
in Vietnam, and Borey Lim Cheanghak and Daun Penh Land in Cambodia. The Company has approximately 400 of
its product consultants placed with its modern trade distributors. These consultants help drive demand of the
Company‟s paint and coating products, promote new products to the modern trade distributors as well as provide
customer service and local market insights*.
The Company has also benefitted from wholesale export to a large number of countries within the AEC such as
Malaysia, Singapore, Brunei, Philippines, Indonesia, Cambodia, Laos, Myanmar and Vietnam, as well as to other
countries outside the AEC, namely, Maldives, China, India, Australia, Ghana, Pakistan, Sri Lanka, United Arab
Emirates, Lebanon, Cook Islands, Bangladesh and Nigeria. The Company also maintains sales offices in its key
markets in the AEC outside Thailand, such as Vietnam, Laos, Malaysia, Indonesia, Myanmar and Cambodia*.
The Company is also planning to develop an online distribution channel by leveraging its extensive distribution
network across Thailand. An e-commerce technology platform is currently being tested which is likely to help the
Company roll-out an online sales channel that caters to end users who will be able to buy the Company‟s paint and
coating products online*.
Note: * Content in paragraphs marked with an ‘*’ are based on information shared by The Company.
92 http://data.worldbank.org/indicator/EN.POP.DNST