
Independent Equity Research Rating by CRISIL
25
Transcript of Independent Equity Research Rating by CRISIL
RESEARCH
CRISIL IER Independent Equity Research
Enhancing investment decisions
Dhanuka Agritech Ltd
Detailed Report
CRISIL IER Independent Equity Research
Explanation of CRISIL Fundamental and Valuation (CFV) matrix
The CFV Matrix (CRISIL Fundamental and Valuation Matrix) addresses the two important analysis of an investment making process – Analysis of Fundamentals (addressed through Fundamental Grade) and Analysis of Returns (Valuation Grade) The fundamental grade is assigned on a five-point scale from grade 5 (indicating Excellent fundamentals) to grade 1 (Poor fundamentals) The valuation grade is assigned on a five-point scale from grade 5 (indicating strong upside from the current market price (CMP)) to grade 1 (strong downside from the CMP).
CRISIL Fundamental Grade Assessment
CRISIL Valuation Grade Assessment
5/5 Excellent fundamentals 5/5 Strong upside (>25% from CMP) 4/5 Superior fundamentals 4/5 Upside (10-25% from CMP) 3/5 Good fundamentals 3/5 Align (+-10% from CMP) 2/5 Moderate fundamentals 2/5 Downside (negative 10-25% from CMP) 1/5 Poor fundamentals 1/5 Strong downside (<-25% from CMP)
About CRISIL Limited CRISIL is a global analytical company providing ratings, research, and risk and policy advisory services. We are India’s leading ratings agency. We are also the foremost provider of high-end research to the world’s largest banks and leading corporations. About CRISIL Research CRISIL Research is India's largest independent integrated research house. We provide insights, opinion and analysis on the Indian economy, industry, capital markets and companies. We also conduct training programs to financial sector professionals on a wide array of technical issues. We are India's most credible provider of economy and industry research. Our industry research covers 86 sectors and is known for its rich insights and perspectives. Our analysis is supported by inputs from our network of more than 5,000 primary sources, including industry experts, industry associations and trade channels. We play a key role in India's fixed income markets. We are the largest provider of valuation of fixed income securities to the mutual fund, insurance and banking industries in the country. We are also the sole provider of debt and hybrid indices to India's mutual fund and life insurance industries. We pioneered independent equity research in India, and are today the country's largest independent equity research house. Our defining trait is the ability to convert information and data into expert judgements and forecasts with complete objectivity. We leverage our deep understanding of the macro-economy and our extensive sector coverage to provide unique insights on micro-macro and cross-sectoral linkages. Our talent pool comprises economists, sector experts, company analysts and information management specialists. CRISIL Privacy CRISIL respects your privacy. We use your contact information, such as your name, address, and email id, to fulfil your request and service your account and to provide you with additional information from CRISIL and other parts of McGraw Hill Financial you may find of interest.
For further information, or to let us know your preferences with respect to receiving marketing materials, please visit www.crisil.com/privacy. You can view McGraw Hill Financial’s Customer Privacy Policy at http://www.mhfi.com/privacy.
Last updated: August, 2014 Analyst Disclosure Each member of the team involved in the preparation of the grading report, hereby affirms that there exists no conflict of interest that can bias the grading recommendation of the company. Disclaimer: This Company commissioned CRISIL IER report is based on data publicly available or from sources considered reliable. CRISIL Ltd. (CRISIL) does not represent that it is accurate or complete and hence, it should not be relied upon as such. The data / report is subject to change without any prior notice. Opinions expressed herein are our current opinions as on the date of this report. Nothing in this report constitutes investment, legal, accounting or tax advice or any solicitation, whatsoever. The subscriber / user assume the entire risk of any use made of this data / report. CRISIL especially states that, it has no financial liability whatsoever, to the subscribers / users of this report. This report is for the personal information only of the authorised recipient in India only. This report should not be reproduced or redistributed or communicated directly or indirectly in any form to any other person – especially outside India or published or copied in whole or in part, for any purpose. As per CRISIL’s records, none of the analysts involved has any ownership / directorship in the company. However CRISIL or its associates may have commercial transactions with the company.
RESEARCH
Dhanuka Agritech Ltd
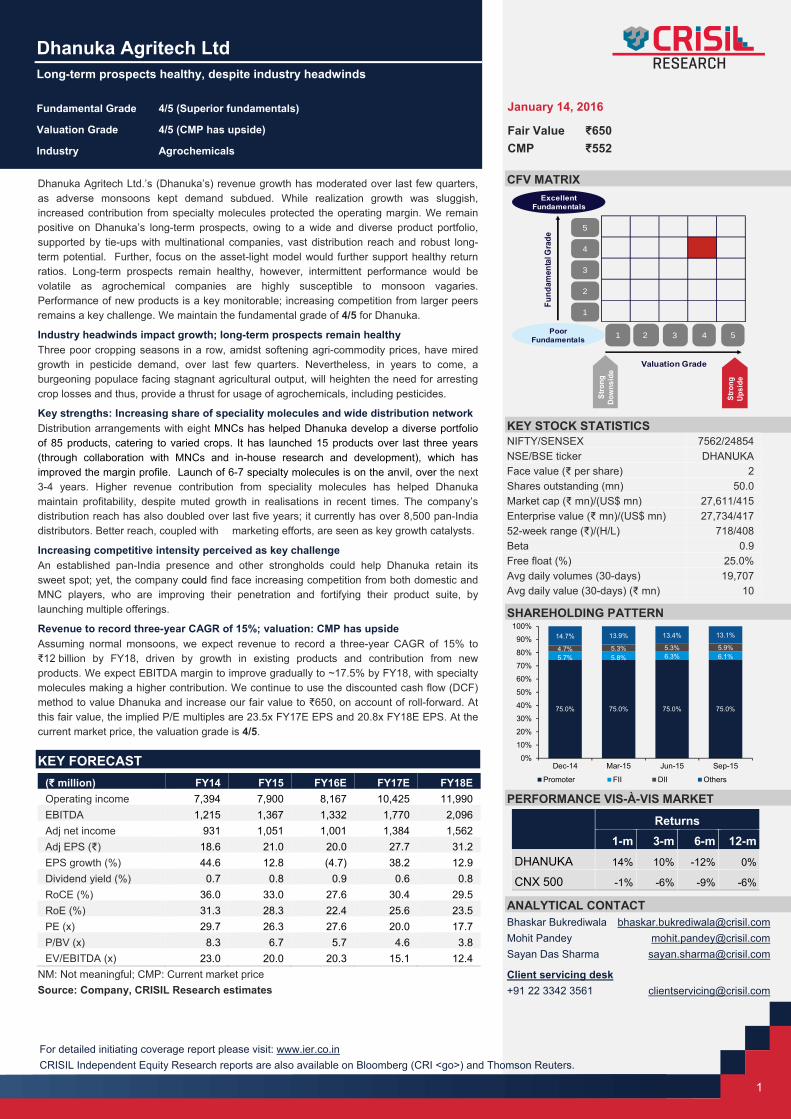
Long-term prospects healthy, despite industry headwinds
Fundamental Grade 4/5 (Superior fundamentals)
Valuation Grade 4/5 (CMP has upside)
Industry Agrochemicals
1
January 14, 2016
Fair Value ₹650 CMP ₹552
For detailed initiating coverage report please visit: www.ier.co.in CRISIL Independent Equity Research reports are also available on Bloomberg (CRI <go>) and Thomson Reuters.
Dhanuka Agritech Ltd.’s (Dhanuka’s) revenue growth has moderated over last few quarters, as adverse monsoons kept demand subdued. While realization growth was sluggish, increased contribution from specialty molecules protected the operating margin. We remain positive on Dhanuka’s long-term prospects, owing to a wide and diverse product portfolio, supported by tie-ups with multinational companies, vast distribution reach and robust long-term potential. Further, focus on the asset-light model would further support healthy return ratios. Long-term prospects remain healthy, however, intermittent performance would be volatile as agrochemical companies are highly susceptible to monsoon vagaries. Performance of new products is a key monitorable; increasing competition from larger peers remains a key challenge. We maintain the fundamental grade of 4/5 for Dhanuka.
Industry headwinds impact growth; long-term prospects remain healthy Three poor cropping seasons in a row, amidst softening agri-commodity prices, have mired growth in pesticide demand, over last few quarters. Nevertheless, in years to come, a burgeoning populace facing stagnant agricultural output, will heighten the need for arresting crop losses and thus, provide a thrust for usage of agrochemicals, including pesticides.
Key strengths: Increasing share of speciality molecules and wide distribution network Distribution arrangements with eight MNCs has helped Dhanuka develop a diverse portfolio of 85 products, catering to varied crops. It has launched 15 products over last three years (through collaboration with MNCs and in-house research and development), which has improved the margin profile. Launch of 6-7 specialty molecules is on the anvil, over the next 3-4 years. Higher revenue contribution from speciality molecules has helped Dhanuka maintain profitability, despite muted growth in realisations in recent times. The company’s distribution reach has also doubled over last five years; it currently has over 8,500 pan-India distributors. Better reach, coupled with marketing efforts, are seen as key growth catalysts.
Increasing competitive intensity perceived as key challenge An established pan-India presence and other strongholds could help Dhanuka retain its sweet spot; yet, the company could find face increasing competition from both domestic and MNC players, who are improving their penetration and fortifying their product suite, by launching multiple offerings.
Revenue to record three-year CAGR of 15%; valuation: CMP has upside Assuming normal monsoons, we expect revenue to record a three-year CAGR of 15% to ₹12 billion by FY18, driven by growth in existing products and contribution from new products. We expect EBITDA margin to improve gradually to ~17.5% by FY18, with specialty molecules making a higher contribution. We continue to use the discounted cash flow (DCF) method to value Dhanuka and increase our fair value to ₹650, on account of roll-forward. At this fair value, the implied P/E multiples are 23.5x FY17E EPS and 20.8x FY18E EPS. At the current market price, the valuation grade is 4/5.
KEY FORECAST
(₹ million) FY14 FY15 FY16E FY17E FY18E Operating income 7,394 7,900 8,167 10,425 11,990 EBITDA 1,215 1,367 1,332 1,770 2,096 Adj net income 931 1,051 1,001 1,384 1,562 Adj EPS (₹) 18.6 21.0 20.0 27.7 31.2 EPS growth (%) 44.6 12.8 (4.7) 38.2 12.9 Dividend yield (%) 0.7 0.8 0.9 0.6 0.8 RoCE (%) 36.0 33.0 27.6 30.4 29.5 RoE (%) 31.3 28.3 22.4 25.6 23.5 PE (x) 29.7 26.3 27.6 20.0 17.7 P/BV (x) 8.3 6.7 5.7 4.6 3.8 EV/EBITDA (x) 23.0 20.0 20.3 15.1 12.4
NM: Not meaningful; CMP: Current market price Source: Company, CRISIL Research estimates
CFV MATRIX
KEY STOCK STATISTICS NIFTY/SENSEX 7562/24854 NSE/BSE ticker DHANUKA Face value (₹ per share) 2 Shares outstanding (mn) 50.0 Market cap (₹ mn)/(US$ mn) 27,611/415 Enterprise value (₹ mn)/(US$ mn) 27,734/417 52-week range (₹)/(H/L) 718/408 Beta 0.9 Free float (%) 25.0% Avg daily volumes (30-days) 19,707 Avg daily value (30-days) (₹ mn) 10
SHAREHOLDING PATTERN
PERFORMANCE VIS-À-VIS MARKET
Returns
1-m 3-m 6-m 12-mDHANUKA 14% 10% -12% 0%
CNX 500 -1% -6% -9% -6%
ANALYTICAL CONTACT Bhaskar Bukrediwala [email protected] Mohit Pandey [email protected] Sayan Das Sharma [email protected]
Client servicing desk +91 22 3342 3561 [email protected]
1 2 3 4 5
1
2
3
4
5
Valuation Grade
Fund
amen
tal G
rade
Poor Fundamentals
ExcellentFundamentals
Stro
ngDo
wns
ide
Stro
ngUp
side
75.0% 75.0% 75.0% 75.0%
5.7% 5.8% 6.3% 6.1%4.7% 5.3% 5.3% 5.9%
14.7% 13.9% 13.4% 13.1%
0%
10%
20%
30%
40%
50%
60%
70%
80%
90%
100%
Dec-14 Mar-15 Jun-15 Sep-15
Promoter FII DII Others
CRISIL IER Independent Equity Research
2
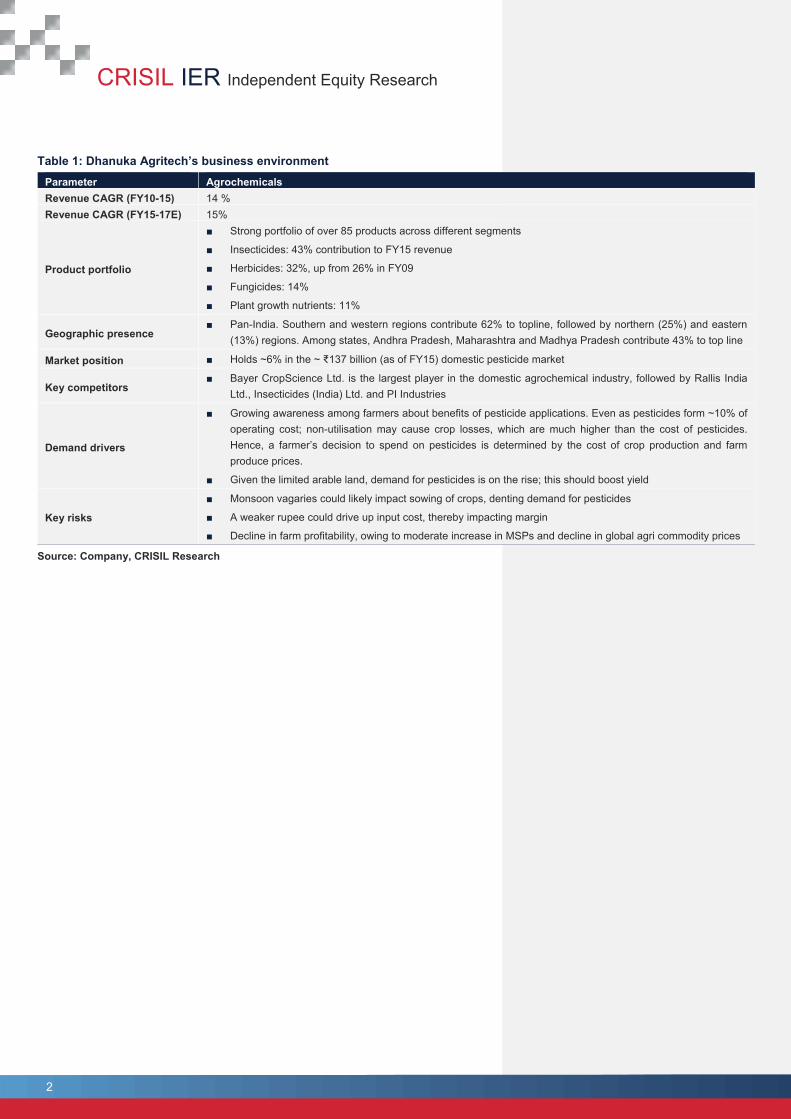
Table 1: Dhanuka Agritech’s business environment Parameter Agrochemicals Revenue CAGR (FY10-15) 14 % Revenue CAGR (FY15-17E) 15%
Product portfolio
■ Strong portfolio of over 85 products across different segments
■ Insecticides: 43% contribution to FY15 revenue
■ Herbicides: 32%, up from 26% in FY09
■ Fungicides: 14%
■ Plant growth nutrients: 11%
Geographic presence ■ Pan-India. Southern and western regions contribute 62% to topline, followed by northern (25%) and eastern
(13%) regions. Among states, Andhra Pradesh, Maharashtra and Madhya Pradesh contribute 43% to top line
Market position ■ Holds ~6% in the ~ ₹137 billion (as of FY15) domestic pesticide market
Key competitors ■ Bayer CropScience Ltd. is the largest player in the domestic agrochemical industry, followed by Rallis India
Ltd., Insecticides (India) Ltd. and PI Industries
Demand drivers
■ Growing awareness among farmers about benefits of pesticide applications. Even as pesticides form ~10% of operating cost; non-utilisation may cause crop losses, which are much higher than the cost of pesticides. Hence, a farmer’s decision to spend on pesticides is determined by the cost of crop production and farm produce prices.
■ Given the limited arable land, demand for pesticides is on the rise; this should boost yield
Key risks
■ Monsoon vagaries could likely impact sowing of crops, denting demand for pesticides
■ A weaker rupee could drive up input cost, thereby impacting margin
■ Decline in farm profitability, owing to moderate increase in MSPs and decline in global agri commodity prices
Source: Company, CRISIL Research
RESEARCH
Dhanuka Agritech Ltd
3
Grading Rationale
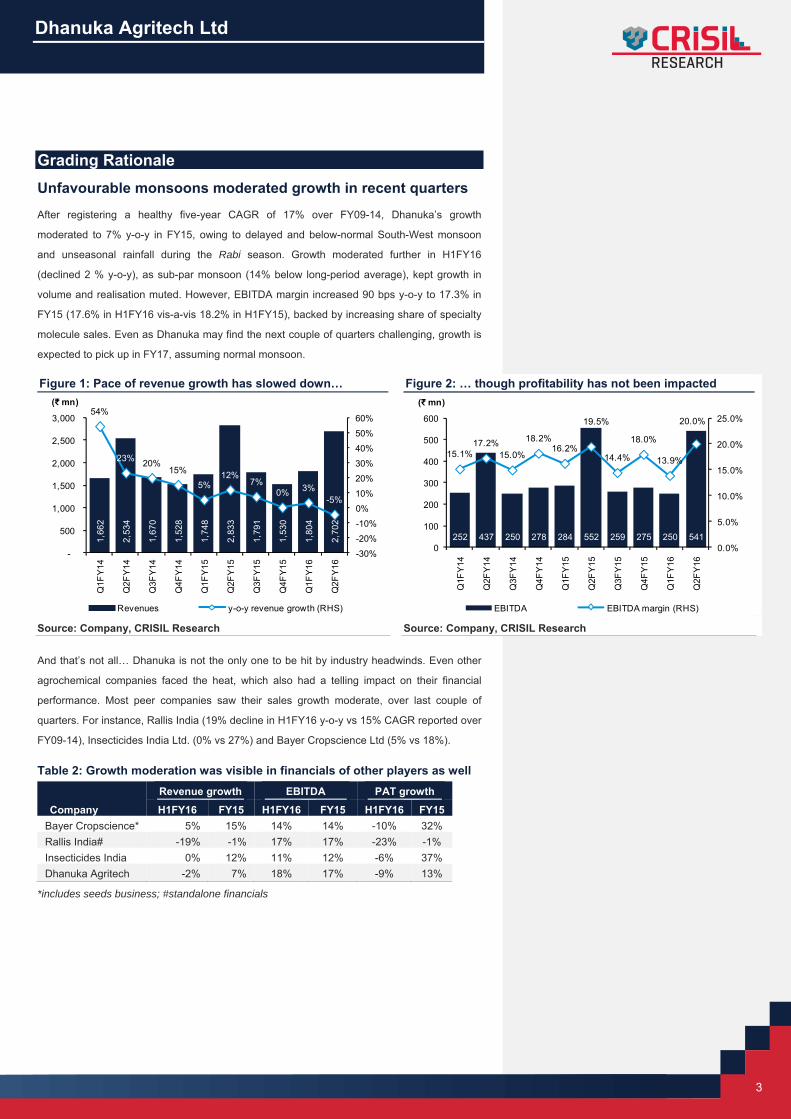
Unfavourable monsoons moderated growth in recent quarters After registering a healthy five-year CAGR of 17% over FY09-14, Dhanuka’s growth
moderated to 7% y-o-y in FY15, owing to delayed and below-normal South-West monsoon
and unseasonal rainfall during the Rabi season. Growth moderated further in H1FY16
(declined 2 % y-o-y), as sub-par monsoon (14% below long-period average), kept growth in
volume and realisation muted. However, EBITDA margin increased 90 bps y-o-y to 17.3% in
FY15 (17.6% in H1FY16 vis-a-vis 18.2% in H1FY15), backed by increasing share of specialty
molecule sales. Even as Dhanuka may find the next couple of quarters challenging, growth is
expected to pick up in FY17, assuming normal monsoon. Figure 1: Pace of revenue growth has slowed down… Figure 2: … though profitability has not been impacted
Source: Company, CRISIL Research Source: Company, CRISIL Research
And that’s not all… Dhanuka is not the only one to be hit by industry headwinds. Even other
agrochemical companies faced the heat, which also had a telling impact on their financial
performance. Most peer companies saw their sales growth moderate, over last couple of
quarters. For instance, Rallis India (19% decline in H1FY16 y-o-y vs 15% CAGR reported over
FY09-14), Insecticides India Ltd. (0% vs 27%) and Bayer Cropscience Ltd (5% vs 18%). Table 2: Growth moderation was visible in financials of other players as well
Company
Revenue growth EBITDA PAT growth
H1FY16 FY15 H1FY16 FY15 H1FY16 FY15 Bayer Cropscience* 5% 15% 14% 14% -10% 32% Rallis India# -19% -1% 17% 17% -23% -1% Insecticides India 0% 12% 11% 12% -6% 37% Dhanuka Agritech -2% 7% 18% 17% -9% 13%
*includes seeds business; #standalone financials
1,66
2
2,53
4
1,67
0
1,52
8
1,74
8
2,83
3
1,79
1
1,53
0
1,80
4
2,70
2
54%
23% 20%15%
5%12%
7%0% 3%
-5%
-30%
-20%
-10%
0%
10%
20%
30%
40%
50%
60%
-
500
1,000
1,500
2,000
2,500
3,000
Q1F
Y14
Q2F
Y14
Q3F
Y14
Q4F
Y14
Q1F
Y15
Q2F
Y15
Q3F
Y15
Q4F
Y15
Q1F
Y16
Q2F
Y16
(₹ mn)
Revenues y-o-y revenue growth (RHS)
252 437 250 278 284 552 259 275 250 541
15.1%17.2%
15.0%
18.2%16.2%
19.5%
14.4%
18.0%
13.9%
20.0%
0.0%
5.0%
10.0%
15.0%
20.0%
25.0%
0
100
200
300
400
500
600
Q1F
Y14
Q2F
Y14
Q3F
Y14
Q4F
Y14
Q1F
Y15
Q2F
Y15
Q3F
Y15
Q4F
Y15
Q1F
Y16
Q2F
Y16
(₹ mn)
EBITDA EBITDA margin (RHS)
CRISIL IER Independent Equity Research
4
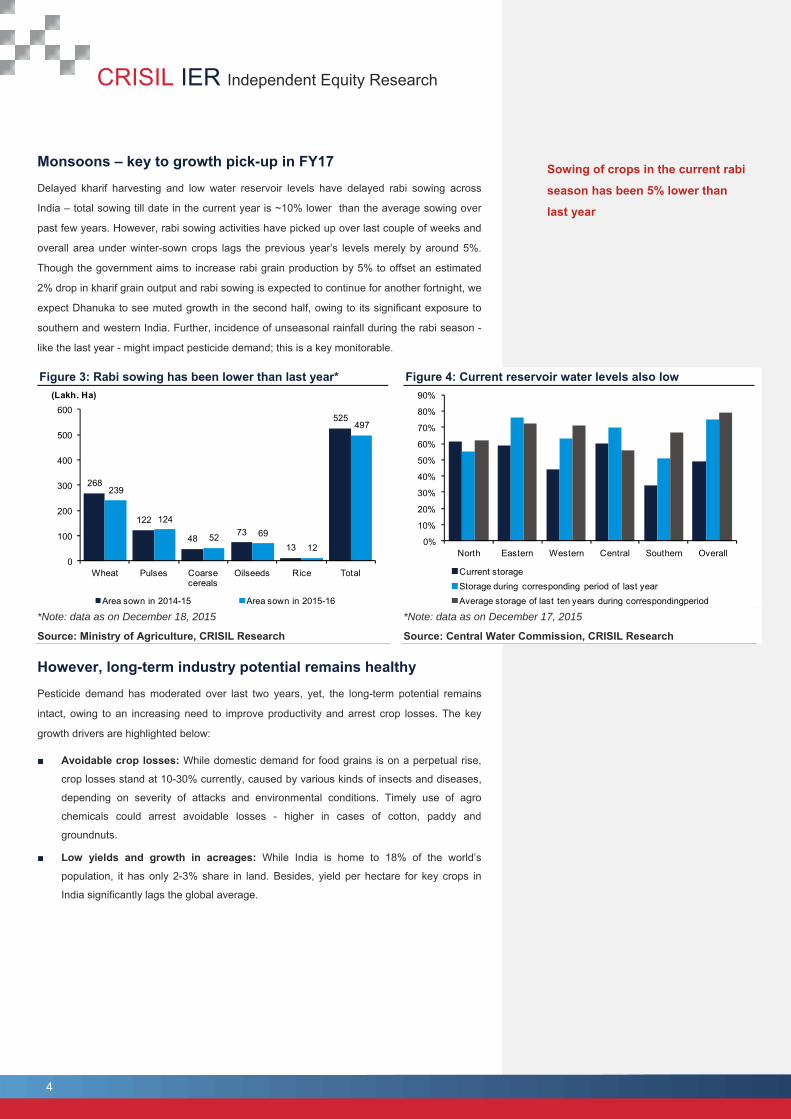
Monsoons – key to growth pick-up in FY17 Delayed kharif harvesting and low water reservoir levels have delayed rabi sowing across
India – total sowing till date in the current year is ~10% lower than the average sowing over
past few years. However, rabi sowing activities have picked up over last couple of weeks and
overall area under winter-sown crops lags the previous year’s levels merely by around 5%.
Though the government aims to increase rabi grain production by 5% to offset an estimated
2% drop in kharif grain output and rabi sowing is expected to continue for another fortnight, we
expect Dhanuka to see muted growth in the second half, owing to its significant exposure to
southern and western India. Further, incidence of unseasonal rainfall during the rabi season -
like the last year - might impact pesticide demand; this is a key monitorable. Figure 3: Rabi sowing has been lower than last year* Figure 4: Current reservoir water levels also low
*Note: data as on December 18, 2015
Source: Ministry of Agriculture, CRISIL Research
*Note: data as on December 17, 2015
Source: Central Water Commission, CRISIL Research
However, long-term industry potential remains healthy Pesticide demand has moderated over last two years, yet, the long-term potential remains
intact, owing to an increasing need to improve productivity and arrest crop losses. The key
growth drivers are highlighted below:
■ Avoidable crop losses: While domestic demand for food grains is on a perpetual rise,
crop losses stand at 10-30% currently, caused by various kinds of insects and diseases,
depending on severity of attacks and environmental conditions. Timely use of agro
chemicals could arrest avoidable losses - higher in cases of cotton, paddy and
groundnuts.
■ Low yields and growth in acreages: While India is home to 18% of the world’s
population, it has only 2-3% share in land. Besides, yield per hectare for key crops in
India significantly lags the global average.
268
122
4873
13
525
239
124
52 6912
497
0
100
200
300
400
500
600
Wheat Pulses Coarse cereals
Oilseeds Rice Total
(Lakh. Ha)
Area sown in 2014-15 Area sown in 2015-16
0%
10%
20%
30%
40%
50%
60%
70%
80%
90%
North Eastern Western Central Southern Overall
Current storage Storage during corresponding period of last yearAverage storage of last ten years during correspondingperiod
Sowing of crops in the current rabi
season has been 5% lower than
last year
RESEARCH
Dhanuka Agritech Ltd
5
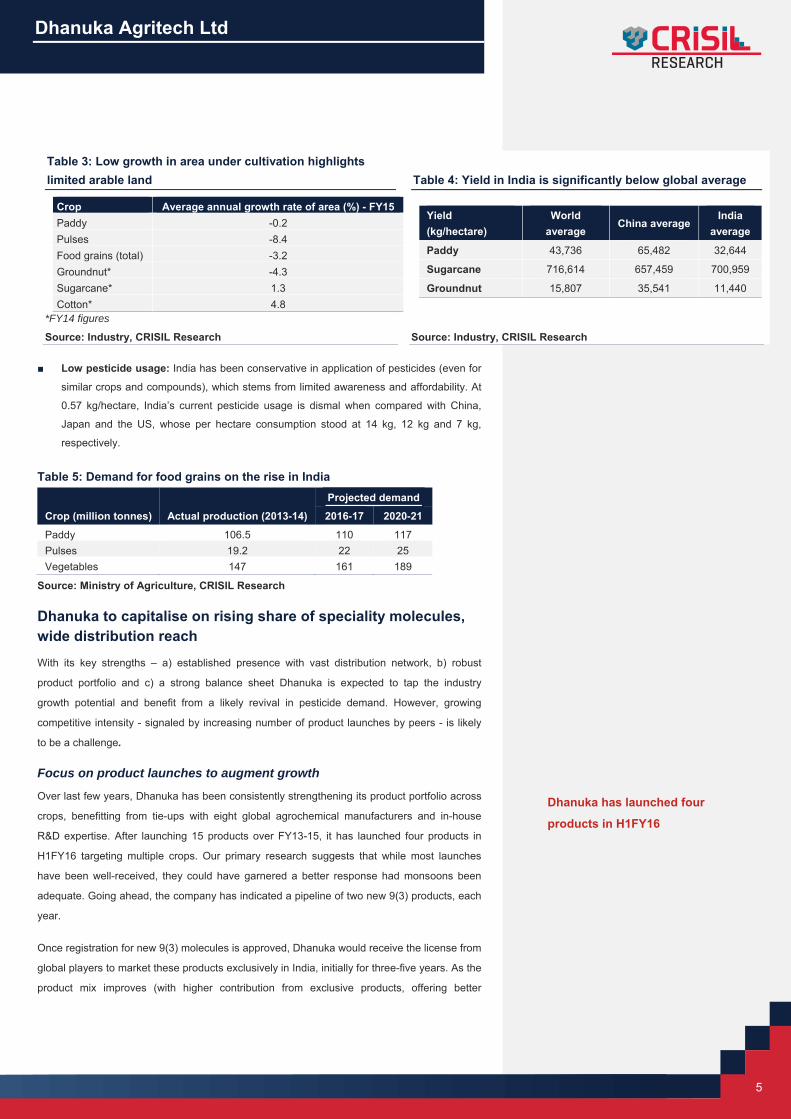
Table 3: Low growth in area under cultivation highlights limited arable land Table 4: Yield in India is significantly below global average
Crop Average annual growth rate of area (%) - FY15 Paddy -0.2 Pulses -8.4 Food grains (total) -3.2 Groundnut* -4.3 Sugarcane* 1.3 Cotton* 4.8
Yield (kg/hectare)
World average
China average India
average
Paddy 43,736 65,482 32,644
Sugarcane 716,614 657,459 700,959
Groundnut 15,807 35,541 11,440
*FY14 figures
Source: Industry, CRISIL Research Source: Industry, CRISIL Research ■ Low pesticide usage: India has been conservative in application of pesticides (even for
similar crops and compounds), which stems from limited awareness and affordability. At
0.57 kg/hectare, India’s current pesticide usage is dismal when compared with China,
Japan and the US, whose per hectare consumption stood at 14 kg, 12 kg and 7 kg,
respectively. Table 5: Demand for food grains on the rise in India
Crop (million tonnes) Actual production (2013-14)
Projected demand
2016-17 2020-21
Paddy 106.5 110 117 Pulses 19.2 22 25 Vegetables 147 161 189
Source: Ministry of Agriculture, CRISIL Research
Dhanuka to capitalise on rising share of speciality molecules, wide distribution reach With its key strengths – a) established presence with vast distribution network, b) robust
product portfolio and c) a strong balance sheet Dhanuka is expected to tap the industry
growth potential and benefit from a likely revival in pesticide demand. However, growing
competitive intensity - signaled by increasing number of product launches by peers - is likely
to be a challenge. Focus on product launches to augment growth
Over last few years, Dhanuka has been consistently strengthening its product portfolio across
crops, benefitting from tie-ups with eight global agrochemical manufacturers and in-house
R&D expertise. After launching 15 products over FY13-15, it has launched four products in
H1FY16 targeting multiple crops. Our primary research suggests that while most launches
have been well-received, they could have garnered a better response had monsoons been
adequate. Going ahead, the company has indicated a pipeline of two new 9(3) products, each
year.
Once registration for new 9(3) molecules is approved, Dhanuka would receive the license from
global players to market these products exclusively in India, initially for three-five years. As the
product mix improves (with higher contribution from exclusive products, offering better
Dhanuka has launched four
products in H1FY16
CRISIL IER Independent Equity Research
6
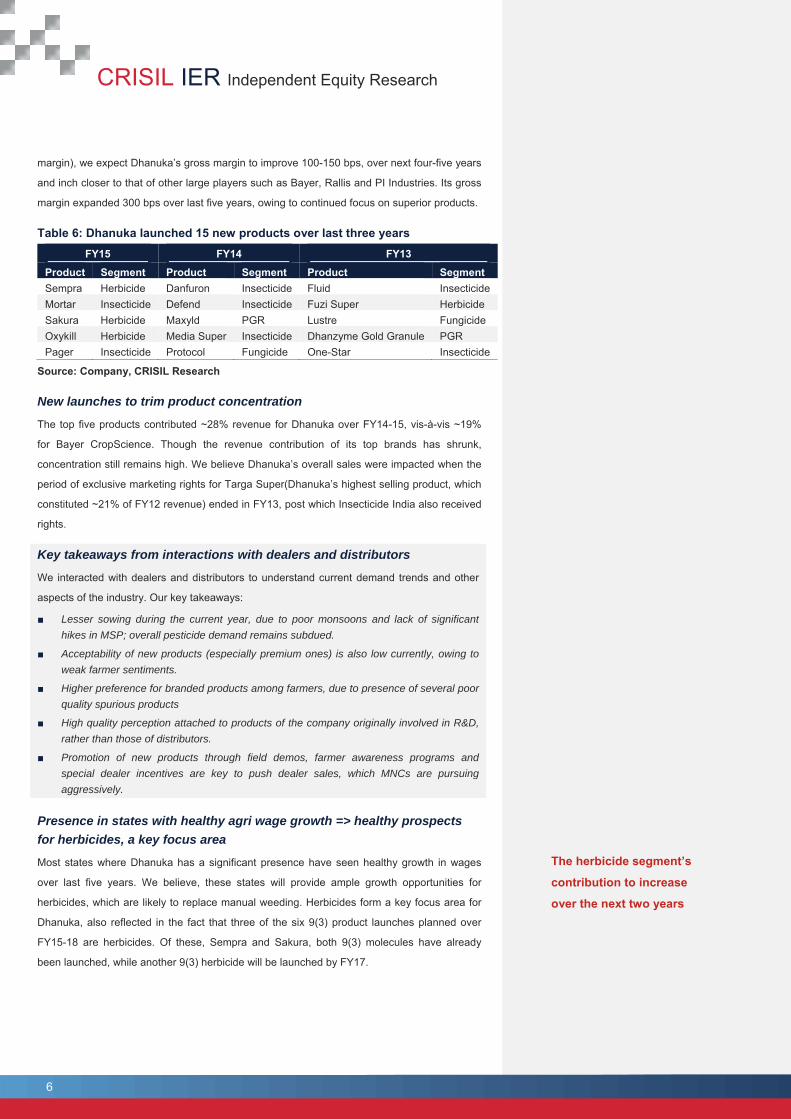
margin), we expect Dhanuka’s gross margin to improve 100-150 bps, over next four-five years
and inch closer to that of other large players such as Bayer, Rallis and PI Industries. Its gross
margin expanded 300 bps over last five years, owing to continued focus on superior products. Table 6: Dhanuka launched 15 new products over last three years
FY15 FY14 FY13
Product Segment Product Segment Product Segment Sempra Herbicide Danfuron Insecticide Fluid Insecticide Mortar Insecticide Defend Insecticide Fuzi Super Herbicide Sakura Herbicide Maxyld PGR Lustre Fungicide Oxykill Herbicide Media Super Insecticide Dhanzyme Gold Granule PGR Pager Insecticide Protocol Fungicide One-Star Insecticide
Source: Company, CRISIL Research New launches to trim product concentration
The top five products contributed ~28% revenue for Dhanuka over FY14-15, vis-à-vis ~19%
for Bayer CropScience. Though the revenue contribution of its top brands has shrunk,
concentration still remains high. We believe Dhanuka’s overall sales were impacted when the
period of exclusive marketing rights for Targa Super(Dhanuka’s highest selling product, which
constituted ~21% of FY12 revenue) ended in FY13, post which Insecticide India also received
rights. Key takeaways from interactions with dealers and distributors
We interacted with dealers and distributors to understand current demand trends and other
aspects of the industry. Our key takeaways:
■ Lesser sowing during the current year, due to poor monsoons and lack of significant hikes in MSP; overall pesticide demand remains subdued.
■ Acceptability of new products (especially premium ones) is also low currently, owing to weak farmer sentiments.
■ Higher preference for branded products among farmers, due to presence of several poor quality spurious products
■ High quality perception attached to products of the company originally involved in R&D, rather than those of distributors.
■ Promotion of new products through field demos, farmer awareness programs and special dealer incentives are key to push dealer sales, which MNCs are pursuing aggressively.
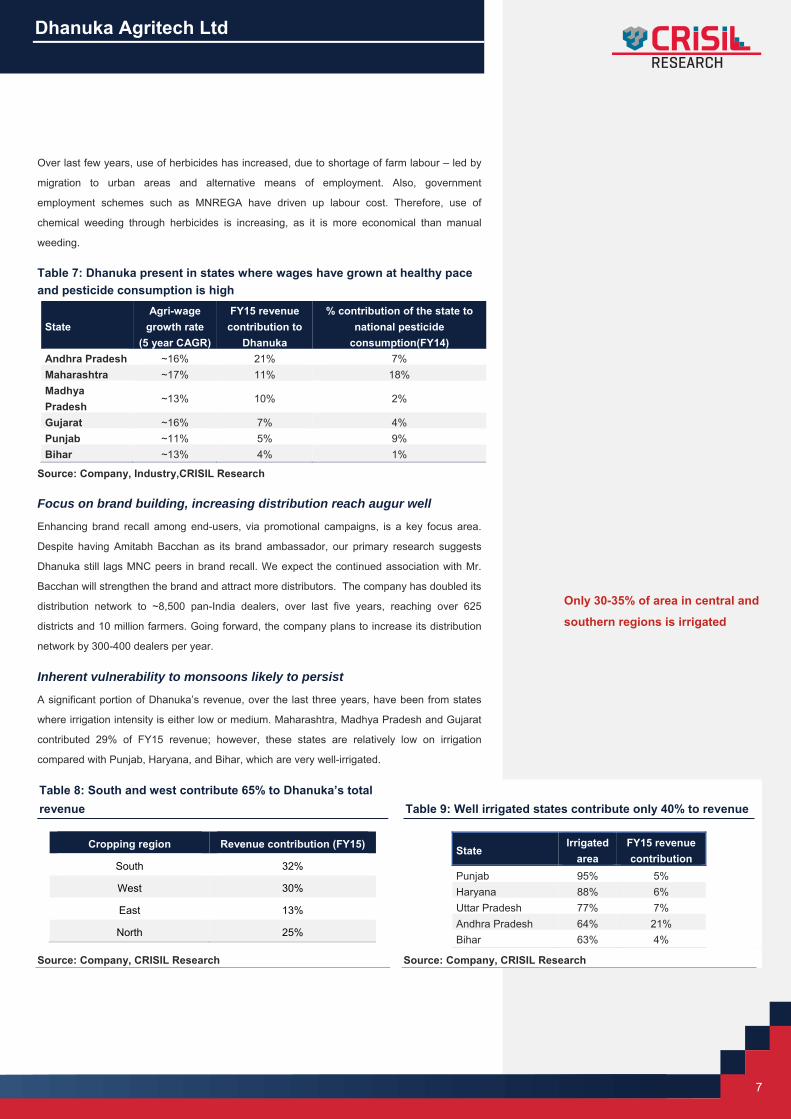
Presence in states with healthy agri wage growth => healthy prospects for herbicides, a key focus area
Most states where Dhanuka has a significant presence have seen healthy growth in wages
over last five years. We believe, these states will provide ample growth opportunities for
herbicides, which are likely to replace manual weeding. Herbicides form a key focus area for
Dhanuka, also reflected in the fact that three of the six 9(3) product launches planned over
FY15-18 are herbicides. Of these, Sempra and Sakura, both 9(3) molecules have already
been launched, while another 9(3) herbicide will be launched by FY17.
The herbicide segment’s
contribution to increase
over the next two years
RESEARCH
Dhanuka Agritech Ltd
7
Over last few years, use of herbicides has increased, due to shortage of farm labour – led by
migration to urban areas and alternative means of employment. Also, government
employment schemes such as MNREGA have driven up labour cost. Therefore, use of
chemical weeding through herbicides is increasing, as it is more economical than manual
weeding. Table 7: Dhanuka present in states where wages have grown at healthy pace and pesticide consumption is high
State Agri-wage
growth rate (5 year CAGR)
FY15 revenue contribution to
Dhanuka
% contribution of the state to national pesticide
consumption(FY14) Andhra Pradesh ~16% 21% 7% Maharashtra ~17% 11% 18% Madhya Pradesh
~13% 10% 2%
Gujarat ~16% 7% 4% Punjab ~11% 5% 9% Bihar ~13% 4% 1%
Source: Company, Industry,CRISIL Research
Focus on brand building, increasing distribution reach augur well
Enhancing brand recall among end-users, via promotional campaigns, is a key focus area.
Despite having Amitabh Bacchan as its brand ambassador, our primary research suggests
Dhanuka still lags MNC peers in brand recall. We expect the continued association with Mr.
Bacchan will strengthen the brand and attract more distributors. The company has doubled its
distribution network to ~8,500 pan-India dealers, over last five years, reaching over 625
districts and 10 million farmers. Going forward, the company plans to increase its distribution
network by 300-400 dealers per year. Inherent vulnerability to monsoons likely to persist
A significant portion of Dhanuka’s revenue, over the last three years, have been from states
where irrigation intensity is either low or medium. Maharashtra, Madhya Pradesh and Gujarat
contributed 29% of FY15 revenue; however, these states are relatively low on irrigation
compared with Punjab, Haryana, and Bihar, which are very well-irrigated. Table 8: South and west contribute 65% to Dhanuka’s total revenue Table 9: Well irrigated states contribute only 40% to revenue
Cropping region Revenue contribution (FY15)
South 32%
West 30%
East 13%
North 25%
State Irrigated
area FY15 revenue contribution
Punjab 95% 5% Haryana 88% 6% Uttar Pradesh 77% 7% Andhra Pradesh 64% 21% Bihar 63% 4%
Source: Company, CRISIL Research Source: Company, CRISIL Research
Only 30-35% of area in central and
southern regions is irrigated
CRISIL IER Independent Equity Research
8
Commissioning of new plant at Keshwana to support future growth Dhanuka will be commissioning its new plant at Keshwana, Rajasthan by March 2016. Built at
a cost of ~Rs. 500 million, the company plans to shift production from its current
manufacturing facility in Gurgaon to Keshwana, once the new facility stabilises. The
company’s capacity is consequently expected to nearly triple.
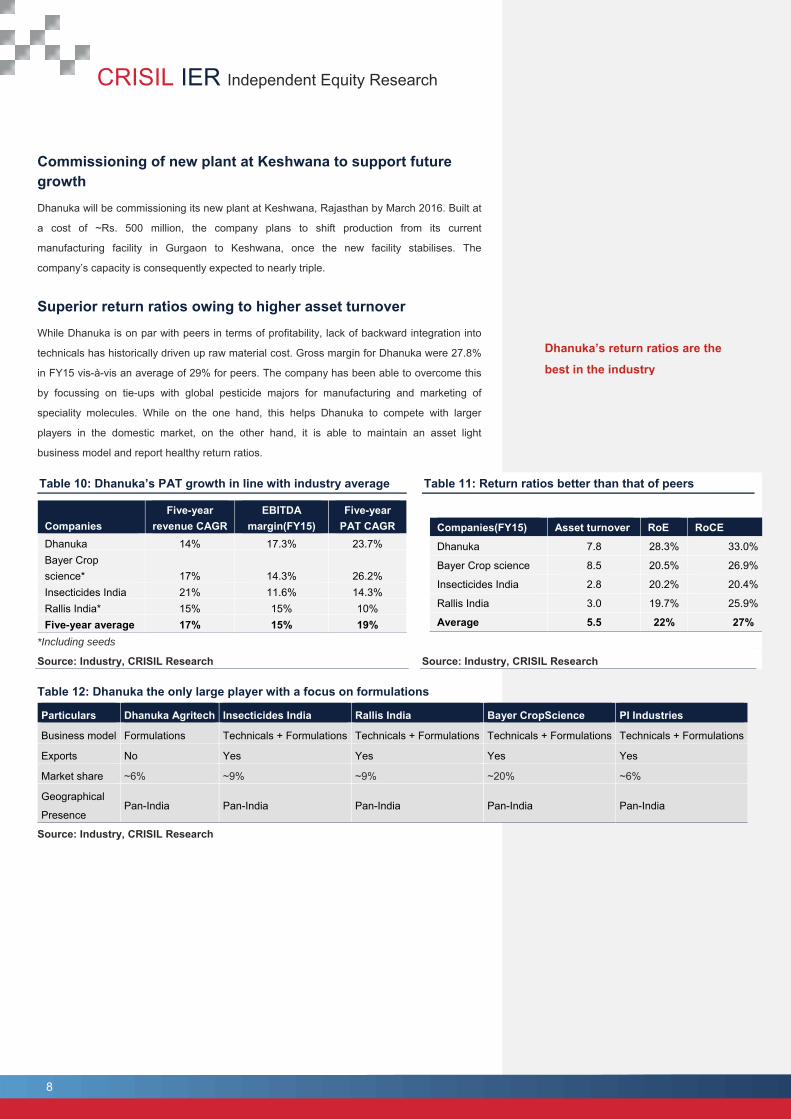
Superior return ratios owing to higher asset turnover While Dhanuka is on par with peers in terms of profitability, lack of backward integration into
technicals has historically driven up raw material cost. Gross margin for Dhanuka were 27.8%
in FY15 vis-à-vis an average of 29% for peers. The company has been able to overcome this
by focussing on tie-ups with global pesticide majors for manufacturing and marketing of
speciality molecules. While on the one hand, this helps Dhanuka to compete with larger
players in the domestic market, on the other hand, it is able to maintain an asset light
business model and report healthy return ratios. Table 10: Dhanuka’s PAT growth in line with industry average Table 11: Return ratios better than that of peers
Companies Five-year
revenue CAGR EBITDA
margin(FY15) Five-year
PAT CAGR Dhanuka 14% 17.3% 23.7% Bayer Crop science* 17% 14.3% 26.2% Insecticides India 21% 11.6% 14.3% Rallis India* 15% 15% 10% Five-year average 17% 15% 19%
*Including seeds
Companies(FY15) Asset turnover RoE RoCE
Dhanuka 7.8 28.3% 33.0%
Bayer Crop science 8.5 20.5% 26.9%
Insecticides India 2.8 20.2% 20.4%
Rallis India 3.0 19.7% 25.9%
Average 5.5 22% 27%
Source: Industry, CRISIL Research Source: Industry, CRISIL Research Table 12: Dhanuka the only large player with a focus on formulations
Particulars Dhanuka Agritech Insecticides India Rallis India Bayer CropScience PI Industries
Business model Formulations Technicals + Formulations Technicals + Formulations Technicals + Formulations Technicals + Formulations
Exports No Yes Yes Yes Yes
Market share ~6% ~9% ~9% ~20% ~6%
Geographical
Presence Pan-India Pan-India Pan-India Pan-India Pan-India
Source: Industry, CRISIL Research
Dhanuka’s return ratios are the
best in the industry
RESEARCH
Dhanuka Agritech Ltd
9
Key Risks Unfavorable monsoons Unfavourable monsoons, over last three cropping seasons, have impacted growth of the
pesticide industry. Going forward too, poor monsoons might impact crop sowing and changes
in crop patterns, and result in lower pesticide demand. However, given their diverse product
portfolio and wide distribution reach, deficient rainfall generally has a relatively lesser impact
on organised players.
Weaker farm profitability due to drop in agri commodity prices Farmers’ purchasing power for agricultural inputs depends on realisation of farm output.
Therefore, consumption of pesticides is partly dependent on revisions in MSP and other
subsidies. Delay in announcement of a hike in MSP may restrict the farmers’ ability to
purchase pesticides, thereby impacting demand. Besides, for farm products influenced by
export-import dynamics, any unfavourable movement in global realisations would impact
domestic profitability.
Regulatory risks The pesticide industry is highly regulated. Every product launch, patented or off-patent, has to
undergo field trials and comply with several requirements to keep the environment safe and
toxic levels, under acceptable limits. Highly toxic products carry the risk of being banned and
hence, impact financials adversely.
CRISIL IER Independent Equity Research
10
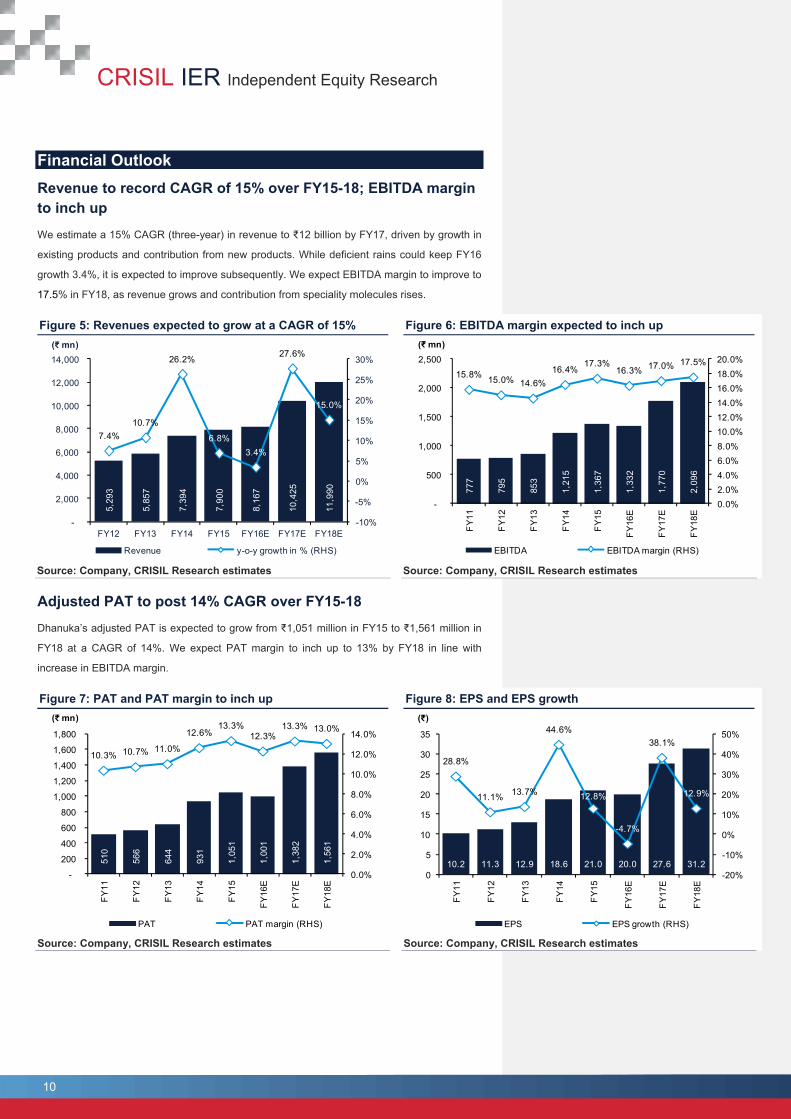
Financial Outlook Revenue to record CAGR of 15% over FY15-18; EBITDA margin to inch up We estimate a 15% CAGR (three-year) in revenue to ₹12 billion by FY17, driven by growth in
existing products and contribution from new products. While deficient rains could keep FY16
growth 3.4%, it is expected to improve subsequently. We expect EBITDA margin to improve to
17.5% in FY18, as revenue grows and contribution from speciality molecules rises. Figure 5: Revenues expected to grow at a CAGR of 15% Figure 6: EBITDA margin expected to inch up
Source: Company, CRISIL Research estimates Source: Company, CRISIL Research estimates
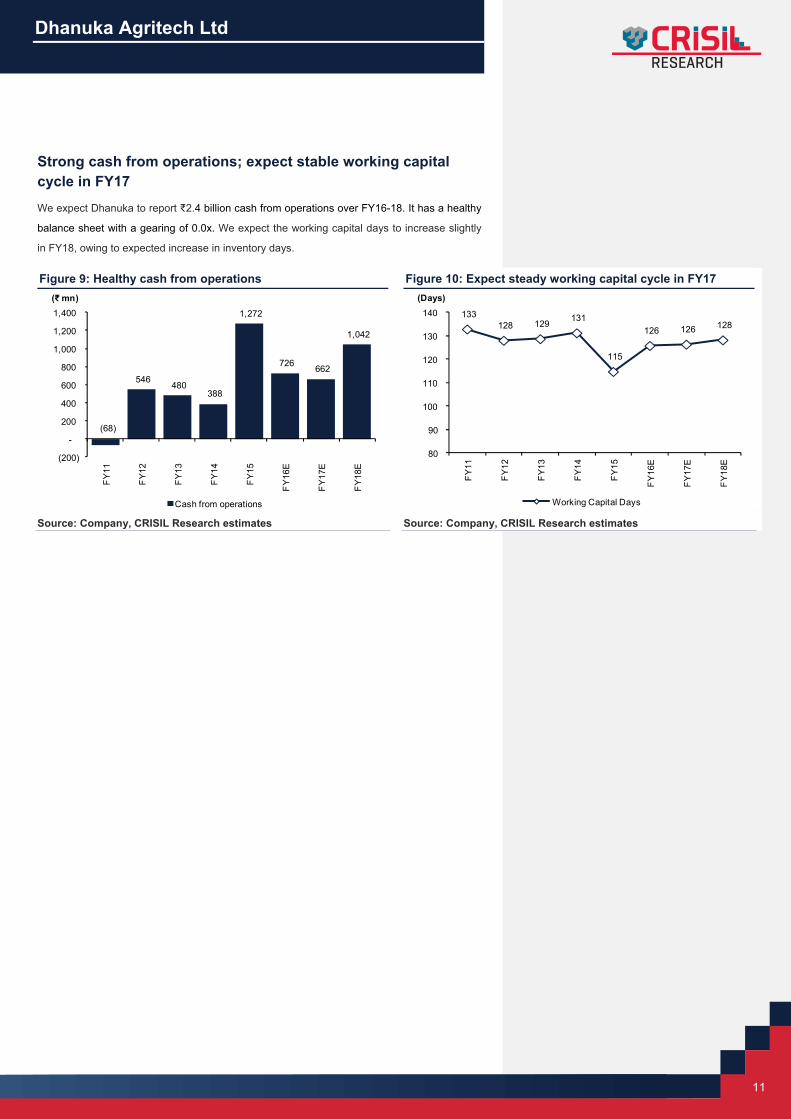
Adjusted PAT to post 14% CAGR over FY15-18 Dhanuka’s adjusted PAT is expected to grow from ₹1,051 million in FY15 to ₹1,561 million in
FY18 at a CAGR of 14%. We expect PAT margin to inch up to 13% by FY18 in line with
increase in EBITDA margin. Figure 7: PAT and PAT margin to inch up Figure 8: EPS and EPS growth
Source: Company, CRISIL Research estimates Source: Company, CRISIL Research estimates
5,29
3
5,85
7
7,39
4
7,90
0
8,16
7
10,4
25
11,9
90
7.4%10.7%
26.2%
6.8%3.4%
27.6%
15.0%
-10%
-5%
0%
5%
10%
15%
20%
25%
30%
-
2,000
4,000
6,000
8,000
10,000
12,000
14,000
FY12 FY13 FY14 FY15 FY16E FY17E FY18E
(₹ mn)
Revenue y-o-y growth in % (RHS)
777
795
853
1,21
5
1,36
7
1,33
2
1,77
0
2,09
6
15.8% 15.0% 14.6%16.4%
17.3%16.3% 17.0% 17.5%
0.0%2.0%4.0%6.0%8.0%10.0%12.0%14.0%16.0%18.0%20.0%
-
500
1,000
1,500
2,000
2,500
FY
11
FY
12
FY
13
FY
14
FY
15
FY
16E
FY
17E
FY
18E
(₹ mn)
EBITDA EBITDA margin (RHS)
510
566
644
931
1,05
1
1,00
1
1,38
2
1,56
1
10.3% 10.7% 11.0%
12.6%13.3%
12.3%13.3% 13.0%
0.0%
2.0%
4.0%
6.0%
8.0%
10.0%
12.0%
14.0%
-
200
400
600
800
1,000
1,200
1,400
1,600
1,800
FY
11
FY
12
FY
13
FY
14
FY
15
FY
16E
FY
17E
FY
18E
(₹ mn)
PAT PAT margin (RHS)
10.2 11.3 12.9 18.6 21.0 20.0 27.6 31.2
28.8%
11.1% 13.7%
44.6%
12.8%
-4.7%
38.1%
12.9%
-20%
-10%
0%
10%
20%
30%
40%
50%
0
5
10
15
20
25
30
35
FY
11
FY
12
FY
13
FY
14
FY
15
FY
16E
FY
17E
FY
18E
(₹)
EPS EPS growth (RHS)
RESEARCH
Dhanuka Agritech Ltd
11
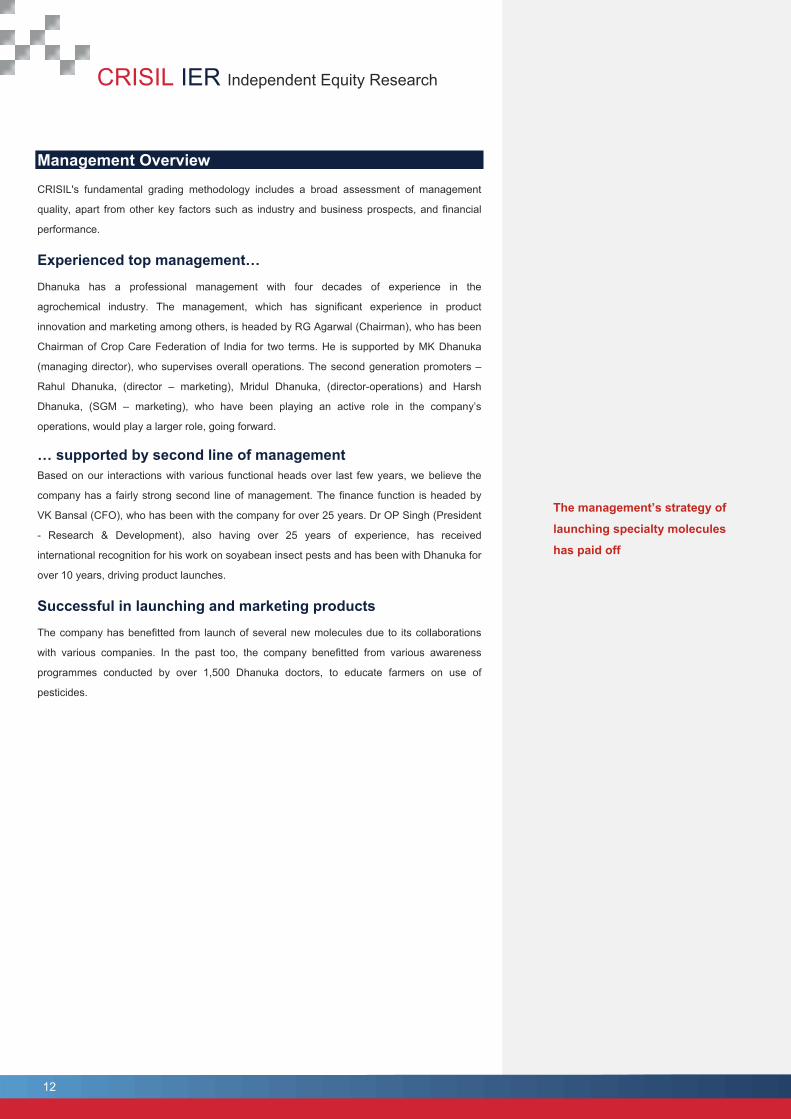
Strong cash from operations; expect stable working capital cycle in FY17 We expect Dhanuka to report ₹2.4 billion cash from operations over FY16-18. It has a healthy
balance sheet with a gearing of 0.0x. We expect the working capital days to increase slightly
in FY18, owing to expected increase in inventory days. Figure 9: Healthy cash from operations Figure 10: Expect steady working capital cycle in FY17
Source: Company, CRISIL Research estimates Source: Company, CRISIL Research estimates
(68)
546 480
388
1,272
726 662
1,042
(200)
-
200
400
600
800
1,000
1,200
1,400
FY
11
FY
12
FY
13
FY
14
FY
15
FY
16E
FY
17E
FY
18E
(₹ mn)
Cash from operations
133 128 129 131
115
126 126 128
80
90
100
110
120
130
140
FY
11
FY
12
FY
13
FY
14
FY
15
FY
16E
FY
17E
FY
18E
(Days)
Working Capital Days
CRISIL IER Independent Equity Research
12
Management Overview CRISIL's fundamental grading methodology includes a broad assessment of management
quality, apart from other key factors such as industry and business prospects, and financial
performance.
Experienced top management… Dhanuka has a professional management with four decades of experience in the
agrochemical industry. The management, which has significant experience in product
innovation and marketing among others, is headed by RG Agarwal (Chairman), who has been
Chairman of Crop Care Federation of India for two terms. He is supported by MK Dhanuka
(managing director), who supervises overall operations. The second generation promoters –
Rahul Dhanuka, (director – marketing), Mridul Dhanuka, (director-operations) and Harsh
Dhanuka, (SGM – marketing), who have been playing an active role in the company’s
operations, would play a larger role, going forward. … supported by second line of management Based on our interactions with various functional heads over last few years, we believe the
company has a fairly strong second line of management. The finance function is headed by
VK Bansal (CFO), who has been with the company for over 25 years. Dr OP Singh (President
- Research & Development), also having over 25 years of experience, has received
international recognition for his work on soyabean insect pests and has been with Dhanuka for
over 10 years, driving product launches.
Successful in launching and marketing products The company has benefitted from launch of several new molecules due to its collaborations
with various companies. In the past too, the company benefitted from various awareness
programmes conducted by over 1,500 Dhanuka doctors, to educate farmers on use of
pesticides.
The management’s strategy of
launching specialty molecules
has paid off
RESEARCH
Dhanuka Agritech Ltd
13
Corporate Governance CRISIL’s fundamental grading methodology includes a broad assessment of corporate
governance and management quality, apart from other key factors such as industry and
business prospects, and financial performance. In this context, CRISIL Research analyses the
shareholding structure, board composition, typical board processes, disclosure standards and
related-party transactions. Any qualifications by regulators or auditors also serve as useful
inputs while assessing a company’s corporate governance.
Corporate governance at Dhanuka reflects good practices, supported by a strong and fairly
independent board, with good and relevant experience, and board processes and structures
broadly conforming to minimum standards.
Board composition and processes Dhanuka’s board comprises 12 directors, six of whom are independent. Its board composition
meets the minimum requirement under Clause 49 of SEBI’s listing agreement.
The company has various committees – audit, nomination and remuneration and
stakeholders’ relationship – to support corporate governance. The independent directors hail
from various backgrounds such as finance, marketing, investor relations, human resources
etc.; and they are experienced in their respective domains. The audit committee is headed by
Priya Brat, former DMD, SBI, an independent director, who has expertise in finance.
Good quality of earnings, healthy dividend payout key positives ■ In our opinion, Dhanuka’s quality of earnings is good – though its operations are working
capital intensive, it has generated healthy cash from operations in each of the past four
years. Its asset turnover, is also significantly higher than that of peers.
■ Dhanuka has also maintained its dividend payout ratio of ~20%, over last five years; this
is a positive for minority shareholders.
■ Inventory and debtor days have been largely stable over the last five years, though
elevated vis-à-vis peers.
Concerns: Long tenure of auditors The current auditors – Dinesh Mehta & Co. – have been associated with the company for
more than a decade. The long tenure may limit their objectivity and independence. However,
the company changed its partner two years ago and plans to do the same, going ahead.
CRISIL IER Independent Equity Research
14
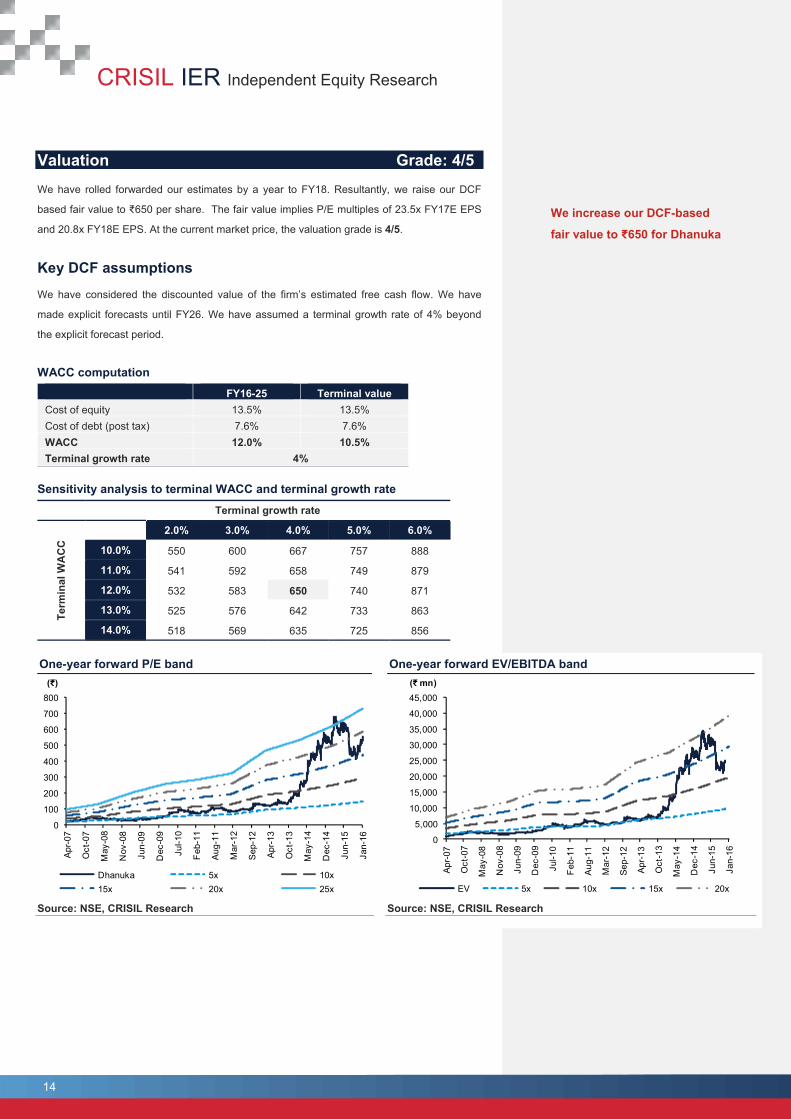
Valuation Grade: 4/5 We have rolled forwarded our estimates by a year to FY18. Resultantly, we raise our DCF
based fair value to ₹650 per share. The fair value implies P/E multiples of 23.5x FY17E EPS
and 20.8x FY18E EPS. At the current market price, the valuation grade is 4/5.
Key DCF assumptions We have considered the discounted value of the firm’s estimated free cash flow. We have
made explicit forecasts until FY26. We have assumed a terminal growth rate of 4% beyond
the explicit forecast period.
WACC computation FY16-25 Terminal value Cost of equity 13.5% 13.5% Cost of debt (post tax) 7.6% 7.6% WACC 12.0% 10.5% Terminal growth rate 4%
Sensitivity analysis to terminal WACC and terminal growth rate
Terminal growth rate
Term
inal
WA
CC
2.0% 3.0% 4.0% 5.0% 6.0%
10.0% 550 600 667 757 888
11.0% 541 592 658 749 879
12.0% 532 583 650 740 871
13.0% 525 576 642 733 863
14.0% 518 569 635 725 856 One-year forward P/E band One-year forward EV/EBITDA band
Source: NSE, CRISIL Research Source: NSE, CRISIL Research
0
100
200
300
400
500
600
700
800
Apr
-07
Oct
-07
May
-08
Nov
-08
Jun-
09
Dec
-09
Jul-1
0
Feb
-11
Aug
-11
Mar
-12
Sep
-12
Apr
-13
Oct
-13
May
-14
Dec
-14
Jun-
15
Jan-
16
(₹)
Dhanuka 5x 10x15x 20x 25x
0
5,000
10,000
15,000
20,000
25,000
30,000
35,000
40,000
45,000
Apr
-07
Oct
-07
May
-08
Nov
-08
Jun-
09
Dec
-09
Jul-1
0
Feb
-11
Aug-
11
Mar
-12
Sep-
12
Apr
-13
Oct
-13
May
-14
Dec
-14
Jun-
15
Jan-
16
(₹ mn)
EV 5x 10x 15x 20x
We increase our DCF-based
fair value to ₹650 for Dhanuka
RESEARCH
Dhanuka Agritech Ltd
15
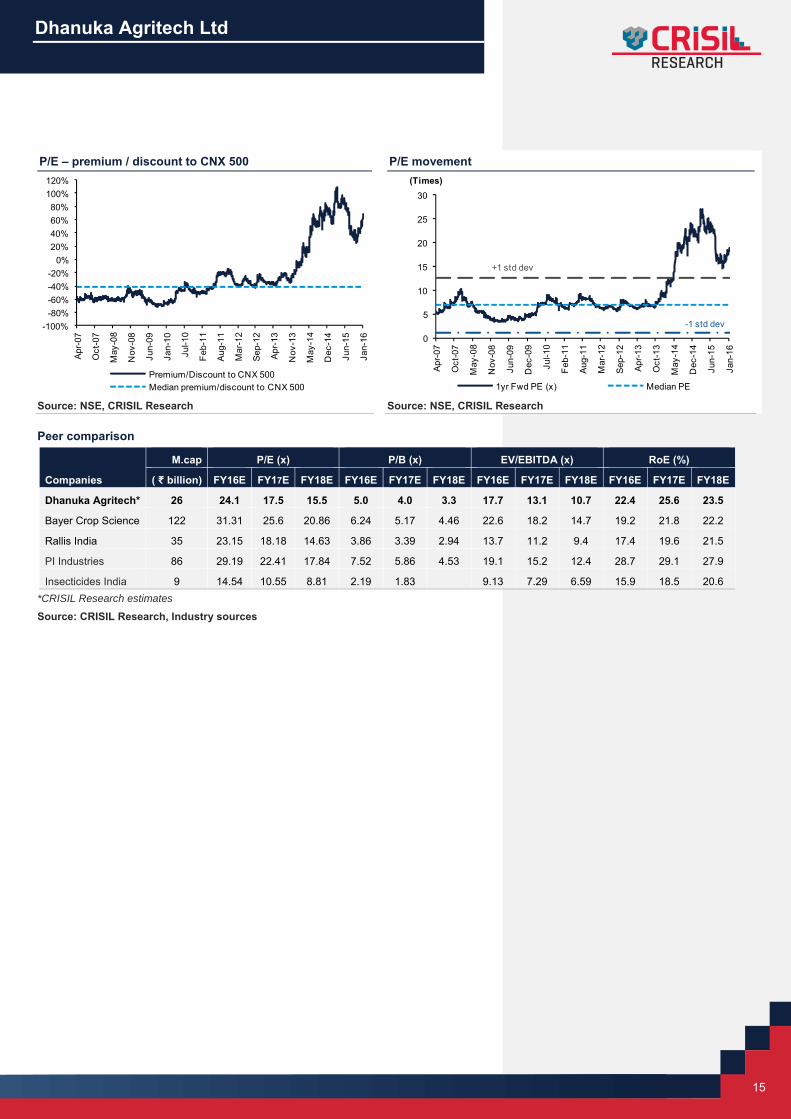
P/E – premium / discount to CNX 500 P/E movement
Source: NSE, CRISIL Research Source: NSE, CRISIL Research Peer comparison
Companies
M.cap P/E (x) P/B (x) EV/EBITDA (x) RoE (%)
( ₹ billion) FY16E FY17E FY18E FY16E FY17E FY18E FY16E FY17E FY18E FY16E FY17E FY18E
Dhanuka Agritech* 26 24.1 17.5 15.5 5.0 4.0 3.3 17.7 13.1 10.7 22.4 25.6 23.5
Bayer Crop Science 122 31.31 25.6 20.86 6.24 5.17 4.46 22.6 18.2 14.7 19.2 21.8 22.2
Rallis India 35 23.15 18.18 14.63 3.86 3.39 2.94 13.7 11.2 9.4 17.4 19.6 21.5
PI Industries 86 29.19 22.41 17.84 7.52 5.86 4.53 19.1 15.2 12.4 28.7 29.1 27.9
Insecticides India 9 14.54 10.55 8.81 2.19 1.83 9.13 7.29 6.59 15.9 18.5 20.6 *CRISIL Research estimates
Source: CRISIL Research, Industry sources
-100%-80%-60%-40%-20%
0%20%40%60%80%
100%120%
Apr
-07
Oct
-07
May
-08
Nov
-08
Jun-
09
Jan-
10
Jul-1
0
Feb
-11
Aug-
11
Mar
-12
Sep-
12
Apr
-13
Nov
-13
May
-14
Dec
-14
Jun-
15
Jan-
16Premium/Discount to CNX 500Median premium/discount to CNX 500
0
5
10
15
20
25
30
Apr-0
7
Oct
-07
May
-08
Nov
-08
Jun-
09
Dec
-09
Jul-1
0
Feb
-11
Aug-
11
Mar
-12
Sep-
12
Apr-1
3
Oct
-13
May
-14
Dec
-14
Jun-
15
Jan-
16
(Times)
1yr Fwd PE (x) Median PE
+1 std dev
-1 std dev
CRISIL IER Independent Equity Research
16
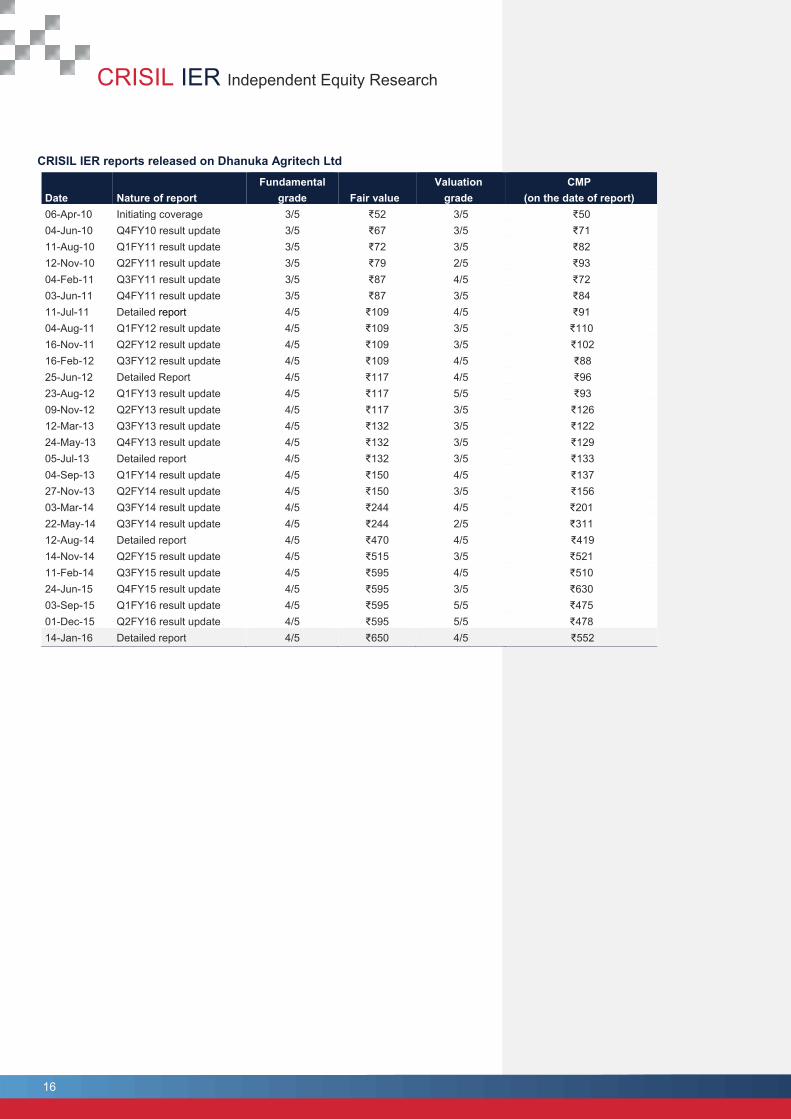
CRISIL IER reports released on Dhanuka Agritech Ltd
Date Nature of report Fundamental
grade Fair value Valuation
grade CMP
(on the date of report) 06-Apr-10 Initiating coverage 3/5 ₹52 3/5 ₹50 04-Jun-10 Q4FY10 result update 3/5 ₹67 3/5 ₹71 11-Aug-10 Q1FY11 result update 3/5 ₹72 3/5 ₹82 12-Nov-10 Q2FY11 result update 3/5 ₹79 2/5 ₹93 04-Feb-11 Q3FY11 result update 3/5 ₹87 4/5 ₹72 03-Jun-11 Q4FY11 result update 3/5 ₹87 3/5 ₹84 11-Jul-11 Detailed report 4/5 ₹109 4/5 ₹91 04-Aug-11 Q1FY12 result update 4/5 ₹109 3/5 ₹110 16-Nov-11 Q2FY12 result update 4/5 ₹109 3/5 ₹102 16-Feb-12 Q3FY12 result update 4/5 ₹109 4/5 ₹88 25-Jun-12 Detailed Report 4/5 ₹117 4/5 ₹96 23-Aug-12 Q1FY13 result update 4/5 ₹117 5/5 ₹93 09-Nov-12 Q2FY13 result update 4/5 ₹117 3/5 ₹126 12-Mar-13 Q3FY13 result update 4/5 ₹132 3/5 ₹122 24-May-13 Q4FY13 result update 4/5 ₹132 3/5 ₹129 05-Jul-13 Detailed report 4/5 ₹132 3/5 ₹133 04-Sep-13 Q1FY14 result update 4/5 ₹150 4/5 ₹137 27-Nov-13 Q2FY14 result update 4/5 ₹150 3/5 ₹156 03-Mar-14 Q3FY14 result update 4/5 ₹244 4/5 ₹201 22-May-14 Q3FY14 result update 4/5 ₹244 2/5 ₹311 12-Aug-14 Detailed report 4/5 ₹470 4/5 ₹419 14-Nov-14 Q2FY15 result update 4/5 ₹515 3/5 ₹521 11-Feb-14 Q3FY15 result update 4/5 ₹595 4/5 ₹510 24-Jun-15 Q4FY15 result update 4/5 ₹595 3/5 ₹630 03-Sep-15 Q1FY16 result update 4/5 ₹595 5/5 ₹475 01-Dec-15 Q2FY16 result update 4/5 ₹595 5/5 ₹478 14-Jan-16 Detailed report 4/5 ₹650 4/5 ₹552
RESEARCH
Dhanuka Agritech Ltd
17
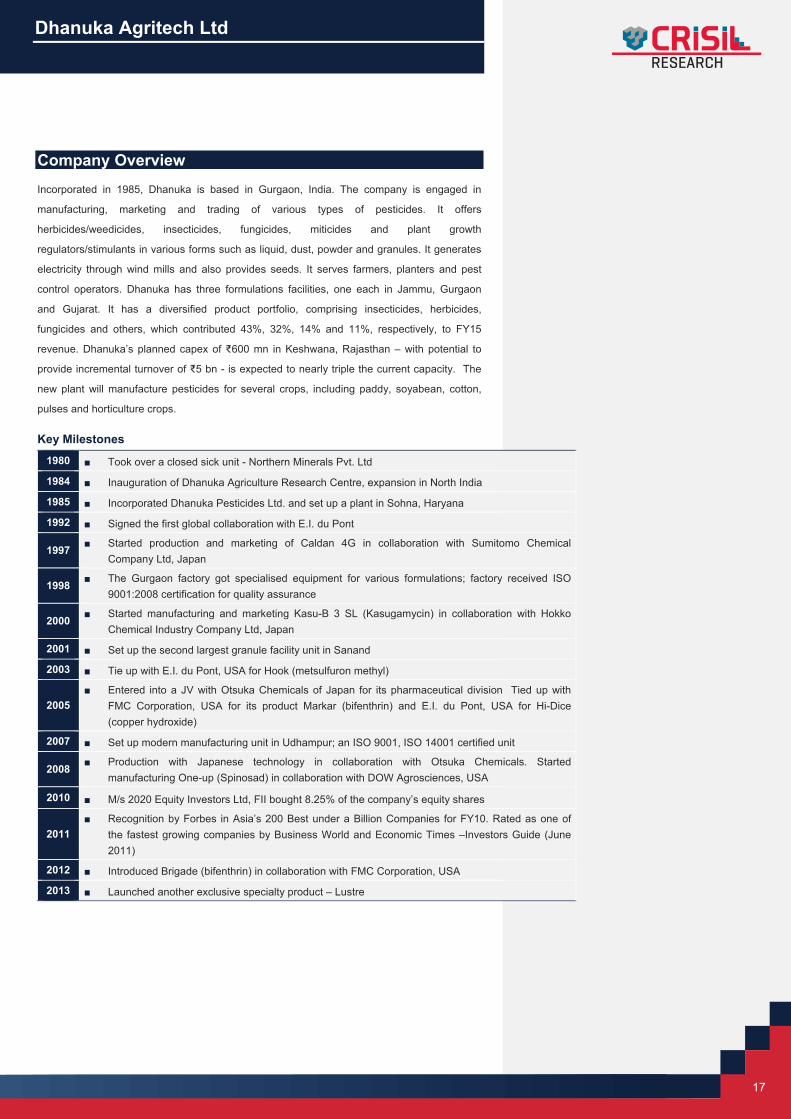
Company Overview
Incorporated in 1985, Dhanuka is based in Gurgaon, India. The company is engaged in
manufacturing, marketing and trading of various types of pesticides. It offers
herbicides/weedicides, insecticides, fungicides, miticides and plant growth
regulators/stimulants in various forms such as liquid, dust, powder and granules. It generates
electricity through wind mills and also provides seeds. It serves farmers, planters and pest
control operators. Dhanuka has three formulations facilities, one each in Jammu, Gurgaon
and Gujarat. It has a diversified product portfolio, comprising insecticides, herbicides,
fungicides and others, which contributed 43%, 32%, 14% and 11%, respectively, to FY15
revenue. Dhanuka’s planned capex of ₹600 mn in Keshwana, Rajasthan – with potential to
provide incremental turnover of ₹5 bn - is expected to nearly triple the current capacity. The
new plant will manufacture pesticides for several crops, including paddy, soyabean, cotton,
pulses and horticulture crops. Key Milestones
1980 ■ Took over a closed sick unit - Northern Minerals Pvt. Ltd
1984 ■ Inauguration of Dhanuka Agriculture Research Centre, expansion in North India
1985 ■ Incorporated Dhanuka Pesticides Ltd. and set up a plant in Sohna, Haryana
1992 ■ Signed the first global collaboration with E.I. du Pont
1997 ■ Started production and marketing of Caldan 4G in collaboration with Sumitomo Chemical Company Ltd, Japan
1998 ■ The Gurgaon factory got specialised equipment for various formulations; factory received ISO 9001:2008 certification for quality assurance
2000 ■ Started manufacturing and marketing Kasu-B 3 SL (Kasugamycin) in collaboration with Hokko Chemical Industry Company Ltd, Japan
2001 ■ Set up the second largest granule facility unit in Sanand
2003 ■ Tie up with E.I. du Pont, USA for Hook (metsulfuron methyl)
2005 ■ Entered into a JV with Otsuka Chemicals of Japan for its pharmaceutical division Tied up with
FMC Corporation, USA for its product Markar (bifenthrin) and E.I. du Pont, USA for Hi-Dice (copper hydroxide)
2007 ■ Set up modern manufacturing unit in Udhampur; an ISO 9001, ISO 14001 certified unit
2008 ■ Production with Japanese technology in collaboration with Otsuka Chemicals. Started manufacturing One-up (Spinosad) in collaboration with DOW Agrosciences, USA
2010 ■ M/s 2020 Equity Investors Ltd, FII bought 8.25% of the company’s equity shares
2011 ■ Recognition by Forbes in Asia’s 200 Best under a Billion Companies for FY10. Rated as one of
the fastest growing companies by Business World and Economic Times –Investors Guide (June 2011)
2012 ■ Introduced Brigade (bifenthrin) in collaboration with FMC Corporation, USA
2013 ■ Launched another exclusive specialty product – Lustre
CRISIL IER Independent Equity Research
18
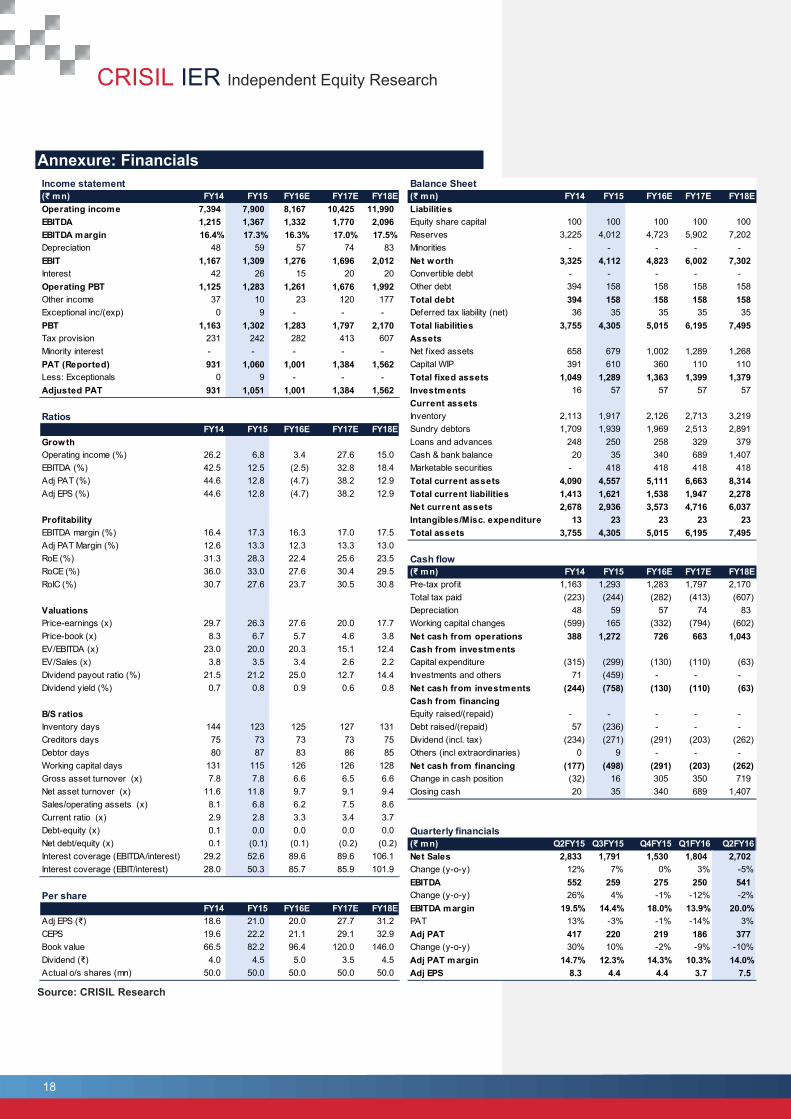
Annexure: Financials
Source: CRISIL Research
Income statement Balance Sheet(₹ mn) FY14 FY15 FY16E FY17E FY18E (₹ mn) FY14 FY15 FY16E FY17E FY18EOperating income 7,394 7,900 8,167 10,425 11,990 LiabilitiesEBITDA 1,215 1,367 1,332 1,770 2,096 Equity share capital 100 100 100 100 100 EBITDA margin 16.4% 17.3% 16.3% 17.0% 17.5% Reserves 3,225 4,012 4,723 5,902 7,202 Depreciation 48 59 57 74 83 Minorities - - - - - EBIT 1,167 1,309 1,276 1,696 2,012 Net worth 3,325 4,112 4,823 6,002 7,302 Interest 42 26 15 20 20 Convertible debt - - - - - Operating PBT 1,125 1,283 1,261 1,676 1,992 Other debt 394 158 158 158 158 Other income 37 10 23 120 177 Total debt 394 158 158 158 158 Exceptional inc/(exp) 0 9 - - - Deferred tax liability (net) 36 35 35 35 35 PBT 1,163 1,302 1,283 1,797 2,170 Total liabilities 3,755 4,305 5,015 6,195 7,495 Tax provision 231 242 282 413 607 AssetsMinority interest - - - - - Net f ixed assets 658 679 1,002 1,289 1,268 PAT (Reported) 931 1,060 1,001 1,384 1,562 Capital WIP 391 610 360 110 110 Less: Exceptionals 0 9 - - - Total fixed assets 1,049 1,289 1,363 1,399 1,379 Adjusted PAT 931 1,051 1,001 1,384 1,562 Investments 16 57 57 57 57
Current assetsRatios Inventory 2,113 1,917 2,126 2,713 3,219
FY14 FY15 FY16E FY17E FY18E Sundry debtors 1,709 1,939 1,969 2,513 2,891 Growth Loans and advances 248 250 258 329 379 Operating income (%) 26.2 6.8 3.4 27.6 15.0 Cash & bank balance 20 35 340 689 1,407 EBITDA (%) 42.5 12.5 (2.5) 32.8 18.4 Marketable securities - 418 418 418 418 Adj PAT (%) 44.6 12.8 (4.7) 38.2 12.9 Total current assets 4,090 4,557 5,111 6,663 8,314 Adj EPS (%) 44.6 12.8 (4.7) 38.2 12.9 Total current liabilities 1,413 1,621 1,538 1,947 2,278
Net current assets 2,678 2,936 3,573 4,716 6,037 Profitability Intangibles/Misc. expenditure 13 23 23 23 23 EBITDA margin (%) 16.4 17.3 16.3 17.0 17.5 Total assets 3,755 4,305 5,015 6,195 7,495 Adj PAT Margin (%) 12.6 13.3 12.3 13.3 13.0 RoE (%) 31.3 28.3 22.4 25.6 23.5 Cash flowRoCE (%) 36.0 33.0 27.6 30.4 29.5 (₹ mn) FY14 FY15 FY16E FY17E FY18ERoIC (%) 30.7 27.6 23.7 30.5 30.8 Pre-tax prof it 1,163 1,293 1,283 1,797 2,170
Total tax paid (223) (244) (282) (413) (607) Valuations Depreciation 48 59 57 74 83 Price-earnings (x) 29.7 26.3 27.6 20.0 17.7 Working capital changes (599) 165 (332) (794) (602) Price-book (x) 8.3 6.7 5.7 4.6 3.8 Net cash from operations 388 1,272 726 663 1,043 EV/EBITDA (x) 23.0 20.0 20.3 15.1 12.4 Cash from investmentsEV/Sales (x) 3.8 3.5 3.4 2.6 2.2 Capital expenditure (315) (299) (130) (110) (63) Dividend payout ratio (%) 21.5 21.2 25.0 12.7 14.4 Investments and others 71 (459) - - - Dividend yield (%) 0.7 0.8 0.9 0.6 0.8 Net cash from investments (244) (758) (130) (110) (63)
Cash from financingB/S ratios Equity raised/(repaid) - - - - - Inventory days 144 123 125 127 131 Debt raised/(repaid) 57 (236) - - - Creditors days 75 73 73 73 75 Dividend (incl. tax) (234) (271) (291) (203) (262) Debtor days 80 87 83 86 85 Others (incl extraordinaries) 0 9 - - - Working capital days 131 115 126 126 128 Net cash from financing (177) (498) (291) (203) (262) Gross asset turnover (x) 7.8 7.8 6.6 6.5 6.6 Change in cash position (32) 16 305 350 719 Net asset turnover (x) 11.6 11.8 9.7 9.1 9.4 Closing cash 20 35 340 689 1,407 Sales/operating assets (x) 8.1 6.8 6.2 7.5 8.6 Current ratio (x) 2.9 2.8 3.3 3.4 3.7 Debt-equity (x) 0.1 0.0 0.0 0.0 0.0 Quarterly financialsNet debt/equity (x) 0.1 (0.1) (0.1) (0.2) (0.2) (₹ mn) Q2FY15 Q3FY15 Q4FY15 Q1FY16 Q2FY16Interest coverage (EBITDA/interest) 29.2 52.6 89.6 89.6 106.1 Net Sales 2,833 1,791 1,530 1,804 2,702 Interest coverage (EBIT/interest) 28.0 50.3 85.7 85.9 101.9 Change (y-o-y) 12% 7% 0% 3% -5%
EBITDA 552 259 275 250 541 Per share Change (y-o-y) 26% 4% -1% -12% -2%
FY14 FY15 FY16E FY17E FY18E EBITDA margin 19.5% 14.4% 18.0% 13.9% 20.0%Adj EPS (₹) 18.6 21.0 20.0 27.7 31.2 PAT 13% -3% -1% -14% 3%CEPS 19.6 22.2 21.1 29.1 32.9 Adj PAT 417 220 219 186 377 Book value 66.5 82.2 96.4 120.0 146.0 Change (y-o-y) 30% 10% -2% -9% -10%Dividend (₹) 4.0 4.5 5.0 3.5 4.5 Adj PAT margin 14.7% 12.3% 14.3% 10.3% 14.0%Actual o/s shares (mn) 50.0 50.0 50.0 50.0 50.0 Adj EPS 8.3 4.4 4.4 3.7 7.5
RESEARCH
Dhanuka Agritech Ltd
19
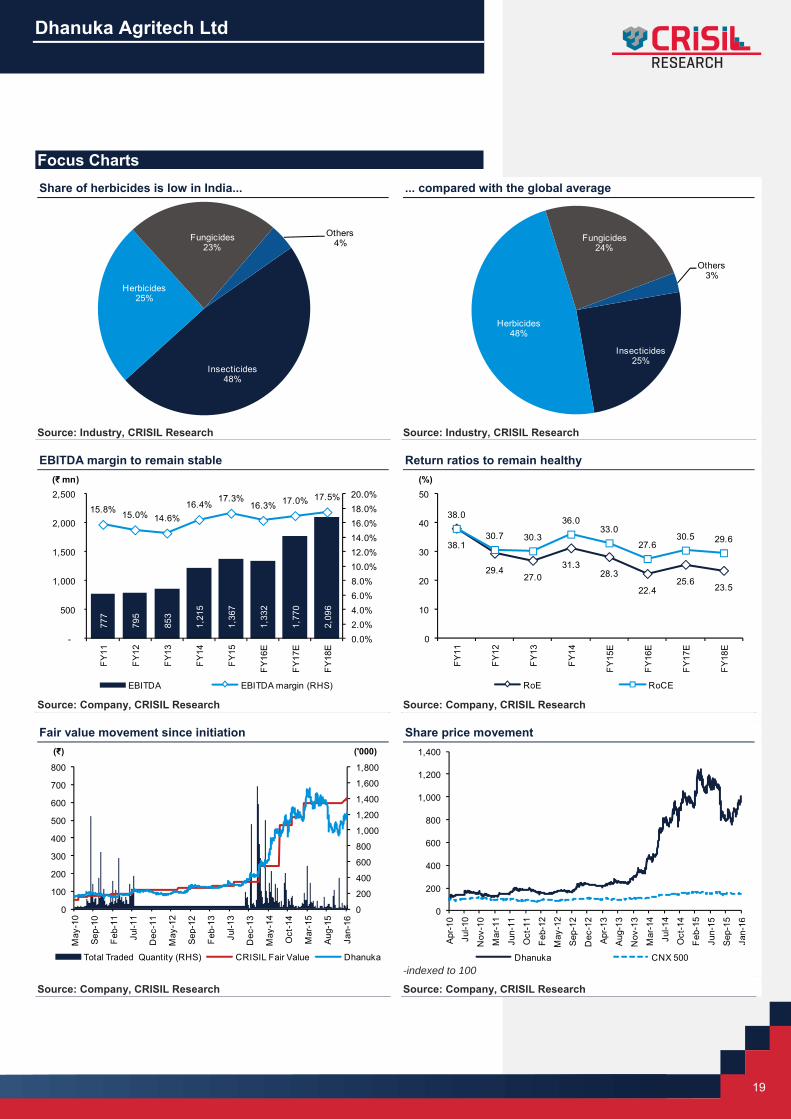
Focus Charts Share of herbicides is low in India... ... compared with the global average
Source: Industry, CRISIL Research Source: Industry, CRISIL Research
EBITDA margin to remain stable Return ratios to remain healthy
Source: Company, CRISIL Research Source: Company, CRISIL Research
Fair value movement since initiation Share price movement
-indexed to 100
Source: Company, CRISIL Research Source: Company, CRISIL Research
Insecticides48%
Herbicides25%
Fungicides23%
Others4%
Insecticides25%
Herbicides48%
Fungicides24%
Others3%
777
795
853
1,21
5
1,36
7
1,33
2
1,77
0
2,09
6
15.8% 15.0% 14.6%16.4%
17.3%16.3% 17.0% 17.5%
0.0%2.0%4.0%6.0%8.0%10.0%12.0%14.0%16.0%18.0%20.0%
-
500
1,000
1,500
2,000
2,500
FY
11
FY
12
FY
13
FY
14
FY
15
FY
16E
FY
17E
FY
18E
(₹ mn)
EBITDA EBITDA margin (RHS)
38.1
29.427.0
31.328.3
22.425.6
23.5
38.0
30.7 30.3
36.033.0
27.630.5 29.6
0
10
20
30
40
50
FY
11
FY
12
FY
13
FY
14
FY
15E
FY
16E
FY
17E
FY
18E
(%)
RoE RoCE
0
200
400
600
800
1,000
1,200
1,400
1,600
1,800
0
100
200
300
400
500
600
700
800
May
-10
Sep-
10
Feb-
11
Jul-1
1
Dec
-11
May
-12
Se p
-12
Feb-
13
Jul-1
3
Dec
-13
Ma y
-14
Oct
-14
Mar
-15
Aug-
15
Jan-
16
('000)(₹)
Total Traded Quantity (RHS) CRISIL Fair Value Dhanuka
0
200
400
600
800
1,000
1,200
1,400
Apr-1
0
Jul-1
0
Nov
-10
Mar
-11
Jun-
11
Oct
-11
Feb
-12
May
-12
Sep
-12
Dec
-12
Apr-1
3
Aug
-13
Nov
-13
Mar
-14
Jul-1
4
Oct
-14
Feb
-15
Jun-
15
Sep
-15
Jan-
16
Dhanuka CNX 500
CRISIL IER Independent Equity Research
CRISIL Research Team
Senior Director
Manish Jaiswal CRISIL Research +91 22 3342 8290 [email protected]
Analytical Contacts
Prasad Koparkar Senior Director, Industry & Customised Research +91 22 3342 3137 [email protected]
Binaifer Jehani Director, Customised Research +91 22 3342 4091 [email protected]
Manoj Damle Director, Customised Research +91 22 3342 3342 [email protected]
Manoj Mohta Director, Customised Research +91 22 3342 3554 [email protected]
Jiju Vidyadharan Director, Funds & Fixed Income Research +91 22 3342 8091 [email protected]
Ajay Srinivasan Director, Industry Research +91 22 3342 3530 [email protected]
Rahul Prithiani Director, Industry Research +91 22 3342 3574 [email protected]
Ajay D'Souza Director, New Product Development +91 22 3342 3567 [email protected]
Business Development
Prosenjit Ghosh Director, Industry & Customised Research +91 99206 56299 [email protected]
Megha Agrawal Associate Director +91 98673 90805 [email protected]
Neeta Muliyil Associate Director +91 99201 99973 [email protected]
Ankesh Baghel Regional Manager (West) +91 98191 21510 [email protected]
Ravi Lath Regional Manager (West) +91 98200 62424 [email protected]
Sarrthak Sayal Regional Manager (North) +91 95828 06789 [email protected]
Priyanka Murarka Regional Manager (East) +91 99030 60685 [email protected]
Naveena R Regional Manager (Karnataka & Kerala) +91 95383 33088 [email protected]
Sanjay Krishnaa Regional Manager (Tamil Nadu & AP) +91 98848 06606 [email protected]
RESEARCH
Our Capabilities
Making Markets Function Better
Economy and Industry Research ■ Largest team of economy and industry research analysts in India
■ Acknowledged premium, high quality research provider with track record spanning two decades
■ 95% of India’s commercial banking industry by asset base uses our industry research for credit decisions
■ Coverage on 86 industries: We provide analysis and forecast on key industry parameters including demand, supply,prices, investments and profitability, along with insightful opinions on emerging trends and impact of key events
■ Research on sectors and clusters dominated by small and medium enterprises covering analysis of relative attractiveness,growth prospects and financial performance
■ High-end customised research for many leading Indian and global corporates in areas such as market sizing, demandforecasting, project feasibility and entry strategy
Funds and Fixed Income Research ■ Largest and most comprehensive database on India’s debt market, covering more than 18,000 securities
■ Largest provider of fixed income valuations in India
■ Provide valuation for more than ₹81 trillion (US$ 1,275 billion) of Indian debt securities
■ Sole provider of fixed income and hybrid indices to mutual funds and insurance companies; we maintain 37 standardindices and over 100 customised indices
■ Ranking of Indian mutual fund schemes covering 75% of assets under management and ₹9 trillion (US$ 144 billion)by value
■ Business review consultants to The Employees’ Provident Fund Organisation (EPFO) and The National Pension System(NPS) Trust in monitoring performance of their fund managers
Equity and Company Research ■ Assigned the first IPO grade in India; graded more than 100 IPOs till date
■ Due Diligence and Valuation services across sectors; executed close to 100 valuation assignments
■ Due Diligence, IPO Grading and Independent Equity Research for SME companies planning to list or already listed in NSEEmerge platform
■ First research house to release exchange-commissioned equity research reports in India; covered 1,488 firms listed andtraded on the National Stock Exchange
Executive Training ■ Conducted 1200+ training programs on a wide spectrum of topics including credit, risk, retail finance, treasury, and
corporate advisory; trained more than 24,000 professionals till date
■ Training programs being conducted in India, Sri Lanka and Bangladesh through an extensive network of well-qualifiedfinancial professionals
Our Office
Ahmedabad 706, Venus Atlantis Nr. Reliance Petrol Pump Prahladnagar, Ahmedabad, India Phone: +91 79 4024 4500 Fax: +91 79 2755 9863
Hyderabad 3rd Floor, Uma Chambers Plot No. 9&10, Nagarjuna Hills, (Near Punjagutta Cross Road) Hyderabad - 500 482, India Phone: +91 40 2335 8103/05 Fax: +91 40 2335 7507
Bengaluru W-101, Sunrise Chambers, 22, Ulsoor Road, Bengaluru - 560 042, India Phone: +91 80 2558 0899
+91 80 2559 4802 Fax: +91 80 2559 4801
Kolkata Horizon, Block 'B', 4th Floor 57 Chowringhee Road Kolkata - 700 071, India Phone: +91 33 2289 1949/50 Fax: +91 33 2283 0597
Chennai Thapar House, 43/44, Montieth Road, Egmore, Chennai - 600 008, India Phone: +91 44 2854 6205/06
+91 44 2854 6093 Fax: +91 44 2854 7531
Pune 1187/17, Ghole Road, Shivaji Nagar, Pune - 411 005, India Phone: +91 20 2553 9064/67 Fax: +91 20 4018 1930
Gurgaon Plot No. 46 Sector 44 Opp. PF Office Gurgaon - 122 003, India Phone: +91 124 6722 000
Stay Connected | CRISIL Website | Twitter | LinkedIn |
YouTube | Facebook
CRISIL Limited CRISIL House, Central Avenue, Hiranandani Business Park, Powai, Mumbai – 400076. India Phone: +91 22 3342 3000 | Fax: +91 22 3342 8088 www.crisil.com
CRISIL Ltd is a Standard & Poor's company