
CRISIL IER - Moneycontrol.comstatic-news.moneycontrol.com/static-mcnews/2017/10/...For detailed...
33
CRISIL IER Independent Equity Research Enhancing investment decisions JM Financial Ltd Detailed Report
Transcript of CRISIL IER - Moneycontrol.comstatic-news.moneycontrol.com/static-mcnews/2017/10/...For detailed...

CRISIL IER Independent Equity Research
Enhancing investment decisions
JM Financial Ltd
Detailed Report
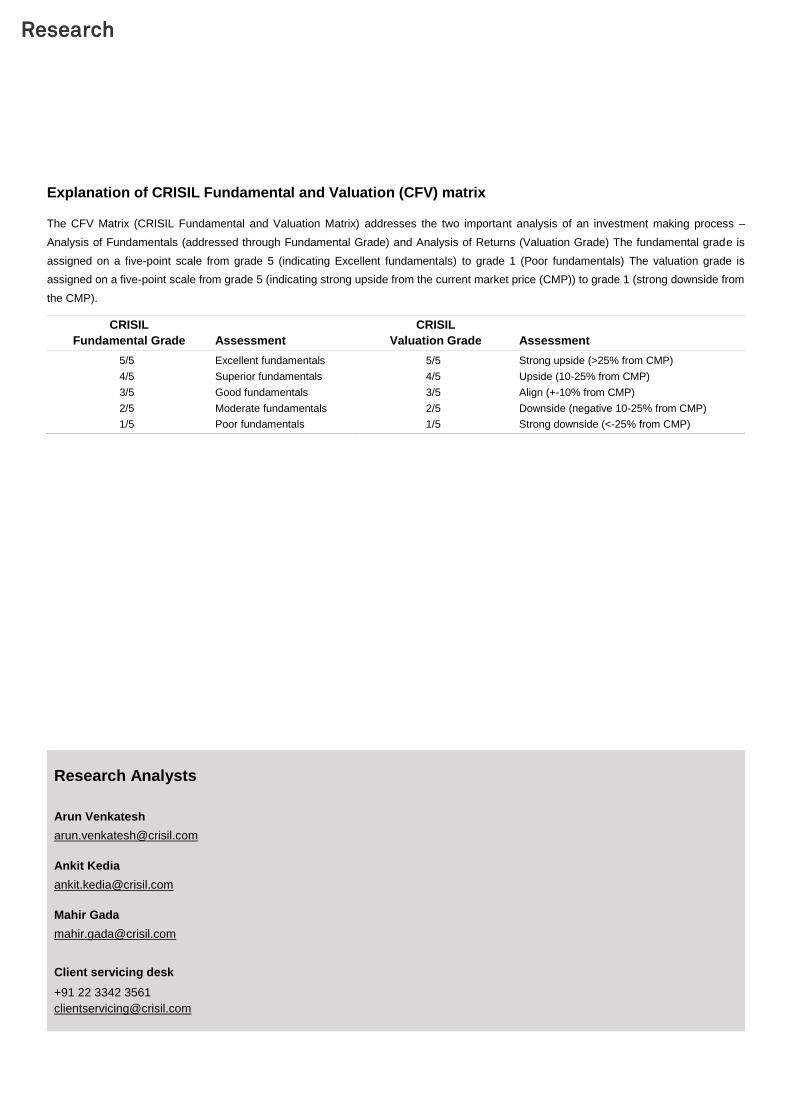
Explanation of CRISIL Fundamental and Valuation (CFV) matrix
The CFV Matrix (CRISIL Fundamental and Valuation Matrix) addresses the two important analysis of an investment making process –
Analysis of Fundamentals (addressed through Fundamental Grade) and Analysis of Returns (Valuation Grade) The fundamental grade is
assigned on a five-point scale from grade 5 (indicating Excellent fundamentals) to grade 1 (Poor fundamentals) The valuation grade is
assigned on a five-point scale from grade 5 (indicating strong upside from the current market price (CMP)) to grade 1 (strong downside from
the CMP).
CRISIL
Fundamental Grade Assessment
CRISIL
Valuation Grade Assessment
5/5 Excellent fundamentals 5/5 Strong upside (>25% from CMP)
4/5 Superior fundamentals 4/5 Upside (10-25% from CMP)
3/5 Good fundamentals 3/5 Align (+-10% from CMP)
2/5 Moderate fundamentals 2/5 Downside (negative 10-25% from CMP)
1/5 Poor fundamentals 1/5 Strong downside (<-25% from CMP)
Research Analysts
Arun Venkatesh
Ankit Kedia
Mahir Gada
Client servicing desk
+91 22 3342 3561

For detailed initiating coverage report please visit: www.crisil.com
CRISIL Independent Equity Research reports are also available on Bloomberg (CRI <go>) and Thomson Reuters.
JM Financial Ltd
Another stellar year; fund-based business to help sustain growth momentum
Fundamental Grade: 4/5 (Superior fundamentals) Valuation Grade: 3/5 (CMP is aligned)
Industry: Capital Markets and Diversified finance Fair Value: ₹150 CMP: ₹143
October 03, 2017
Mirroring the growth streak of the past four years, leading financial services provider JM
Financial Ltd (JM) recorded healthy performance in FY17 led by the fund-based and
investment banking, wealth management & securities (IWS) businesses. Driven primarily by
real estate, the fund-based business (the group’s mainstay) delivered robust performance
with loan book growth of 58% in FY17, while maintaining gross non-performing assets
(GNPAs) at ~0.1%. The company is well positioned in the ARC business as well, with focus
on asset resolution while cautiously acquiring stressed assets. In the IWS business, the
company has benefitted from robust activities in the capital markets and has strengthened
its competitive position as a leading M&A advisory firm by executing several marquee deals.
JM’s 1) proven track record of risk management in the lending business along with improving
prospects in the real estate sector, 2) foray into affordable housing finance and SME lending
towards the end of 2017, and 3) sustained buoyancy in the capital markets are a good augury
for medium-term growth. We, thus, maintain our fundamental grade of 4/5.
Fund-based business characterised by sustainable growth and robust asset quality
The fund-based business, having posted ~30% CAGR over FY11-17, has become the key
driver for the company in terms of revenue (63% share in FY17) and profits (80% PBT share).
While real estate continues to dominate the loan book (~71%), corporate lending and capital
market book grew 163% and 69%, respectively, in FY17. Despite high growth, the company
has been able to maintain its asset quality (GNPA below 1% in the past five years) owing to
prudent risk management policies, which include 1) lending to reputed developers with track
record of having completed a project at least 10 years ago, 2) cash flow-backed lending, and
3) focus on tier-I metros and repeat clients. However, increasing leverage and growing
pressure on yields, owing to lending to low-risk projects and intensifying competition in the
space, led to ~30 bps contraction in NIM in FY17. We expect the company’s FY18 book to
grow ~45% thanks to exploring opportunities in new geographies and addition of new clients
(6-10) every year.
IWS business driven by buoyant capital markets, though volatility is an inherent risk
The IWS business recorded a stellar year attributable to increased activities in the capital
markets. The business’ revenue increased 29% in FY17 driven by strong competitive position
in the IB space coupled with traction in capital markets across primary and secondary
segments. JM’s expertise and strong corporate relationships led to it brokering key
transactions during the year. We expect the segment’s revenue to increase a healthy ~17%
in FY18 based on sustained capital market activities.
Fair value raised to ₹150 per share
We value JM by the sum of the parts (SoTP) method and our fair value estimate as on FY18
is raised to ₹150 per share. We value the lending business at a price-to-book (P/B) multiple
of 3x FY18E book value and the IWS business at a price-to-earnings (P/E) multiple of 15x
FY18E earnings. At the current market price of ₹143 per share, our valuation grade is 3/5.
KEY FORECAST (CONSOLIDATED)
(₹ mn) FY14 FY15 FY16 FY17 FY18E
Operating income 10,020 13,984 16,847 23,593 29,175
EBITDA 6,050 9,554 12,254 17,995 23,038
Adj PAT 2,116 3,312 4,006 4,898 6,013
Adj EPS-₹ 2.8 4.2 5.1 5.9 7.5
Dividend yield 4.0 2.8 3.8 1.2 1.3
RoCE (%) 10.0 14.1 13.3 13.9 13.1
RoE (%) 9.8 13.9 14.7 15.1 16.9
PE (x) 9.0 11.3 7.5 21.1 16.6
P/BV (x) 0.8 1.2 0.8 2.2 2.0
Source: Company, CRISIL Research estimates
CMP: Current market price
CFV MATRIX
KEY STOCK STATISTICS
Nifty/Sensex 9860/31497
NSE ticker JMFINANCIL/JMFINAN
Face Value (₹ per share) 1
Shares outstanding (mn) 796.8
Market cap (₹ mn)/(US$ mn) 113,942/1738
Enterprise value (₹ mn)/(US$ mn) 217,948/3325
52-week range (₹)(H/L) 131/47
Beta 1.3
Free float (%) 34.9%
Avg daily volumes (30-days) 2,170,043
Avg daily value (30-days) (₹ mn) 308.1
SHAREHOLDING PATTERN
PERFORMANCE VIS-À-VIS MARKET
Returns
1-m 3-m 6-m 12-m
JM Financial 1% 23% 59% 97%
NIFTY 500 -1% 3% 8% 15%
1 2 3 4 5
1
2
3
4
5
Valuation Grade
Fu
nd
am
en
tal G
rad
e
Poor
Fundamentals
Excellent
Fundamentals
Str
on
g
Do
wn
sid
e
Str
on
g
Up
sid
e
65.4% 65.3% 65.3% 65.2%
34.6% 34.7% 34.7% 34.9%
0%
10%
20%
30%
40%
50%
60%
70%
80%
90%
100%
Sep-16 Dec-16 Mar-17 Jun-17
Promoter Others

2
Table 1: JM Financial - business environment
Parameters Fund-based activities Fee-based activities
Lending and ARC^ IWS Asset management Others
Segment
offerings
● Real estate lending
● Capital market lending:
loan against securities,
margin funding, IPO
financing, broker
funding, ESOP funding
● Corporate lending -
promoter funding, bridge
loans, corporate loans,
structured loans,
acquisition financing
● Asset reconstruction
company (ARC) -
acquisition of NPAs,
their resolution and
recovery
● Investment banking
services – M&A advisory,
corporate finance
advisory, PE syndication,
equity and debt markets
oriented services
● Equity research, sales &
trading
● Wealth management
● Financial products
distribution
● Mutual funds –
equity and debt
● Alternative
asset
management –
real estate fund,
private equity
fund
Revenue
contribution*
FY17
FY18E
63%
66%
25%
24%
3%
3%
9%
7%
Revenue
growth (FY18E) 28% 17% 7% 0%
Key
competitors
● Lending business -
Edelweiss Capital, IIFL,
HDFC, Indiabulls
Housing Finance,
Piramal Enterprises;
Altico Capital
● ARC - Edelweiss ARC,
ARCIL
● Investment banking - Citi,
Edelweiss, HSBC, ICICI
securities, Axis bank,
among others
● Securities business -
IIFL, Motilal Oswal,
Edelweiss capital
● HDFC AMC, ICICI
Prudential AMC,
LIC MF, Invesco
MF, Sundaram MF,
DHFL Pramerica
NA
* Total revenue, including inter-segment sales, is used to calculate revenue contribution of segments
^ ARC figures in the statement of profit and loss are consolidated on a line by line basis from October 1, 2016. The ARC was an “associate” of JM
Financial until September 30, 2016.
Source: Company, CRISIL Research

3
Grading Rationale
Successive years of robust performance driven by fund-based
and IWS businesses
As estimated in our previous detailed report (dated June 26, 2016) JM marked another year
of solid performance, registering consolidated revenue and adjusted PAT growth of 40% and
22% on-year, respectively, in FY17. The fund-based and IWS businesses are key revenue
and profit drivers, accounting for ~88% of revenue and ~95% of PBT in FY17. The
company’s loan book grew a robust 58% to ~₹114 bn in FY17 from ₹72 bn in FY16 driven
by traction across segments. The year also saw the IB and securities business post revenue
and PBT growth of 29% and 81%, respectively, driven by buoyant capital markets (primary
as well as secondary) and M&A activities.
Fund-based business: The engine for sustainable growth
The company’s fund-based business witnessed robust revenue growth of 51% and PBT
growth of 42% in FY17. The lending book increased 58% on-year driven by growth across
real estate, capital market and corporate lending. Real estate book, accounting for ~72% of
the total loan book as of FY17, grew 45% on-year, while the capital market and corporate
lending book grew 69% and 163%, respectively.
Figure 1: Revenue growth of 40% in FY17... Figure 2:…driven by fund-based and IWS businesses
Source: Company, CRISIL Research Source: Company, CRISIL Research
10
,42
4
10
,06
7
14
,03
0
16
,84
7
23
,59
3
2,519 2,802
5,167
6,929
9,717
-
5,000
10,000
15,000
20,000
25,000
FY13 FY14 FY15 FY16 FY17
(₹ mn)
Revenue PBT
25%15%
63% 80%
12%5%
0%
10%
20%
30%
40%
50%
60%
70%
80%
90%
100%
Revenue mix PBT mix
IWS business Lending business Others
FY17 revenue and PBT share
40% revenue growth in FY17
driven by fund-based and IWS
segments
The fund-based business
contributed ~63% of revenue
and ~80% of PBT in FY17

4
Figure 3: Fund-based business posted robust revenue
and PBT growth
Figure 4: Real estate lending book accounted for 72% in
FY17
Source: Company, CRISIL Research Source: Company, CRISIL Research
Asset quality maintained, but NIM and yield contracted
Historically, the asset quality of the lending book has remained healthy (GNPAs <1% over
the past five years) and improved further in the past seven quarters (GNPAs <0.5% since
Q3FY16), driven mainly by the company’s policy of lending to developers having completed
a project at least 10 years ago. The company has been able to maintain robust asset quality
based on its risk assessment expertise and experience in real estate and capital markets,
focus on lending to reputed builders in tier-I markets as well as practice of cash flow-backed
lending. However, as the lending book has grown rapidly while keeping its asset quality
intact, yields and NIM contracted slightly owing to competitive pressures in the low-risk
lending space. We expect the spreads to contract by 40-50 bps in FY18.
Figure 5: JM’s expertise and disciplined approach helped
asset quality improve further, but…
Figure 6: …yield and NIM receded from high levels of
FY16
Source: Company, CRISIL Research Source: Company, CRISIL Research
5,5
18
5,2
92
8,0
62
10,7
90
16,2
50
1,825 1,995 3,473
5,486 7,788
-
2,000
4,000
6,000
8,000
10,000
12,000
14,000
16,000
18,000
FY13 FY14 FY15 FY16 FY17
(₹ mn)
Lending business revenue Lending business PBT
0.8%
0.4%
0.9%
0.3%
0.1%
0.7%
0.2%
0.7%
0.2%0.0%
0.0%
0.1%
0.2%
0.3%
0.4%
0.5%
0.6%
0.7%
0.8%
0.9%
1.0%
FY13 FY14 FY15 FY16 FY17
Gross NPA Net NPA
14.8% 15.1% 14.8% 15.0%14.4%
10.8% 11.0%10.3%
9.7% 9.5%
4.3%
6.2%6.7%
8.0%
7.3%
0.0%
2.0%
4.0%
6.0%
8.0%
10.0%
12.0%
14.0%
16.0%
FY13 FY14 FY15 FY16 FY17
Yield Cost of borrowing NIM
~0.1% GNPA reflects robust
risk management practices

5
Growth in real estate lending book driven by existing relationships and …
JMs real estate lending business accounts for ~72% of the total loan book. It grew at more
than 80% CAGR over FY13-17. The company currently lends to about 59 clients with
significant focus on repeat business. It majorly provides real estate project financing backed
by cash flows and ~80% of the book is against residential projects. Some of its prominent
clients are Kalpataru, RMZ, Embassy, Kanakia, Peninsula, Adarsh Developers, Goel Ganga,
Rajesh Lifespace and Lodha Group. The company primarily lends to reputed and established
developers; most have an experience of more than 25 years in the industry.
Figure 7: Real estate loan book grew at a phenomenal rate
Source: Company, CRISIL Research
…foray into newer geographies amid…
Most of JM’s real estate lending is linked to projects in tier-I markets of Mumbai, Pune and
Bengaluru. The company entered Hyderabad in FY17 and Kolkata this year. It also plans to
enter NCR in FY18. It plans to initially cater to existing clients in these markets. The company
has been adding six to seven new clients every year; which it plans to ramp up to 10. In
FY17, majority of disbursements were in Mumbai, Pune, Bengaluru and Chennai.
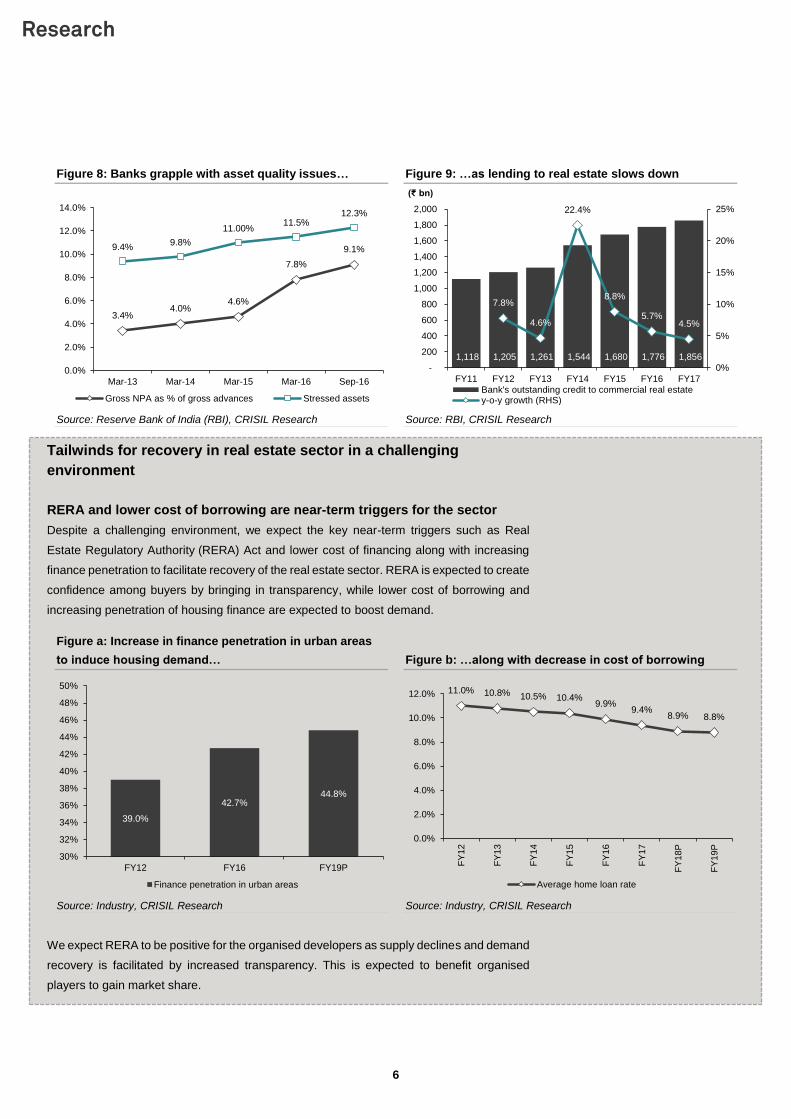
…opportunity arising from slowing of bank credit towards real estate
Banks have become moderately averse to lending to real estate developers because of high
risk perception and bank’s struggling with significant stressed assets. This has led to non-
banking financial companies (NBFCs) gaining market share as they increasingly cater to the
sector.
7.3 13.7 28.5 56.3 81.6
0.0
10.0
20.0
30.0
40.0
50.0
60.0
70.0
80.0
90.0
FY13 FY14 FY15 FY16 FY17
(₹ bn)
Real estate loan book
Real estate lending book
accounts for ~72% of the loan
book
6
Figure 8: Banks grapple with asset quality issues… Figure 9: …as lending to real estate slows down
Source: Reserve Bank of India (RBI), CRISIL Research Source: RBI, CRISIL Research
Tailwinds for recovery in real estate sector in a challenging
environment
RERA and lower cost of borrowing are near-term triggers for the sector
Despite a challenging environment, we expect the key near-term triggers such as Real
Estate Regulatory Authority (RERA) Act and lower cost of financing along with increasing
finance penetration to facilitate recovery of the real estate sector. RERA is expected to create
confidence among buyers by bringing in transparency, while lower cost of borrowing and
increasing penetration of housing finance are expected to boost demand.
Figure a: Increase in finance penetration in urban areas
to induce housing demand… Figure b: …along with decrease in cost of borrowing
Source: Industry, CRISIL Research Source: Industry, CRISIL Research
We expect RERA to be positive for the organised developers as supply declines and demand
recovery is facilitated by increased transparency. This is expected to benefit organised
players to gain market share.
3.4%4.0%
4.6%
7.8%
9.1%9.4%9.8%
11.00%11.5%
12.3%
0.0%
2.0%
4.0%
6.0%
8.0%
10.0%
12.0%
14.0%
Mar-13 Mar-14 Mar-15 Mar-16 Sep-16
Gross NPA as % of gross advances Stressed assets
1,118 1,205 1,261 1,544 1,680 1,776 1,856
7.8%
4.6%
22.4%
8.8%
5.7%4.5%
0%
5%
10%
15%
20%
25%
-
200
400
600
800
1,000
1,200
1,400
1,600
1,800
2,000
FY11 FY12 FY13 FY14 FY15 FY16 FY17
(₹ bn)
Bank's outstanding credit to commercial real estatey-o-y growth (RHS)
39.0%
42.7%44.8%
30%
32%
34%
36%
38%
40%
42%
44%
46%
48%
50%
FY12 FY16 FY19P
Finance penetration in urban areas
11.0% 10.8% 10.5% 10.4%9.9%
9.4%8.9% 8.8%
0.0%
2.0%
4.0%
6.0%
8.0%
10.0%
12.0%
FY
12
FY
13
FY
14
FY
15
FY
16
FY
17
FY
18P
FY
19P
Average home loan rate

7
Figure c: RERA to bring in greater transparency and increase buyer confidence
Source: Industry, CRISIL Research
Absorption expected to pick up in 2019
We expect gradual recovery in absorption from 2019 onwards as 2018 is still expected to
witness sluggish growth in demand. However, we expect absorption in the residential
segment to decline in 2017. The residential segment remained under pressure in 2016 in
the key metros of Mumbai, Pune, Bengaluru, Chennai, Kolkata and NCR where absorption
declined 4-5%. Only Hyderabad reported an increase in absorption. The near-term outlook
for the real estate industry is muted. Pile-up in inventory and stagnant new launches have
strained cash flows of most developers, especially smaller ones, in the past couple of years.
Figure d: Absorption expected to pick up in 2019… Figure e: …after decline in 2017 in most key markets
Source: CRISIL Research Source: CRISIL Research
RERA - key features
Registration of project
before putting up for sale launch
Changes to the plan will
require written consent of
buyer
Regulatory forum in
every state
To deposit 70% of
collected money in escrow account
Property to be sold
based on carpet area
Levy of 10%
interest as penalty in case of delay
7%
4%6% 5%
7%
4%5%
0%
1%
2%
3%
4%
5%
6%
7%
8%
Mum
ba
i
Pun
e
Ben
ga
luru
Ch
en
nai
Hyd
era
bad
Kolk
ata
NC
R
Absorption of residential units in 2019 over 2018
-8%
-3%
-8%
-8%
-7%
-8%
-14%
-15% -10% -5% 0%
Mumbai
Pune
Bengaluru
Chennai
Hyderabad
Kolkata
NCR
Absorption of residential units in 2017 over 2016
8
Prudent risk management policies ensured healthy asset quality and successful exits
in real estate book
The company has maintained healthy asset quality in real estate, despite riskier nature of
the asset class. Management has indicated that there have been nil NPAs in its real estate
loan book since inception. The company has been able to maintain healthy asset quality
owing to-
● Fixed limit (as a percentage of book) on lending to a particular developer
● Focus on lending to reputed and quality developers who have completed project at least
10 years ago
● ~88% (Q1FY18) of the book is backed by cash flows
● ~84% (Q1FY18) of the lending book against residential projects (non-investor markets)
and mostly in tier-I cities
The company’s loan book is seasoned as evident from its experience of six-seven years in
the real estate lending space. Loan tenor of two-four years enabled it to log several
successful exits in the past three-four years.
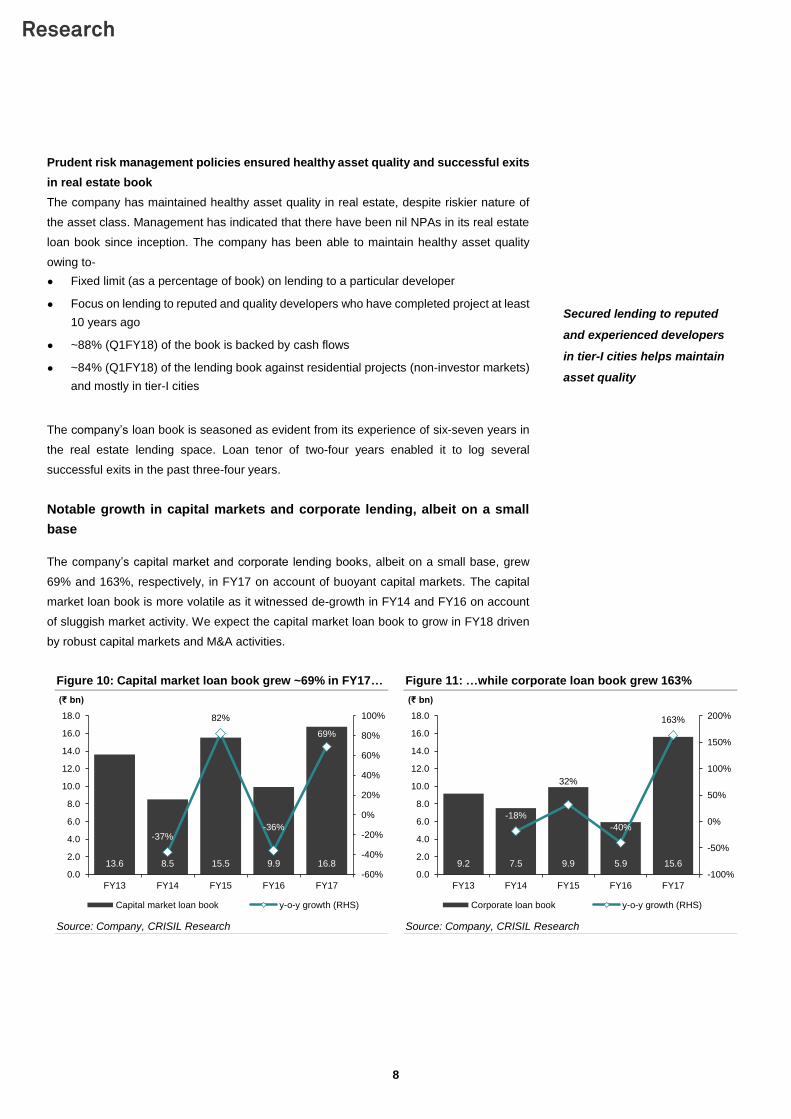
Notable growth in capital markets and corporate lending, albeit on a small
base
The company’s capital market and corporate lending books, albeit on a small base, grew
69% and 163%, respectively, in FY17 on account of buoyant capital markets. The capital
market loan book is more volatile as it witnessed de-growth in FY14 and FY16 on account
of sluggish market activity. We expect the capital market loan book to grow in FY18 driven
by robust capital markets and M&A activities.
Figure 10: Capital market loan book grew ~69% in FY17… Figure 11: …while corporate loan book grew 163%
Source: Company, CRISIL Research Source: Company, CRISIL Research
13.6 8.5 15.5 9.9 16.8
-37%
82%
-36%
69%
-60%
-40%
-20%
0%
20%
40%
60%
80%
100%
0.0
2.0
4.0
6.0
8.0
10.0
12.0
14.0
16.0
18.0
FY13 FY14 FY15 FY16 FY17
(₹ bn)
Capital market loan book y-o-y growth (RHS)
9.2 7.5 9.9 5.9 15.6
-18%
32%
-40%
163%
-100%
-50%
0%
50%
100%
150%
200%
0.0
2.0
4.0
6.0
8.0
10.0
12.0
14.0
16.0
18.0
FY13 FY14 FY15 FY16 FY17
(₹ bn)
Corporate loan book y-o-y growth (RHS)
Secured lending to reputed
and experienced developers
in tier-I cities helps maintain
asset quality
9
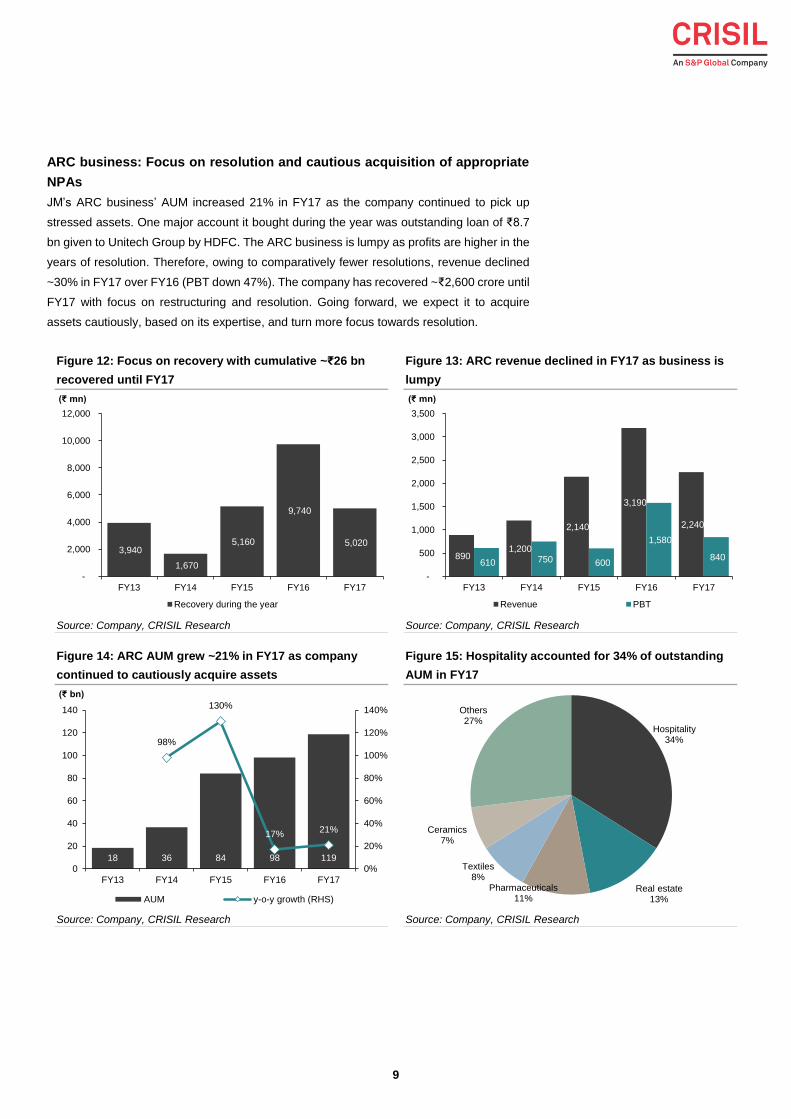
ARC business: Focus on resolution and cautious acquisition of appropriate
NPAs
JM’s ARC business’ AUM increased 21% in FY17 as the company continued to pick up
stressed assets. One major account it bought during the year was outstanding loan of ₹8.7
bn given to Unitech Group by HDFC. The ARC business is lumpy as profits are higher in the
years of resolution. Therefore, owing to comparatively fewer resolutions, revenue declined
~30% in FY17 over FY16 (PBT down 47%). The company has recovered ~₹2,600 crore until
FY17 with focus on restructuring and resolution. Going forward, we expect it to acquire
assets cautiously, based on its expertise, and turn more focus towards resolution.
Figure 12: Focus on recovery with cumulative ~₹26 bn
recovered until FY17
Figure 13: ARC revenue declined in FY17 as business is
lumpy
Source: Company, CRISIL Research Source: Company, CRISIL Research
Figure 14: ARC AUM grew ~21% in FY17 as company
continued to cautiously acquire assets
Figure 15: Hospitality accounted for 34% of outstanding
AUM in FY17
Source: Company, CRISIL Research Source: Company, CRISIL Research
3,940
1,670
5,160
9,740
5,020
-
2,000
4,000
6,000
8,000
10,000
12,000
FY13 FY14 FY15 FY16 FY17
(₹ mn)
Recovery during the year
890 1,200
2,140
3,190
2,240
610 750 600
1,580
840
-
500
1,000
1,500
2,000
2,500
3,000
3,500
FY13 FY14 FY15 FY16 FY17
(₹ mn)
Revenue PBT
18 36 84 98 119
98%
130%
17%21%
0%
20%
40%
60%
80%
100%
120%
140%
0
20
40
60
80
100
120
140
FY13 FY14 FY15 FY16 FY17
(₹ bn)
AUM y-o-y growth (RHS)
Hospitality34%
Real estate13%
Pharmaceuticals11%
Textiles8%
Ceramics7%
Others27%
10
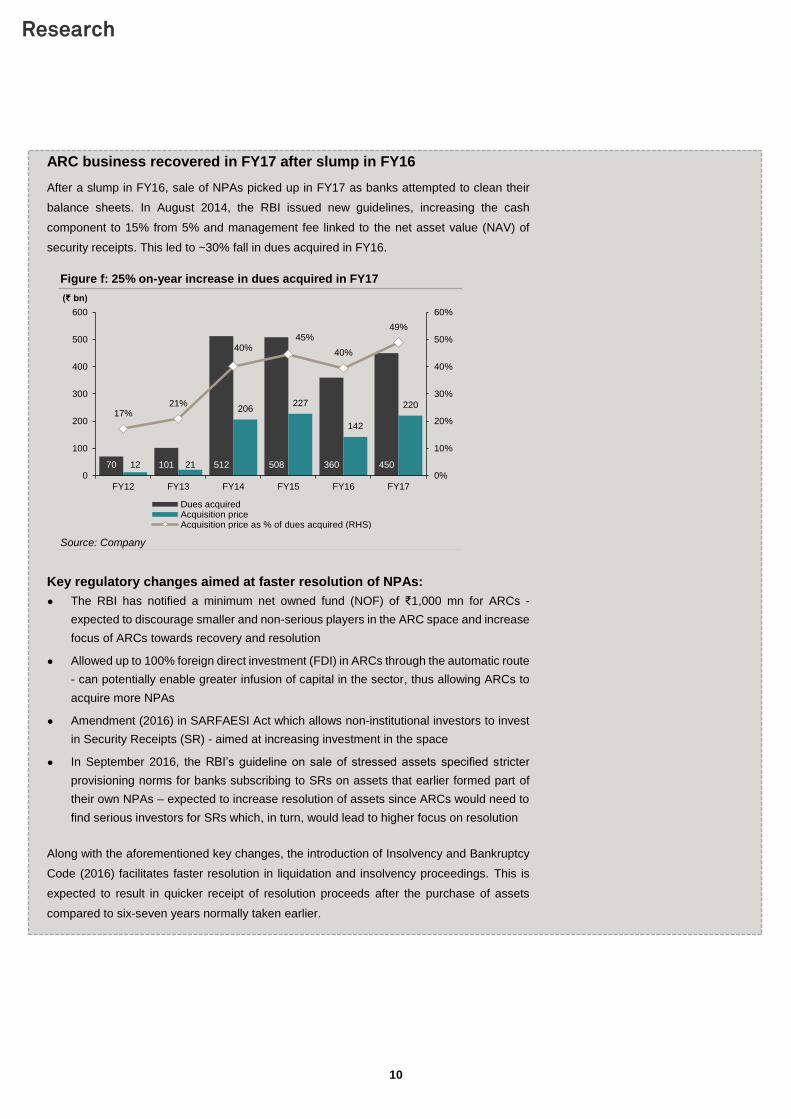
ARC business recovered in FY17 after slump in FY16
After a slump in FY16, sale of NPAs picked up in FY17 as banks attempted to clean their
balance sheets. In August 2014, the RBI issued new guidelines, increasing the cash
component to 15% from 5% and management fee linked to the net asset value (NAV) of
security receipts. This led to ~30% fall in dues acquired in FY16.
Figure f: 25% on-year increase in dues acquired in FY17
Source: Company
Key regulatory changes aimed at faster resolution of NPAs:
● The RBI has notified a minimum net owned fund (NOF) of ₹1,000 mn for ARCs -
expected to discourage smaller and non-serious players in the ARC space and increase
focus of ARCs towards recovery and resolution
● Allowed up to 100% foreign direct investment (FDI) in ARCs through the automatic route
- can potentially enable greater infusion of capital in the sector, thus allowing ARCs to
acquire more NPAs
● Amendment (2016) in SARFAESI Act which allows non-institutional investors to invest
in Security Receipts (SR) - aimed at increasing investment in the space
● In September 2016, the RBI’s guideline on sale of stressed assets specified stricter
provisioning norms for banks subscribing to SRs on assets that earlier formed part of
their own NPAs – expected to increase resolution of assets since ARCs would need to
find serious investors for SRs which, in turn, would lead to higher focus on resolution
Along with the aforementioned key changes, the introduction of Insolvency and Bankruptcy
Code (2016) facilitates faster resolution in liquidation and insolvency proceedings. This is
expected to result in quicker receipt of resolution proceeds after the purchase of assets
compared to six-seven years normally taken earlier.
70 101 512 508 360 45012 21
206227
142
22017%
21%
40%45%
40%
49%
0%
10%
20%
30%
40%
50%
60%
0
100
200
300
400
500
600
FY12 FY13 FY14 FY15 FY16 FY17
(₹ bn)
Dues acquiredAcquisition priceAcquisition price as % of dues acquired (RHS)
11
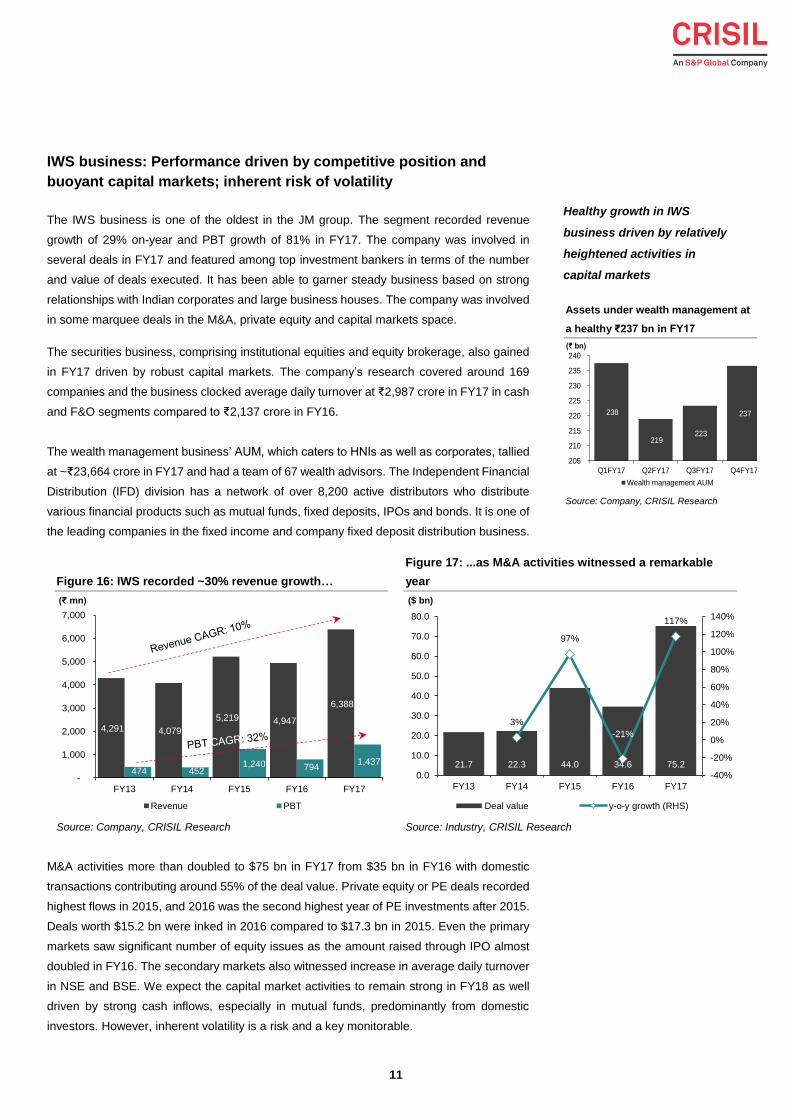
IWS business: Performance driven by competitive position and
buoyant capital markets; inherent risk of volatility
The IWS business is one of the oldest in the JM group. The segment recorded revenue
growth of 29% on-year and PBT growth of 81% in FY17. The company was involved in
several deals in FY17 and featured among top investment bankers in terms of the number
and value of deals executed. It has been able to garner steady business based on strong
relationships with Indian corporates and large business houses. The company was involved
in some marquee deals in the M&A, private equity and capital markets space.
The securities business, comprising institutional equities and equity brokerage, also gained
in FY17 driven by robust capital markets. The company’s research covered around 169
companies and the business clocked average daily turnover at ₹2,987 crore in FY17 in cash
and F&O segments compared to ₹2,137 crore in FY16.
The wealth management business’ AUM, which caters to HNIs as well as corporates, tallied
at ~₹23,664 crore in FY17 and had a team of 67 wealth advisors. The Independent Financial
Distribution (IFD) division has a network of over 8,200 active distributors who distribute
various financial products such as mutual funds, fixed deposits, IPOs and bonds. It is one of
the leading companies in the fixed income and company fixed deposit distribution business.
Figure 16: IWS recorded ~30% revenue growth…
Figure 17: ...as M&A activities witnessed a remarkable
year
Source: Company, CRISIL Research Source: Industry, CRISIL Research
M&A activities more than doubled to $75 bn in FY17 from $35 bn in FY16 with domestic
transactions contributing around 55% of the deal value. Private equity or PE deals recorded
highest flows in 2015, and 2016 was the second highest year of PE investments after 2015.
Deals worth $15.2 bn were inked in 2016 compared to $17.3 bn in 2015. Even the primary
markets saw significant number of equity issues as the amount raised through IPO almost
doubled in FY16. The secondary markets also witnessed increase in average daily turnover
in NSE and BSE. We expect the capital market activities to remain strong in FY18 as well
driven by strong cash inflows, especially in mutual funds, predominantly from domestic
investors. However, inherent volatility is a risk and a key monitorable.
4,291 4,079
5,219 4,947
6,388
474 452 1,240 794
1,437
-
1,000
2,000
3,000
4,000
5,000
6,000
7,000
FY13 FY14 FY15 FY16 FY17
(₹ mn)
Revenue PBT
21.7 22.3 44.0 34.6 75.2
3%
97%
-21%
117%
-40%
-20%
0%
20%
40%
60%
80%
100%
120%
140%
0.0
10.0
20.0
30.0
40.0
50.0
60.0
70.0
80.0
FY13 FY14 FY15 FY16 FY17
($ bn)
Deal value y-o-y growth (RHS)
Healthy growth in IWS
business driven by relatively
heightened activities in
capital markets
Assets under wealth management at
a healthy ₹237 bn in FY17
Source: Company, CRISIL Research
238
219 223
237
205
210
215
220
225
230
235
240
Q1FY17 Q2FY17 Q3FY17 Q4FY17
(₹ bn)
Wealth management AUM
12
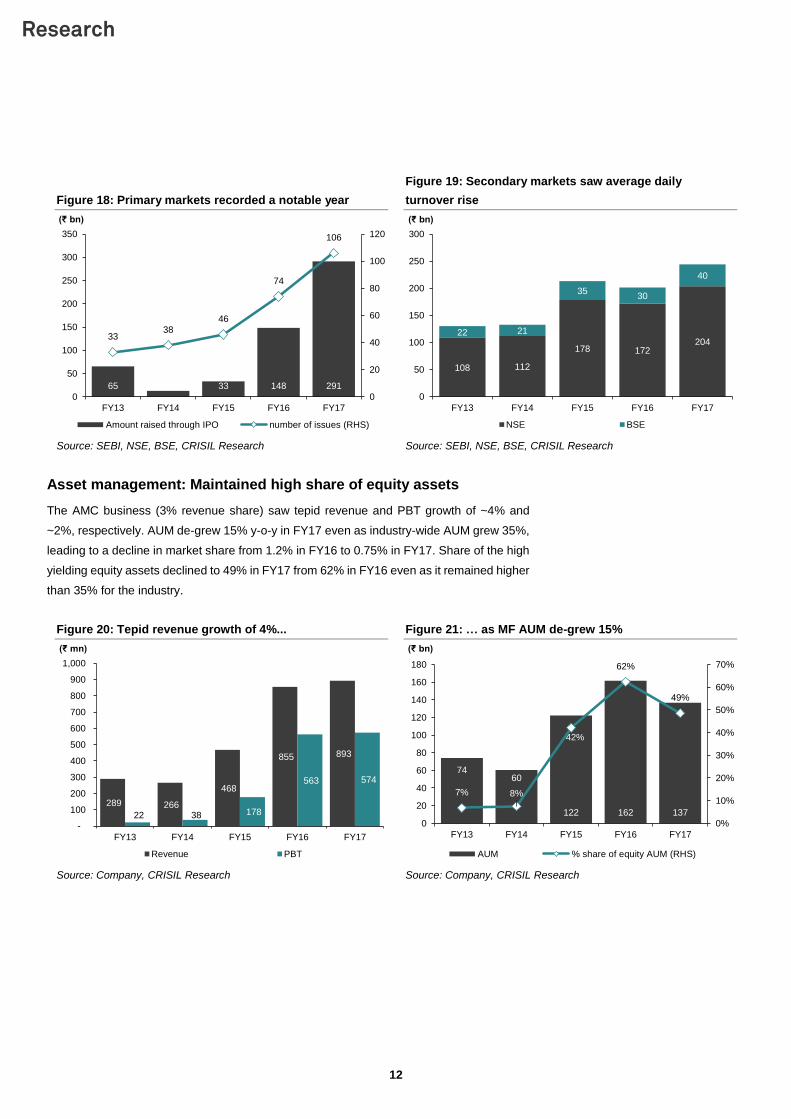
Figure 18: Primary markets recorded a notable year
Figure 19: Secondary markets saw average daily
turnover rise
Source: SEBI, NSE, BSE, CRISIL Research Source: SEBI, NSE, BSE, CRISIL Research
Asset management: Maintained high share of equity assets
The AMC business (3% revenue share) saw tepid revenue and PBT growth of ~4% and
~2%, respectively. AUM de-grew 15% y-o-y in FY17 even as industry-wide AUM grew 35%,
leading to a decline in market share from 1.2% in FY16 to 0.75% in FY17. Share of the high
yielding equity assets declined to 49% in FY17 from 62% in FY16 even as it remained higher
than 35% for the industry.
Figure 20: Tepid revenue growth of 4%... Figure 21: … as MF AUM de-grew 15%
Source: Company, CRISIL Research Source: Company, CRISIL Research
65 12 33 148 291
3338
46
74
106
0
20
40
60
80
100
120
0
50
100
150
200
250
300
350
FY13 FY14 FY15 FY16 FY17
(₹ bn)
Amount raised through IPO number of issues (RHS)
108 112
178 172204
22 21
3530
40
0
50
100
150
200
250
300
FY13 FY14 FY15 FY16 FY17
(₹ bn)
NSE BSE
289 266
468
855 893
22 38 178
563 574
-
100
200
300
400
500
600
700
800
900
1,000
FY13 FY14 FY15 FY16 FY17
(₹ mn)
Revenue PBT
7460
122 162 137
7% 8%
42%
62%
49%
0%
10%
20%
30%
40%
50%
60%
70%
0
20
40
60
80
100
120
140
160
180
FY13 FY14 FY15 FY16 FY17
(₹ bn)
AUM % share of equity AUM (RHS)

13
Figure 22: MF industry’s AUM grew 35% Figure 23: JM continues to be a small player
Source: Company, CRISIL Research, AMFI Source: Company, CRISIL Research, AMFI
Alternate asset management: New PE fund in capital raising mode
The company’s PE Fund II has received Sebi registration as Cat II – AIF and is in the process
of raising capital. Similar to the first fund, which is now in exit mode, Fund II is an India-
focused private equity fund, with the aim of providing growth capital to dynamic and fast
growing mid-market companies.
JM Financial Property Fund is a real estate-focused private equity fund that has invested in
residential, hospitality and mixed use development assets at individual projects or at the
holding level in development companies. The fund continues to focus on exploring exit
opportunities for its outstanding portfolio investments. During the year, the fund’s domestic
scheme received consent from investors to extend the tenure by two years.
Affordable housing finance and SME lending: Exploring new
opportunities
JM is also exploring new opportunities in affordable housing and SME lending. It has floated
a housing finance company (HFC) and has made an application to National Housing Bank
(NHB) for a licence. In the affordable housing space, the company will lend to homebuyers
whereas it will offer several products in the SME lending space. Though we believe there
are significant opportunities in these segments, they entail a different set of expertise. We
have not factored any meaningful revenue from these new businesses in our projections for
FY18 as the company is expected to enter these businesses by the end of 2017.
The company has started building the team for operating in the affordable housing segment
by hiring people for senior to mid-level managerial positions. Its geographic target market
will be outskirts of cities. The average ticket size is expected to be ₹1.5 mn to ₹2 mn. It plans
to grow affordable housing book to ₹25 bn to ₹30 bn in the next three to four years.
Healthy growth expected in low ticket housing finance industry
We expect low ticket housing loan book to grow at a healthy pace of 18-20% CAGR from
FY17 to FY21. The recent push by the government to provide 'housing for all' by 2022 and
8,232 9,099 11,946 13,588 18,350
25%
22%
32% 32%35%
0%
5%
10%
15%
20%
25%
30%
35%
40%
-
2,000
4,000
6,000
8,000
10,000
12,000
14,000
16,000
18,000
20,000
FY13 FY14 FY15 FY16 FY17
(₹ bn)
AUM % share of equity AUM (RHS)
0
500
1000
1500
2000
2500
3000
ICIC
I P
rude
ntia
l M
F
HD
FC
MF
Re
liance M
F
Birla
Sun
Life M
F
SB
I M
F
UT
I M
F
Kota
k M
ah
ind
ra M
F
Fra
nklin
…
DS
P B
lackR
ock M
F
IDF
C M
F
Axis
MF
Tata
MF
L&
T M
F
Su
nd
ara
m M
F
DH
FL P
ram
eri
ca
MF
Invesco M
F
LIC
MF
JM
Fin
an
cia
l M
F
(₹ bn)
AUM
Focus on affordable housing
finance and SME lending for
growth opportunities

14
various steps taken to implement the same are expected to boost sales of affordable, low-
cost housing units and, consequently, financing for the same. Higher government support
for the affordable housing segment (in terms of interest rate subsidy) as well as a low interest
rate scenario will push up overall housing loan demand in the next two-three years.
Figure 24: Healthy growth in low ticket housing finance… Figure 25: …with HFC to increase market share
Source: RBI, NHB, CRISIL Research Source: RBI, NHB, CRISIL Research
The company is looking at entering SME lending via several products. The new areas are
more retail-oriented and of smaller ticket size than its current expertise areas of real estate
and corporate lending. Based on inputs from research teams, the company will focus on
lending to SMEs in select sectors and regions. It plans to grow the SME lending book to ₹25
bn to ₹30 bn over the next three to four years.
NBFC to sustain impressive growth of 22-25% in SME lending
Lending to the SME sector is expected to increase 12-14% annually over the next four years.
We expect the share of NBFCs to increase from the current 6.4% as growth is expected to
be higher in non-metros. Growth will also be supported by better customer reach, greater
focus, faster documentation process and higher risk appetite. NBFCs are gaining on money
lenders as well as banks by offering higher loan amount, better service, faster turnaround
time and lesser documentation.
4,564
7,805
15,539
-
2,000
4,000
6,000
8,000
10,000
12,000
14,000
16,000
18,000
FY13 FY17 FY21E
(₹ bn)
Loan book - less than Rs 2.5 million
66% 65% 64%
34% 35% 36%
0%
10%
20%
30%
40%
50%
60%
70%
80%
90%
100%
FY16 FY17 FY19P
Banks HFC

15
Figure 26: NBFCs to sustain impressive growth… Figure 27: …leading to increase in market share
Source: RBI, NHB, CRISIL Research Source: RBI, NHB, CRISIL Research
Rationalising corporate structure for capital and operational
efficiency
The company is looking to reorganise its business -- it plans to offer similar services under
one vertical to drive operational efficiencies. For instance, financing needs of wealth
customers shall now be served by its subsidiary (JM Financial Capital Ltd) of the IWS vertical
(fig: 31 for details on corporate structure). This will enable it serve multiple needs of the client
under one business vertical more efficiently.
11,345 11,733
19,205
597 746 1,822
-
5,000
10,000
15,000
20,000
25,000
FY16 FY17 FY21P
(₹ bn)
MSME loan book - overall MSME loan book - NBFC
5.3%6.4%
8.1%
0.0%
1.0%
2.0%
3.0%
4.0%
5.0%
6.0%
7.0%
8.0%
9.0%
FY16 FY17 FY19P
Share of NBFC

16
Key Risks
Linkage with capital market
JM’s IWS and capital market lending prospects are correlated with capital markets. Capital
markets are inherently volatile, driven by economic and political factors as well as public
sentiment. Any potential instability would also have a significant impact on the company’s
earnings potential.
Regulatory uncertainty
As in the case of banks, the RBI’s regulations have deeply affected the business models of
NBFCs and ARCs. Any adverse regulation or tightening of norms can further impact
profitability and viability of the company’s NBFC and ARC businesses.
Declining yields owing to competition in real estate lending
The real estate lending business constitutes ~72% of the company’s lending portfolio. Real
estate lending is primarily linked to the economic condition in tier-I cities such as Mumbai,
Bengaluru, Chennai and Pune. Downturn in these cities could significantly impact growth
and yields, and our estimates unfavourably.

17
Q1FY18 result update
Revenue and earnings in line with expectations
JM’s Q1FY18 revenue increased 49% y-o-y (declined 2% q-o-q) to ₹7.1 bn driven by the
fund-based business – which grew 53% y-o-y and 5% q-o-q. Adjusted PAT increased 49%
y-o-y, but declined 15% q-o-q, to ₹1,282 mn. The lending book (60% revenue share) grew
65% y-o-y and 7% q-o-q to ₹121.1 bn.
Lending business continues to witness growth momentum
The real estate lending book remained flat compared to the last quarter and increased 42%
over Q1FY17. The capital market book grew 24% q-o-q and 88% y-o-y to ₹20.7 bn, whereas
the corporate lending book grew 25% q-o-q and 247% y-o-y to ₹19.6 bn. NIM was 7.1%
(down 30 bps q-o-q). GNPA declined from 0.1% in Q4FY17 to 0.0%. Even as capital
adequacy ratio declined to 22.7% from 27.6% in Q1FY17, there is still sufficient headroom
for growth over the next two years.
Revenue traction in IWS segment remains healthy
The IWS business’ revenue increased 44% y-o-y (down 21% q-o-q) to ₹1,768 mn. The
company has a healthy pipeline of M&A and capital market-related deals. JM’s equity market
share on the NSE increased from 2.99% last quarter to 3.4%.
Q1FY18 Results Summary (Consolidated)
₹ mn Q1FY18 Q4FY17 Q1FY17 q-o-q (%) y-o-y (%)*
Income from operations 7,091 7,250 4,765 -2% 49%
Employee Cost 979 799 662 23% 48%
Other expenses 733 988 582 -26% 26%
EBITDA 5,379 5,463 3,521 -2% 53%
EBITDA margin 76% 75% 74% 49 bps 197 bps
Depreciation 64 63 53 1% 20%
EBIT 5,315 5,401 3,468 -2% 53%
Interest and finance charges 2,617 2,138 1,757 22% 49%
Operating PBT 2,698 3,262 1,711 -17% 58%
PBT 2,698 3,262 1,711 -17% 58%
Tax 917 1,160 588 -21% 56%
PAT 1,781 2,103 1,123 -15% 59%
Minority Interest 501 596 310 -16% 62%
Profit of Associates 2 2 48 12% -95%
Adj PAT 1,282 1,508 861 -15% 49%
Adj PAT margin 18% 21% 18% -273 bps 1 bps
No of equity shares (mn) 796.8 794.5 789.6 NM NM
Adj EPS (₹) 1.6 1.9 1.1 -15% 48%
*Note: ARC figures in the statement of profit and loss are consolidated on line by line basis from
October 1, 2016. The ARC was an “associate” of JM Financial until September 30, 2016. Therefore,
Q1FY18 figures are not strictly comparable with Q1FY17 numbers.
Source: Company, CRISIL Research

18
Q1FY18 segment-wise revenue summary (consolidated)
₹ mn Q1FY18 Q4FY17 Q1FY17 q-o-q (%) y-o-y (%)
IWS business 1,768 2,228 1,232 -21% 44%
Fund-based activities 5,020 4,782 3,276 5% 53%
Alternative asset management 81 10 18 742% 341%
Asset management 221 259 182 -15% 22%
Others 1,233 744 299 66% 313%
Total segment revenue 8,324 8,022 5,006 4% 66%
Less: Inter-segment revenue 1,233 773 241 60% 411%
Income from operations 7,091 7,250 4,765 22% 52%
Source: Company, CRISIL Research
Q1FY18 segment-wise profit before tax summary (consolidated)
₹ mn Q1FY18 Q4FY17 Q1FY17 q-o-q (%) y-o-y (%)
IWS business 363 691 205 -47% 77%
Fund-based activities 2,190 2,395 1,429 -9% 53%
Alternative asset management (4) (19) (16) -76% -72%
Asset management 138 187 97 -26% 42%
Others 12 8 (4) 47% -387%
Total 2,698 3,262 1,711 -17% 58%
Source: Company, CRISIL Research
19
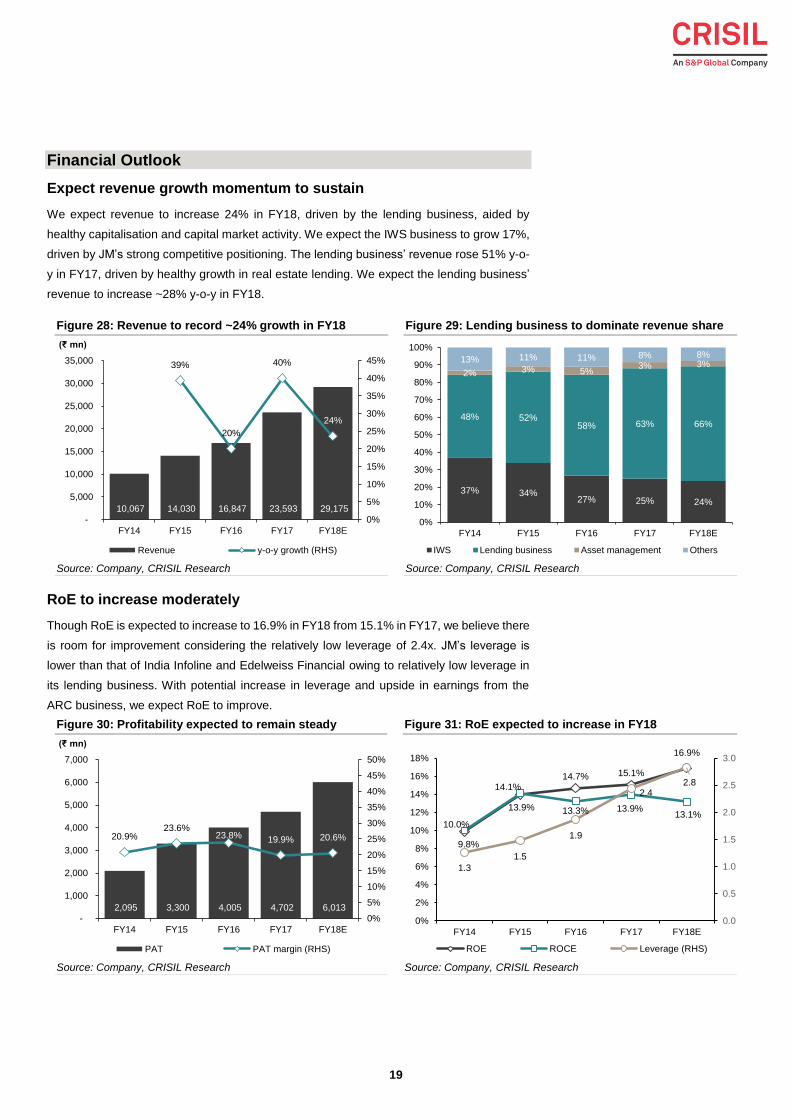
Financial Outlook
Expect revenue growth momentum to sustain
We expect revenue to increase 24% in FY18, driven by the lending business, aided by
healthy capitalisation and capital market activity. We expect the IWS business to grow 17%,
driven by JM’s strong competitive positioning. The lending business’ revenue rose 51% y-o-
y in FY17, driven by healthy growth in real estate lending. We expect the lending business’
revenue to increase ~28% y-o-y in FY18.
Figure 28: Revenue to record ~24% growth in FY18 Figure 29: Lending business to dominate revenue share
Source: Company, CRISIL Research Source: Company, CRISIL Research
RoE to increase moderately
Though RoE is expected to increase to 16.9% in FY18 from 15.1% in FY17, we believe there
is room for improvement considering the relatively low leverage of 2.4x. JM’s leverage is
lower than that of India Infoline and Edelweiss Financial owing to relatively low leverage in
its lending business. With potential increase in leverage and upside in earnings from the
ARC business, we expect RoE to improve.
Figure 30: Profitability expected to remain steady Figure 31: RoE expected to increase in FY18
Source: Company, CRISIL Research Source: Company, CRISIL Research
10,067 14,030 16,847 23,593 29,175
39%
20%
40%
24%
0%
5%
10%
15%
20%
25%
30%
35%
40%
45%
-
5,000
10,000
15,000
20,000
25,000
30,000
35,000
FY14 FY15 FY16 FY17 FY18E
(₹ mn)
Revenue y-o-y growth (RHS)
37% 34%27% 25% 24%
48% 52%58% 63% 66%
2% 3% 5%3% 3%
13% 11% 11% 8% 8%
0%
10%
20%
30%
40%
50%
60%
70%
80%
90%
100%
FY14 FY15 FY16 FY17 FY18E
IWS Lending business Asset management Others
2,095 3,300 4,005 4,702 6,013
20.9%23.6%
23.8% 19.9% 20.6%
0%
5%
10%
15%
20%
25%
30%
35%
40%
45%
50%
-
1,000
2,000
3,000
4,000
5,000
6,000
7,000
FY14 FY15 FY16 FY17 FY18E
(₹ mn)
PAT PAT margin (RHS)
9.8%
13.9%
14.7% 15.1%
16.9%
10.0%
14.1%
13.3% 13.9%13.1%
1.3
1.5
1.9
2.42.8
0.0
0.5
1.0
1.5
2.0
2.5
3.0
0%
2%
4%
6%
8%
10%
12%
14%
16%
18%
FY14 FY15 FY16 FY17 FY18E
ROE ROCE Leverage (RHS)

20
Figure 32: JM’s leverage is significantly lower than that of peers
Source: Company, CRISIL Research
6.15.5
4.4
3.5 3.4
2.4
0.0
1.0
2.0
3.0
4.0
5.0
6.0
7.0
L&T financeholdings
EdelweissFinancial
IIFL Holdings Shriram cityunion finance
ReligareEnterprises
JM Financial
Leverage
21
Management Overview
CRISIL's fundamental grading methodology includes a broad assessment of management
quality, apart from other key factors such as industry and business prospects, and financial
performance.
Highly qualified and experienced management team
Led by Mr Nimesh Kampani, Group Chairman, JM Financial operates through subsidiaries,
joint ventures and associate companies. Mr Kampani has over four decades of experience
in the Indian capital markets and has played a pivotal role in not only making JM Financial
an integrated player, but also fostered development of the financial market. Mr Vishal
Kampani, Mr Nimesh Kampani’s son, is the Managing Director of JM Financial - the group’s
flagship listed company. He joined the group in 1997 and has worked in different
departments in various capacities.
Each business is headed by experienced professionals with in-depth understanding of
financial markets and their relevant business segments.
● Manish Sheth is the Group Chief Financial Officer. He has over a decade of experience
in financial consultancy, management consultancy, taxation, accounting and company
laws. Mr Gagan Kothari is the CFO of JM Financial Credit Solutions Ltd – the primary
real estate lending NBFC of the group.
● Dipti Neelakantan is the Group Chief Operating Officer with about four decades of
experience in IB.
Decision making is decentralised
An experienced second line of management supports different businesses. Several
members of the senior management, who lead various business segments and manage day-
to-day operations, have been associated with the company for almost a decade. Our
previous interaction with business heads (of ARC and NBFC) indicates that business units
enjoy sufficient autonomy in decision making, which enhances operational flexibility.
Shown intent to grow the business
The top management’s intent for diversified growth is apparent from the exploring of new
opportunities. Management is looking at entering the affordable housing and SME lending
space based on available opportunities. Also, as mentioned, JM’s PE Fund II has received
Sebi registration as Cat II – AIF, and is in the process of raising capital. The company has
hired Mr Darius Pandole to head the PE division. He was partner at PE fund New Silk Route.
Even in the existing real estate lending business, management is exploring entering new
geographies.
22
Corporate Governance
CRISIL’s fundamental grading methodology includes a broad assessment of corporate
governance and management quality, apart from other key factors such as industry and
business prospects, and financial performance. In this context, CRISIL Research analyses
the shareholding structure, board composition, typical board processes, disclosure
standards and related-party transactions. Any qualifications by regulators or auditors also
serve as useful inputs while assessing a company’s corporate governance.
Corporate governance at JM Financial is good. It is supported by a strong board and efficient
board practices. It adheres to all regulatory requirements.
A well-structured board with diverse knowledge
JM has an eight-member board, six of whom are independent, which meets Clause 49 of
Sebi’s listing guidelines. The board is chaired by Nimesh Kampani. The independent
directors are well qualified and bring significant diverse domain knowledge in consulting,
corporate restructuring, project finance and strategic advisory. EA Kshirsagar is the
independent director and chairman of the audit committee. He has three decades of
experience in consulting and also serves on the board of other public listed companies in
India. Independent directors have good understanding of the business. The company has all
the necessary committees – audit, remuneration and investor grievance – in place. Board
meetings are held at regular intervals. JM’s board processes and systems seem satisfactory.
Consistent dividend payment policy
● Consistent payment of dividends – Over the past few years, the company has
maintained a healthy dividend payout. The average dividend payout ratio over FY13-17
was around 32%.
● Appointment of new auditors – M/s. Khimji Kunverji & Co. has been the auditor for
over a decade. The company has appointed Deloitte Haskins & Sells LLP as statutory
auditor for a period of five years in its AGM held in July 2017.

23
Valuation Grade: 3/5
We continue to use the SoTP method to value JM. The IWS business is valued at a P/E
multiple of 15x FY18E EPS. The P/B multiple on FY18E book value for the fund-based
business is raised to 3x. The ARC business is valued separately at a P/B multiple of 2.4x
FY18E book value per share. We have raised our FY18 fair value estimate to ₹150 per share.
At the current market price of ₹143 per share, our valuation grade is 3/5.
SoTP Valuation
Methodology Multiple used Parameter
Parameter value
adjusted for JM’s stake
Valuation
(per share)
Lending business P/B 3x FY18E net
worth ₹24,681 mn ₹92
IWS business P/E 15x FY18E
earnings ₹1,380 mn ₹26
ARC business P/B 2.4x FY18E net
worth ₹3,326 mn ₹10
AMC business % of AUM 4% FY18E AUM ₹85,523 mn ₹5
Alternative asset management
and Excess cash and
investments
₹17
Fair value as on FY18 ₹ 150
TTM P/E band TTM P/B band
Source: NSE, CRISIL Research Source: NSE, CRISIL Research
0
50
100
150
200
250
Oct-
11
Feb
-12
Ju
n-1
2
Oct-
12
Feb
-13
Ju
l-13
No
v-1
3
Mar-
14
Ju
l-14
No
v-1
4
Apr-
15
Aug
-15
De
c-1
5
Apr-
16
Aug
-16
Ja
n-1
7
May-1
7
Sep
-17
(₹)
JM 6x 12x 18x 24x 30x
0
20
40
60
80
100
120
140
160
Oct-
09
Feb
-10
Ju
n-1
0
No
v-1
0
Mar-
11
Ju
l-11
De
c-1
1
Apr-
12
Aug
-12
Ja
n-1
3
May-1
3
Sep
-13
Feb
-14
Ju
n-1
4
Oct-
14
Mar-
15
Ju
l-15
No
v-1
5
Apr-
16
Aug
-16
De
c-1
6
May-1
7
Sep
-17
(₹)
JM 0.5x 1.0x 1.5x 2.0x

24
P/E – premium / discount to CNX 500 P/E movement
Source: NSE, CRISIL Research Source: NSE, CRISIL Research
Share price movement Fair value movement since initiation
-Indexed to 100
Source: NSE, CRISIL Research
Source: NSE, CRISIL Research
-80%
-60%
-40%
-20%
0%
20%
40%
60%
80%
100%
Oct-
09
Feb
-10
Ju
n-1
0
No
v-1
0
Mar-
11
Ju
l-11
De
c-1
1
Apr-
12
Au
g-1
2
Ja
n-1
3
May-1
3
Se
p-1
3
Feb
-14
Ju
n-1
4
Oct-
14
Mar-
15
Ju
l-15
No
v-1
5
Apr-
16
Au
g-1
6
De
c-1
6
May-1
7
Se
p-1
7Premium/Discount to CNX 500Median premium/discount to CNX 500
0
5
10
15
20
25
30
35
40
45
50
Oct-
09
Fe
b-1
0
Ju
n-1
0
No
v-1
0
Mar-
11
Ju
l-11
De
c-1
1
Apr-
12
Aug
-12
Ja
n-1
3
May-1
3
Sep
-13
Fe
b-1
4
Ju
n-1
4
Oct-
14
Mar-
15
Ju
l-15
No
v-1
5
Apr-
16
Aug
-16
De
c-1
6
May-1
7
Sep
-17
(Times)
Historic PE (x) Median PE
+1 std dev
-1 std dev
0
100
200
300
400
500
600
700
800
Feb
-09
Ju
n-0
9
Oct-
09
Ma
r-1
0
Ju
l-10
No
v-1
0
Apr-
11
Aug
-11
De
c-1
1
Apr-
12
Sep
-12
Ja
n-1
3
May-1
3
Oct-
13
Feb
-14
Ju
n-1
4
No
v-1
4
Mar-
15
Ju
l-15
De
c-1
5
Apr-
16
Aug
-16
De
c-1
6
May-1
7
Sep
-17
JM Financial NIFTY 500
0
10,000
20,000
30,000
40,000
50,000
60,000
70,000
0
20
40
60
80
100
120
140
160
De
c-0
9A
pr-
10
Aug
-10
De
c-1
0M
ar-
11
Ju
l-11
No
v-1
1F
eb
-12
Ju
n-1
2O
ct-
12
Feb
-13
May-1
3S
ep
-13
Ja
n-1
4A
pr-
14
Aug
-14
De
c-1
4A
pr-
15
Ju
l-15
No
v-1
5M
ar-
16
Ju
n-1
6O
ct-
16
Feb
-17
Ju
n-1
7S
ep
-17
('000)(₹)
Total Traded Quantity (RHS) CRISIL Fair Value JM Financial

25
CRISIL IER reports released on JM Financial Ltd
Date Nature of report
Fundamental
grade Fair value
Valuation
grade
CMP
(on the date of report)
28-Dec-09 Initiating coverage 4/5 ₹57 5/5 ₹41
02-Feb-10 Q3FY10 result update 4/5 ₹57 5/5 ₹41
01-Jun-10 Q4FY10 result update 4/5 ₹50 5/5 ₹38
19-Aug-10 Q1FY11 result update 4/5 ₹45 5/5 ₹34
03-Nov-10 Q2FY11 result update 4/5 ₹45 4/5 ₹40
27-Jan-11 Detailed Report 4/5 ₹45 5/5 ₹22
21-Feb-11 Q3FY11 result update 4/5 ₹45 5/5 ₹25
14-Jun-11 Q4FY11 result update 4/5 ₹42 5/5 ₹24
04-Aug-11 Q1FY12 result update 4/5 ₹42 5/5 ₹22
08-Nov-11 Q2FY12 result update 4/5 ₹33 5/5 ₹19
24-Nov-11 Detailed Report 4/5 ₹36 5/5 ₹15
20-Feb-12 Q3FY12 result update 4/5 ₹36 5/5 ₹18
27-June-12 Q4FY12 result update 4/5 ₹36 5/5 ₹12
29-Aug-12 Q1FY13 result update 4/5 ₹36 5/5 ₹14
28-Nov-12 Q2FY13 result update 4/5 ₹36 5/5 ₹17
06-Dec-12 Detailed Report 4/5 ₹36 5/5 ₹18
05-Mar-13 Q3FY13 result update 4/5 ₹36 5/5 ₹16
07-June-13 Q4FY13 result update 4/5 ₹36 4/5 ₹29
10-Sep-13 Q1FY14 result update 4/5 ₹36 5/5 ₹24
08-Nov-13 Q2FY14 result update 4/5 ₹36 5/5 ₹28
21-Feb-14 Q3FY14 result update 4/5 ₹36 5/5 ₹26
23-May-14 Q4FY14 result update 4/5 ₹42 4/5 ₹37
12-Aug-14 Q1FY15 result update 4/5 ₹49 4/5 ₹40
11-Nov-14 Q2FY15 result update 4/5 ₹49 3/5 ₹47
23-Feb-15 Q3FY15 result update 4/5 ₹70 5/5 ₹53
23-Jun-15 Detailed report 4/5 ₹70 5/5 ₹46
18-Aug-15 Q1FY16 result update 4/5 ₹70 5/5 ₹53
08-Dec-15 Q2FY16 result update 4/5 ₹70 5/5 ₹37
27-June-16 Detailed report 4/5 ₹70 5/5 ₹51
30-Aug-16 Q1FY17 result update 4/5 ₹84 5/5 ₹66
08-Dec-16 Q2FY17 result update 4/5 ₹84 4/5 ₹71
06-Mar-17 Q3FY17 result update 4/5 ₹102 4/5 ₹82
12-Jun-17 Q4FY17 result update 4/5 ₹110 2/5 ₹126
03-Oct-17 Detailed report 4/5 ₹150 3/5 ₹143

26
Company Overview
Established in 1973, JM Financial is an integrated financial services player, operating across
varied business such as investment banking, equity, debt, commodity sales and trading,
wealth management, portfolio management services, asset management, alternative asset
management, financing and lending and distressed asset management. These businesses
are managed as strategic business units and organised as separate companies headed by
a team of professionals. The group caters to corporates, HNIs and retail investors through
its subsidiaries / joint ventures / associate companies.
Figure 33: Organisational structure*
Source: Company, CRISIL Research
*Note: as on June 30, 2017

27
Milestones
1973 ● Establishment of JM Financial & Investment Consultancy Services Pvt. Ltd
1986 ● Ventured into stock broking and the securities broking business
1997 ● Joint venture with Morgan Stanley to offer IB and securities broking services
2006 ● Launch of PE fund, JM Financial India Fund, with US-based Old Lane Partners, LP
2007
● Termination of joint venture with Morgan Stanley
● Acquired 60% stake in ASK Securities – specialised in institutional broking business
● Launch of the real estate fund
2008-12
● Acquired the remaining 40% stake in ASK Securities and rechristened JM Financial Institutional Securities Pvt.
Ltd
● Strategic co-operation with Rand Merchant Bank of South Africa to offer M&A advisory services to Indian and
African corporates
● Expanded to international markets
● Commenced asset reconstruction business
2012-till
date
● Announced partnership in real estate NBFC, with an investment made by Vikram Pandit
● Announced the appointment of Mr Vishal Kampani as MD of JM Financial Ltd. Mr Nimesh Kampani continues to
be the non-executive chairman of the group and a director on the board of a few group companies
● Floated HFC and applied to NHB for licence
Source: Company

28
Annexure: Financials (Consolidated)
Source: CRISIL Research
Income statement Balance Sheet
(₹ mn) FY15 FY16 FY17 FY18E (₹ mn) FY15 FY16 FY17 FY18E
Operating income 13,984 16,847 23,593 29,175 Liabilities
EBITDA 9,554 12,254 17,995 23,038 Equity share capital 784 789 795 799
EBITDA margin 68.3% 72.7% 76.3% 79.0% Reserves 24,646 28,306 32,532 37,108
Depreciation 181 203 233 250 Minorities 6,546 6,686 11,092 12,942
EBIT 9,374 12,051 17,761 22,788 Share w arrants - - - -
Interest 4,202 5,121 7,820 10,875 Net worth 31,976 35,780 44,419 50,849
Operating PBT 5,172 6,930 9,942 11,913 Convertible debt - - - -
Other income (2) (1) (24) - Other debt 47,239 66,729 108,032 143,412
Exceptional inc/(exp) (13) (1) (196) - Total debt 47,239 66,729 108,032 143,412
PBT 5,157 6,929 9,721 11,913 Deferred tax liability (net) 873 853 683 665
Tax provision 1,557 2,225 3,353 4,050 Total liabilities 80,088 103,362 153,134 194,926
Assets
301 699 1,667 1,850 Net f ixed assets 3,334 3,317 3,726 3,765
PAT (Reported) 3,300 4,005 4,702 6,013 Capital WIP 25 86 38 113
Less: Exceptionals (13) (1) (196) - Total fixed assets 3,359 3,403 3,764 3,878
Adjusted PAT 3,312 4,006 4,898 6,013 Investments 5,383 7,855 5,532 8,532
Current assets
Inventory (securities held as stock in trade)3,510 2,539 97 3,197
Sundry debtors 2,627 3,548 11,789 4,476
Ratios Loans and advances 59,397 77,684 131,292 177,965
FY15 FY16 FY17 FY18E Cash & bank balance 2,031 8,548 4,026 6,060
Growth Marketable securities 7,311 5,515 7,471 5,071
Operating income (%) 39.6 20.5 40.0 23.7 Total current assets 74,876 97,833 154,675 196,769
EBITDA (%) 57.9 28.3 46.8 28.0 Total current liabilities 4,650 6,857 11,983 15,399
Adj PAT (%) 56.5 20.9 22.3 22.7 Net current assets 70,226 90,976 142,693 181,370
Adj EPS (%) 50.9 20.1 21.4 22.0 Intangibles/Misc. expenditure 1,120 1,128 1,145 1,145
Total assets 80,088 103,362 153,134 194,926
Profitability
EBITDA margin (%) 68.3 72.7 76.3 79.0 Cash flow
Adj PAT Margin (%) 23.6 23.8 19.9 20.6 (₹ mn) FY15 FY16 FY17 FY18E
RoE (%) 13.9 14.7 15.1 16.9 Pre-tax profit 5,170 6,930 9,918 11,913
RoCE (%) 14.1 13.3 13.9 13.1 Total tax paid (1,590) (2,245) (3,522) (4,068)
RoIC (%) 13.4 12.4 12.5 11.6 Depreciation 181 203 233 250
Working capital changes (23,412) (16,030) (54,282) (39,044)
Valuations Net cash from operations (19,651) (11,142) (47,653) (30,950)
Price-earnings (x) 11.3 7.5 21.1 16.6 Cash from investments
Price-book (x) 1.2 0.8 2.2 2.0 Capital expenditure (2,365) (255) (612) (364)
EV/EBITDA (x) 8.6 7.3 11.5 10.6 Investments and others (2,143) (675) 366 (600)
EV/Sales (x) 6.3 5.6 9.2 8.4 Net cash from investments (4,508) (931) (245) (964)
Dividend payout ratio (%) 32.1 28.6 24.4 21.6 Cash from financing
Dividend yield (%) 2.8 3.8 1.2 1.3 Equity raised/(repaid) 557 152 192 115
Debt raised/(repaid) 17,309 19,490 41,303 35,380
B/S ratios Dividend (incl. tax) (1,265) (1,334) (1,298) (1,547)
Current ratio (x) 16.1 14.3 12.9 12.8 Others (incl extraordinaries) 5,437 281 2,983 -
Debt-equity (x) 1.5 1.9 2.4 2.8 Net cash from financing 22,039 18,588 43,180 33,948
Net debt/equity (x) 1.2 1.5 2.2 2.6 Change in cash position (2,108) 6,517 (4,522) 2,033
Interest coverage 2.2 2.4 2.3 2.1 Closing cash 2,031 8,548 4,026 6,059
Quarterly financials
(₹ mn) Q2FY17 Q3FY17 Q4FY17 Q1FY18
Total operating income 5,638 5,940 7,250 7,091
Change (q-o-q) 18.3% 5.4% 22.1% -2.2%
EBITDA 4,281 4,505 5,463 5,379
Per share Change (q-o-q) 21.6% 5.2% 21.3% -1.6%
FY15 FY16 FY17 FY18E EBITDA margin 75.9% 75.9% 75.4% 75.9%
Adj. EPS (₹) 4.2 5.1 6.2 7.5 Reported PAT 1,507 1,637 2,103 1,781
CEPS 4.4 5.3 6.2 7.8 Adj PAT 1,147 1,186 1,508 1,282
Book value 40.8 45.3 55.9 63.6 Change (q-o-q) 33.2% 3.4% 27.2% -15.0%
Dividend (₹) 1.4 1.5 1.5 1.6 Adj PAT margin 20.3% 20.0% 20.8% 18.1%
Actual o/s shares (mn) 784 789 795 799 Adj EPS 1.4 1.5 1.9 1.6
Less: Minority interest/ Share of
profit of associates

29
Focus charts
Fund-based business posted robust revenue and PBT
growth
JM’s expertise and disciplined approach helped improve
asset quality
Source: Company, CRISIL Research Source: Company, CRISIL Research
Revenue estimated to increase 24% in FY18 RoE expected to increase in FY18
Source: Company, CRISIL Research Source: Company, CRISIL Research
Share price movement Fair value movement since initiation
-Indexed to 100
Source: NSE, CRISIL Research
Source: NSE, CRISIL Research
5,5
18
5,2
92
8,0
62
10,7
90
16,2
50
1,825 1,995 3,473
5,486 7,788
-
2,000
4,000
6,000
8,000
10,000
12,000
14,000
16,000
18,000
FY13 FY14 FY15 FY16 FY17
(₹ mn)
Lending business revenue Lending business PBT
0.8%
0.4%
0.9%
0.3%
0.1%
0.7%
0.2%
0.7%
0.2%0.0%
0.0%
0.1%
0.2%
0.3%
0.4%
0.5%
0.6%
0.7%
0.8%
0.9%
1.0%
FY13 FY14 FY15 FY16 FY17
Gross NPA Net NPA
10,067 14,030 16,847 23,593 29,175
39%
20%
40%
24%
0%
5%
10%
15%
20%
25%
30%
35%
40%
45%
-
5,000
10,000
15,000
20,000
25,000
30,000
35,000
FY14 FY15 FY16 FY17 FY18E
(₹ mn)
Revenue y-o-y growth (RHS)
9.8%
13.9%
14.7% 15.1%
16.9%
10.0%
14.1%
13.3% 13.9%13.1%
1.3
1.5
1.9
2.42.8
0.0
0.5
1.0
1.5
2.0
2.5
3.0
0%
2%
4%
6%
8%
10%
12%
14%
16%
18%
FY14 FY15 FY16 FY17 FY18E
ROE ROCE Leverage (RHS)
0
100
200
300
400
500
600
700
800
Feb
-09
Ju
n-0
9
Oct-
09
Ma
r-1
0
Ju
l-10
No
v-1
0
Apr-
11
Aug
-11
De
c-1
1
Apr-
12
Sep
-12
Ja
n-1
3
May-1
3
Oct-
13
Feb
-14
Ju
n-1
4
No
v-1
4
Mar-
15
Ju
l-15
De
c-1
5
Apr-
16
Aug
-16
De
c-1
6
May-1
7
Sep
-17
JM Financial NIFTY 500
0
10,000
20,000
30,000
40,000
50,000
60,000
70,000
0
20
40
60
80
100
120
140
160
De
c-0
9A
pr-
10
Aug
-10
De
c-1
0M
ar-
11
Ju
l-11
No
v-1
1F
eb
-12
Ju
n-1
2O
ct-
12
Feb
-13
May-1
3S
ep
-13
Ja
n-1
4A
pr-
14
Aug
-14
De
c-1
4A
pr-
15
Ju
l-15
No
v-1
5M
ar-
16
Ju
n-1
6O
ct-
16
Feb
-17
Ju
n-1
7S
ep
-17
('000)(₹)
Total Traded Quantity (RHS) CRISIL Fair Value JM Financial
CRISIL Research Team
Senior Director
Nagarajan Narasimhan CRISIL Research +91 22 3342 3540 [email protected]
Analytical Contacts
Prasad Koparkar Senior Director, Industry & Customised Research +91 22 3342 3137 [email protected]
Jiju Vidyadharan Senior Director, Funds & Fixed Income Research +91 22 3342 8091 [email protected]
Binaifer Jehani Director, Customised Research +91 22 3342 4091 [email protected]
Manoj Damle Director, Customised Research +91 22 3342 3342 [email protected]
Ajay Srinivasan Director, Industry Research +91 22 3342 3530 [email protected]
Rahul Prithiani Director, Industry Research +91 22 3342 3574 [email protected]
Miren Lodha Director, Data Business +91 22 3342 1977 [email protected]
Hetal Gandhi Director, Research Execution +91 22 33424155 [email protected]
Business Development
Prosenjit Ghosh Director, Industry & Customised Research +91 99206 56299 [email protected]
Megha Agrawal Associate Director +91 98673 90805 [email protected]
Dharmendra Sharma Associate Director (North) +91 98189 05544 [email protected]
Ankesh Baghel Regional Manager (West) +91 98191 21510 [email protected]
Sonal Srivastava Regional Manager (West) +91 98204 53187 [email protected]
Priyanka Murarka Regional Manager (East) +91 99030 60685 [email protected]
Rupak Sharma Regional Manager (Tamil Nadu & AP) +91 84240 15517 [email protected]
Argentina | China | Hong Kong | India | Poland | Singapore | UK | USA
CRISIL Limited: CRISIL House, Central Avenue, Hiranandani Business Park, Powai, Mumbai – 400076. India
Phone: + 91 22 3342 3000 | Fax: + 91 22 3342 3001 | www.crisil.com
About CRISIL Limited
CRISIL is an agile and innovative, global analytics company driven by its mission of making markets function better. We are
India’s foremost provider of ratings, data, research, analytics and solutions. A strong track record of growth, culture of innovation
and global footprint sets us apart. We have delivered independent opinions, actionable insights, and efficient solutions to over
100,000 customers.
We are majority owned by S&P Global Inc., a leading provider of transparent and independent ratings, benchmarks, analytics
and data to the capital and commodity markets worldwide.
About CRISIL Research
CRISIL Research is India's largest independent integrated research house. We provide insights, opinion and analysis on the
Indian economy, industry, capital markets and companies. We also conduct training programs to financial sector professionals on
a wide array of technical issues. We are India's most credible provider of economy and industry research. Our industry research
covers 86 sectors and is known for its rich insights and perspectives. Our analysis is supported by inputs from our large network
sources, including industry experts, industry associations and trade channels. We play a key role in India's fixed income markets.
We are the largest provider of valuation of fixed income securities to the mutual fund, insurance and banking industries in the
country. We are also the sole provider of debt and hybrid indices to India's mutual fund and life insurance industries. We pioneered
independent equity research in India, and are today the country's largest independent equity research house. Our defining trait is
the ability to convert information and data into expert judgments and forecasts with complete objectivity. We leverage our deep
understanding of the macro-economy and our extensive sector coverage to provide unique insights on micro-macro and cross-
sectoral linkages. Our talent pool comprises economists, sector experts, company analysts and information management
specialists.
CRISIL Privacy
CRISIL respects your privacy. We use your contact information, such as your name, address, and email id, to fulfil your request and service your
account and to provide you with additional information from CRISIL and other parts of S&P Global Inc. and its subsidiaries (collectively, the
“Company”) you may find of interest.
For further information, or to let us know your preferences with respect to receiving marketing materials, please visit www.crisil.com/privacy. You
can view the Company’s Customer Privacy at https://www.spglobal.com/privacy
Last updated: April 2016
Analyst Disclosure
Each member of the team involved in the preparation of the grading report, hereby affirms that there exists no conflict of interest that can bias the
grading recommendation of the company.
Disclaimer:
This Company commissioned CRISIL IER report is based on data publicly available or from sources considered reliable. CRISIL Research,
division of CRISIL Ltd. (CRISIL) does not represent that it is accurate or complete and hence, it should not be relied upon as such. The data /
report is subject to change without any prior notice. Opinions expressed herein are our current opinions as on the date of this report. Nothing in
this report constitutes investment, legal, accounting or tax advice or any solicitation, whatsoever. The subscriber / user assume the entire risk of
any use made of this data / report. CRISIL especially states that, it has no financial liability whatsoever, to the subscribers / users of this report.
This report is for the personal information only of the authorised recipient in India only. This report should not be reproduced or redistributed or
communicated directly or indirectly in any form to any other person – especially outside India or published or copied in whole or in part, for any
purpose. CRISIL Research operates independently of, and does not have access to information obtained by CRISIL’s Ratings Division / CRISIL
Risk and Infrastructure Solutions Limited (CRIS), which may, in their regular operations, obtain information of a confidential nature. The views
expressed in this Report are that of CRISIL Research and not of CRISIL’s Ratings Division / CRIS. However, CRISIL Limited or its affiliates or
other employees may have other commercial transactions with the Company.