Impact of Store Layout Design on Customer Shopping · PDF file · 2017-07-13Impact...
15
Proceedings of Annual Australian Business and Social Science Research Conference 26 - 27 September 2016, Crowne Plaza Hotel, Gold Coast, Queensland, Australia ISBN: 978-1-925488-17-3 Impact of Store Layout Design on Customer Shopping Experience: A Study of FMCG Retail Outlets in Hyderabad, India V V Devi Prasad Kotni The aim of the study is to find out the impact of store layout design on customer shopping experience. If there is any impact found, what are the store layout design characteristics that provide good shopping experience to the customers? What are the store layout design characteristics that are not expected by the customers? The study identifies various characteristics of store layout design from review of related literature. This study is organised in an Indian city of Hyderabad and only FMCG retail outlets are considered for this study. The primary data was collected from 300 customers who shopped in any FMCG retail outlets in the study area. Factor analysis was performed on the data of customer perception towards store layout design characteristics to find out most important factors and to eliminate some characteristics which are not important for good shopping experience according to the respondents. Finally a regression model is adopted to find out most important store layout design characteristics (independent variables) that influence customer shopping experience (dependant variable). Conference Track: Marketing / Retailing 1. Introduction Store layout design contributes to the uniqueness of a store. The exterior and interior of a store convey several messages about the store to the consumers. Managing space is the first and foremost concern of almost every retailer, when it comes to designing the store's interior. There are two areas in which the entire space of the outlet can be divided into. One is selling area and another is non-selling area. Selling area is the area where the merchandise of the retail outlet can be showcased with the help of fixtures like racks, tables and others. Non-selling area is the area which is left for customer movement inside the store. A good store layout design must find a balance between these two areas. Area/Space is always an expensive and scarce resource. Retailers always try to maximize the return on sales per square foot. Planning a layout for the store's interior is the first step in designing the store's interior. A successful store should keep a consumer interested and finally convert the window shopper into the actual customer. From the customers’ point of view, they would like the shopping process to be easy and satisfying. They prefer a pleasant shopping environment where the aisles are wide, the view of the merchandise is clear, the merchandise is easy to find and that there are sufficient items such that customers won’t experience stock-outs. The retailer should have effective merchandising and displays in order to increase the satisfaction of customers. Layout design specifies the relative location of departments in a retail store. Most of the previous research on retail management is from a strategy point of view, including situation analysis, targeting customers, choosing a store location, managing a retail business, developing customer service, and planning for the future. However, the design of the store layout and the detailed facility layout haven’t received much attention. Assistant Professor, Department of Management Studies, Gayatri Vidya Parishad College for Degree and PG Courses (A), Rushikonda, Visakhapatnam, India. Email: [email protected]
Transcript of Impact of Store Layout Design on Customer Shopping · PDF file · 2017-07-13Impact...

Proceedings of Annual Australian Business and Social Science Research Conference
26 - 27 September 2016, Crowne Plaza Hotel, Gold Coast, Queensland, Australia
ISBN: 978-1-925488-17-3
Impact of Store Layout Design on Customer Shopping Experience: A Study of FMCG Retail Outlets in Hyderabad,
India
V V Devi Prasad Kotni
The aim of the study is to find out the impact of store layout design on customer shopping experience. If there is any impact found, what are the store layout design characteristics that provide good shopping experience to the customers? What are the store layout design characteristics that are not expected by the customers? The study identifies various characteristics of store layout design from review of related literature. This study is organised in an Indian city of Hyderabad and only FMCG retail outlets are considered for this study. The primary data was collected from 300 customers who shopped in any FMCG retail outlets in the study area. Factor analysis was performed on the data of customer perception towards store layout design characteristics to find out most important factors and to eliminate some characteristics which are not important for good shopping experience according to the respondents. Finally a regression model is adopted to find out most important store layout design characteristics (independent variables) that influence customer shopping experience (dependant variable).
Conference Track: Marketing / Retailing
1. Introduction Store layout design contributes to the uniqueness of a store. The exterior and interior of a store convey several messages about the store to the consumers. Managing space is the first and foremost concern of almost every retailer, when it comes to designing the store's interior. There are two areas in which the entire space of the outlet can be divided into. One is selling area and another is non-selling area. Selling area is the area where the merchandise of the retail outlet can be showcased with the help of fixtures like racks, tables and others. Non-selling area is the area which is left for customer movement inside the store. A good store layout design must find a balance between these two areas. Area/Space is always an expensive and scarce resource. Retailers always try to maximize the return on sales per square foot. Planning a layout for the store's interior is the first step in designing the store's interior. A successful store should keep a consumer interested and finally convert the window shopper into the actual customer. From the customers’ point of view, they would like the shopping process to be easy and satisfying. They prefer a pleasant shopping environment where the aisles are wide, the view of the merchandise is clear, the merchandise is easy to find and that there are sufficient items such that customers won’t experience stock-outs. The retailer should have effective merchandising and displays in order to increase the satisfaction of customers. Layout design specifies the relative location of departments in a retail store. Most of the previous research on retail management is from a strategy point of view, including situation analysis, targeting customers, choosing a store location, managing a retail business, developing customer service, and planning for the future. However, the design of the store layout and the detailed facility layout haven’t received much attention.
Assistant Professor, Department of Management Studies, Gayatri Vidya Parishad College for Degree and PG Courses (A), Rushikonda, Visakhapatnam, India. Email: [email protected]

Proceedings of Annual Australian Business and Social Science Research Conference
26 - 27 September 2016, Crowne Plaza Hotel, Gold Coast, Queensland, Australia
ISBN: 978-1-925488-17-3
Based on an overall consideration of the principles and characteristics in designing a retail area layout, this research is focuses on determining the store layout design characteristics from customer point of view. The main difference between previous research and this proposed research is the formulization of statistical models that can be specifically applied in the retail sector.
2. Review of Related Literature
In the last twenty years, different aspects of retail management and customer behaviour have been intensely studied. In general, these studies have been more qualitative in nature than quantitative. The table 1 presents some of the important contributions that were made in past years related to the research problem.
Table 1: Previous Studies authors and their contributions
S.No Author(s) Contribution
1 Stevens (1980) Retailers have claimed that they have influenced customer’s buying behaviour by manipulating store atmospheric via layout, colour, lighting and music.
2 Lewison (1994) The selling floor layout can strongly influence in-store traffic patterns, shopping atmosphere, shopping behaviour and operational efficiency.
3 Donovan, Rossiter, Marcoolyn and Nesdale (1994)
Store environment is viewed as fantasy environment providing a range of entertainment: musical, visual and theatrical for today’s consumer.
4 Erdem (1999) Store image is an important factor affecting customer behaviour.
5 Simonson (1999) Store layout design can play a key role not only in satisfying buyers’ requirements but also in influencing their wants and preferences.
6 Merrilees and Miller (2001)
Store layout design is one of the most important determinants for store loyalty.
7 Baker (2002) Store layout design is a critical determinant affecting the creation of that store image.
8 Postrel (2003 ) Shopping malls are pursuing aesthetic to attract consumer who seek an entertaining experience. Store environment is viewed as fantasy environment providing a range of entertainment.
9 Karolefski (2003) Consumer wants products, communications, entertainment, and marketing efforts that pique their senses, evoke emotion, and stimulate their thinking—they expect and respond best to experiences and want shopping to be fun.
10 Raymond R. Burke and Alex Leykin (2007)
The retail shoppability as the ability of the retail environment to translate consumer demand into purchase with the various determinants for it as store layout , navigation, product profilation and presentation, defining the shopping attitude i.e intentions for store entry and purchase but retailers (often mistakenly) believe stocking more products means selling more products.
Source: Review of Related Literature
Proceedings of Annual Australian Business and Social Science Research Conference
26 - 27 September 2016, Crowne Plaza Hotel, Gold Coast, Queensland, Australia
ISBN: 978-1-925488-17-3
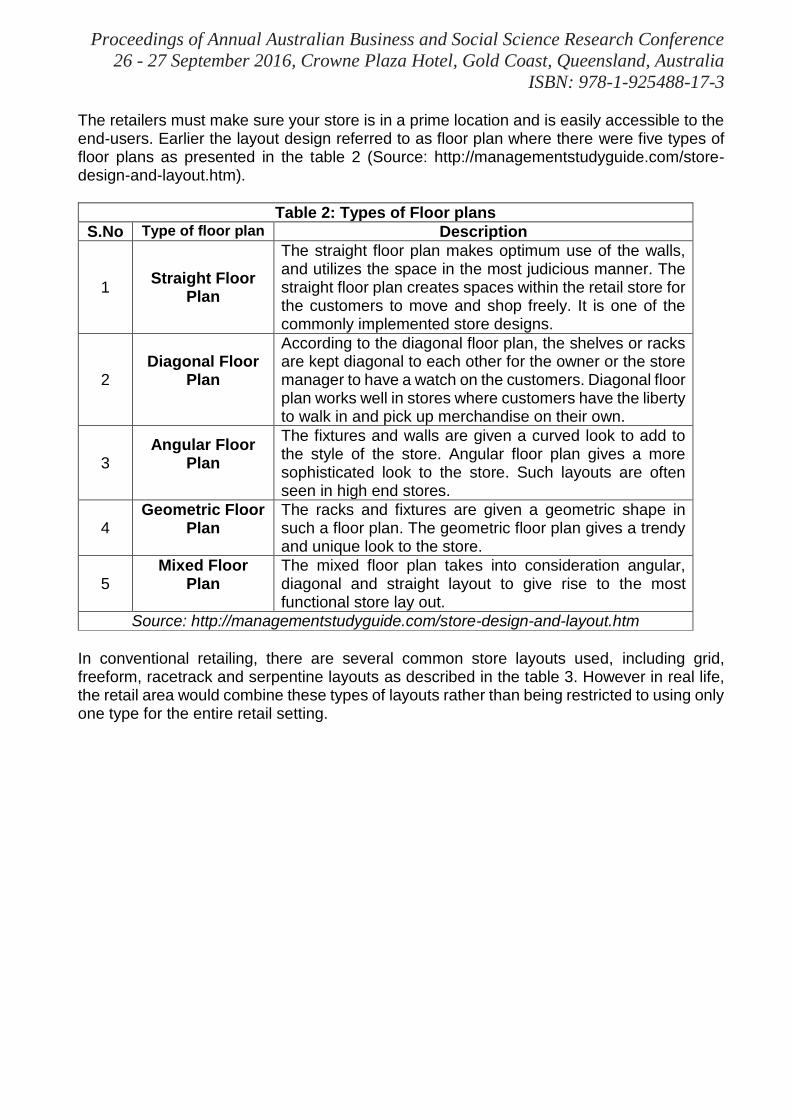
The retailers must make sure your store is in a prime location and is easily accessible to the end-users. Earlier the layout design referred to as floor plan where there were five types of floor plans as presented in the table 2 (Source: http://managementstudyguide.com/store-design-and-layout.htm).
Table 2: Types of Floor plans
S.No Type of floor plan Description
1 Straight Floor
Plan
The straight floor plan makes optimum use of the walls, and utilizes the space in the most judicious manner. The straight floor plan creates spaces within the retail store for the customers to move and shop freely. It is one of the commonly implemented store designs.
2 Diagonal Floor
Plan
According to the diagonal floor plan, the shelves or racks are kept diagonal to each other for the owner or the store manager to have a watch on the customers. Diagonal floor plan works well in stores where customers have the liberty to walk in and pick up merchandise on their own.
3 Angular Floor
Plan
The fixtures and walls are given a curved look to add to the style of the store. Angular floor plan gives a more sophisticated look to the store. Such layouts are often seen in high end stores.
4 Geometric Floor
Plan
The racks and fixtures are given a geometric shape in such a floor plan. The geometric floor plan gives a trendy and unique look to the store.
5 Mixed Floor
Plan
The mixed floor plan takes into consideration angular, diagonal and straight layout to give rise to the most functional store lay out.
Source: http://managementstudyguide.com/store-design-and-layout.htm
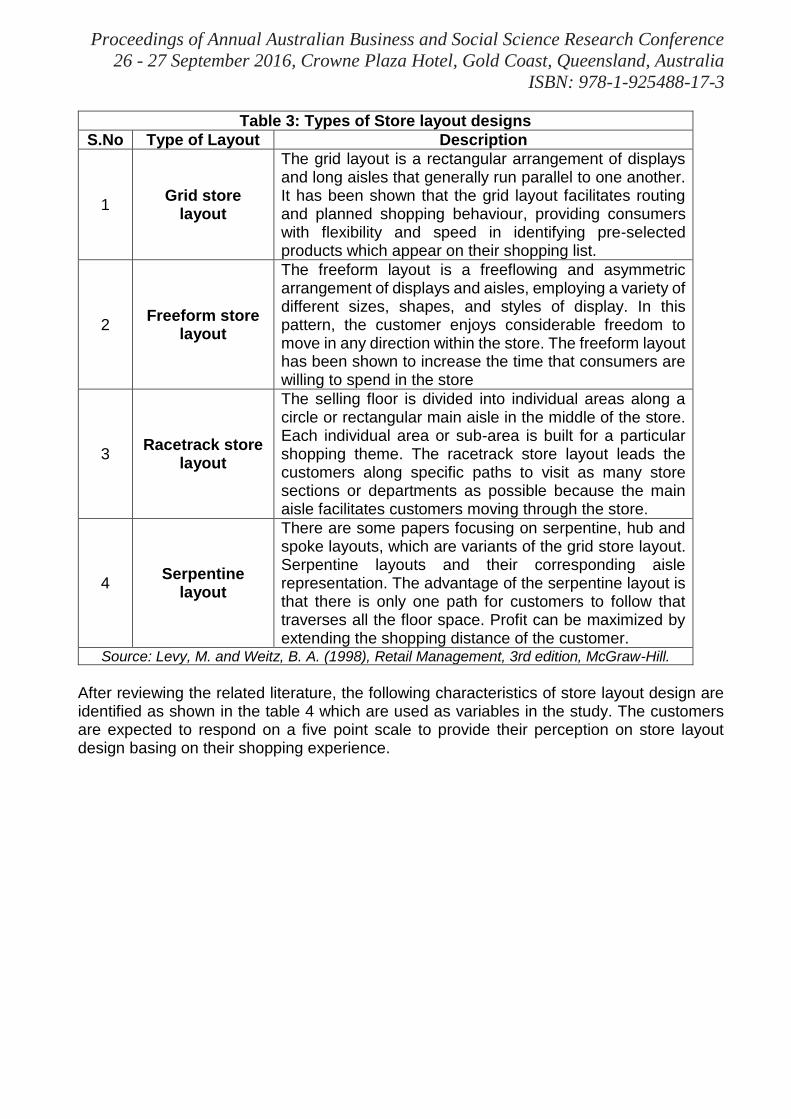
In conventional retailing, there are several common store layouts used, including grid, freeform, racetrack and serpentine layouts as described in the table 3. However in real life, the retail area would combine these types of layouts rather than being restricted to using only one type for the entire retail setting.
Proceedings of Annual Australian Business and Social Science Research Conference
26 - 27 September 2016, Crowne Plaza Hotel, Gold Coast, Queensland, Australia
ISBN: 978-1-925488-17-3
Table 3: Types of Store layout designs
S.No Type of Layout Description
1 Grid store
layout
The grid layout is a rectangular arrangement of displays and long aisles that generally run parallel to one another. It has been shown that the grid layout facilitates routing and planned shopping behaviour, providing consumers with flexibility and speed in identifying pre-selected products which appear on their shopping list.
2 Freeform store
layout
The freeform layout is a freeflowing and asymmetric arrangement of displays and aisles, employing a variety of different sizes, shapes, and styles of display. In this pattern, the customer enjoys considerable freedom to move in any direction within the store. The freeform layout has been shown to increase the time that consumers are willing to spend in the store
3 Racetrack store
layout
The selling floor is divided into individual areas along a circle or rectangular main aisle in the middle of the store. Each individual area or sub-area is built for a particular shopping theme. The racetrack store layout leads the customers along specific paths to visit as many store sections or departments as possible because the main aisle facilitates customers moving through the store.
4 Serpentine
layout
There are some papers focusing on serpentine, hub and spoke layouts, which are variants of the grid store layout. Serpentine layouts and their corresponding aisle representation. The advantage of the serpentine layout is that there is only one path for customers to follow that traverses all the floor space. Profit can be maximized by extending the shopping distance of the customer.
Source: Levy, M. and Weitz, B. A. (1998), Retail Management, 3rd edition, McGraw-Hill.
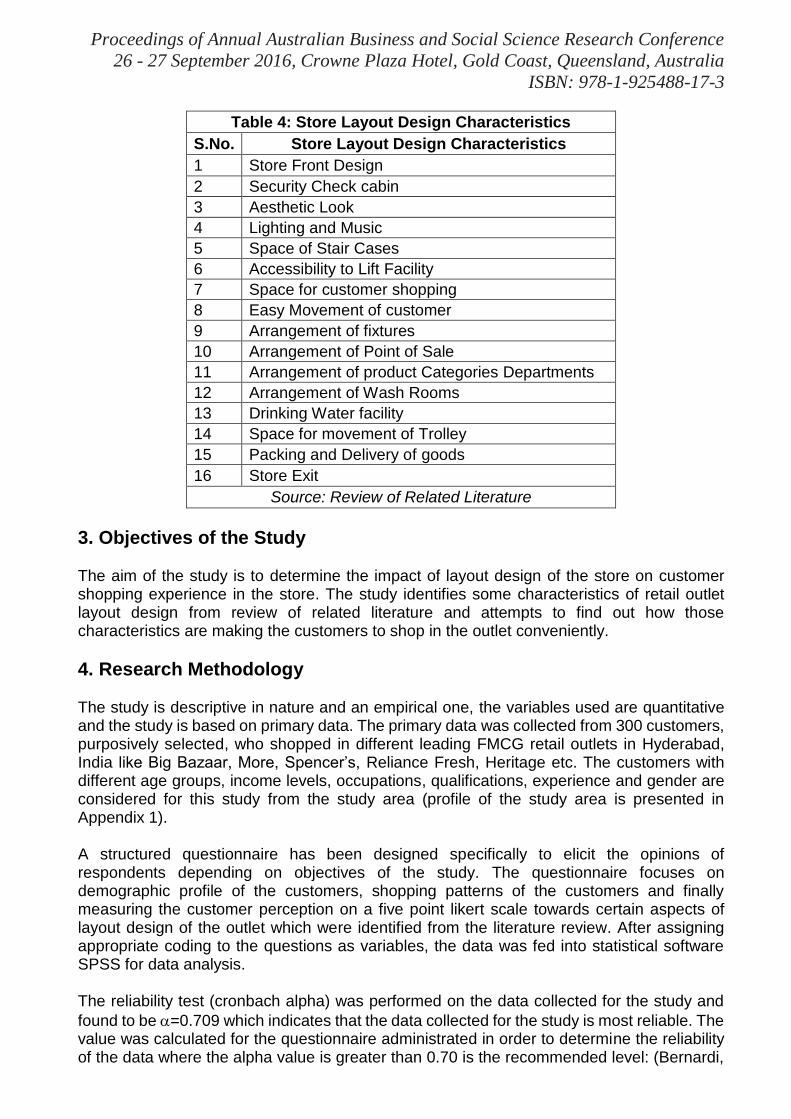
After reviewing the related literature, the following characteristics of store layout design are identified as shown in the table 4 which are used as variables in the study. The customers are expected to respond on a five point scale to provide their perception on store layout design basing on their shopping experience.
Proceedings of Annual Australian Business and Social Science Research Conference
26 - 27 September 2016, Crowne Plaza Hotel, Gold Coast, Queensland, Australia
ISBN: 978-1-925488-17-3
Table 4: Store Layout Design Characteristics
S.No. Store Layout Design Characteristics
1 Store Front Design
2 Security Check cabin
3 Aesthetic Look
4 Lighting and Music
5 Space of Stair Cases
6 Accessibility to Lift Facility
7 Space for customer shopping
8 Easy Movement of customer
9 Arrangement of fixtures
10 Arrangement of Point of Sale
11 Arrangement of product Categories Departments
12 Arrangement of Wash Rooms
13 Drinking Water facility
14 Space for movement of Trolley
15 Packing and Delivery of goods
16 Store Exit
Source: Review of Related Literature
3. Objectives of the Study The aim of the study is to determine the impact of layout design of the store on customer shopping experience in the store. The study identifies some characteristics of retail outlet layout design from review of related literature and attempts to find out how those characteristics are making the customers to shop in the outlet conveniently.
4. Research Methodology The study is descriptive in nature and an empirical one, the variables used are quantitative and the study is based on primary data. The primary data was collected from 300 customers, purposively selected, who shopped in different leading FMCG retail outlets in Hyderabad, India like Big Bazaar, More, Spencer’s, Reliance Fresh, Heritage etc. The customers with different age groups, income levels, occupations, qualifications, experience and gender are considered for this study from the study area (profile of the study area is presented in Appendix 1). A structured questionnaire has been designed specifically to elicit the opinions of respondents depending on objectives of the study. The questionnaire focuses on demographic profile of the customers, shopping patterns of the customers and finally measuring the customer perception on a five point likert scale towards certain aspects of layout design of the outlet which were identified from the literature review. After assigning appropriate coding to the questions as variables, the data was fed into statistical software SPSS for data analysis. The reliability test (cronbach alpha) was performed on the data collected for the study and
found to be =0.709 which indicates that the data collected for the study is most reliable. The value was calculated for the questionnaire administrated in order to determine the reliability of the data where the alpha value is greater than 0.70 is the recommended level: (Bernardi,

Proceedings of Annual Australian Business and Social Science Research Conference
26 - 27 September 2016, Crowne Plaza Hotel, Gold Coast, Queensland, Australia
ISBN: 978-1-925488-17-3
1994). Statistical tool factor analysis was performed on the data of perceptions of customers towards layout design of the outlets. In order to find out the appropriateness of factor analysis for the aspects (variables) of store layout and design, Kaiser-Meyer-Olkin (KMO) and Bartlett's Test of Sphericity is used. KMO measures the magnitude of observed correlation coefficients to the magnitude of partial correlation coefficients. Bartlett's Test measures the correlation of variables. A probability of more than .05 is desirable: (Akansha Anchaliya et al., 2012).
5. Demographic Profile of the Respondents Demographic analysis of the study enables the retailers to know that the profile of the customers in terms of age, gender, income, education, occupation etc. This analysis enables the marketers and retail managers to draw the STP strategies and Retail Marketing Mix strategies for better business performance.
Table 5: Demographic Profile of Respondents
Variable Categories of variable Frequency %
Gender Male 346 58%
Female 254 42%
Age 13 - 19 years (teenagers) 24 4%
20 - 30 years (youngagers) 384 64%
31 - 40 years (early middleage) 94 16%
41 - 50 years (late middleage) 80 13%
above 50 years (oldage) 18 3%
Occupation Unemployed / Students 32 5%
Employed 429 72%
Business people 139 23%
Education Primary Education 9 2%
Secondary Education 27 5%
Higher Secondary / Diploma / ITI 108 18%
Graduation (UG) 240 40%
Post Graduation (PG) 189 32%
Higher than PG 27 5%
Income Less than Rs.15,000/- 152 25%
Between Rs.15,000/- and Rs.30,000/-
170 28%
Between Rs.30,000/- and Rs.50,000/-
139 23%
More than Rs.50,000/- 139 23%
Size of Family
Two 144 24%
Three 162 27%
Four 238 40%
Five 47 8%
Six 9 2%
Source: field study
In this section an attempt has been made to analyse the demographic characteristics of respondents as presented in table 5. Out of total 300 sample respondents, 58% are male

Proceedings of Annual Australian Business and Social Science Research Conference
26 - 27 September 2016, Crowne Plaza Hotel, Gold Coast, Queensland, Australia
ISBN: 978-1-925488-17-3
and 42% are female. The respondents are categorised into five groups basing on their age. Out of total sample, 4% are teenagers (13 – 19 years), 64% are from young age (20 – 30 years), 16% are from early middle age (31 – 40 years), 13% belong to late middle age (41 – 50 years) and 3% are from old age (above 50 years). Based on occupation, the respondents are categorised into three groups, unemployed/students (5%), employed (72%) and business people (23%). Basing on the education, 2% respondents completed primary education, 5% have secondary education, 18% completed higher secondary education, 40% are graduated, 32% have post graduation qualification and 5% are higher post graduates. Basing on the income levels, the respondents are categorised into four groups. 25% are having monthly income less than Rs.15,000/-, 28% have income between Rs.15,000/- and Rs.30,000/-, 23% have income between Rs.30,000/- and Rs.50,000/-, another 23% respondents have income more than Rs.50,000/-. The family size of respondents are also analysed, 24% have family size two, 27% have size three, 40% are having family size four, 8% have five and 2% of respondents are having size six.
6. Shopping Behaviour of Customers The shopping behaviour of customers refers to the activities and actions of the customers before shopping, during shopping and after shopping the goods in the outlets. The shopping behaviour in terms of activities and actions like frequency of shopping, most preferred time of shopping, amount spent per month, distance from home to outlet, family life cycle stage etc are studied. The study of shopping behaviour of customers also enables the marketers and retail managers to draw the STP strategies and Retail Marketing Mix strategies for better business performance.

Proceedings of Annual Australian Business and Social Science Research Conference
26 - 27 September 2016, Crowne Plaza Hotel, Gold Coast, Queensland, Australia
ISBN: 978-1-925488-17-3
Table 6: Shopping Behaviour of Respondents
Variable Categories of variable Frequency %
Frequency of shopping
Daily 32 5%
Weekly 183 31%
Biweekly 118 20%
Monthly 132 22%
Bimonthly 42 7%
as per requirement 93 16%
Most preferred Time of shopping
first week of month 251 42%
2nd week of month 138 23%
last week of month 51 9%
as per requirement 160 27%
amount spent per month
less than Rs.1000/- 155 26%
between Rs.1000/- to Rs.5000/- 243 41%
between Rs.5000/- to Rs.10000/- 151 25%
more than Rs.10000/- 51 9%
distance from home to outlet
less than 1 k.m. 216 36%
between 1 k.m. - 3 k.m. 204 34%
between 3 k.m. - 5 k.m. 78 13%
5 k.m. - 10 k.m. 54 9%
more than 10 k.m. 48 8%
Family Life Cycle Stage
Young Couple with no children 135 23%
Couple with children 229 38%
Couple with working children 196 33%
Old Couple-working children with kids
33 6%
Old Couple staying away from children
7 1%
Source: field study
The shopping behaviour of the respondents is analysed as shown in the table 6. The frequency of shopping observed as daily 5%, weekly 31%, biweekly 20%, monthly 22%, bimonthly 7% and 16% of respondents are visiting the outlet as per requirement of goods. Most preferred time for shopping is analysed as first week of the month 42%, second week 23%, last week 9% and 27% of the respondents preferred time of shopping is as per requirement of goods. The amount spent per month for shopping by the customers is less than Rs.1000/- for 26%, 41% of the customers are spending an amount between Rs.1000 and Rs.5000, 25% are spending an amount between Rs.5000/- to Rs.10000/- and 9% are spending an amount more than Rs.10000/-. The distance between outlet and customer household is analysed, 36% of the respondents are shopping in the retail outlets which are in less than 1 k.m. radius, 34% are shopping in the outlets which are situated in the distance is in between 1 k.m. and 3 k.m. from home, 13% are shopping in distance between 3 k.m. and 5 k.m., 9% are shopping in distance ranging from 5 k.m. to 10 k.m. and 8% of the respondents are shopping in the outlets which are more than 10 k.m. away from their households. The family life cycle stages of the respondents are categorised into six groups i.e. young-couple-without-children 23%, couple-with-children 38%, couple-with-working-children 33%, old-couple-working-children with kids 6%, old-couple-staying-away-from-children 1%.

Proceedings of Annual Australian Business and Social Science Research Conference
26 - 27 September 2016, Crowne Plaza Hotel, Gold Coast, Queensland, Australia
ISBN: 978-1-925488-17-3
7. Performing Factor Analysis on Store Layout Design Characteristics In this section an attempt has been made to analyse the characteristics of store layout design to be measured. The customers were asked to respond on a five point likert scale (Strongly-Agree [5], Agree [4], Slightly-Agree [3], Disagree [2], Strongly-Disagree [1]) regarding sixteen variables which were designed on the basis of previous studies and interviews. To determine the data reliability, Reliability test was performed on the data of customer response towards store layout and design. The value of the Cronbach's Alpha is found to be 0.889, which shows the data of Store Layout Design Characteristics is 88.9% reliable which ensures to proceed for further analysis. 7.1 Reliability of Data: Kaiser Meyer Olkin (KMO) and Bartlett’s Test for Store Layout Design Characteristics
Table 7: KMO and Bartlett's Test for Store Layout Design Characteristics
Kaiser-Meyer-Olkin Measure of Sampling Adequacy 0.794
Bartlett's Test of Sphericity
Approx. Chi-Square 827.537
df 120
Sig. .000
Source: Factor Analysis Data Reduction (SPSS 21.0)
To determine the appropriateness of factor analysis on the identified characteristics of layout design, Kaiser Meyer Olkin (KMO) and Bartlett’s Test was performed as shown in table 7. The KMO measure is observed to be 0.861 which is higher than the threshold value of .5 (Hair et al. 1998). So it can be interpreted that there is no error in 86.1% of the sample and
remaining 13.9% there may occur some sort of error. Bartlett's Test of Spherincity (2 =6526516) is found to be significant (p < .001, df 190). Finally it can be concluded that the data collected on store layout design characteristics is appropriate for factor analysis. 7.2 Factors – Store Layout Design Characteristics
Table 8 : Total Variance Explained in Factors - Store Layout Design Characteristics
Extraction Sums of Squared Loadings
FACTORS Total % of
Variance Cumulative
%
EASY MOVEMENT 2.143 13.393 13.393
FIXTURES 1.737 10.859 24.252
ENTRY 1.682 10.511 34.763
FACILITIES 1.543 9.645 44.408
EXIT 1.518 9.486 53.893
Source: Factor Analysis Data Reduction (SPSS 21.0)
Factor analysis was performed to study the store layout design characteristics influencing the shopping experience in the study area. Factor analysis was used to remove the redundant variables from the survey data and to reduce the number of variables into a definite number of dimensions. The application was done in SPSS 21.0. The factor analysis was performed using principle component extraction method with varimax rotation. After performing factor analysis, the sixteen characteristics were reduced to five factor dimensions,

Proceedings of Annual Australian Business and Social Science Research Conference
26 - 27 September 2016, Crowne Plaza Hotel, Gold Coast, Queensland, Australia
ISBN: 978-1-925488-17-3
which explained 53.893% of cumulative variance which is indicating that the variance of original values was captured by these five factors as shown in table 8. The five factors are provisionally named Easy Movement, Fixtures, Entry, Facilities and Exit. The factor scores of store layout design characteristics are presented in the table 9. 7.3 Factor Scores Matrix - Store Layout Design Characteristics
Table 9: Factors loadings - Store Layout Design Characteristics
ATTRIBUTES EASY
MOVEMENT FIXTURES ENTRY FACILITIES EXIT
I found the space of staircase in the outlet is good and comfortable.
.729
I feel Accessibility to Lift Facility is good.
.673
The Space for customer shopping inside the store and across the racks is good
.563
There is an easy internal movement of customer which makes chopping comfortable.
.517
I found the Arrangement of product Categories/Departments in the store is good.
.757
There is a good Arrangement of fixtures which makes all the products on the outlet is accessible.
.601
The Arrangement of Point of Sale is found to be good.
.581
The Arrangement of Security Check cabin is good.
.712
The Store Front Design is good and motivating for purchase.
.562
The space allocated for Drinking Water facility is good.
.797
The space allocated for Arrangement of Washroom facility is comfortable.
.783
There is enough space allocated for comfortable Packing and Delivery of goods.
.722
The Store Exit is good. .642
There is enough Space allocated for movement of Trolley.
.599
Extraction Method: Principal Component Analysis. Rotation Method: Varimax with Kaiser Normalization.
Source: Factor Analysis Data Reduction (SPSS 21.0) with alignment

Proceedings of Annual Australian Business and Social Science Research Conference
26 - 27 September 2016, Crowne Plaza Hotel, Gold Coast, Queensland, Australia
ISBN: 978-1-925488-17-3
The factor scores matrix of Store Layout Design Characteristics shows the associated variables in all the five factors and their relative factor scores as presented in table 9. The factor scores in the factor scores matrix represent the priority of Store Layout Design Characteristics as opined by the customer. The first factor formed is Easy Movement with an Eigen value of 2.143, variance of 13.393% and four associated variables. The associated variables are Space of staircases (factor score .729), Accessibility to the lift facility (.673), Space for customer shopping (.563) and Easy movement of the customer (.517). The second factor formed is Fixtures with an Eigen value of 1.737, variance of 10.859% and three associated variables. The associated variables are Arrangement of product categories/departments (.757), Arrangement of fixtures (.601) and Arrangement of point of sale (.581). The third factor formed is Entry with an Eigen value of 1.682, variance of 10.511% and two associated variables. The associated variables are Security check cabin (.712) and Store front design (.562). The fourth factor formed is Facilities with an Eigen value of 1.543, variance of 9.645% and two associated variables. The associated variables are Drinking water facilities (.797) and Arrangement of wash rooms (.783). The fifth factor formed is Exit with an Eigen value of 1.518, variance of 9.486% and three associated variables. The associated variables are Packing and Delivery of goods counter (.722), Store Exit (.642) and Space for movement of trolley (.599). Two variables (store layout design characteristics, namely aesthetic look and lighting/music are eliminated while performing factor analysis with statistical package SPSS.
8. Finding Customer Shopping Experience Index In this section an attempt has been made to identify overall customer perception towards shopping experience in FMCG retail outlets with three variables. Factor analysis was performed on the customer shopping experience which was recorded on a five point likert scale (i.e. Highly Satisfied [5], Satisfied [4], Slightly Satisfied [3], Dissatisfied [2] and Highly Dissatisfied [1]). To determine the data reliability, reliability test was performed on the data of customer perception on shopping experience data. The value of the Cronbach's Alpha is found to be 0.789, which shows the data of shopping experience is 78.9% reliable which ensures to proceed for further analysis. To determine the appropriateness of factor analysis for the customer shopping experience, Kaiser Meyer Olkin (KMO) and Bartlett’s Test was performed. As shown in table 10, the KMO measure is observed to be 0.540 which is higher than the threshold value of .5 (Hair et al. 1998). So it can be interpreted that there is no error in 54% of the sample and remaining 46%
there may occur some sort of error. Bartlett's Test of Spherincity (2 =8.993) is found to be significant (p < .001, df 3). Finally it can be concluded that the data of customer perception on shopping experience is appropriate for factor analysis. After performing factor analysis, as shown in table 11, three variables are formed into only one factor, named after customer experience index is formed with an Eigen value of 1.578, variance of 60.25% and three associated variables convenient design (.691), rate of motivation (.602) and flackable look (.601).
Table 10 : KMO and Bartlett's Test for Customer Shopping Experience
Kaiser-Meyer-Olkin Measure of Sampling Adequacy 0.540
Bartlett's Test of Sphericity
Approx. Chi-Square 8.993
Df 3
Sig. .000
Source: Factor Analysis Data Reduction (SPSS 21.0)

Proceedings of Annual Australian Business and Social Science Research Conference
26 - 27 September 2016, Crowne Plaza Hotel, Gold Coast, Queensland, Australia
ISBN: 978-1-925488-17-3
Table 11 : Total Variance Explained for Customer Shopping Experience
Extraction Sums of Squared Loadings
Factors Total Variance % of Variance Cumulative %
CUSTOMER SHOPPING INDEX
1.202 40.068 40.068
Source: Factor Analysis Data Reduction (SPSS 21.0)
Table 12: Factors loadings - Customer Shopping Experience
ATTRIBUTES Experience
The store is designed conveniently so that is attracts the customers for shopping.
.691
The Rate of motivation for shopping provided to me is good.
.602
The store has Flackable look and feel that provides good shopping experience.
.601
Extraction Method: Principal Component Analysis. Rotation Method: Varimax with Kaiser Normalization.
Source: Factor Analysis Data Reduction (SPSS 21.0)
8. Model Specification and Discussion In this section an attempt has been made to analyse the associations among customer perception towards shopping experience and store layout design characteristics. To know the impact of store layout design on customer shopping experience, the factors formed from store layout design characteristics (from table 8) and factor formed from customer shopping experience (from table 11) are used for this analysis. Considering customer shopping experience index as dependent variable and the formed five factors (from store layout design characteristics) as independent variables, a multiple regression model is proposed as follows. Customer Satisfaction Index (ICS) = f (Easy Movement, Fixtures, Entry, Facilities, Exit) [1]
Table 13: Model Summary
Model R R
Square
Adjusted R
Square
Std. Error of the
Estimate
Change Statistics
R Square Change
F Change
df1 df2 Sig. F
Change
1 .374 .140 .125 .9352602 .140 9.565 5 294 .000
Source: Regression Analysis (SPSS 21.0)

Proceedings of Annual Australian Business and Social Science Research Conference
26 - 27 September 2016, Crowne Plaza Hotel, Gold Coast, Queensland, Australia
ISBN: 978-1-925488-17-3
Table 14: ANOVAa Table
Model Sum of
Squares df
Mean Square
F Sig.
1
Regression 41.835 5 8.367 9.565 .000b
Residual 257.165 294 .875
Total 299.000 299
a. Dependent Variable: SATISFACTION b. Predictors: (Constant), EXIT, FACILITIES, ENTRY, FIXUTRES, EASY_MOVEMENT
Source: Regression Analysis (SPSS 21.0)
The proposed model is statistically significant at 0.000 level with an f value 9.565 and degrees of freedom 5 as shown in the table 13, R is found to be .374 and R2 is found to be .140 and adjusted R2 found to be .125. Hence it can be concluded that all the independent variables are able to explain only 12.5% in dependent variable as shown in table 13. Customer Shopping Experience Index (ICS) = 1.109E-16 + 0.189 Easy Movement + 0.220 Fixtures + 0.118 Entry + 0.042 Facilities + 0.200 Exit) [2]
Table 15: Coefficients – Store Layout Design Characteristics
Model
Unstandardized Coefficients
Standardized Coefficients
t Sig.
B Std. Error
Beta
1
(Constant) 1.109E-16 .054 .000 1.000
Easy Movement .189 .054 .189 3.501 .001**
Fixtures .220 .054 .220 4.067 .000*
Entry .118 .054 .118 2.183 .030
Facilities .042 .054 .042 .784 .434
Exit .200 .054 .200 3.694 .000*
* Significant Source: Regression analysis (SPSS 21.0)
From table 15, it can be observed that customer shopping experience will be increased by 18.9%, if there is easy movement in the store layout design. The associated variables/characteristics with the factor (Easy Movement) are spacious staircases, accessibility to lift facility, space for customer shopping, easy internal movement of customers. Customer shopping experience will be increased by 22%, if there are good fixtures in the store layout design. The associated variables/characteristics with the factor (Fixture) are Arrangement of product categories/departments, good arrangement of fixtures, and arrangement of point of sales. Customer shopping experience will be increased by 20%, if there is comfortable exit in the store layout design. The associated variables/characteristics with the factor (Exit) are Space for packing and delivery of goods, store exit and movement of trolley.
Proceedings of Annual Australian Business and Social Science Research Conference
26 - 27 September 2016, Crowne Plaza Hotel, Gold Coast, Queensland, Australia
ISBN: 978-1-925488-17-3
Out of five factors of store layout design characteristics, only three factors are found to be significant i.e. Fixtures, Exit and Easy Movement. Remaining two characteristics Entry and Facilities are not found to be statistically significant. It can be concluded that if the level of good store layout design is increasing, the level customer shopping experience is also increasing. It can be observed from the regression analysis model that the customers are more motivated by easy movement in the store, good fixtures and comfortable exit.
Limitations and Further Scope of the Study The present study is limited to only one city i.e. Hyderabad but it can be extended to other cities in India and other countries also. The research topic is confined to only store layout design, but it can be combined with other related topics like visual merchandising. The current research is concentrated only on impact of store layout design on shopping experience, but impact on customer satisfaction, impact on sales, impact on customer retention must also be found out.
References Anchaliya, Akansha, Chitnis, Ekta, Bapna, Ira and Shrivastava, Gitanjali. Eds 2012, ‘Job
Satisfaction of bank employees – A comparative study of Public and private sector’. Ensisage 2020: Emerging Business Practices, New Delhi: Excel Publications.
Baker, J., Parasuraman, A., Grewal, D. and Voss, G.B., 2002, ‘The influence of multiple store environment cues on perceived merchandise value and store patronage intentions’, Journal of Marketing, Vol 66, No 2, pp.120–141.
Bernardi R A.1994, ‘Validating research results when Cronbach’s Alpha is below .70: A Methodological procedure’, Educational and Psychological Measurement, Vol 54, No 3, pp.766-775.
Burke Raymond R, 2005, ‘Retail Shoppability: A Measure of the World’s Best Store’, Future Retail Now: 40 Of The World’s Best Stores, ISBN: 0-9766719-0-5.
Donovan, Robert and John Rossiter, 1982, ‘Store Atmosphere: An Environmental Psychology Approach’, Journal of Retailing, Vol 58, Spring, pp.34-57.
Erdem, O. Oumlil, A.B. and Tuncalp, S, 1999, ‘Consumer values and the importance of store attributes’, International Journal of retail & distribution management, Vol. 27, No.4, pp.137- 144.
Hair J F, Anderson R E, Tatham R L and Black W C., 1998, Multivariate data analysis, New Jersey: Prentice Hall Inc, pp.15-45.
Karolefski J., 2003, ‘Sampling with Sizzle; Retailers Are Upgrading Their Promotions to Engage Shoppers and Create a Memorable Experience’, Supermarket News, January 20, 2003.
Lewison, D, 1994, Retailing, Upper saddle river, Prentice Hall, pp.277-278. Merrilees, B. and Miller, D., 2001, ‘Superstore interactivity: a new self-service paradigm of
retail service?’, International Journal of Retail and Distribution Management, Vol 29, No 8, pp.379-389.
Sherali, H.D. and Adams, W. P., 1998, ‘A reformulation-linearization technique for solving discrete and continuous non-convex problem’, Springer. Stevens, C W, 1980, ‘K-Mart stores try new look to invite more spending’, The Wall street Journal, Nov.26, pp.29-35. Postrel, V. (2003), The Substance of Style, New York: Harper Collins.

Proceedings of Annual Australian Business and Social Science Research Conference
26 - 27 September 2016, Crowne Plaza Hotel, Gold Coast, Queensland, Australia
ISBN: 978-1-925488-17-3
Appendix 1
Profile of the Study Area: Hyderabad Hyderabad is the capital city of the southern Indian state of Telangana. Occupying 650 square kilometres (250 sq mi) on the banks of the Musi River, it is also the largest city in the state. Historically, Hyderabad was known for its pearl and diamond trading centres. Industrialisation brought major Indian Manufacturing, R&D, and Financial Institutions to the city, such as the Bharat Heavy Electricals Limited, the Defence Research and Development Organisation, the Centre for Cellular and Molecular Biology and the National Mineral Development Corporation. The formation of an Information Technology (IT) Special Economic Zone (SEZ) by the state agencies attracted global and Indian companies to set up operations in the city. The emergence of Pharmaceutical and Biotechnology industries during the 1990s earned it the titles of "India's pharmaceutical capital" and the "Genome Valley of India". The Telugu film industry is based in Hyderabad. As of 2011, the Hyderabad Urban Agglomeration has a population of 7,749,334, making it the sixth most populous urban agglomeration in the country. There are 3,500,802 male and 3,309,168 female citizens—a sex ratio of 945 females per 1000 males, higher than the national average of 926 per 1000. Among children aged 0–6 years, 373,794 are boys and 352,022 are girls—a ratio of 942 per 1000. Literacy stands at 82.96% (male 85.96%; female 79.79%), higher than the national average of 74.04%.