Impact of Communications between Firms on Innovation and ...
36
Impact of Communications between Firms on Innovation and New Product Development. The Case of the Cambridge/Boston Biotech Cluster by Dmitry Kolosov Diploma, Astrophysics Moscow State University, 1987 Submitted to the System Design and Management Program in Partial Fulfillment of the Requirements for the Degree of MASSACHUSETTS INSTITUTE OF TECHNOLOGY JUL 2 0 2011 LIBRARIES ARCHIVES Master of Science in Engineering and Management at the Massachusetts Institute of Technology February 2011 @ 2011 Dmitry Kolosov, All rights reserved The author hereby grants to MIT permission copies of this thesis document in whole or to reproduce and distribute publicly paper and electronic in part in any 7 di n known or hereafter created. Signature of Author: '~-~ Certified by: / Accepted by: Dmitry Kolosov Fellow, ystem Design and Management Program Thomas J. Allen Thesis Supervisor Margaret MacVicar Faculty Fellow Howard W. Johnson Professor of Management Professor of Engineering Systems \ J ,.,.trick Hale Director, System Design and Management Program
Transcript of Impact of Communications between Firms on Innovation and ...

Impact of Communications between Firms onInnovation and New Product Development.The Case of the Cambridge/Boston Biotech
Clusterby
Dmitry Kolosov
Diploma, AstrophysicsMoscow State University, 1987
Submitted to the System Design and Management Programin Partial Fulfillment of the Requirements for the Degree of
MASSACHUSETTS INSTITUTEOF TECHNOLOGY
JUL 2 0 2011
LIBRARIES
ARCHIVES
Master of Science in Engineering and Management
at the
Massachusetts Institute of Technology
February 2011
@ 2011 Dmitry Kolosov, All rights reserved
The author hereby grants to MIT permissioncopies of this thesis document in whole or
to reproduce and distribute publicly paper and electronicin part in any 7 di n known or hereafter created.
Signature of Author:'~-~
Certified by: /
Accepted by:
Dmitry KolosovFellow,
ystem Design and Management Program
Thomas J. AllenThesis Supervisor
Margaret MacVicar Faculty FellowHoward W. Johnson Professor of Management
Professor of Engineering Systems
\ J ,.,.trick HaleDirector,
System Design and Management Program

Impact of Communications between Firms onInnovation and New Product Development.The Case of the Cambridge/Boston Biotech
Clusterby
Dmitry Kolosov
Diploma, AstrophysicsMoscow State University, 1987
Submitted to the System Design and Management Programin Partial Fulfillment of the Requirements for the Degree of
Master of Science in Engineering and Management
at the
Massachusetts Institute of Technology
February 2011
Abstract
The paper reports the results of a study of innovations and new product development inbiotechnology and pharmaceutical companies in Boston/Cambridge cluster. The purpose of the studywas to test the hypothesis that more intensive or frequent communications correlate positively withhigher productivity, measured as the number of patents, new drugs or clinical trials per employee.
No significant correlations were found between communications and new drugs or clinical trials.Statistically significant (p < 0.05) negative correlations were found between Number of Patents perEmployee and the three metrics devised for intensity of communications.
Thesis Supervisor:Thomas J. Allen
Title:Margaret MacVicar Faculty FellowHoward W. Johnson Professor of Management EmeritusProfessor of Engineering Systems Emeritus
Dmitry KolosovSDM Thesis Page 2

Acknowledgements
It is my pleasure to express my gratitude to all the people who supported me throughout my years
at System Design and Management program at MIT.
First and foremost, to Professor Thomas Allen, for offering the exciting thesis topic, for providing
data and for guiding my work in a gentle, encouraging and inspiring way. Thank you Tom!
To the faculty, staff and students of SDM program at MIT, for the wonderful atmosphere of mutual
support, constant learning, and for sharing their knowledge and experience.
To Topcon Positioning Systems, the company that not only sponsored my studies at MIT, but also
tolerated my working part time and having to split time between work and studies.
To my wife Natasha, for her encouragement and support, for being with me even when we were on
opposite sides of the ocean.
SDM Thesis Page 3 Dmitry KolosovSDM Thesis Page 3 Dmitry Kolosov

Table of Contents
Abstract ........................................................................-......----... -----------------------------............................. 2
Acknow ledge m ents ..............................................................................-.. . -----------.......................-- - - - - . 3
Table of Contents ......................................................................................... ------------------................---- 4
Table of Figures .....................................................................- -.....---.... --... ------.........................-- - - - .. 5
1. Introduction ..................................................................................... ...... -.. -----------------.................. 6
2. Biotech Cluster in Boston-Cam bridge Area ................................................................................ 7
3. Data...................................................................................................------...-------------. --.............. 8
3.1. Original Data Collected for Previous Study.......................................................................... 9
3.1.1. Instances of Com m unication ....................................................................................... 9
3.1.2. Com panies.......................................................................................................................10
3.2. Additional Data Collected for this Research ..................................................................... 10
3.2.1. Patents ..........................................................................................-------------------............ 11
3.2.2. New Drugs..............................................................................................----------------.-.......12
3.3. Data Characteristics and Our Assum ptions ....................................................................... 15
3.3.1. Stationary State.........................................................................................------....---.---...15
3.3.2. Respondents as Representatives of their Respective Firm s ........................................ 16
4. M etrics and Variables ................................................................................................. . ----.....-. 17
4.1. Com m unications................................................................................................--.........---------17
4.1.1. Degree Centrality .......................................................................................... .... 17
4.1.2. Com m unication Frequency.............................................................................................20
4.1.3. Com m unications w ith Universities ................................................................................. 20
4.2. Innovations ................................................................................................. ... ----........ 21
5. Analysis .................................................................................................--- .... . . -----.--............... 22
5.1. M ethod .......................................................................................................------------------........ 22
5.2. Results............................................................................................------------------------.............. 23
5.3. Effect of Size .................................................................................- -...... --.. -----............... 31
6. Discussion .........................................................................................-------------. . ----------................ 33
Bibliography......................................................................................-- .......- . . - --- ----.................... 35
SDM Thesis Page 4 Dmitry Kolosov

Table of Figures
Figure 1. PhRM A search results ............................................................................................................................ 14
Figure 2. ClinicalTrials.gov search results ............................................................................................................. 15
Figure 3. Correlation between Degree Centrality, firm Size and Number of Respondents.............................19
Figure 4. H1.1: Number of Patents per Employee vs. Degree Centrality, Weighted ........................................ 23
Figure 5. H1.2: New Drugs per Employee vs. Degree Centrality, Weighted ................................................... 24
Figure 6. H1.3: Clinical Trials per Employee vs. Degree Centrality, Weighted ................................................. 25
Figure 7. H2.1: Patents per Employee vs. Frequency of Communications ...................................................... 26
Figure 8. H2.2: New Drugs per Employee vs. Frequency of Communications ................................................. 27
Figure 9. H2.3: Clinical Trials per Employee vs. Frequency of Communications ............................................ 28
Figure 10. H3.1: Patents per Employee vs. Frequency of Contacts with Universities ................... 29
Figure 11. H3.2: New Drugs per Employee vs. Frequency of Contacts with Universities............................... 30
Figure 12. H3.3: Clinical Trials per Employee vs. Frequency of Contacts with Universities ............................. 31
5DM Thesis Page 5 Dmitry KolosovDmitry KolosovSDM Thesis Page 5
1. Introduction
Labor pooling or intermediate goods supply are things that in principle one couldexamine directly... Knowledge flows, by contrast, are invisible; they leave nopaper trail by which they may be measured and tracked, and there is nothing toprevent the theorist from assuming anything about them that she likes.
Paul Krugman, Geography and Trade (1991), p. 53
Exchange of information between R&D laboratories and firms has been recognized by many
researchers as a strong ferment for innovation. Informal trading of technical know-how was both
reported on anecdotal basis and explained in economic terms (von Hippel, 1988).
One of the first papers that discussed the economic effect of information transfer between
companies was (Grilliches, 1979). The paper introduced the "knowledge production function" and
demonstrated how it can include a term for information spillover; however, the paper did not show any
experimental or statistical data to test the theory. A series of studies that followed in the 1980-s and
1990-s presented circumstantial evidence of spillovers (Jaffe, 1986) and demonstrated that investments
in R&D made by large corporations and universities spill over to smaller firms which sometimes appear
more innovative while limited in their R&D spending (Acs, Audretsch, & Feldman, 1994). Moreover, it
was demonstrated that geographical proximity to universities facilitates the spillover of R&D from
universities to smaller firms (Anselin, Varga, & Acs, 1997).
These researches did not measure R&D spillover directly, but rather modeled its effect by
incorporating into a firm's knowledge production function a "black box" term representing aggregate
knowledge ("spillover pool") of technologically similar industries. They also did not suggest specific
mechanisms of information transfer between companies that would facilitate the spillover effect.
SDM Thesis Page 6 Dmitry KolosovDmitry KolosovPage 6SDMV Thesis

On the other hand, information exchange, R&D ties, access to critical information and resource
flows are believed to be critical factors needed for a firm's growth. "On complex projects, the inner
team cannot sustain itself and work effectively without constantly importing new information from the
outside world" (Allen, 1977, p. 123). A study of biotechnology firms (Powell, Koput, & Smith-Doerr,
1996) found that firms ranking higher in network measures (degree centrality, collaborative R&D
experience, etc.) also ranked higher in number of citations per scientific paper and were known as
developers of best-selling drugs.
The purpose of this research is to investigate possible correlations between communications among
organizations and their productivity in generating research-intensive product.
2. Biotech Cluster in Boston-Cambridge Area
For the purpose of this research we will analyze the data collected by Allen and colleagues from
biotechnology and pharmaceutical firms in Massachusetts (Allen, Raz, & Gloor, 2009). The
Massachusetts Biotech Cluster is comprised of more than 240 biotechnology and pharmaceutical firms,
450+ medical device companies, 16 academic medical centers and hospitals. Collectively, firms in the
cluster employ more than 28,000 people (Massachusetts Biotechnology Council, 2009). In addition,
several major universities in the area (MIT, Harvard, Boston University, etc.) maintain relations with
commercial firms and are deeply embedded in the network.
Several factors make the Cluster a unique testing ground for a research of information transfer and
innovation activity:
1) The firms in the cluster belong to the same industry, thus the data is free from influence of
factors that may differ from industry to industry, and we do not need to control additional
variables representing these differences.
SDM Thesis Page 7 Dmitry Kolosov

2) The number of firms in the area is large enough to provide statistically significant samples of
data.
3) MIT in general and Dr. Allen's research group in particular are embedded in the network of
biotech/pharmaceutical companies, which facilitated collaboration of these companies with the
research group during the data-collection phase.
On the other hand, the field presents certain challenges for a researcher:
1) Most of the companies represented in the cluster are privately owned, and parameters that are
traditionally used for production function analysis (R&D spending, market capitalization, profits,
etc.) are not publicly available.
2) Dynamic processes in biotechnology and pharmaceutical industries change the landscape very
rapidly: new companies are founded, existing firms change their names and affiliations due to
mergers and acquisitions (the most notable is probably the acquisition of Wyeth by Pfizer, Inc. in
October 20091); firms also may completely disappear from the scene without leaving a trace!
3) Most biotech and pharma companies grow rapidly, and the data we have about the number of
employees in a company in 2005-2006 may be obsolete by now. We have to assume that the
processes of growth are more or less uniform throughout the cluster and if a scaling coefficient
is required to account for the growth, this coefficient will be more or less the same for all firms.
3. Data
The process of data collection and the tools used in the process were described in detail in the
original paper by Allen, Raz and Gloor (2009) so we will not repeat it here. We will only remind that a
1 See for example (Wyeth Transaction, 2009)
SDM Thesis Page 8 Dmitry Kolosov

total of 410 bench-level scientists from 32 companies were contacted regularly (approximately once a
week, on a random day during the week) during several months and were asked to indicate which
organizations (if any) they had contact with on that particular day. The participants were chosen
randomly from the list of active researchers with PhD or MD degree, so that larger companies were
represented by approximately 10% of its research personnel. In smaller companies this proportion was
greater; in some instances as much as 100 percent.
The data set itself requires a somewhat detailed description, because its certain characteristics will
be important for further discussion.
3.1. Original Data Collected for Previous Study
3.1.1. Instances of Communication
The main data table contains 2160 items, each item representing an instance of communication
between two companies in the form of a tuple { ID, Date, From, To }. For the purposes of this
paper, ID (a unique identifier assigned to the instance of communication) and Date (the calendar date
when the communication occurred and was reported) fields are irrelevant, and will not be discussed any
further. From is a unique identifier of the firm that reported the act of communication, To is a unique
identifier of the peer firm in the communication act. There were 32 firms participating in the study, and
therefore there are 32 different values of the From field. The To firm, however, did not necessarily
participate in the survey and therefore this field may represent a university or any large or small biotech
company within or outside of the Boston area.
In 851 cases, respondents did not specify the peer company of a communication instance, and the
To field is zero in such cases. The previous paper was focusing on the geographic characteristics of
SDM Thesis Page 9 Dmitry KolosovSDM Thesis Page 9 Dmitry Kolosov

communication, and cases of "unspecified peer company" had to be discarded in the analysis process.
For this research, these communications with "Company 0" were included in the sample.
3.1.2. Companies
The second table in data set listed 182 biotech and pharma companies in Boston/Cambridge area,
plus 7 universities in Boston/Cambridge area (MIT, Harvard, Boston University, Tufts, Northeastern
University, Boston College and UMass Boston), plus 5 special entries representing
- all hospitals in Boston area
- all Big Pharma companies outside Boston area
- all biotech companies outside Boston area
- all non-profit research organizations
- all universities outside Boston area
For each firm, the table of companies contains company ID, name, category (Biotech Firm,
University, etc.), number of employees in Massachusetts2, number of respondents participating in the
survey, total number of reports submitted by respondents from a company, plus other data that was
important for the previous research but is irrelevant for the purposes of this paper (Founding Year, City,
Zip Code).
3.2. Additional Data Collected for this Research
The goal of this research is to look for correlations between intensity of communications in biotech
industry and firms' innovations and new product development activity, so we will need variables
representing these two dimensions, and we will need the data to derive these variables from. The data
2 Throughout this paper, "number of employees" means "number of employees in Massachusetts", takenfrom the original data.
SDM Thesis Page 10 Dmitry Kolosov

characterizing communications was described earlier in this section. The task is now to find data that
would help quantify innovations of companies within the sample.
Traditional, although often criticized methods of measuring innovation include patent statistics and
statistics of new products developed by a firm. Fortunately, due to homogeneity of our sample (all firms
working in the same industry) and due to the specifics of the industry (pharma companies tend to file
patent applications for all new chemical compounds found or synthesized in the course of research),
many of the problems of using patent statistics or new product statistics are mitigated. Certainly, it
would not be correct to compare, say, Amgen to IBM, but comparing Alantos Pharmaceuticals to
Millennium Pharmaceuticals seems a reasonable thing to do.
3.2.1. Patents
Since all the firms on our list are operating in the U.S., we chose to look only at U.S. patents, leaving
European, Japanese and other patents beyond the scope of this research. Several web portals provide
access to database maintained by U.S. Patents and Trademark Office.
We found that http://www.freepatentsonline.com/ is particularly easy to use, because it readily
shows the total number of patents and patent applications satisfying the search criteria.
The search query we used was in the form:
APD/1/1/2005->10/10/2010 and IS/MA and AN/"Acusphere"
Here, APD/1/1/ 20 05->10 /10/2010 selects patents or applications with application date
between 1 st of January, 2005 and 1 0 th of October, 2010. This interval of dates captures statistics for the
last 5 years for each firm, so we do not need to correct for the firm age. On the other hand, if a firm
ceased to exist shortly after the original survey ended (June 2006), it will be underrepresented in patent
SDM Thesis Page 11 Dmitry KolosovSDM Thesis Page 11 Dmitry Kolosov

data. A shorter period would capture the dynamics more accurately, but at the same time would reduce
the sample size to the level where the metrics would no longer be statistically significant.
IS/MA stands for "Inventor State is Massachusetts". This predicate limits the search to patents or
applications where at least one of inventors is a Massachusetts resident, and filters out applications filed
from foreign branches of large multinational corporations, such as Novartis or Merck. We assume that,
for example, a patent awarded to Novartis International AG (Basel, Switzerland) is a result of work done
in Novartis Institute of Biomedical Research in Cambridge, MA if one of inventors is a resident of
Massachusetts. Before it was purchased by Pfizer, Wyeth had two facilities in Massachusetts: Wyeth
Research in Cambridge and Wyeth Biotech campus in Andover. These were represented separately in
the original data. Since it is impossible to separate patents originating from these two facilities, the two
entries in our tables were merged.
AN/ "Acusphere" - this predicate simply selects all records where Assignee Name contains the
word "Acusphere", or the name of another firm from our tables.
We collected data both about patent applications filed and about patents awarded, and both were
included in the analysis. In this paper, we will report results based only on the number of patents
awarded - partly for the sake of brevity, partly because we believe that number of patents which passed
the review process at USPTO more accurately reflects a firm's standing in terms of innovations.
3.2.2. New Drugs
It is really hard to measure and quantify activity in new products development in many industries.
Pharmaceutical business is different from other industries in several ways: most of its products can be
directly traced back to patents; most patents in the industry are directly related to products; most of its
products have to go through government-regulated process, and thus will leave a trail.
SDM Thesis Page 12 Dmitry Kolosov

Most of the biotechnology and pharmaceutical companies on our list are in the business of creating
new drugs for therapeutic applications, and the statistics of patents confirm that: of 354 patents
awarded to the 32 firms in our sample, 273 are related to new substances, molecules or compounds.
The remaining 78 are related to new methods of refining, drying, inducing, purification, synthesis, or to
improvements in disease detection and treatment.
Since 1938, the regulation and control of new drugs in the United States requires that every new
drug must be a subject of an approved New Drug Application before U.S. commercialization. The NDA
application is the vehicle through which drug sponsors formally propose that the FDA approve a new
pharmaceutical for sale and marketing in the U.S. (U.S. Food and Drug Administration, 2010).
Before a drug is submitted for NDA approval, a company has to conduct a series of clinical
investigations to determine if the product is reasonably safe for initial use in humans, and if the
compound exhibits pharmacological activity that justifies commercial development. Current Federal law
requires that a drug be the subject of an approved marketing application before it is transported or
distributed across state lines (U.S. Food and Drug Administration, 2010), and if a drug has to be shipped
across state lines to reach a clinical investigator, its sponsor company usually submits an Investigational
New Drug (IND) application.
NDA and IND databases can be valuable source of information about new products in
pharmaceutical industry, but unfortunately we were not able to find a way to access these databases.
However, we were able to use two resources that accumulate and provide access to information about
new drugs in development.
Dmitry KolosovSDM Thesis Page 13

3.2.2.1. PhRMA
The Pharmaceutical Research and Manufacturers of America (PhRMA), representing the country's
leading pharmaceutical research and biotechnology companies, maintains a web site
(http://newmeds.phrma.org/) that provides access to a database that includes medicines currently in
clinical trials or at FDA for review. As of November 2010, the database contains information about more
than 2,000 new medicines in development. We collected statistics about the number of drugs sponsored
by each of the 32 firms on our list. See Figure 1 for an example.
I New Medicines Database I PHRMA - Mozilla Firefox
fle £dit Yiew Hiatory Bookmarks lools jelp
X http://newmeds.phrma.org/results.php?skin=phrma&drug=&indication=&company Googc
New Meddns Database I PHRMA +
la w Disease is our enemy. Working to save lives is our job.Nn % i-N M1
I MI E a
About PhRMA Medicines in Development PatientAssistance Programs Publications News Room
NEW MEDICINES DATABASE
Your search for Genzyme Corporation returned 27 results. Showing results 1-27. SE CH AGAINI
Figure 1.
Genzyme Corporation (Originator)
Development Status IndicationAge-related macular degeneration
Genzyme Corporation (Originator)Development Status IndicationI Niemann-Pick disease type B
PhRMA search results
3.2.2.2. ClinicalTrials.gov
ClinicalTrials.gov (http://clinicaltrials.gov/) is a registry of federally and privately supported clinical
trials conducted in the United States and around the world. As of November 2010, the database counts
99,315 trials with locations in 174 countries. For each firm in our list, we found the number of trials
where the firm was either a sponsor or a collaborator.
I
SDM Thesis Page 14 Dmitry Kolosov

Search ot Genzyme - Ust Results - ClinicalThalsgos - Mozilla Firefos I Il®
file idit Yiew Hiltory lookmarks lools hielp
C X TZ 91 http://clinicaftrials.gov/ct2/resultsterm=&recr=&rst=&type=&cond=&intr=&outc=&le Q ' Goog e
I Searchof:Genzyne-UstResuts -U... +
AsrihnalTaalngov
Found 345 studies with search of: Genzyme
Hide studies that are not seekinq new volunteers.
Rank Status Study
Mucopolysaccharidosis I (MPS 1) and Their Breastfed Infants
I Completed Clinical Study of Aldurazyme in Patients With Mucopolysaccharidosis IMPS) IHas Results Conditions Mucopolysaccharidosis I. Hurlers Syndrome, Hurler Scheie Syndrome, Scheie
Interventions- Biological rhIDU (recombinant human-Alpha-L-lduronidase); Biological Placebo
2 Completed Study of Aldurazyme@ Replacement Therapy in Patients With Mucopolysaccharidosis I (MPS 1) DiseaseHas Results Conditions Mucopolysaccharidosis I; Hurler Syndrome; Hurler-Scheie Syndrome. Scheie Syndrome
Intervention: Biological: Aldurazyme (Recombinant Human Alpha-L-Iduronidase)
3 Recruiting A Study of the Effect of Aldurazyme@ (Laronidase) Treatment on Lactation in Female Patients With
Conditions Mucopolysacchaidosis 1-; Hurler's Syndrome: Hurler-Scheie Syndrome: ScheieIntervention: Drug: Aldurazyme (laronidase)
4 Recruiting Immune Tolerance Study With Aldurazyme@
Figure 2. ClinicalTrials.gov search results
PhRMA and ClinicalTrials.gov database entries attribute a drug or a trial to entire company, so for
large corporations with offices and research facilities outside of Massachusetts, it is not possible to tell
whether a drug is a result of research done in the firm's Boston/Cambridge facility or elsewhere. For this
reason, we had to discard from our sample the entries for the companies that have facilities outside the
Cluster: Novartis, Merck, Pfizer, Serono, Wyeth.
3.3. Data Characteristics and Our Assumptions
Throughout the rest of the paper, we will need to make certain assumptions about collected data.
3.3.1. Stationary State
The data collection process took approximately 13 months in 2005-2006, and each participant was
being contacted during a 6-month sliding window within that period. The previous paper noted that "the
Home Search Study Topics GlossarySearch
+ Display Options
ISSearch of: Genzyme - List Results - ClinicalTrials.gov - Mozilla Firefox
SDM Thesis Page 15 Dmitry Kolosov
-r I CElMO

six month period of data collection is slightly different (but overlapping) for each firm. This could have
had serious [consequences]for the study had something critical affected the industry during the study.
Fortunately for the investigators, no such untoward event occurred." This assumption about the
stationary state is even more important for this study, since, as will be shown later, we will be analyzing
performance characteristics of biotech firms on the data samples that in some cases spread over several
years and in other cases are "snapshots" of current state. We are therefore making the assumptions
that
- Current state of the industry captured in our metrics and variables is somewhat representative
of the long-term state.
- Any periodic or non-periodic trends and any abrupt or catastrophic changes (e.g. financial crisis
of 2008/2009) affect all companies in similar ways and do not introduce biases in our data.
Specifically, if firm A was is found to have communications frequency F during the 6-month period
that it participated in the survey, we are assuming that F accurately characterizes the firm's long-term
information exchange activity and propensity to communicate, relative to other firms in the sample.
3.3.2. Respondents as Representatives of their Respective Firms
As of 2006, the firms in our sample collectively employed about 10,000 people in Massachusetts. Of
course, not all of them were involved in scientific research work, but still it would be unrealistic to
expect that a survey could enlist all bench-level scientists. The sample we have includes reports from
410 respondents, or about 5-10% of all researchers that could contribute to communications statistics.
These respondents were chosen randomly, with the assumption that they represent a fair distribution of
propensity to communicate.
SDM Thesis Page 16 Dmitry KolosovDmitry KolosovSDM Thesis Page 16

Every organization has a small number of key people, technological gatekeepers, that "differ from
their colleagues in the degree to which they expose themselves to sources of technical information
outside their organization" (Allen, 1977, p. 145). It is our assumption that the firms are fairly
represented by their gatekeepers in the pool of respondents, and the number of communication
instances reported from a firm can be scaled to the total number of employees.
We will discuss these and other assumptions in more detail when we introduce our variables in
subsequent sections of this paper.
4. Metrics and Variables
There are several metrics that can be calculated from the collected data sample. Since our goal is to
investigate correlation between "intensity of communications" and "innovations" of companies in
Boston/Cambridge biotech cluster, we must first define the relevant variables that can characterize the
two dimensions of our interest.
4.1. Communications
We will use three different metrics for the "communications" dimension, each quantifying a slightly
different characteristic of the process.
4.1.1. Degree Centrality
In graph theory, degree of a node is the number of edges incident to the node. Degree centrality of
a node can be defined as CD(v) = deg ( where deg(v) is degree of node v. Since (n - 1) is the sameSi 1
for all nodes in a graph or network, it is simply a scale factor that can safely be ignored for most
SDM Thesis Page 17 Dmitry KolosovSDM Thesis Page 17 Dmitry Kolosov

purposes, and we will define Degree Centrality of firm A as the number of different firms and
universities (including "the firm 0") that firm A had communications with.
In directed graphs, one may decide to treat incoming and outgoing edges separately, and introduce
two separate measures of degree centrality. Our data, however, does not capture direction of
communication: if a respondent in firm A reported that she had had a discussion with firm B, this does
not tell us whether the discussion was initiated by herself or by her peer in firm B. Therefore, we are
treating all communications as nondirectional, and degree centrality of firm A will be equal to the
number of communication instances where From=A, plus the number of instances where To=A. We
are assuming here that the chance of the same instance of communication to be reported by both peers
is relatively small (partly because there is a relatively small probability of both peers being in our pool of
reporters) and does not introduce a bias in our data.
Degree centrality, therefore, represents the breadth of communication network of a firm. It does
not, however, represent the intensity with which the firm communicates in the network, or how well
the firm leverages its position within the network. If firm A "talks" only to firm B or only to university C,
it will have the degree centrality of 1, whether a communication takes place every day or only once in 6
months.
One problem with degree centrality is that it is not clear how it scales from the sample to the whole
population. We will argue that it is a metric of the breadth of communication network of the
respondents within a firm, not of the whole firm.
Consider a firm A with 300 employees, 5 of them being on our list of respondents. Suppose they
cumulatively reported 100 instances of communication to 12 other firms, and no other firm reported a
communication with firm A (degree centrality equals 12). It is then reasonable to assume that all 300
employees had (100/5)x300=6000 communications over the same period. But does it also mean that
SDM Thesis Page 18 Dmitry Kolosov

they were talking to (12/5)x300=720 other firms? This number is three times greater than the total
number of biotech and pharma companies in the cluster! On the other hand, is it reasonable to expect
that all 300 employees are talking to the same 12 companies? If it was so, then degree centrality would
not show significant correlation with company size or the number of respondents. In fact, it does (see
Figure 3)
35 35Degree Centrality Degree Centrality
30 3DC = 7.0 log10E - 1.7 . . 30 DC = 10.9 log10R + 2.3
25 R2 =0.4455 R2 0.51662525 R2 056
20 20
15 11
10 10
5 5Number of g $
0 Employees (log) 0
1 10 100 1000 10000 1 10
Figure 3. Correlation between Degree Centrality, firm Size and Number of Respondents
. .
.Number ofRespondents (log)
100
We found, empirically, that Degree Centrality divided by logarithm of the number of respondents
does not show dependency on the number of employees or number of reporters in the company and
therefore can be applied as a measure of breadth of communication network of the whole firm.
We will introduce a "Degree Centrality, Weighted" variable as
Di = Ci/log1 0 Ri
where
Ci - is the number of other organizations that the firm reported communications with, plus the
number of organizations that reported communications with the firm;
Ri - is the number of respondents (reporters) in the firm.
SDM Thesis Page 19 Dmitry KolosovSDMV Thesis Page 19 Dmitry Kolosov
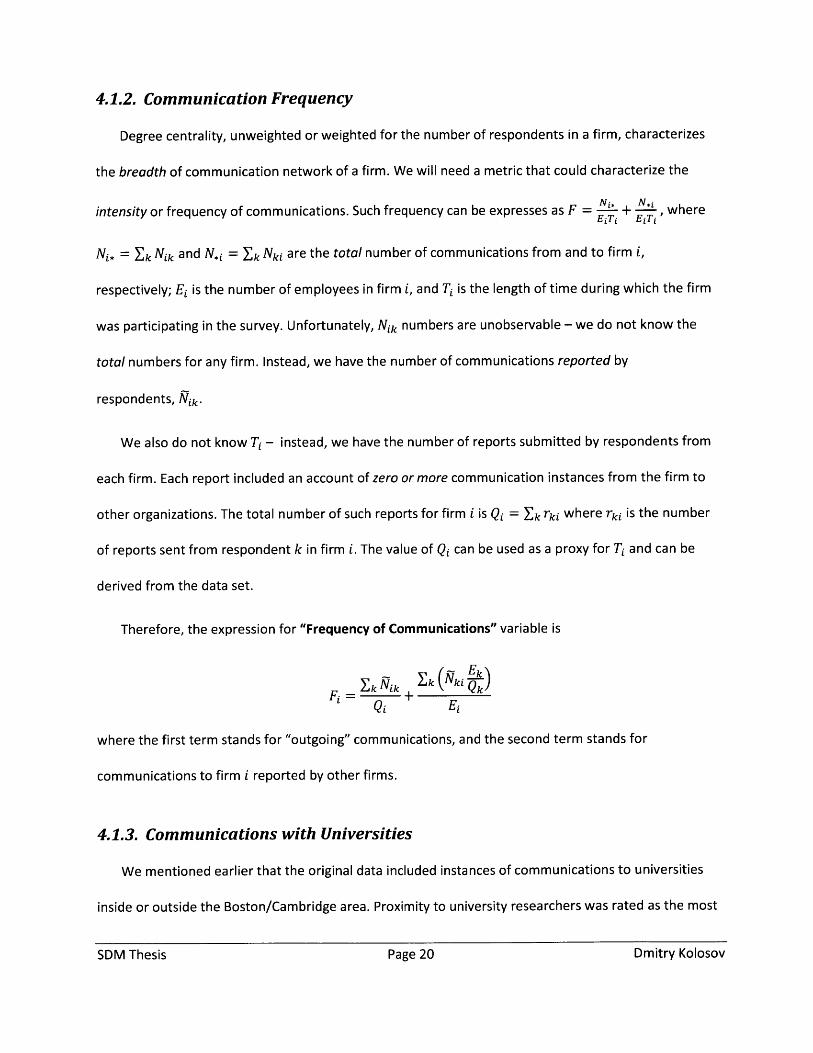
4.1.2. Communication Frequency
Degree centrality, unweighted or weighted for the number of respondents in a firm, characterizes
the breadth of communication network of a firm. We will need a metric that could characterize the
N-intensity or frequency of communications. Such frequency can be expresses as F = + , where
EiTi EiTi
Nj, = Eik Nik and Nj = Yk Nk1 are the total number of communications from and to firm i,
respectively; Ei is the number of employees in firm i, and Tj is the length of time during which the firm
was participating in the survey. Unfortunately, Nik numbers are unobservable - we do not know the
total numbers for any firm. Instead, we have the number of communications reported by
respondents, Nik.
We also do not know T - instead, we have the number of reports submitted by respondents from
each firm. Each report included an account of zero or more communication instances from the firm to
other organizations. The total number of such reports for firm i is Qi = Ek rki where rki is the number
of reports sent from respondent k in firm i. The value of Qi can be used as a proxy for Ti and can be
derived from the data set.
Therefore, the expression for "Frequency of Communications" variable is
Zk kt k(Nki Ek)Fj = +kjikQ
Qi Ei
where the first term stands for "outgoing" communications, and the second term stands for
communications to firm i reported by other firms.
4.1.3. Communications with Universities
We mentioned earlier that the original data included instances of communications to universities
inside or outside the Boston/Cambridge area. Proximity to university researchers was rated as the most
Dmitry KolosovSDM Thesis Page 20

important factor affecting the decision to place a biotech firm in Massachusetts cluster (Bagchi-Sen,
Lawton Smith, & Hall, 2004), so one could expect that communications between commercial
biotech/pharma firms and communications of these firms with universities may demonstrate different
patterns and may affect innovative activities in different ways. Patterns of communications between
biotech firms in the Cluster and universities were a subject of a separate research (Hashmi, 2008).
A variable for "Frequency of Contacts with Universities" metric can be constructed similarly to the
Frequency of Communications variable. It is somewhat simpler, because we do not have respondents in
universities, so all contacts were reported unilaterally. The variable, therefore, is
k ikUQi
where index k runs only over 8 records corresponding to universities (7 universities in the area plus one
record representing all other universities).
4.2. Innovations
We already discussed metrics for innovations earlier; in this section we will only present the
variables constructed for the metrics.
"Patents per Employee" Pi is the total number of patents assigned to firm i, applied for between
1/12005 and 10/10/2010, with at least inventor residing in Massachusetts, divided by the number of
employees in the firm.
"New Drugs per Employee" Gi is the number of new drugs attributed to the firm in PhRMA
database, divided by the number of employees. This sample does not include large companies that have
offices outside of the Boston/Cambridge Cluster.
Dmitry KolosovSDM Thesis Page 21

"Clinical Trials per Employee" Li is the number of clinical trials attributed to the firm in
ClinicalTrials.gov database, divided by the number of employees. This sample does not include large
companies that have offices outside of the Boston/Cambridge Cluster.
5. Analysis
5.1. Method
We now have three variables measuring different aspects of communications:
Degree Centrality, Weighted DiFrequency of Communications FiFrequency of Contacts with Universities Ut
We also have three variables for innovations and new product development:
Patents per Employee PiNew Drugs per Employee GiClinical Trials per Employee Li
The purpose of this research was to study possible correlations between communications among
organizations and their productivity. The general hypothesis can be formulated as follows:
Firms that communicate more generate more innovations in comparison to firms with lower
intensity of communications.
We break down the general hypothesis into 9 separate hypotheses, each analyzing a relation
between two variables:
positive correlationpositive correlationpositive correlationpositive correlationpositive correlationpositive correlationpositive correlationpositive correlationpositive correlation
between Di and Pibetween Di and Gibetween Di and Libetween F and Pibetween F and G1between Fi and Libetween Uj and Pibetween U and Gibetween U and Li
SDM Thesis Page 22 Dmitry Kolosov
H1.1: ThereH1.2: ThereH1.3: ThereH2.1: ThereH2.2: ThereH2.3: ThereH3.1: ThereH3.2: ThereH3.3: There
is ais ais ais ais ais ais ais ais a
Dmitry KolosovSDM Thesis Page 22

5.2. Results
Below we present the plots illustrating each hypothesis, and a summary table with results of
statistical analysis of each hypothesis. The analysis was performed in Stata/SE 10.1, a statistical package
by StataCorp LP (http://stata.com/).
The econometric analysis reported below is based on the following specification:
Metrics of Innovationi = Const + fl * Proxy for Communicationi + E6
We ran this specification for all 9 combinations of variables. After each regression we performed the
Breusch-Pagan test for heteroscedasticity, and in all 9 cases we found that the null hypotheses of
independence of estimated variance of the residuals on the values of the independent variables had to
be rejected at 0.1 level. Consequently, a variant of Stata analysis function which accounts for
heteroscedasticity was chosen for all estimates of the above specification.
H1.1: Number of Patents per Employee vs. Degree Centrality, Weighted
0.35 ~ Patents per Employee
0.30 -
0.25 -
0.20 -
0.15 -
0.10 - ,''' * Degree Centrality,0.05 - Weighted
0.00 -
0 5 10 15 20 25 30 35
Figure 4. H1.1: Number of Patents per Employee vs. Degree Centrality, Weighted
Definitely, the plot shows no positive correlations between the two variables. Moreover, there is a
statistically significant (p < 0.05) negative correlation, as illustrated in the following table.
SDM Thesis Page 23 Dmitry Kolosov

Dependent variable Patents per EmployeeIndependent variable Degree Centrality, WeightedRegression Coefficient -0.0041
(Robust std. err.) (0.0020)
Constant 0.1050
(Robust std. err.) (0.0355)
Number of Observations 31
R-squared 0.1895
t-Statistic -2.08
p 0.046
Table 1. H1.1: Correlation between Patents per Employee and Degree Centrality, Weighted
The more organizations a firm is talking to, the fewer patents it produces per employee.
H1.2: Number of New Drugs per Employee vs. Degree Centrality, Weighted
0.12 -
0.10 -
0.08 -
0.06 -
0.04 -
0.02 -
0.00
New Drugsper Employee
------------------ _Pegree Centrality,* Weigh~te
A&A
0 5 10 15 20 25 30 35
Figure 5. H1.2: New Drugs per Employee vs. Degree Centrality, Weighted
There is no significant correlation, positive or negative, between these variables (p=0.78).
Dependent variable New Drugs per Employee
Independent variable Degree Centrality, WeightedRegression Coefficient -0.0002(Robust std. err.) (0.0007)
Constant 0.0264
(Robust std. err.) (0.0103)
Number of Observations 26
R-squared 0.0029
t-Statistic -0.28
p 0.782
Table 2. H1.2: Correlation between New Drugs per Employee and Degree Centrality, Weighted
' -
Dmitry KolosovPage 24SDM Thesis

H1.3: Number of Clinical Trials per Employee vs. Degree Centrality, Weighted
0.60 -
0.50 -
0.40 -
0.30 -
0.20 -
0.10 -
0.00
Clinical Trialsper Employee
- - - Degree Centrality,~ W Eg-h-ted
*L *I 'W I
0 5 10 15 20 25 30 35
Figure 6. H1.3: Clinical Trials per Employee vs. Degree Centrality, Weighted
There is no significant correlation, positive or negative, between these variables (p=0.82).
Dependent variable Clinical Trials per EmployeeIndependent variable Degree Centrality, WeightedRegression Coefficient -0.0007(Robust std. err.) (0.0031)
Constant 0.1277
(Robust std. err.) (0.0514)Number of Observations 26
R-squared 0.0014t-Statistic -0.23
p 0.818
Table 3. H1.3: Correlation between Clinical Trials per Employee and Degree Centrality, Weighted
SDM Thesis Page 25 Dmitry Kolosov
I 1W IWI 1W I ,I -
SDM Thesis Page 25 Dmitry Kolosov

H2.1: Number of Patents per Employee vs. Frequency of Communications
Patents per Employee
Frequency of-- - Communications
0.0 0.2 0.4 0.6 0.8 1.0 1.2
Figure 7. H2.1: Patents per Employee vs. Frequency of Communications
Definitely, the plot shows no positive correlations between the two variables. Moreover, there is a
statistically significant (p < 0.01) negative correlation, as illustrated in the following table.
Dependent variable Patents per EmployeeIndependent variable Frequency of CommunicationsRegression Coefficient -0.0801(Robust std. err.) (0.0265)
Constant 0.0805(Robust std. err.) (0.0201)
Number of Observations 31
R-squared 0.1107t-Statistic -3.02
p 0.005
Table 4. H2.1: Correlation between Patents per Employee and Frequency of Communications
The more often researchers in a firm are talking to other organizations, the fewer patents the firm
produces per employee.
Dmitry Kolosov
0.35 -
0.30 -
0.25 -
0.20 -
0.15 -
0.10 -
0.05 -
0.00
+
-
SDM Thesis Page 26

H2.2: Number of New Drugs per Employee vs. Frequency of Communications
0.12 -
0.10 -
0.08 -
0.06 -
0.04
0.02
0.00
New Drugsper Employee
E te.quen.cy-ofCommunications
&A AL
0.0 0.2 0.4 0.6 0.8 1.0 1.2
Figure 8. H2.2: New Drugs per Employee vs. Frequency of Communications
There is no significant correlation, positive or negative, between these variables (p=0.87).
Dependent variable New Drugs per EmployeeIndependent variable Frequency of CommunicationsRegression Coefficient 0.0034(Robust std. err.) (0.0208)Constant 0.0223(Robust std. err.) (0.0083)Number of Observations 26
R-squared 0.0011t-Statistic 0.16
p 0.873
Table 5. H2.2: Correlation between New Drugs per Employee and Frequency of Communications
SDM Thesis Page 27 Dmitry KolosovSDM Thesis Page 27 Dmitry Kolosov

H2.3: Number of Clinical Trials per Employee vs. Frequency of Communications
0.60
0.50
0.40
0.30
0.20 -
0.10 -
0.00
Clinical Trialsper Employee
------ -- -- - Frequencyof* Communications
A #
0.0 0.2 0.4 0.6 0.8 1.0 1.2
Figure 9. H2.3: Clinical Trials per Employee vs. Frequency of Communications
There is no significant correlation, positive or negative, between these variables (p=0.87).
Dependent variable Clinical Trials per EmployeeIndependent variable Frequency of CommunicationsRegression Coefficient -0.0149(Robust std. err.) (0.0929)
Constant 0.1242(Robust std. err.) (0.0394)
Number of Observations 26
R-squared 0.0008
t-Statistic -0.16
p 0.874
Table 6. H2.3: Correlation between Clinical Trials per Employee and Frequency of Communications
SDM Thesis Page 28 Dmitry Kolosov
-
1
Dmitry KolosovSDM Thesis Page 28

H3.1: Number of Patents per Employee vs. Frequency of Contacts with Universities
0.35Patents per Employee
0.30
0.25
0.20
0.15
0.10Frequency of Contacts
0.05 with Universities
0.00 * >0.0 0.1 0.2 0.3 0.4 0.5
Figure 10. H3.1: Patents per Employee vs. Frequency of Contacts with Universities
Definitely, the plot shows no positive correlations between the two variables. Moreover, there is a
statistically significant (p < 0.02) negative correlation, as illustrated in the following table.
Dependent variable Patents per EmployeeIndependent variable Frequency of Contacts with UniversitiesRegression Coefficient -0.2824(Robust std. err.) (0.1090)
Constant 0.07211
(Robust std. err.) (0.0176)Number of Observations 31
R-squared 0.1556t-Statistic -2.59
p 0.015
Table 7. H3.1: Correlation between Patents per Employee and Frequency of Contacts with Universities
The more often researchers in a firm are talking to universities, the fewer patents the firm produces
per employee.
SDM Thesis Page 29 Dmitry KolosovSDM Thesis Page 29 Dmitry Kolosov

H3.2: Number of New Drugs per Employee vs. Frequency of Contacts with Universities
0.12 -
0.10 -
New Drugsper Employee
0.08 t
0.06
0.04
0.02 4
0.00
Frequency of Contactswith Universities
V V ~Y' W W
0.0 0.1 0.2 0.3 0.4 0.5
Figure 11. H3.2: New Drugs per Employee vs. Frequency of Contacts with Universities
There is no significant correlation, positive or negative, between these variables (p=0.997).
Dependent variable New Drugs per Employee
Independent variable Frequency of Contacts with Universities
Regression Coefficient 0.0002(Robust std. err.) (0.0608)
Constant 0.0237
(Robust std. err.) (0.0061)
Number of Observations 26
R-squared 0.0000
t-Statistic 0.00
p 0.997
Table 8. H3.2: Correlation between New Drugs per Employee and Frequency of Contacts with Universities
SDM Thesis Page 30 Dmitry Kolosov
1W VW 1W
Dmnitry KolosovPage 30SDM Thesis

H3.2: Number of Clinical Trials per Employee vs. Frequency of Contacts with Universities
0.60Clinical Trials
0.50 per Employee
0.40
0.30
0.20
0.10- ~~~- ------..-- Frequency of Contacts0.10 ~ ~-~------------- ftHiesis* ~ 'with-Universities
0.00
0.0 0.1 0.2 0.3 0.4 0.5
Figure 12. H3.3: Clinical Trials per Employee vs. Frequency of Contacts with Universities
There is no significant correlation, positive or negative, between these variables (p=0.62).
Dependent variable New Drugs per EmployeeIndependent variable Frequency of Contacts with UniversitiesRegression Coefficient -0.1492(Robust std. err.) (0.2931)Constant 0.1312
(Robust std. err.) (0.0389)Number of Observations 26R-squared 0.0098t-Statistic -0.51
P 0.615
Table 9. H3.3: Correlation between Clinical Trials per Employee and Frequency of Contacts with Universities
5.3. Effect of Size
Variables used for productivity metrics used the total number of people a firm employed in
Massachusetts. One might argue that the number of employees includes technical and support
personnel and does not accurately represent the number of scientists involved in research, patent
activity and new product development. This overhead can be expected to account for larger fractions of
personnel in larger companies. Moreover, larger companies employ staff in manufacturing, marketing
and selling of their products; and smaller firms are more focused on pure research.
SDM Thesis Page 31 Dmitry Kolosov

These considerations imply that we need to control for firm size in our analysis. One way to do this is
to include the number of employees as an independent variable in statistical analysis.
The table below shows the results of such analysis from Stata. We can see that controlling for the
size did not change the results obtained earlier, and size is not an explanatory variable for our
dependent variables.
Patents per New Drugs Clinical TrialsEmployee per Employee per Employee
Log of Employment -0.00569 -0.00301 -0.00289
(0.00566) (0.00269) (0.0178)
Degree Centrality, -0.00403** -0.00015 -0.00068
Weighted (0.00191) (0.00074) (0.00321)
Constant 0.129** 0.0380** 0.139
(0.0549) (0.0169) (0.106)
Observations 31 26 26
R-squared 0.211 0.035 0.002
Robust standard errors*** p<0.01, ** p<0.05,
in parentheses* p< 0 .1
Table 10. Productivity metrics vs. Degree Centrality, Weighted
Log of Employment
Frequency ofCommunicationsConstant
ObservationsR-squaredRobust standard errors*** p<0.01, ** p<0.05,
Patents perEmployee-0.0161*(0.00922)-0.128**(0.051)0.169**(0.0669)310.246
New Drugsper Employee
-0.00339(0.00295)-0.00493(0.0229)0.0396*(0.020)260.035
Clinical Trialsper Employee
-0.00491(0.0207)-0.0269(0.113)0.149(0.136)260.003
in parentheses* p<0.1
Table 11. Productivity metrics vs. Frequency of Communications
5DM Thesis Page 32 Dmitry KolosovDmitry KolosovSDM Thesis Page 32

Patents per New DrugsEmployee per Emplo
Log of Employment -0.012 -0.00324(0.00763) (0.00272)
Frequency of Contacts -0.350** -0.0131with Universities (0.133) (0.0636)Constant 0.130** 0.0381**
(0.0507) (0.0169)Observations 31 26
R-squared 0.245 0.035Robust standard errors in parentheses*** p<0.01, ** p<0.05, * p<.1
Table 12. Productivity metrics vs. Frequency of Contacts with Universities
yeeClinical Trials
per Employee-0.00552
(0.0196)-0.172
(0.336)0.156
(0.122)260.013
6. Discussion
We cannot say that, at least in this setting and with this data sample, more intensive or frequent
communications correlate with, let alone cause, higher productivity, at least as measured with the
metrics we developed.
There is a statistically significant (p < 0.05) negative correlation between Number of Patents per
Employee and intensity of communications with other organizations or universities.
The results may seem counterintuitive and perplexing. However, several earlier studies quoted in
(Allen, 1977, p. 136) demonstrated similar trends: inverse relation between the extent to which team
members consulted with persons outside of their respective firms and the technical quality of their
work; strong inverse relation between the extent to which laboratories used paid outside consultants
and laboratory performance; higher quality of ideas generated within the firm, compared to those
coming from outside.
Allen (1977) suggested an explanation for this phenomenon: "From a purely logical viewpoint, it is
probably not information but lack of it that leads to poor performance. The engineer seeks information
SDM Thesis Page 33 Dmitry KolosovPage 33 Dmitry KolosovSDM Thesis

because he perceives a potential gap in his knowledge relative to a specific problem. If this gap in fact
exists, his performance should be better if it is filled; it should be worse if it is not" (p.140).
Apparently, this reasoning can be applied to biotech and pharmaceutical firms in the
Boston/Cambridge cluster.
5DM Thesis Page 34 Dmitry KolosovDmitry KolosovPage 34SDM Thesis

Bibliography
Acs, Z. J., Audretsch, D. B., & Feldman, M. P. (1994). R&D Spillovers and Recipient Firm Size. The Review of
Economics and Statistics, 336-340.
Allen, T. J. (1977). Managing the Flow of Technology. Cambridge, London: MIT Press.
Allen, T. J., Raz, 0., & Gloor, P. (2009). Does Geographic Clustering Still Benefit High Tech New Ventures? The
Case of The Cambridge/Boston Biotech Cluster. Cambridge: MIT.
Anselin, L., Varga, A., & Acs, Z. (1997). Local Geographic Spillovers between University Research and High
Technology Innovations. Journal of Urban Economics, 42, 422-448.
Audretsch, D. B., & Stephan, P. E. (1999). Knowledge Spillovers in Biotechnology: Sources and Incentives.
Journal of Evolutionary Economics, 9 (1), 97-107.
Bagchi-Sen, S., Lawton Smith, H., & Hall, L. (2004). The US biotechnology industry: industry dynamics and
policy. Environment and Planning C: Government and Policy, 22, 199-216.
Grilliches, Z. (1979). Issues in Assessing the Contribution of Research and Development to Productivity
Growth. The Bell Journal of Economics, 10 (1), 92-116.
Hashmi, N. (2008). The Study of the Communication Patterns of Boston-Cambridge Regional Biotech Firms to
Universities. MS Thesis, MIT, SDM, Cambridge, MA.
Jaffe, A. B. (1986). Technological Opportunity and Spillovers of R & D: Evidence from Firms' Patents,
Profits,and Market Value. The American Economic Review, 76 (5), 984-1001.
Krugman, P. R. (1991). Geography and Trade. Cambridge: MIT Press.
Massachusetts Biotechnology Council. (2009). Strategic Outlook for 2015 and Strategic Plan. Cambridge, MA.
Powell, W. W., Koput, K. W., & Smith-Doerr, L. (1996). Interorganizational Collaboration and the Locus of
Innovation: Networks of Learning in Biotechnology. Administrative Science Quarterly, 41 (1), 116-145.
SDM Thesis Page 35 Dmitry KolosovSDMV Thesis Page 35 Dmitry Kolosov

U.S. Food and Drug Administration. (2010, May 11). Investigational New Drug (IND) Application. Retrieved
November 27, 2010, from
http://www.fda.gov/Drugs/DevelopmentApprovalProcess/HowDrugsareDevelopedandApproved/ApprovalApplicat
ions/InvestigationalNewDruglNDApplication/default.htm
U.S. Food and Drug Administration. (2010, August 20). New Drug Application (NDA). Retrieved 11 27, 2010,
from
http://www.fda.gov/Drugs/DevelopmentApprovaIProcess/HowDrugsareDevelopedandApproved/ApprovalApplicat
ions/NewDrugApplicationNDA/default.htm
von Hippel, E. (1988). The Sources of Innovation. Ney York, Oxford: Oxford University Press.
Wyeth Transaction. (2009, October 15). Retrieved November 27, 2010, from
http://www.pfizer.com/investors/shareholderservices/wyethtransaction.jsp
5DM Thesis Page 36 Dmitry KolosovPage 36 Dmitry KolosovSDM Thesis