
Innovation intensity and skills in firms across five ...
15
Innovation intensity and skills in firms across five European countries Martin Falk Austrian Institute of Economic Research (WIFO) Eva Hagsten University of Iceland, Swedish Agency for Economic and Regional Growth Concordi 2019: Innovation for industrial transformation, 25-27 September, Seville
Transcript of Innovation intensity and skills in firms across five ...

Innovation intensity and skills in firms across five European countries
Martin Falk
Austrian Institute of Economic Research (WIFO)
Eva Hagsten
University of Iceland, Swedish Agency for Economic and Regional Growth
Concordi 2019: Innovation for industrial transformation, 25-27 September, Seville

Purpose and contribution Purpose:
i) Illustrate analysis made possible by remote access to harmonised and multi-linked official firm-level data by
ii) Investigating the relationship between skills and innovation intensity (expenditures) for firms in five European countries (Finland, France, the Netherlands, Slovenia and the United Kingdom) 2004-2010.
Contribution:
Novel analysis of relationship between innovation expenditures and kind of skills based on comparable multi-linked firm-level data for a group of European countries.
In brief: Clearly significant link between employees with tertiary
degrees and innovation intensity in firms.
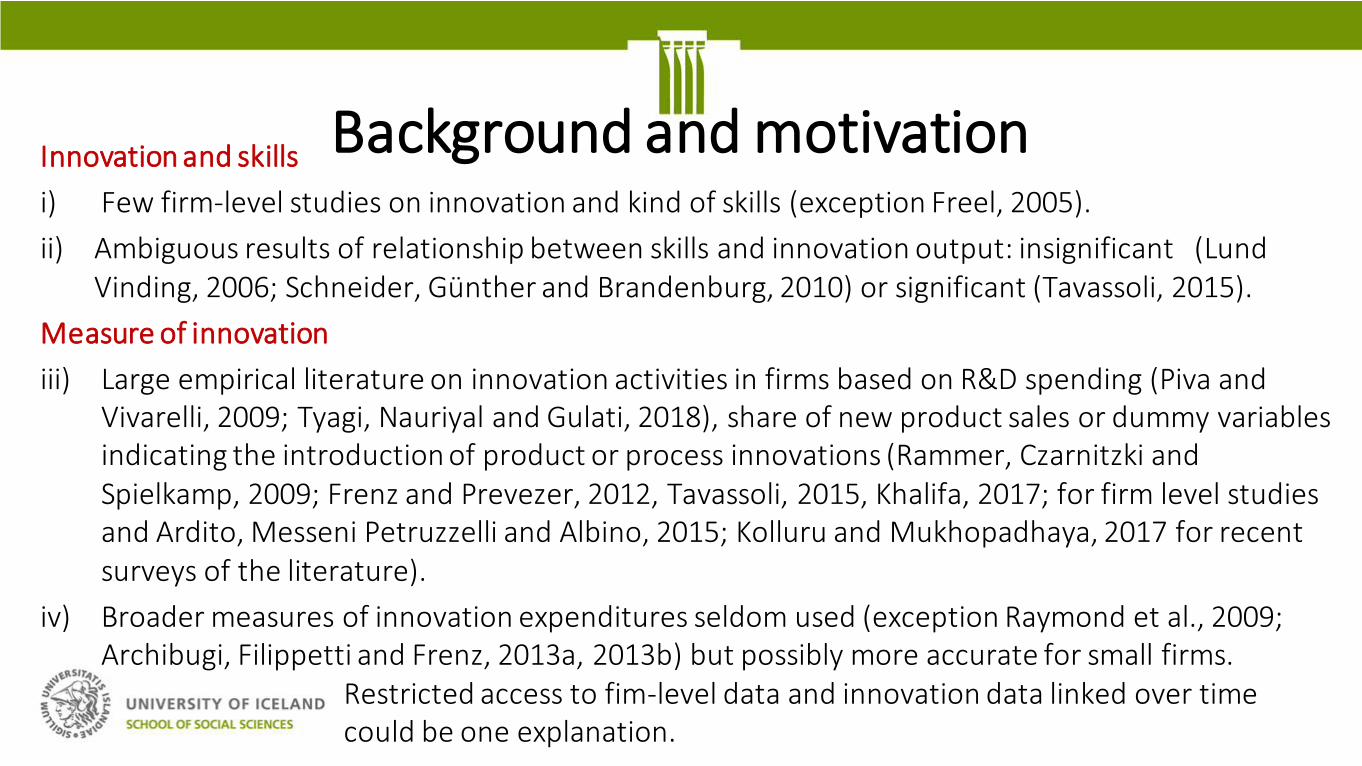
Background and motivation Innovation and skills
i) Few firm-level studies on innovation and kind of skills (exception Freel, 2005).
ii) Ambiguous results of relationship between skills and innovation output: insignificant (Lund Vinding, 2006; Schneider, Günther and Brandenburg, 2010) or significant (Tavassoli, 2015).
Measure of innovation
iii) Large empirical literature on innovation activities in firms based on R&D spending (Piva and Vivarelli, 2009; Tyagi, Nauriyal and Gulati, 2018), share of new product sales or dummy variables indicating the introduction of product or process innovations (Rammer, Czarnitzki and Spielkamp, 2009; Frenz and Prevezer, 2012, Tavassoli, 2015, Khalifa, 2017; for firm level studies and Ardito, Messeni Petruzzelli and Albino, 2015; Kolluru and Mukhopadhaya, 2017 for recent surveys of the literature).
iv) Broader measures of innovation expenditures seldom used (exception Raymond et al., 2009; Archibugi, Filippetti and Frenz, 2013a, 2013b) but possibly more accurate for small firms. Restricted access to fim-level data and innovation data linked over time could be one explanation.

Background and motivation
EC-funded ESSLait project and predecessors (2006-2014): With purpose to test multi-linking of official firm-level data, analyse ICT and innovation impacts and build cross-country disclosable dataset.
*Multi-linking possible, but measures to reduce response burden of firms create selection bias.
*A Micro Moments database with 14 countries and 10 years is created (Eurostat Safe Centre).
*Articles published in international journals on the link between technological innovations, skills and firm performance (Bartelsman, Falk, Hagsten & Polder, 2019; Kotnik & Hagsten, 2018, Hagsten, & Sabadash, 2017; Hagsten & Kotnik, 2017; Hagsten, 2016; Hagsten, 2015; Pantea, Sabadash, & Biagi, 2017),
on performance at the micro-aggregate level (Bertschek, Polder & Schulte, 2019; Falk & Hagsten, 2018); Bartelsman, van Leeuwen & Polder, 2017; Biagi & Falk, 2017; Falk& Biagi, 2017); Falk & Hagsten, 2015) and on the approach to access and build the Micro Moments dataset (Bartelsman, Hagsten & Polder, 2018).

Empirical approach

Empirical approach
Age: Age of firm
Age2: Non-linear relationship
Funding: Dummy for funding source (domestic, EU or a combination) with no funding as reference category
Sector: Dummy variables for 30 industries
Dummy_year: Dummy variable for year
Method: OLS pooled across industries and over time (panel data estimator not possible to use because of high rotation of firms in innovation survey).

Data sources ESSLait harmonised and linked national and Micro Moments datasets 2001-2010 (official registers on business, education and trade as well as statistics on production, ICT and innovation).
a) Encompasses service and manufacturing firms > ten employees.
b) Time period includes revision of industry classification, firms are transformed back to NACE rev. 1.1.
d) This study uses four underlying waves of Community innovation survey (retail trade, hotels and restaurants non-systematically covered, voluntary in survey).
e) Eight countries with information on formal education, but only five on funding (voluntary in survey).
c) Data accessed by common protocol: Distributed Microdata Approach, DMD (Bartelsman, 2004; Eurostat, 2008, 2013; Bartelsman, Hagsten and Polder, 2018).
Similar approaches used by OECD Dynemp and Multiprod as well as ECB Compnet.
f) Selection bias may appear in multi-linked datasets, although Fazio, Lam and Ritchie (2006) conclude that associations are less sensitive than descriptive statistics.

Data sources Stylised facts (data pooled over time) FI FR UK NL SI
Mean
Innovation intensity (expenditures/turnover), % 1.7 1.9 0.8 1 1.7
Employees with tertiary degrees (HKpct), % 20.1 16.2 13.8 15 13.3
Employees with ICT-oriented tertiary degrees (HKITpct), % 9.3 2.8 5.7
Employees with generally-oriented tertiary degrees (HKNITpct), % 10.8 13.4 8.1
Per cent of firms
National funding 20 8.2 9.2 16.3 8.8
EU funding 3.4 3.1 0.9 2.6 3.9
Source: Micro Moments Database and own calculations.

Empirical results: Specification with two human capital variables FI FR UK
Dependent variable: ln innovation expenditures/turnover Coeff. t-stat Coeff. t-stat Coeff. t-stat
Constant -4.981 *** 4.88 -3.179 *** 18.28 -2.372 *** 3.60
ln employment -0.317 *** 15.09 -0.280 *** 27.91 -0.249 *** 14.89
Employees with ICT-oriented tertiary degrees (HKITpct), % 1.177 *** 5.99 1.553 *** 9.17 1.452 *** 8.30
Employees with generally-oriented tertiary degrees (HKNITpct), % 2.208 *** 9.77 1.530 *** 9.73 0.128 0.80
Age -0.0081 ** 2.21 -0.009 *** 4.65 -0.0082 0.81
Age squared 0.0001 *** 2.63 0.0001 *** 3.60 0.0002 0.87
EU and national funding (reference category: no funding) 1.147 *** 10.45 0.960 *** 16.70 1.349 *** 7.25
National funding only 0.694 *** 11.79 0.601 *** 14.60 0.575 *** 8.02
EU funding only 0.033 0.14 0.059 0.49 -0.083 0.29
Sector dummy variables yes yes yes
Year dummy variables yes yes yes
Number of observations 2993 12024 5001
R-squared 0.30 0.19 0.24
Significance at one, five or ten per cent levels denoted by ***, ** and *. Source: ESSLait datasets and own calculations.
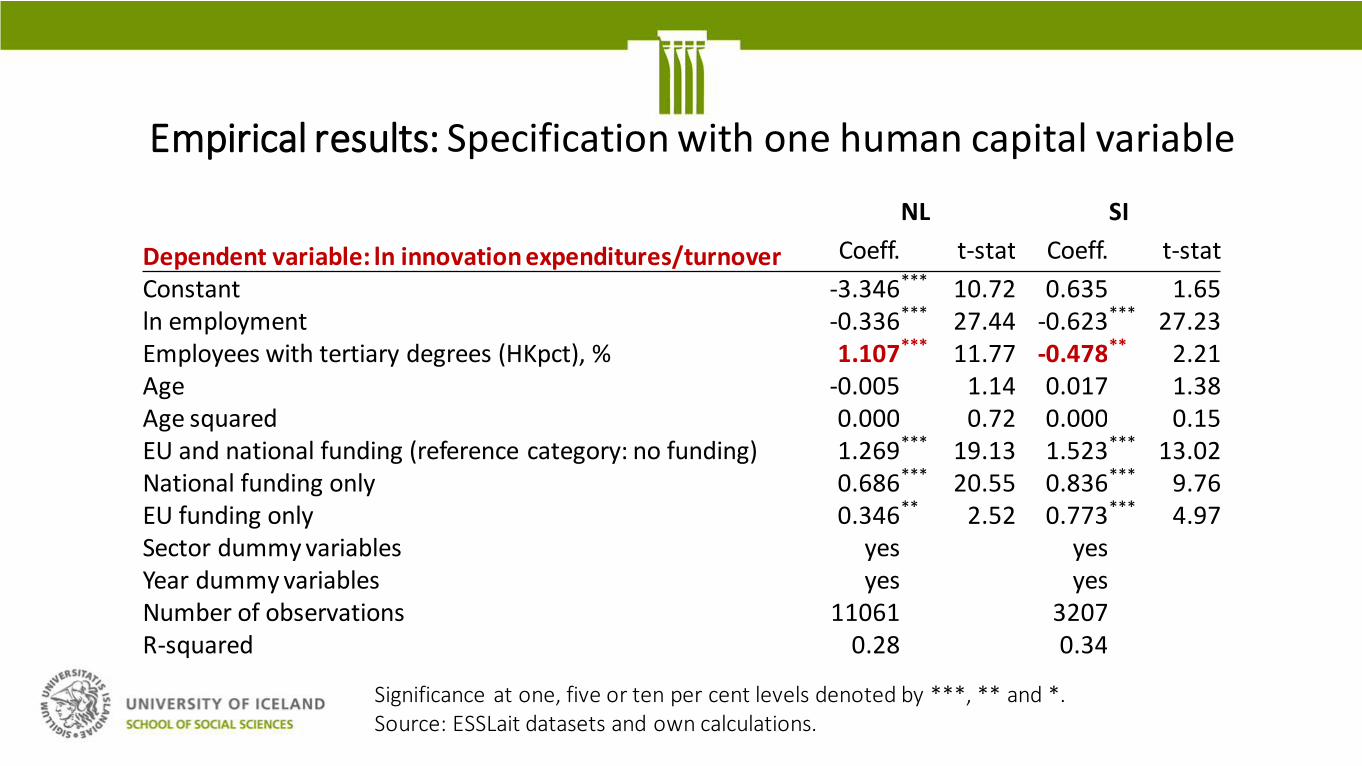
Empirical results: Specification with one human capital variable
NL SI
Dependent variable: ln innovation expenditures/turnover Coeff. t-stat Coeff. t-stat
Constant -3.346 *** 10.72 0.635 1.65 ln employment -0.336 *** 27.44 -0.623 *** 27.23 Employees with tertiary degrees (HKpct), % 1.107 *** 11.77 -0.478 ** 2.21 Age -0.005 1.14 0.017 1.38 Age squared 0.000 0.72 0.000 0.15 EU and national funding (reference category: no funding) 1.269 *** 19.13 1.523 *** 13.02 National funding only 0.686 *** 20.55 0.836 *** 9.76 EU funding only 0.346 ** 2.52 0.773 *** 4.97 Sector dummy variables yes yes Year dummy variables yes yes Number of observations 11061 3207 R-squared 0.28 0.34
Significance at one, five or ten per cent levels denoted by ***, ** and *. Source: ESSLait datasets and own calculations.

Empirical results Strong positive and significant link between schooled HK in most countries, except general orientation in the UK and all kinds of tertiary degrees in SI (significantly negative).
Variability in results could stem from differences in how financial crisis is met, for instance (Archibugi et al., 2013a, 2013b).
Size significant with negative sign, Age as well, or not significant at all.
Results on size partly contradict literature on drivers of R&D, (Cohen, Levin and Mowery, 1989; Rogers, 2002).
Combined EU and national funding strongest associated with innovation expenditures.

Concluding remarks Example of comparative analysis based on common protocol and remote access to harmonised and linked official firm-level datasets.
Estimations based on innovation data linked to business registers, education and production statistics over time, demonstrate a strong link between the degree of highly educated employees and innovation expenditures in firms.
A combination of domestic and EU funding also important for innovation intensity.
Limitation: linked datasets suffer from high turnover of firms in sample surveys and impede panel data approaches. Micro-aggregated data can be used to overcome such problems (Micro Moments Database for 14 countries and 10 years).

Concluding remarks
Future studies should include continuous attempts to link microdata, preferably with additional sources such as R&D. Presently no follow-up to ESSLait project.
Change of sampling strategies at statistical offices would vastly facilitate microdata linking (R&D statistics for instance) and firm-level analyses.
Increased access to microdata allows better analyses of drivers and impacts in the economy.

Bartelsman, E. J., Falk, M., Hagsten, E., & Polder, M. (2019). Productivity, technological innovations and broadband connectivity: firm-level evidence for ten European countries. Eurasian Business Review, 9(1), 25-48.
Bartelsman, E., Hagsten, E., & Polder, M. (2018). Micro Moments Database for cross‐country analysis of ICT, innovation, and economic outcomes. Journal of Economics & Management Strategy, 27(3), 626-648.
Hagsten, E., & Sabadash, A. (2017). A neglected input to production: the role of ICT-schooled employees in firm performance. International Journal of Manpower, 38(3), 373-391.
Hagsten, E., & Kotnik, P. (2017). ICT as facilitator of internationalisation in small-and medium-sized firms. Small Business Economics, 48(2), 431-446.
Hagsten, E. (2016). Broadband connected employees and labour productivity: a comparative analysis of 14 European countries based on distributed Microdata access. Economics of Innovation and New Technology, 25(6), 613-629.
Hagsten, E. (2015). Distributed access to linked microdata: the example of ICT and exports. Applied economics letters, 22(7), 576-580.
Kotnik, P., & Hagsten, E. (2018). ICT use as a determinant of export activity in manufacturing and service firms: Multi-country evidence. Zbornik radova Ekonomskog fakulteta u Rijeci: časopis za ekonomsku teoriju i praksu, 36(1), 103-128.
Peer reviewed articles published in international journals, based on ESSLait work or data
Peer reviewed articles published in international journals, based on ESSLait work or data
Pantea, S., Sabadash, A., & Biagi, F. (2017). Are ICT displacing workers in the short run? Evidence from seven European countries. Information Economics and Policy, 39, 36-44.
b) Micro-aggregated level
Bartelsman, E., van Leeuwen, G., & Polder, M. (2017). CDM using a cross-country micro moments database. Economics of Innovation and New Technology, 26(1-2), 168-182.
Biagi, F., & Falk, M. (2017). The impact of ICT and e-commerce on employment in Europe. Journal of Policy Modeling, 39(1), 1-18.
Bertschek, I., Polder, M., & Schulte, P. (2019). ICT and resilience in times of crisis: evidence from cross-country micro moments data. Economics of Innovation and New Technology, 1-16.
Falk, M., & Biagi, F. (2017). Relative demand for highly skilled workers and use of different ICT technologies. Applied Economics, 49(9), 903-914.
Falk, M., & Hagsten, E. (2018). Employment impacts of market novelty sales: evidence for nine European Countries. Eurasian Business Review, 8(2), 119-137.
Falk, M., & Hagsten, E. (2015). E-commerce trends and impacts across Europe. International Journal of Production Economics, 170, 357-369.


