Ice core records of levoglucosan and dehydroabietic and ... · the saddle of Aurora Peak in Alaska...
16
Atmos. Chem. Phys., 20, 597–612, 2020 https://doi.org/10.5194/acp-20-597-2020 © Author(s) 2020. This work is distributed under the Creative Commons Attribution 4.0 License. Ice core records of levoglucosan and dehydroabietic and vanillic acids from Aurora Peak in Alaska since the 1660s: a proxy signal of biomass-burning activities in the North Pacific Rim Ambarish Pokhrel 1,2,3,4 , Kimitaka Kawamura 1,2 , Bhagawati Kunwar 2 , Kaori Ono 1 , Akane Tsushima 1 , Osamu Seki 1 , Sumio Matoba 1 , and Takayuki Shiraiwa 1 1 Institute of Low Temperature Science, Hokkaido University, Sapporo, Japan 2 Chubu Institute for Advanced Studies, Chubu University, Kasugai, Japan 3 Institute of Science and Technology, Tribhuvan University, Kathmandu, Nepal 4 Asian Research Center, Kathmandu, Nepal Correspondence: Kimitaka Kawamura ([email protected]) Received: 11 February 2019 – Discussion started: 6 March 2019 Revised: 13 September 2019 – Accepted: 16 October 2019 – Published: 17 January 2020 Abstract. A 180 m long (343 years) ice core was drilled in the saddle of Aurora Peak in Alaska (63.52 ◦ N, 146.54 ◦ W; elevation: 2825 m) and studied for biomass-burning trac- ers. Concentrations of levoglucosan and dehydroabietic and vanillic acids exhibit multidecadal variability, with higher spikes in 1678, 1692, 1695, 1716, 1750, 1764, 1756, 1834, 1898, 1913, 1966 and 2005 CE. Historical trends of these compounds showed enhanced biomass-burning activities in the deciduous broadleaf forests, boreal conifer forests, and/or tundra woodland and mountain ecosystems before the 1830s and after the Great Pacific Climate Shift (GPCS). The grad- ually elevated level of dehydroabietic acid after the GPCS is similar to p-hydroxybenzoic acid (p-HBA) from the Sval- bard ice core, suggesting common climate variability in the Northern Hemisphere. The periodic cycle of levoglucosan, which seemed to be associated with the Pacific Decadal Oscillation (PDO), may be more involved with the long- range atmospheric transport than other species. These com- pounds showed significant correlations with global lower- tropospheric temperature anomalies (GLTTAs). The relations of the biomass-burning tracers with the PDO and GLTTA in this study suggest that their emission, frequency and deposi- tion are controlled by the climate-driven forces. In addition, historical trends of dehydroabietic and vanillic acids (burn- ing products of resin and lignin, respectively) from our ice core demonstrate the Northern Hemispheric connections to the common source regions as suggested from other ice core studies from Svalbard, Akademii Nauk and Tunu Greenland in the Northern Hemisphere. 1 Introduction Biomass-burning tracers (e.g., levoglucosan and dehydroabi- etic, vanillic, p-hydroxybenzoic and syringic acids) are ubiq- uitous in the atmosphere and deposited well on ice sheets as snow particles (i.e., precipitation; Pokhrel, 2015; Müller- Tautges et al., 2016; Grieman et al., 2018a, b; Shi et al., 2019). Previously, ammonium (NH + 4 ), nitrite (NO - 2 ), nitrate (NO - 3 ) and sulfate (SO 2- 4 ) were used to understand the at- mospheric signals of biomass burning and/or the Pioneer Agriculture Revolution (PIA-GREV) in the Northern Hemi- sphere (Holdsworth et al., 1996; Legrand and Mayewski, 1997; Legrand et al., 2016). For instance, a signal of biomass burning is ammonium (e.g., [NH 4 ] 2 SO 4 ) in snow particles, which is a constituent of forest fire smoke (Holdsworth et al., 1996; Tsai et al., 2013). Biomass-burning activities such as forest fires and residential heating may affect cli- mate change (Legrand and De Angelis, 1996; Savarino and Legrand, 1998; Gambaro et al., 2008; Keywood et al., 2011). Ice core records archive the long-term changes in depo- sition and concentration of organic (e.g., biomass-burning tracers, ethane, formate, acetate, dicarboxylic acids, pyruvic acid and α-dicarbonyls) and inorganic species (e.g., NH + 4 , Published by Copernicus Publications on behalf of the European Geosciences Union.
Transcript of Ice core records of levoglucosan and dehydroabietic and ... · the saddle of Aurora Peak in Alaska...
Atmos. Chem. Phys., 20, 597–612, 2020https://doi.org/10.5194/acp-20-597-2020© Author(s) 2020. This work is distributed underthe Creative Commons Attribution 4.0 License.
Ice core records of levoglucosan and dehydroabietic and vanillicacids from Aurora Peak in Alaska since the 1660s: a proxysignal of biomass-burning activities in the North Pacific RimAmbarish Pokhrel1,2,3,4, Kimitaka Kawamura1,2, Bhagawati Kunwar2, Kaori Ono1, Akane Tsushima1, Osamu Seki1,Sumio Matoba1, and Takayuki Shiraiwa1
1Institute of Low Temperature Science, Hokkaido University, Sapporo, Japan2Chubu Institute for Advanced Studies, Chubu University, Kasugai, Japan3Institute of Science and Technology, Tribhuvan University, Kathmandu, Nepal4Asian Research Center, Kathmandu, Nepal
Correspondence: Kimitaka Kawamura ([email protected])
Received: 11 February 2019 – Discussion started: 6 March 2019Revised: 13 September 2019 – Accepted: 16 October 2019 – Published: 17 January 2020
Abstract. A 180 m long (343 years) ice core was drilled inthe saddle of Aurora Peak in Alaska (63.52◦ N, 146.54◦W;elevation: 2825 m) and studied for biomass-burning trac-ers. Concentrations of levoglucosan and dehydroabietic andvanillic acids exhibit multidecadal variability, with higherspikes in 1678, 1692, 1695, 1716, 1750, 1764, 1756, 1834,1898, 1913, 1966 and 2005 CE. Historical trends of thesecompounds showed enhanced biomass-burning activities inthe deciduous broadleaf forests, boreal conifer forests, and/ortundra woodland and mountain ecosystems before the 1830sand after the Great Pacific Climate Shift (GPCS). The grad-ually elevated level of dehydroabietic acid after the GPCS issimilar to p-hydroxybenzoic acid (p-HBA) from the Sval-bard ice core, suggesting common climate variability in theNorthern Hemisphere. The periodic cycle of levoglucosan,which seemed to be associated with the Pacific DecadalOscillation (PDO), may be more involved with the long-range atmospheric transport than other species. These com-pounds showed significant correlations with global lower-tropospheric temperature anomalies (GLTTAs). The relationsof the biomass-burning tracers with the PDO and GLTTA inthis study suggest that their emission, frequency and deposi-tion are controlled by the climate-driven forces. In addition,historical trends of dehydroabietic and vanillic acids (burn-ing products of resin and lignin, respectively) from our icecore demonstrate the Northern Hemispheric connections tothe common source regions as suggested from other ice core
studies from Svalbard, Akademii Nauk and Tunu Greenlandin the Northern Hemisphere.
1 Introduction
Biomass-burning tracers (e.g., levoglucosan and dehydroabi-etic, vanillic, p-hydroxybenzoic and syringic acids) are ubiq-uitous in the atmosphere and deposited well on ice sheetsas snow particles (i.e., precipitation; Pokhrel, 2015; Müller-Tautges et al., 2016; Grieman et al., 2018a, b; Shi et al.,2019). Previously, ammonium (NH+4 ), nitrite (NO−2 ), nitrate(NO−3 ) and sulfate (SO2−
4 ) were used to understand the at-mospheric signals of biomass burning and/or the PioneerAgriculture Revolution (PIA-GREV) in the Northern Hemi-sphere (Holdsworth et al., 1996; Legrand and Mayewski,1997; Legrand et al., 2016). For instance, a signal of biomassburning is ammonium (e.g., [NH4]2SO4) in snow particles,which is a constituent of forest fire smoke (Holdsworthet al., 1996; Tsai et al., 2013). Biomass-burning activitiessuch as forest fires and residential heating may affect cli-mate change (Legrand and De Angelis, 1996; Savarino andLegrand, 1998; Gambaro et al., 2008; Keywood et al., 2011).
Ice core records archive the long-term changes in depo-sition and concentration of organic (e.g., biomass-burningtracers, ethane, formate, acetate, dicarboxylic acids, pyruvicacid and α-dicarbonyls) and inorganic species (e.g., NH+4 ,
Published by Copernicus Publications on behalf of the European Geosciences Union.

598 A. Pokhrel et al.: Ice core records of biomass-burning tracers in the North Pacific Rim
SO2−4 , NO−3 , K+ and NO−2 ; Yang et al., 1995; Legrand and
Mayewski, 1997; Andreae and Merlet, 2001; Kaufmann etal., 2010; Lamarque et al., 2010; Wolff et al., 2012; Kawa-mura et al., 2001, 2012; Kehrwald et al., 2012; Legrand et al.,2016; Shi et al., 2019). Many studies have shown that thereare some discrepancies of temporal and spatial biomass-burning activities in ice core proximity records (Legrand etal., 1992, 1996, 2016; Kaplan et al., 2006; Kawamura et al.,2012; Grieman et al., 2015, 2017, 2018a, b; Rubino et al.,2016; Zennaro et al., 2014; You and Xu, 2018) in both theNorthern Hemisphere (NH) and Southern Hemisphere (SH).
For example, proxy records of biomass-burning activ-ities from Lomonosovfonna, Svalbard (Grieman et al.,2018a), showed different trend between vanillic acid and p-hydroxybenzoic acid (p-HBA) within the same ice core sam-ple. Interestingly, ice core records of the North GreenlandEemian (NEEM; Zennaro et al., 2014, 2018) have demon-strated a human impact on the climate system for 4000 years.A different circumpolar region in the NH has a differentatmospheric air mass circulation with different results ofbiomass-burning tracers such as levoglucosan; vanillic, de-hydroabietic and syringic acids; and ethane, ammonium andother carboxylic acids, suggesting potential discrepancies inthe origin, transport and deposition of these compounds onthe ice crystals.
These discrepancies of biomass-burning tracers in dif-ferent ice core records may suggest the different glacio-chemical cycles in the NH and SH throughout decadal to cen-tennial and even millennial periods. For example, centennialand/or shorter timescales of trends exhibited different ele-vated or suppressed concentration trends of p-HBA or vanil-lic acid during 1600 CE and vanillic or p-HBA during 2000–2008 CE (Grieman et al., 2018a). Similarly, the Svalbard icecore record (Grieman et al., 2018a) showed different elevatedor suppressed historical trends or peaks from the NEEM icecore of Greenland (Zennaro et al., 2018). These results mostlikely suggest the occurrence of changing or shifting contri-butions of source regions with the different ecosystems oftrees, shrubs and grasses to the sampling sites.
There are a few ice core studies of biomass-burning-derived specific organic tracers, including levoglucosan,which is a pyrolysis product of cellulose and hemicellulose,and other sugar compounds such as mannosan and galac-tosan as well as dehydroabietic and vanillic acids, which arebiomass-burning products of resin and lignin, respectively(Kawamura et al., 2012; Legrand et al., 2016; Grieman etal., 2017, 2018a, b; Zennaro et al., 2018; Li et al., 2018;You et al., 2019). Kawamura et al. (2012) reported specificbiomass-burning tracers (levoglucosan, dehydroabietic andvanillic acid) for an ice core (1693–1997 CE), collected fromthe Kamchatka Peninsula (56◦04′ N, 160◦28′ E; elevation:3903 m) in the western North Pacific Rim.
In this paper, we report levoglucosan, dehydroabietic acidand vanillic acid in an ice core collected from Aurora Peak insouthern Alaska, an inland site facing the northeastern Pacific
Ocean (Fig. 1). This study covers 1665–2008 CE, which canhelp with better understanding the historical variability in theatmospheric transport of biomass-burning tracers betweenthe western North Pacific (Kawamura et al., 2012) and east-ern North Pacific (this study). We also compare the presentresults with other ice core studies from Greenland, Svalbardand Akademii Nauk in the NH. The results of this study canfurther disclose the database of levoglucosan, dehydroabieticand vanillic acids from the alpine glaciers in the North Pa-cific Rim to explore their possible sources, origin, long- andshort-range atmospheric transport, ecological changes, andclimate variability in the NH.
2 Materials and methods
An ice core (180.17 m deep and 343 years old) was drilledin the saddle of the Aurora Peak in southern Alaska (loca-tion: 63.52◦N, 146.54◦W; elevation: 2825 m; see Fig. 1 forsampling site). The annual mean temperature at the site was−2.2 ◦C, which matched with the temperature at the 10 mdepth in the borehole ice. The annual accumulation rate ofsnow has been 8 mm yr−1 since 19 century and 23 mm yr−1
after the Great Pacific Climate Shift (GPCS; cold watermasses have been replaced by warm water since 1977, e.g.,Meehl et al., 2013). This 180 m long core was divided into∼ 50 cm pieces and directly transported to the laboratory ofthe Institute of Low Temperature Science (ILTS), HokkaidoUniversity, Japan, and stored in a dark, cold room at −20 ◦Cuntil analysis.
The ice core ages were determined by using annual count-ing of hydrogen isotopes (δD) and Na+ seasonal cycles(Tshushima, 2015; Tsushima et al., 2015), with tritium-peakreference ranges between 1963 and 1964 and volcanic erup-tions of Mt. Spurr and Mt. Katmai in 1992 and 1912, wherethe dating error was±3 years at the 0.02 m resolution. Theseice core samples (50 cm long, one-fourth cut by circumfer-ence) were mechanically shaved off (∼ 5–10 mm thicknessof the outer-core surface) on a clean bench at −15 ◦C ina cold room. A ceramic knife was used to avoid a possi-ble contamination during sample collection. We cleaned theceramic knife (total of 12 times) three times by using or-ganic free pure water (Milli-Q water), methanol (MeOH),dichloromethane (DCM), and a 2 : 1 mixture of DCM andMeOH. These scraped ice samples were placed in a cleanglass jar (Iwaki Glass, 1000 mL) for 24 h with aluminumfoil as a cap cover in a level-2 clean room. After 24 h, theseshaving ice core samples were kept at room temperature (ca.25 ◦C) after a small amount (ca. 10 mg) of HgCl2 was added(Pokhrel, 2015). Finally, the thawed sample was transferredinto a 800 mL pre-cleaned brown glass bottle and storedat 4 ◦C. The clean glass jars and bottles were preheated at450 ◦C for 12 h. The total number of ice core sections was147, with a sampling frequency of ∼ 40 % of the ice core.
Atmos. Chem. Phys., 20, 597–612, 2020 www.atmos-chem-phys.net/20/597/2020/

A. Pokhrel et al.: Ice core records of biomass-burning tracers in the North Pacific Rim 599
Figure 1. Geographical location of Aurora Peak in Alaska, where a 180 m long ice core was drilled into the saddle of this peak in 2008.
These melted ice core samples (150 mL) were concen-trated to near-dryness using a rotary evaporator under avacuum in a pear-shaped flask (300 mL) and extractedby a mixture of DCM /MeOH (2 : 1) using an ultrasonicbath. The extracts were transferred to 1.5 mL glass vialand dried under a nitrogen stream. Extracts were deriva-tized with 99 % N, O-bis-(trimethylsilyl)trifluoroacetamide(BSTFA) +1 % trimethylchlorosilane (TMCS) and 10 µLof pyridine at 70 ◦C for 3 h (Fu et al., 2011; Kawamuraet al., 2012). Before injection to gas chromatography–massspectrometry (GC–MS), the known volume of internal stan-dards (n-C13 alkane) was added. GC peaks were analyzedby GC–MS: a Hewlett Packard Model 5973 MSD cou-pled to a HP 6890 GC using a capillary column (HP-5MS, 30 m× 0.32 mm inner diameter, 0.25 µm film thick-ness) installed with a splitless injector. The GC oven tem-perature was programmed from 50 ◦C (2 min) to 120 ◦C at30 ◦C min−1 and then to 300 ◦C at 6 ◦C min−1 and main-tained at 300 ◦C for 20 min. Helium was used as a carriergas. The GC–MS was operated in scan mode (m/z= 50–650) and with an electron impact mode at 70 eV (Pokhrel etal., 2016).
Fragment ions at m/z= 217, 204 and 333 for levoglu-cosan; m/z= 239 for dehydroabietic acid; and m/z= 297,312 and 267 for vanillic acid were processed on the Chem-Station software and used for quantification. Peaks were fur-ther confirmed by comparing the mass spectra with thoseof authentic standards and the mass spectral data in the
NIST Wiley library. An aliquot of authentic standard solution(10 µL) containing levoglucosan, dehydroabietic acid, vanil-lic acid and syringic acid (5.5, 4.7 and 4.2 ng µL−1, respec-tively) was spiked to organic free Milli-Q water (200 mL)placed in the pear-shaped flask. The water sample was con-centrated and dried by the procedure described above. Theconcentrations were derivatized with BSTFA, and peakswere analyzed by GC–MS. The recoveries of the spiked sam-ples of levoglucosan, dehydroabietic acid and vanillic acidwere more than 83 %. Duplicate analyses were conducted tocheck for the analytical error of target compounds, whichwas less than 9 %. Laboratory blanks was measured usingMilli-Q water (200 mL). The procedural blanks showed nodetectable peaks of these compounds. Detection limits ofthese species were 0.002–0.005 ng per kg ice.
We performed cluster analysis for 10 d back trajectories at500 hPa from 2002 to 2007 (Fig. 2a–f), computed for every6 h, which reveal that long-range atmospheric circulation wassignificant in the study site of Aurora Peak. To identify thepossible source regions of biomass-burning events, we pre-pared annual composite maps (2002 to 2008 CE) of the Mod-erate Resolution Imaging Spectroradiometer (MODIS) effec-tive hotspot (Fig. 2a–f) from the Earth Observing SystemData and Information System (EOSDIS) using the Terra andAqua satellites of NASA (https://earthdata.nasa.gov/data/near-real-time-data/firms/active-fire-data, last access: 7 Au-gust 2019). The 10 d back-trajectory analysis from 2002 to2007 showed that Aurora Peak received air masses from the
www.atmos-chem-phys.net/20/597/2020/ Atmos. Chem. Phys., 20, 597–612, 2020

600 A. Pokhrel et al.: Ice core records of biomass-burning tracers in the North Pacific Rim
North Pacific Ocean, eastern Asia, Siberia, Europe, Canadaand higher latitudes of Alaska (Fig. 2a–f). Similar sourceswere reported using a 10 d back trajectory from 1992–2002(> 300 hPa; Yasunari and Yamazaki, 2009). The KamchatkaPeninsula also receives air masses from China, Mongolia,Siberia, eastern Russia and Europe (Kawamura et al., 2012).
3 Results and discussion
Anhydrosugars such as levoglucosan are ubiquitous in theatmosphere; these are emitted significantly from biomass-burning activities and deposited on the ice crystals and con-tribute to water-soluble organic carbon (WSOC; Zennaro etal., 2014; Verma et al., 2015; Gao et al., 2015; Legrandet al., 2016; Grieman et al., 2017, 2018a, b; Li et al.,2018; You et al., 2019). They are produced from the pyroly-sis and combustion of cellulose and/or hemicellulose fromwildfires and domestic wood fires at temperatures above300 ◦C (Shafizadeh, 1984; Fraser and Lakshmanan, 2000;Simoneit, 2004) during the smoldering stage of a fire. Re-cently, Kuo et al. (2011) reported that levoglucosan and itsisomers are produced at temperatures up to 350 ◦C. Manystudies have shown that levoglucosan is the most abundantanhydrous monosaccharide (Engling et al., 2006; Hoffmannet al., 2010; Kuo et al., 2011), which is tracked by otherspecies of anhydro-monosaccharides, e.g., mannosan, galac-tosan and/or dehydroabietic acid. Such specific charactersand the sources can make levoglucosan a unique tracer (Si-moneit et al., 1999; Jordan et al., 2006) in southern Alaska,as shown in Fig. 1.
In addition, historical trends of biomass-burning tracersmay represent the bulk effects of emissions, transport, trans-formations, and the depositional and post-depositional pro-cess on the ice crystals (Grieman et al., 2017). A comparisonof this study (e.g., concentration trends) with other ice corestudies suggested that these compounds are well captured inthe atmosphere and deposited to the ice sheets. Back trajec-tories of this study and other ice core studies suggested com-mon source regions (e.g., Russia, Siberia and eastern Asia);it takes several days for the compounds to reach the samplingsites (e.g., Tunu, Greenland; Svalbard; Akademii Nauk; andAurora Peak in Alaska).
3.1 Levoglucosan
This study showed that average concentration of levoglu-cosan (BDL – below detection limit – range: BDL-20800;average: 543± 2340 ng per kg ice) is 8.6 times higher thanthat of dehydroabietic acid (range: BDL-556; average: 62±97 ng per kg ice) and 400 times higher than that of vanil-lic acid (range: BDL-18.6; average: 1.5± 2.9 ng per kg ice)for 1665–2008 CE. It should be noted that combustion oflignite (lignite includes fossilized cellulose) or hemicellu-lose emits levoglucosan and its isomers, e.g., mannosan and
galactosan (Hoffmann et al., 2010; Kuo et al., 2011). How-ever, we did not detect these isomer compounds (BDL). Incontrast, higher concentrations of these isomers and levoglu-cosan were reported in aerosol samples collected from theoceans via an “around-the-world cruise” (Fu et al., 2011),Mt. Tai in the North China Plain (Fu et al., 2008) and urbantropical India (Fu et al., 2010) using the same method.
Levoglucosan may not be as stable as previously thoughtin the atmosphere (Fraser and Lakshmanan, 2000; Hoffmannet al., 2010); however, its concentrations are not seriouslyinfluenced during transport for several days (Fraser and Lak-shmanan, 2000; Lai et al., 2014). Hence, we may speculatethat levoglucosan could be stable enough in the ice core stud-ies. However, degradation of levoglucosan depends upon theOH radical (Hennigan et al., 2010), which is automaticallyaffected by relative humidity of the atmosphere and air massaging during long-range atmospheric transport from Japan,China, Mongolia, Siberia and Russia to Aurora Peak.
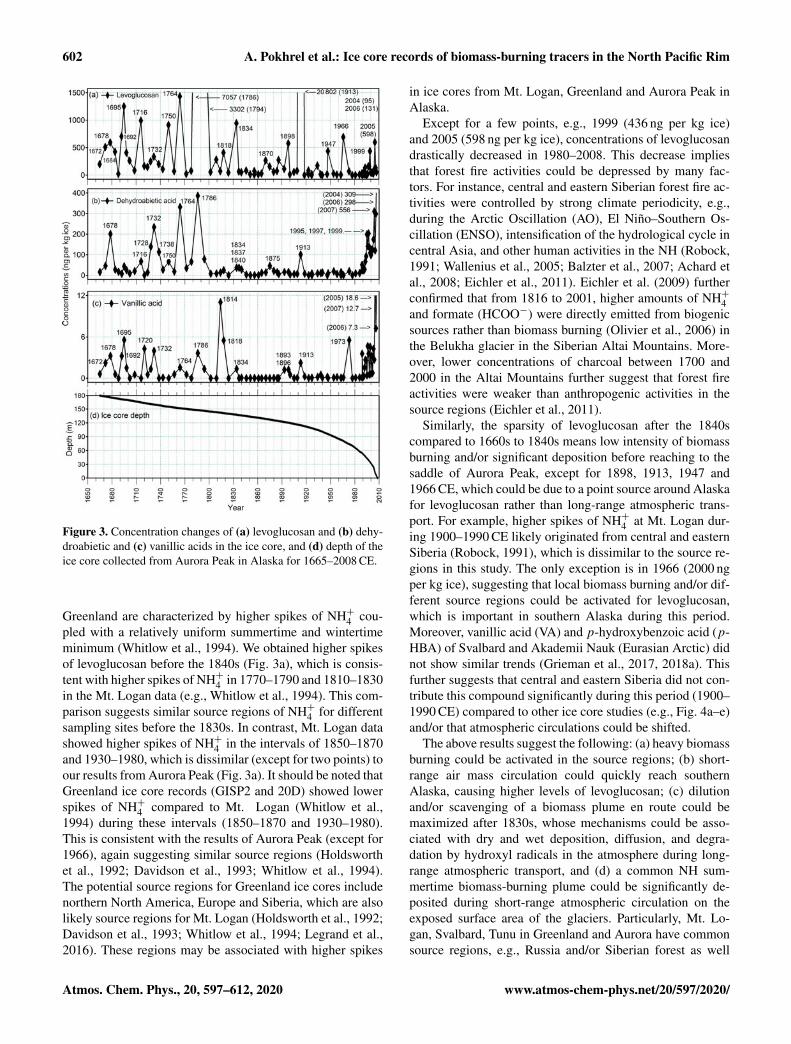
Levoglucosan showed higher concentrations in the 1660sto the 1830s (Fig. 3a), with sporadic peaks in 1678 (icecore depth: 174.6 m; concentration: 593 ng per kg ice), 1692(172.2 m; 704 ng per kg ice), 1695 (170.3 m; 1250 ng perkg ice), 1716 (165.6 m; 990 ng per kg ice), 1750 (156.7 m;913 ng per kg ice), 1764 (151.5 m; 1433 ng per kg ice), 1786(147.3 m; 7057 ng per kg ice), 1794 (146.1 m; 3302 ng per kgice) and 1834 (138.4 m; 944 ng per kg ice) above its averageconcentration (542 ng per kg ice). Source regions of thesehigher spikes could be eastern Asia, eastern Russia, Siberia,and the higher latitudes of Alaska and Canada. For instance,Ivanova et al. (2010) reported the frequently occurring heavyforest fires (e.g., boreal forest) in spring, summer and autumnin eastern Siberia in the past, which is a potential source re-gion to Alaska. This study showed higher concentrations oflevoglucosan before the 1840s (Fig. 3a). Marlon et al. (2008)further confirmed that there was intensive biomass burningbetween the 1750s and 1840s on a global scale, which islinked to increasing anthropogenic activities (e.g., populationgrowth and land-use change).
Similarly, we detected higher spikes of levoglucosan in1898 (120.7 m; 577 ng per kg ice), 1913 (114.8 m; 20 800 ngper kg ice), 1966 (77.7 m; 692 ng per kg ice) and 2005(13.7 m; 598 ng per kg ice) above the average concentration(542 ng per kg ice). Figure 3a clearly shows lower levels thanthe average after the 1830s (except for 1898, 1913, 1966and 2005 CE). This decline could be attributed to less forestfire activity due to intensive grazing, agriculture and forestfire management systems (Marlon et al., 2008; Eichler et al.,2011). It should be noted that charcoal signals are scarce forSiberian regions compared to North American and Europeanice core records (Eichler et al., 2011). Moreover, two-thirdsof Earth’s boreal forest (17×109 ha) lies in Russia, which isa potential source of forest fires with a significant effect on aglobal air quality (Isaev et al., 2002; Eichler et al., 2011).
Mt. Logan in Canada, the Greenland Ice Sheet Project 2(GISP2) and 20D (older than the 1850s) ice core records of
Atmos. Chem. Phys., 20, 597–612, 2020 www.atmos-chem-phys.net/20/597/2020/

A. Pokhrel et al.: Ice core records of biomass-burning tracers in the North Pacific Rim 601
Figure 2. The MODIS fire spots together with 10 d back-trajectory analysis (a–f) of Alaska from 2002 to 2007.
www.atmos-chem-phys.net/20/597/2020/ Atmos. Chem. Phys., 20, 597–612, 2020
602 A. Pokhrel et al.: Ice core records of biomass-burning tracers in the North Pacific Rim
Figure 3. Concentration changes of (a) levoglucosan and (b) dehy-droabietic and (c) vanillic acids in the ice core, and (d) depth of theice core collected from Aurora Peak in Alaska for 1665–2008 CE.
Greenland are characterized by higher spikes of NH+4 cou-pled with a relatively uniform summertime and wintertimeminimum (Whitlow et al., 1994). We obtained higher spikesof levoglucosan before the 1840s (Fig. 3a), which is consis-tent with higher spikes of NH+4 in 1770–1790 and 1810–1830in the Mt. Logan data (e.g., Whitlow et al., 1994). This com-parison suggests similar source regions of NH+4 for differentsampling sites before the 1830s. In contrast, Mt. Logan datashowed higher spikes of NH+4 in the intervals of 1850–1870and 1930–1980, which is dissimilar (except for two points) toour results from Aurora Peak (Fig. 3a). It should be noted thatGreenland ice core records (GISP2 and 20D) showed lowerspikes of NH+4 compared to Mt. Logan (Whitlow et al.,1994) during these intervals (1850–1870 and 1930–1980).This is consistent with the results of Aurora Peak (except for1966), again suggesting similar source regions (Holdsworthet al., 1992; Davidson et al., 1993; Whitlow et al., 1994).The potential source regions for Greenland ice cores includenorthern North America, Europe and Siberia, which are alsolikely source regions for Mt. Logan (Holdsworth et al., 1992;Davidson et al., 1993; Whitlow et al., 1994; Legrand et al.,2016). These regions may be associated with higher spikes
in ice cores from Mt. Logan, Greenland and Aurora Peak inAlaska.
Except for a few points, e.g., 1999 (436 ng per kg ice)and 2005 (598 ng per kg ice), concentrations of levoglucosandrastically decreased in 1980–2008. This decrease impliesthat forest fire activities could be depressed by many fac-tors. For instance, central and eastern Siberian forest fire ac-tivities were controlled by strong climate periodicity, e.g.,during the Arctic Oscillation (AO), El Niño–Southern Os-cillation (ENSO), intensification of the hydrological cycle incentral Asia, and other human activities in the NH (Robock,1991; Wallenius et al., 2005; Balzter et al., 2007; Achard etal., 2008; Eichler et al., 2011). Eichler et al. (2009) furtherconfirmed that from 1816 to 2001, higher amounts of NH+4and formate (HCOO−) were directly emitted from biogenicsources rather than biomass burning (Olivier et al., 2006) inthe Belukha glacier in the Siberian Altai Mountains. More-over, lower concentrations of charcoal between 1700 and2000 in the Altai Mountains further suggest that forest fireactivities were weaker than anthropogenic activities in thesource regions (Eichler et al., 2011).
Similarly, the sparsity of levoglucosan after the 1840scompared to 1660s to 1840s means low intensity of biomassburning and/or significant deposition before reaching to thesaddle of Aurora Peak, except for 1898, 1913, 1947 and1966 CE, which could be due to a point source around Alaskafor levoglucosan rather than long-range atmospheric trans-port. For example, higher spikes of NH+4 at Mt. Logan dur-ing 1900–1990 CE likely originated from central and easternSiberia (Robock, 1991), which is dissimilar to the source re-gions in this study. The only exception is in 1966 (2000 ngper kg ice), suggesting that local biomass burning and/or dif-ferent source regions could be activated for levoglucosan,which is important in southern Alaska during this period.Moreover, vanillic acid (VA) and p-hydroxybenzoic acid (p-HBA) of Svalbard and Akademii Nauk (Eurasian Arctic) didnot show similar trends (Grieman et al., 2017, 2018a). Thisfurther suggests that central and eastern Siberia did not con-tribute this compound significantly during this period (1900–1990 CE) compared to other ice core studies (e.g., Fig. 4a–e)and/or that atmospheric circulations could be shifted.
The above results suggest the following: (a) heavy biomassburning could be activated in the source regions; (b) short-range air mass circulation could quickly reach southernAlaska, causing higher levels of levoglucosan; (c) dilutionand/or scavenging of a biomass plume en route could bemaximized after 1830s, whose mechanisms could be asso-ciated with dry and wet deposition, diffusion, and degra-dation by hydroxyl radicals in the atmosphere during long-range atmospheric transport, and (d) a common NH sum-mertime biomass-burning plume could be significantly de-posited during short-range atmospheric circulation on theexposed surface area of the glaciers. Particularly, Mt. Lo-gan, Svalbard, Tunu in Greenland and Aurora have commonsource regions, e.g., Russia and/or Siberian forest as well
Atmos. Chem. Phys., 20, 597–612, 2020 www.atmos-chem-phys.net/20/597/2020/

A. Pokhrel et al.: Ice core records of biomass-burning tracers in the North Pacific Rim 603
Figure 4. Historical trends of (a) p-hydrobenzoic acid (p-HBA) of Svalbard; (b) vanillic acid (VA) of Svalbard; (c) VA of Tunu, Greenland;(d) p-HBA and VA of Akademii Nauk, with levoglucosan (Lev), dehydroabietic acid (dAA) and VA of Aurora Peak; and (e) historical trendsof dAA and VA of Aurora and VA and p-HBA of Svalbard after the Great Pacific Climate Shift (1977–2007 CE). p-HBA and VA of Svalbardare adopted from Grieman et al. (2018a), VA of Tunu, northeastern Greenland, is adopted from Grieman et al. (2018b), and p-HBA and VAof Akademii Nauk are adopted from Grieman et al. (2017).
North American and Canadian forest (Fig. 4a–e). These con-siderations support the fact that Alaskan glaciers can pre-serve most biomass-burning events in the circumpolar re-gions, which occurred in the source regions of Siberia, east-ern Asia, Canada and Alaska.
Hence, these historical records of levoglucosan before the1830s suggest that long-range atmospheric transport was sig-
nificant rather than short-range transport from intense andwidespread forest fires. For instance, forest fire intensity inaround 1660–1830 CE could be induced by lightning dur-ing drought seasons in the Siberian regions as well as ex-tensive burning to clear land for agriculture purposes in theNH (Whitlow et al., 1994; Legrand et al., 2016; Grieman etal., 2017, 2018a, b).
www.atmos-chem-phys.net/20/597/2020/ Atmos. Chem. Phys., 20, 597–612, 2020

604 A. Pokhrel et al.: Ice core records of biomass-burning tracers in the North Pacific Rim
A declining trend in the concentrations of levoglucosanafter the 1830s (except for few points) showed that sourcescould be changed significantly and/or forest fire activitiescould be suppressed and/or controlled in 1830–1980 (Whit-low et al., 1994). It should be noted that 1400 CE to the endof the 1700 CE is the Little Ice Age (LIA), and the periodafter the LIA until the late 1800s is considered to be the ex-tended Little Ice Age (ELIA; Mann et al., 2009; Divine et al.,2011). This study shows that intense biomass-burning activi-ties (higher spikes) before the 1830s are somewhat similar tohistorical records of p-HBA and vanillic acid of Lomonosov-fonna (Svalbard) and the Akademii Nauk ice core in the NH(Grieman et al., 2017, 2018a) except for some points (Fig. 4a,b, d). Hence, recent changes in the concentration trends in theAlaskan ice core are thought to be driven by climate. Theseclimate-driven effects are further discussed in later Sect. 3.4.
3.2 Dehydroabietic acid
Dehydroabietic acid is produced by pyrolytic dehydration ofabietic acid from conifer resin. In other words, dehydroabi-etic acid is produced during the burning process of coniferresin (Simoneit et al., 1993; Kawamura et al., 2012). It canbe used as a specific biomass-burning tracer for conifer treesand other resin-containing softwoods in an ice core study.Dehydroabietic acid was detected as the second most abun-dant species (range: BDL-556; average: 62.4± 97.2 ng perkg ice); its concentrations are 9 times lower than levoglu-cosan but more than 46 times higher than vanillic acid (range:BDL-18.6; average: 1.62± 2.96 ng per kg ice). Dehydroabi-etic acid showed higher spikes than its average concentra-tion (62.4 ng per kg ice) in 1678 (ice core depth in meters– 173.9 m; 200 ng per kg ice), 1716 (165.3 m; 67.5 ng perkg ice), 1728 (161.5 m; 139 ng per kg ice), 1732 (159.6 m;233 ng per kg ice), 1738 (158.3 m; 113 ng per kg ice), 1750(156.7 m; 66.9 ng per kg ice), 1764 (151.5 m; 331 ng perkg ice), 1786 (147.3 m; 386 ng per kg ice), 1794 (146.1 m;78.6 ng per kg ice), 1913 (114.8 m; 101 ng per kg ice) andeach consecutive year from 1994 to 2007 CE (depth range is44.8–0.88 m; with 92.8, 199, 141, 203, 136, 109, 98.5, 124,124, 174, 309, 131, 298 and 555 ng per kg ice, respectively).Vanillic acid from Svalbard (Grieman et al., 2018a) showedsimilar spikes with dehydroabietic acid in this study from the1660s to the 1790s. In addition, the Svalbard ice core showedrelatively lower spikes from the 1800s to the 1980s as com-pared to those from the 1660s to the 1790s. In contrast, p-HBA in this study did not show a similar trend to Svalbard(Fig. 4a, b).
These periods are consistent with the higher spikes oflevoglucosan, except for a few points (e.g., 1734–1738 CE)before 1990 CE (Fig. 3a, b). The historical trend of dehy-droabietic acid is also similar to that of levoglucosan before1980, which is consistent with Kamchatka ice core records(Kawamura et al., 2012). In contrast, the Kamchatka icecore showed a gradual increase in dehydroabietic acid af-
ter the 1950s. However, we found an abrupt increase for de-hydroabietic and vanillic acids in the Alaskan ice core af-ter 1980 CE (Fig. 3b, c). These results suggest that biomass-burning plumes of pine, larch, spruce and fir trees in Siberianregions have a more substantial influence on Kamchatka,southeastern Russia (facing the western North Pacific Rim),than southern Alaska (facing the eastern North Pacific Rim).
We found that concentrations of dehydroabietic acid in theAlaskan ice core after the 1980s were higher than those oflevoglucosan, which is consistent with Kamchatka records(Kawamura et al., 2012). This further suggests that biomass-burning plumes from Siberian boreal conifer trees could betransported to the North Pacific regions including the easternNorth Pacific Rim. It also suggests that eastern Asian regions(broadleaf trees are common) could be important for levoglu-cosan rather than dehydroabietic acid (boreal forest fires inSiberia, where pine trees are dominant). For instance, cor-relations of levoglucosan versus dehydroabietic and vanillicacid from 1660 to 1840 are weak but significant (τ = 0.37and 0.33, respectively; p < 0.05), suggesting the presence ofa common source region. Correlation of levoglucosan withdehydroabietic and vanillic acids from 1920 to 1977 are notsignificant (0.11 and 0.14, respectively). On the other hand,vanillic vs. dehydroabietic acid showed a significant cor-relation (0.41; p < 0.01), suggesting a different source re-gion for levoglucosan. Back-trajectory analysis (500 hPa) ofair masses (2002–2007 CE), together with fire counts, alsoshowed that sources regions also include Mongolia, Chinaand Japan (Fig. 2a–f). Yasunari and Yamazaki (2009) re-ported that Alaska can receive air masses from eastern Asiaand Japan in the troposphere (> 300 hPa). The KamchatkaPeninsula can also receive air masses from these regions(Kawamura et al., 2012).
These results showed some similarity in the records of lev-oglucosan between Kamchatka and Alaskan ice cores (ex-cept for few points) and some discrepancies of dehydroabi-etic acid between two sampling sites. Dehydroabietic acidconcentrations gradually increased in the Kamchatka ice coreafter the 1950s. The Alaskan ice core showed an increaseafter the 1970s (Fig. 4e), suggesting that conifer-burningplumes could be transported significantly to Kamchatka aswell, but not to southern Alaska, in the 1950s to the 1980s.There is another possibility for this discrepancy between twosites; i.e., dehydroabietic acid could be decomposed dur-ing long-range atmospheric transport (Simoneit and Elias,2001) from Siberia to southern Alaska, although it couldeasily reach Kamchatka in the western North Pacific Rim.The Kamchatka ice core also did not show high spikes (ex-cept 1970) in the 1950s to the 1970s. Such types of lowerspikes and/or sporadic peaks of levoglucosan and dehydroa-bietic acid after the 1910s (Fig. 3a, b) and the correlationssuggest that source regions are different (e.g., eastern Asianbroadleaf trees and Siberian boreal forest and pine trees)or that regional transport overwhelms the long-range atmo-spheric transport of dehydroabietic acid rather than levoglu-
Atmos. Chem. Phys., 20, 597–612, 2020 www.atmos-chem-phys.net/20/597/2020/

A. Pokhrel et al.: Ice core records of biomass-burning tracers in the North Pacific Rim 605
cosan over the saddle of Aurora Peak, at least after the 1910s.Interestingly, dehydroabietic acid showed an increasing trendfrom the 1980s onwards, with higher concentrations thanlevoglucosan, being consistent with the Kamchatka ice core(Kawamura et al., 2012).
Annual composite maps (Fig. 2a–f) of MODIS from 2001to 2007 show a continental outflow of air masses from Eura-sia to the Aurora site, generally supporting the above re-sults and implications for the Alaskan ice core. However, wedetected higher spikes of levoglucosan (in 2004, 2005 and2006 CE, with 95, 598 and 131 ng per kg ice, respectively),dehydroabietic acid (in 2004, 2006 and 2007 CE with 309,298 and 556 ng per kg ice, respectively) and vanillic acid (in2005, 2006 and 2007 CE with 18.6, 7.30 and 12.7 ng per kgice) within these years, suggesting that they have differentsources. It is well known that 2004 is the year of biomassburning in Alaska. The concentration of dehydroabietic acidin 2004 (309 ng per kg ice) is 3 times higher than levoglu-cosan (95.3 ng per kg ice; see Fig. 3), suggesting that borealforest fires associated with conifer trees followed by short-and long-range atmospheric transport are more important inrecent decades in the Northern Hemisphere.
3.3 Vanillic acid
We detected VA in the ice core from Aurora Peak (Fig. 3c),which is a biomass-burning tracer of lignin (Simoneit et al.,1993). Particularly, vanillic acid can be produced by incom-plete combustion of conifer trees, i.e., conifer-rich boreal for-est (Simoneit et al., 1993; Pokhrel, 2015). We found that thelevels of vanillic acid are very low between the 1830s and1960s, as shown in Fig. 3c. Higher spikes of a lignin tracerwere detected in the following years: 1678 (3.25 ng per kgice), 1692 (3.23 ng per kg ice), 1695 (5.56 ng per kg ice),1732 (3.98 ng per kg ice), 1786 (3.60 ng per kg ice), 1814(11.0 ng per kg ice), 1818 (5.50 ng per kg ice), 1973 (5.52 ngper kg ice), 1989 (3.57 ng per kg ice), 1993 (2.66 ng per kgice), 1996 (4.66 ng per kg ice), 1997 (3.57 ng per kg ice),1999 (3.57 ng per kg ice), 2001 (3.26 ng per kg ice) and 2007(18.6 ng per kg ice). We found that the spikes of vanillicacid are not consistent with those of levoglucosan in the icecore during the periods (Fig. 3). In particular, in more recentyears, after 1990, vanillic acid showed a clear abrupt increasein the ice core, which is consistent with the increase in dehy-droabietic acid but different from levoglucosan (Fig. 3). Theabrupt increase in vanillic acid in the Alaskan ice core is con-sistent with that of the Kamchatka ice core (Kawamura et al.,2012).
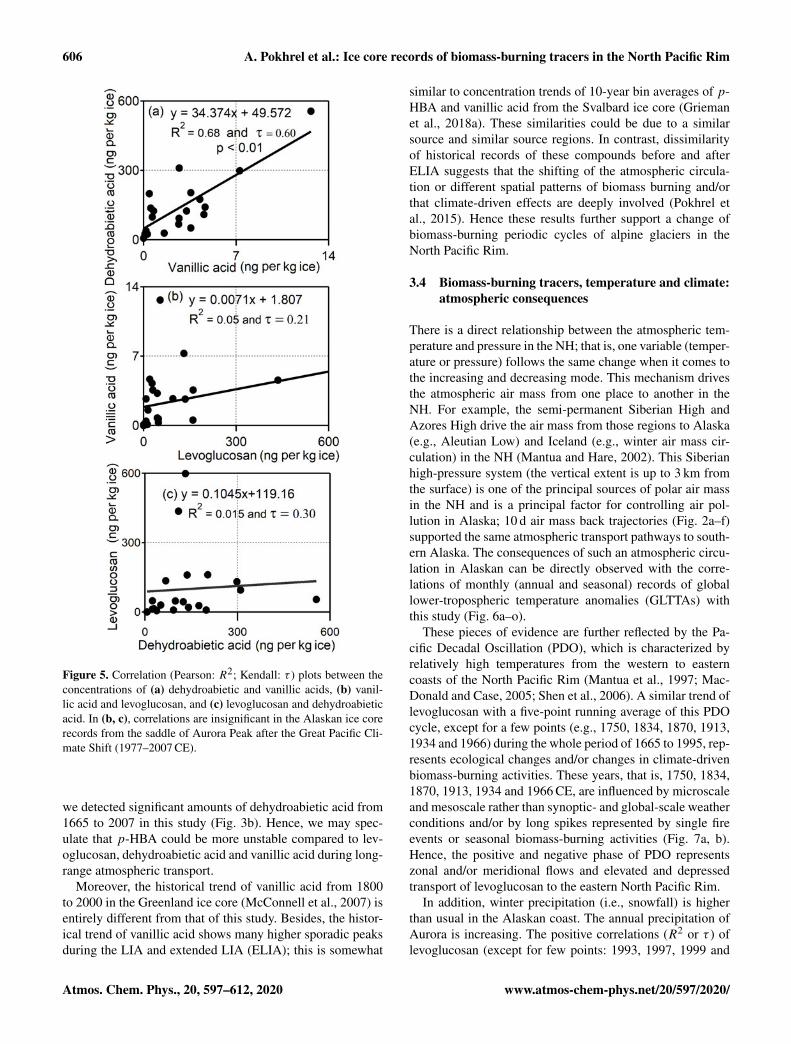
The higher concentrations and similarity of vanillic anddehydroabietic acids in the Alaskan ice core after 1990 sug-gests the enhanced emission of biomass-burning products ofconifer trees and lignin in the boreal forests in Alaska, whichcould be imprinted in the southern Alaskan ice core. Inter-estingly, we found a significant correlation (Fig. 5a) betweendehydroabietic acid (except for 2005 CE) and vanillic acid
(τ = 0.60, p < 0.01) after the 1990s, a period correspond-ing to the GPCS (1977–2007 CE). Being consistent with thewarmer sea surface temperature in the eastern North PacificRim during the GPCS periods (Meehl et al., 2009), southernAlaska is influenced by the warmer temperature and dryness,which triggered a higher chance of forest fire occurrence inthe boreal forests, causing more emissions of conifer andlignin tracers over the southern Alaskan atmosphere (Figs. 3and 4). Interestingly, the Kamchatka ice core also showedan increased concentration of these tracers after the 1970s(Kawamura et al., 2012).
Vanillic acid in the Alaskan ice core showed a differenttrend from the Svalbard ice core (Fig. 4e) after the GPCS(1976–1977), suggesting different source regions. Dehydroa-bietic acid exhibits a similar trend to p-hydroxybenzoic acid(p-HBA) of the Svalbard ice core (Grieman et al., 2018a).p-HBA is produced from tundra grasses and peat species,suggesting that a similar source is northern Asia, includingSiberia. Its ice core record may be driven by climate in theNorth Pacific Rim. In contrast, the historical trend of vanillicacid from the 1770s to the 1950s is similar to that (depressedtrend) of the Tunu, Greenland, ice core, except for few years,namely 1851, 1870, 1880, 1934 and 1946 (Fig. 4c), whichimplies that long-range atmospheric transport from Russiamay be a likely source. These two trends diverge markedlyfrom the 1950s onwards. In addition, vanillic acid in thisstudy exhibits a similar trend to p-HBA and vanillic acid inthe ice core from Akademii Nauk (Grieman et al., 2017) fromthe 1890s to the 1980s (Fig. 4d).
These results suggest that Alaskan glaciers showed non-stationary multidecadal variability in biomass-burning trac-ers from tundra grasses and peat species. Notably, during the1660s to 1820s, vanillic acid, dehydroabietic acid and lev-oglucosan have higher spikes (Fig. 4a, b, c) at four to ninepoints, which is common in other ice cores (Fig. 4a–d) inthe NH. After these higher spikes, a global (at least Tunu,Akademii Nauk and Aurora) depression of vanillic acid andp-HBA (1830s–1950) can be observed (e.g., Fig. 4a–d) inthe NH, suggesting that similarity and variability in theseacids are temporally and spatially heterogeneous in the NHunder the climate-driven forces. Historical trends of biomass-burning tracers from this and other ice core studies, togetherwith back trajectories (Fig. 2a–f), suggest a common poten-tial source region of northern Asia and North America, whichare characterized by fire activities of boreal tundra wood-lands, boreal conifer forests and peat.
Dehydroabietic acids and p-HBA may be more unstablecompared to photodegradation of levoglucosan during long-range transport. For instance, a higher sensitivity of dehy-droabietic acid was reported compared to levoglucosan (Si-moneit and Elias, 2001; Simoneit, 2002). It should be notedthat we did not detect p-HBA, which can be produced fromincomplete combustion of grasses (Simoneit, 2002; Kawa-mura et al., 2012), although p-HBA was detected in theKamchatka ice core (Kawamura et al., 2012). In contrast,
www.atmos-chem-phys.net/20/597/2020/ Atmos. Chem. Phys., 20, 597–612, 2020
606 A. Pokhrel et al.: Ice core records of biomass-burning tracers in the North Pacific Rim
Figure 5. Correlation (Pearson: R2; Kendall: τ ) plots between theconcentrations of (a) dehydroabietic and vanillic acids, (b) vanil-lic acid and levoglucosan, and (c) levoglucosan and dehydroabieticacid. In (b, c), correlations are insignificant in the Alaskan ice corerecords from the saddle of Aurora Peak after the Great Pacific Cli-mate Shift (1977–2007 CE).
we detected significant amounts of dehydroabietic acid from1665 to 2007 in this study (Fig. 3b). Hence, we may spec-ulate that p-HBA could be more unstable compared to lev-oglucosan, dehydroabietic acid and vanillic acid during long-range atmospheric transport.
Moreover, the historical trend of vanillic acid from 1800to 2000 in the Greenland ice core (McConnell et al., 2007) isentirely different from that of this study. Besides, the histor-ical trend of vanillic acid shows many higher sporadic peaksduring the LIA and extended LIA (ELIA); this is somewhat
similar to concentration trends of 10-year bin averages of p-HBA and vanillic acid from the Svalbard ice core (Griemanet al., 2018a). These similarities could be due to a similarsource and similar source regions. In contrast, dissimilarityof historical records of these compounds before and afterELIA suggests that the shifting of the atmospheric circula-tion or different spatial patterns of biomass burning and/orthat climate-driven effects are deeply involved (Pokhrel etal., 2015). Hence these results further support a change ofbiomass-burning periodic cycles of alpine glaciers in theNorth Pacific Rim.
3.4 Biomass-burning tracers, temperature and climate:atmospheric consequences
There is a direct relationship between the atmospheric tem-perature and pressure in the NH; that is, one variable (temper-ature or pressure) follows the same change when it comes tothe increasing and decreasing mode. This mechanism drivesthe atmospheric air mass from one place to another in theNH. For example, the semi-permanent Siberian High andAzores High drive the air mass from those regions to Alaska(e.g., Aleutian Low) and Iceland (e.g., winter air mass cir-culation) in the NH (Mantua and Hare, 2002). This Siberianhigh-pressure system (the vertical extent is up to 3 km fromthe surface) is one of the principal sources of polar air massin the NH and is a principal factor for controlling air pol-lution in Alaska; 10 d air mass back trajectories (Fig. 2a–f)supported the same atmospheric transport pathways to south-ern Alaska. The consequences of such an atmospheric circu-lation in Alaskan can be directly observed with the corre-lations of monthly (annual and seasonal) records of globallower-tropospheric temperature anomalies (GLTTAs) withthis study (Fig. 6a–o).
These pieces of evidence are further reflected by the Pa-cific Decadal Oscillation (PDO), which is characterized byrelatively high temperatures from the western to easterncoasts of the North Pacific Rim (Mantua et al., 1997; Mac-Donald and Case, 2005; Shen et al., 2006). A similar trend oflevoglucosan with a five-point running average of this PDOcycle, except for a few points (e.g., 1750, 1834, 1870, 1913,1934 and 1966) during the whole period of 1665 to 1995, rep-resents ecological changes and/or changes in climate-drivenbiomass-burning activities. These years, that is, 1750, 1834,1870, 1913, 1934 and 1966 CE, are influenced by microscaleand mesoscale rather than synoptic- and global-scale weatherconditions and/or by long spikes represented by single fireevents or seasonal biomass-burning activities (Fig. 7a, b).Hence, the positive and negative phase of PDO representszonal and/or meridional flows and elevated and depressedtransport of levoglucosan to the eastern North Pacific Rim.
In addition, winter precipitation (i.e., snowfall) is higherthan usual in the Alaskan coast. The annual precipitation ofAurora is increasing. The positive correlations (R2 or τ ) oflevoglucosan (except for few points: 1993, 1997, 1999 and
Atmos. Chem. Phys., 20, 597–612, 2020 www.atmos-chem-phys.net/20/597/2020/
A. Pokhrel et al.: Ice core records of biomass-burning tracers in the North Pacific Rim 607
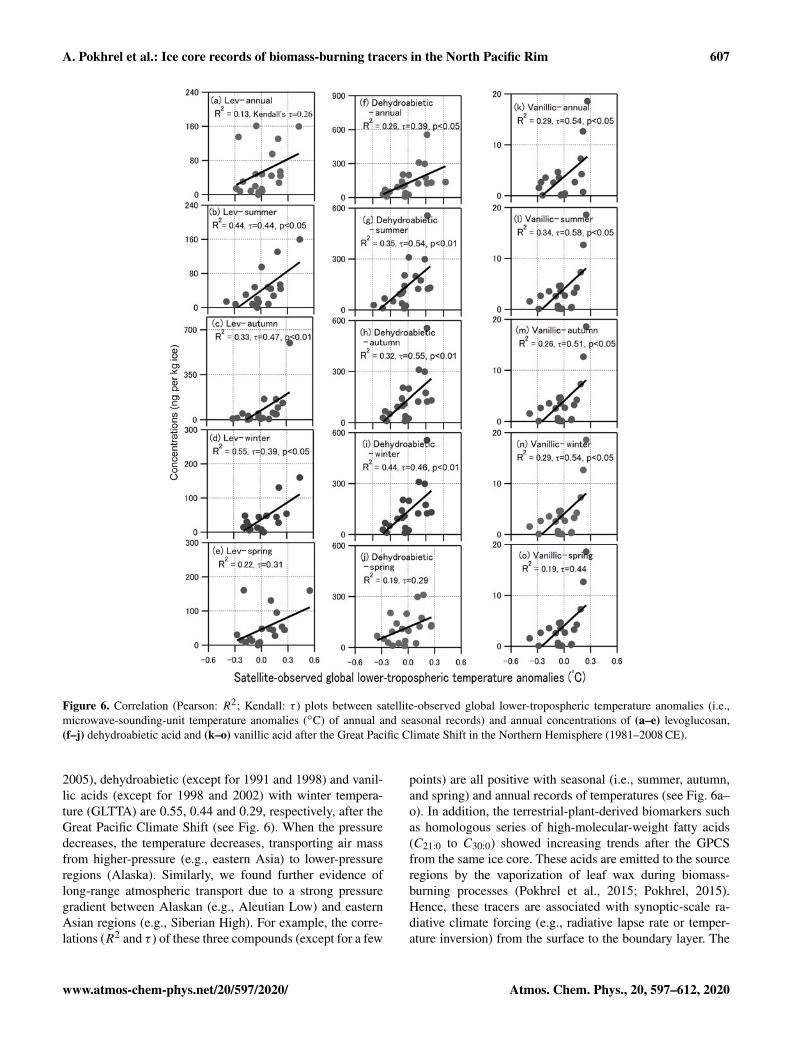
Figure 6. Correlation (Pearson: R2; Kendall: τ ) plots between satellite-observed global lower-tropospheric temperature anomalies (i.e.,microwave-sounding-unit temperature anomalies (◦C) of annual and seasonal records) and annual concentrations of (a–e) levoglucosan,(f–j) dehydroabietic acid and (k–o) vanillic acid after the Great Pacific Climate Shift in the Northern Hemisphere (1981–2008 CE).
2005), dehydroabietic (except for 1991 and 1998) and vanil-lic acids (except for 1998 and 2002) with winter tempera-ture (GLTTA) are 0.55, 0.44 and 0.29, respectively, after theGreat Pacific Climate Shift (see Fig. 6). When the pressuredecreases, the temperature decreases, transporting air massfrom higher-pressure (e.g., eastern Asia) to lower-pressureregions (Alaska). Similarly, we found further evidence oflong-range atmospheric transport due to a strong pressuregradient between Alaskan (e.g., Aleutian Low) and easternAsian regions (e.g., Siberian High). For example, the corre-lations (R2 and τ ) of these three compounds (except for a few
points) are all positive with seasonal (i.e., summer, autumn,and spring) and annual records of temperatures (see Fig. 6a–o). In addition, the terrestrial-plant-derived biomarkers suchas homologous series of high-molecular-weight fatty acids(C21:0 to C30:0) showed increasing trends after the GPCSfrom the same ice core. These acids are emitted to the sourceregions by the vaporization of leaf wax during biomass-burning processes (Pokhrel et al., 2015; Pokhrel, 2015).Hence, these tracers are associated with synoptic-scale ra-diative climate forcing (e.g., radiative lapse rate or temper-ature inversion) from the surface to the boundary layer. The
www.atmos-chem-phys.net/20/597/2020/ Atmos. Chem. Phys., 20, 597–612, 2020
608 A. Pokhrel et al.: Ice core records of biomass-burning tracers in the North Pacific Rim
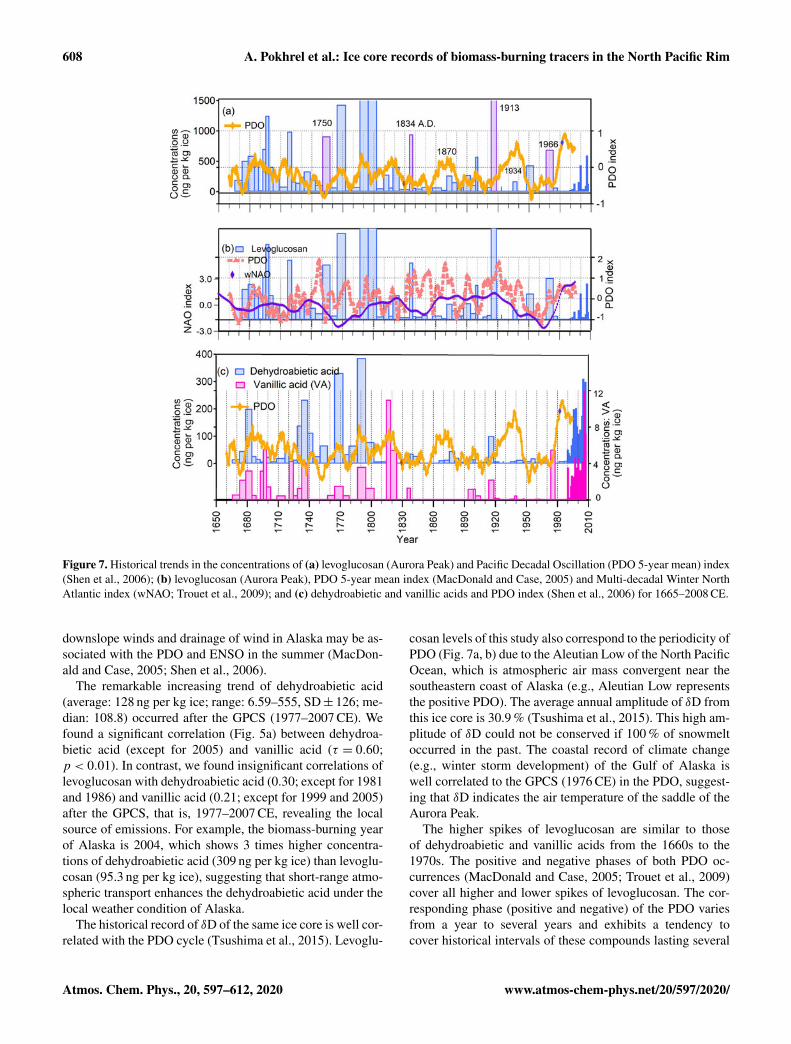
Figure 7. Historical trends in the concentrations of (a) levoglucosan (Aurora Peak) and Pacific Decadal Oscillation (PDO 5-year mean) index(Shen et al., 2006); (b) levoglucosan (Aurora Peak), PDO 5-year mean index (MacDonald and Case, 2005) and Multi-decadal Winter NorthAtlantic index (wNAO; Trouet et al., 2009); and (c) dehydroabietic and vanillic acids and PDO index (Shen et al., 2006) for 1665–2008 CE.
downslope winds and drainage of wind in Alaska may be as-sociated with the PDO and ENSO in the summer (MacDon-ald and Case, 2005; Shen et al., 2006).
The remarkable increasing trend of dehydroabietic acid(average: 128 ng per kg ice; range: 6.59–555, SD± 126; me-dian: 108.8) occurred after the GPCS (1977–2007 CE). Wefound a significant correlation (Fig. 5a) between dehydroa-bietic acid (except for 2005) and vanillic acid (τ = 0.60;p < 0.01). In contrast, we found insignificant correlations oflevoglucosan with dehydroabietic acid (0.30; except for 1981and 1986) and vanillic acid (0.21; except for 1999 and 2005)after the GPCS, that is, 1977–2007 CE, revealing the localsource of emissions. For example, the biomass-burning yearof Alaska is 2004, which shows 3 times higher concentra-tions of dehydroabietic acid (309 ng per kg ice) than levoglu-cosan (95.3 ng per kg ice), suggesting that short-range atmo-spheric transport enhances the dehydroabietic acid under thelocal weather condition of Alaska.
The historical record of δD of the same ice core is well cor-related with the PDO cycle (Tsushima et al., 2015). Levoglu-
cosan levels of this study also correspond to the periodicity ofPDO (Fig. 7a, b) due to the Aleutian Low of the North PacificOcean, which is atmospheric air mass convergent near thesoutheastern coast of Alaska (e.g., Aleutian Low representsthe positive PDO). The average annual amplitude of δD fromthis ice core is 30.9 % (Tsushima et al., 2015). This high am-plitude of δD could not be conserved if 100 % of snowmeltoccurred in the past. The coastal record of climate change(e.g., winter storm development) of the Gulf of Alaska iswell correlated to the GPCS (1976 CE) in the PDO, suggest-ing that δD indicates the air temperature of the saddle of theAurora Peak.
The higher spikes of levoglucosan are similar to thoseof dehydroabietic and vanillic acids from the 1660s to the1970s. The positive and negative phases of both PDO oc-currences (MacDonald and Case, 2005; Trouet et al., 2009)cover all higher and lower spikes of levoglucosan. The cor-responding phase (positive and negative) of the PDO variesfrom a year to several years and exhibits a tendency tocover historical intervals of these compounds lasting several
Atmos. Chem. Phys., 20, 597–612, 2020 www.atmos-chem-phys.net/20/597/2020/
A. Pokhrel et al.: Ice core records of biomass-burning tracers in the North Pacific Rim 609
decades, from the 1660s to the 1970s. The NAO or win-ter NAO (wNAO) phase remains the same for several yearswhen compared to the PDO from same ice core (Pokhrel etal., 2015), as shown in Fig. 7b. The periodicity of the NAOphase (positive and negative) does not represent the histor-ical trends (higher spikes and depression) of levoglucosan,dehydroabietic and vanillic acids (Fig. 7b, c). This NAO rep-resents atmospheric circulation between the subtropical highand polar low (Trouet et al., 2009). In fact, the NAO signif-icantly dominates the North Atlantic (e.g., North America)and European winter climate variabilities rather than thoseof northern Asia (i.e., Eurasia and Siberia), which is sponta-neously inappropriate in this study.
4 Summary and conclusions
This study has been conducted to better understand how tem-poral trends of the forest fire signal in the ice core depend onthe source region and proximity to the source and types ofvegetation in the source regions of southern Alaska since the1660s. Ice core records of dehydroabietic acid, vanillic acidand levoglucosan showed predominant multidecadal trends,suggesting the variations in fire regimes and the proximityto the source and changes in atmospheric circulation, landuse and/or ecological patterns in the midlatitudes to high lat-itudes (≥ 30◦ N) at least before and after the 1830s and af-ter the Great Pacific Climate Shift (GPCS). Levoglucosanshowed sporadic peaks from the 1660s to the 1830s and sin-gle spikes in 1898, 1913, 1966 and 2005 CE. These spikesindicate a significant contribution of biomass and/or biofuelburning attributed to their source-specific emission and at-mospheric stability in Alaska.
Dehydroabietic and vanillic acids showed similar histor-ical trends with levoglucosan before the 1830s, suggestingthat hardwood and conifer trees (e.g., resin and lignin borealconifer trees, deciduous trees, and other higher plants) andperennial grasses (C3 and C4 plants) were simultaneouslyimportant as burning sources. The gradually increasing con-centration trends of dehydroabietic and vanillic acids fromthe 1980s onward show a strong correlation (τ = 0.60, p <0.01; after the GPCS; 1976), suggesting significant changesin either burning patterns (i.e., new land-use pattern or newecological pattern) or atmospheric circulation over Alaskaby the climate-driven forces exhibiting similar signals ofbiomass-burning tracers as opposed to insignificant correla-tion of levoglucosan with these compounds.
The significant positive correlations (τ ) of these threecompounds with global lower-tropospheric (annual andseasonal) temperature anomalies (GLTTAs) suggest thatAlaskan snow precipitation was involved with climate-drivenforces from the end of the GPCS onwards. These tracers arecorrelated with synoptic- and global-scale radiative climateforcing (e.g., radiative atmospheric lapse rate or inversion)from the surface to the atmospheric boundary layer. The se-
ries of higher (lower) spikes of biomass-burning tracers fromAurora Peak represent the positive (negative) phase of PDOperiodicity cycles in the North Pacific Rim. The correlationsof temperature and comparison with the PDO cycle in thisstudy further prove the excellent signal of the periodic cy-cle of a climate-driven regime, namely atmospheric activi-ties, climate and weather conditions, ecological changes, andindividual fire activities of source regions to the Aurora site.
The straightforward historical trends of these three com-pounds were significant before the 1830s; this differs fromthe Kamchatka ice core record, suggesting that there aresome differences between the western and eastern North Pa-cific Rim in terms of the emission, frequency and deposition.The concentrations of these three compounds from AuroraPeak are higher than those from other ice core studies in theNH (e.g., Kamchatka, Svalbard, Tunu and Akademii Nauk).In contrast, there are similarities in the depressed concen-tration trend of Aurora with other ice core studies at least for100 years (e.g., from the 1890s to the 1980s: Akademii Nauk;1820–1960: Tunu, Greenland), suggesting that sources ofbiomass-burning tracers are further confined within the sameregions, traveling from very long distances, and are well cap-tured within the snow particles. If it is true, these compoundsmight be involved as cloud condensation nuclei from the sur-face to 15.2 km (i.e., cumulonimbus cloud) are transportedthousands kilometers to Aurora. This gives positive feedbackfor the climate change and/or climate variability in the NorthPacific Rim.
Data availability. Data are available upon request to the corre-sponding author.
Author contributions. KK designed the research plan. AP and BKanalyzed ice samples and wrote the paper. KO and AT also helpedto prepare the data set of the ice core. SM and TS provided icecore samples and were responsible for field logistics. OS providedsuggestions during the writing process.
Competing interests. The authors declare that they have no conflictof interest.
Acknowledgements. This study was partly supported by the JapanSociety for the Promotion of Science (JSPS) through grant in aid(nos. 19340137 and 24221001) and the Japan Student Services Or-ganization (JASSO). We also acknowledge the support from the In-stitute of Low Temperature Science, Hokkaido University, for theice core program.
Financial support. This research has been supported by the JapanSociety for the Promotion of Science (JSPS) (grant nos. 19340137and 24221001.).
www.atmos-chem-phys.net/20/597/2020/ Atmos. Chem. Phys., 20, 597–612, 2020

610 A. Pokhrel et al.: Ice core records of biomass-burning tracers in the North Pacific Rim
Review statement. This paper was edited by Carlo Barbante and re-viewed by three anonymous referees.
References
Achard, F., Eva, H. D., Mollicone, D., and Beuchleet, R.: The effectof climate anomalies and human ignition factor on wildfires inRussian boreal forests, Phil. Trans., R. Soc., B., 363, 2329e2337,https://doi.org/10.1098/rstb.2007.2203, 2008.
Andreae, M. O. and Merlet, P.: Emission of trace gases and aerosolsfrom biomass burning, Global Biogeochem. Cy., 15, 955–966,2001.
Balzter, H., Gerard, F., Weedon, G., Grey, W., Combal, B.,Bartholome, E., Bartalev, S., and Los, S.: Coupling of vegeta-tion growing season anomalies with hemispheric and regionalscale climate patterns in Central and East Siberia, J. Climate, 20,3713e3729, https://doi.org/10.1175/JCLI4226, 2007.
Davidson, C. I., Jaffrezo, J.-L., Small, M. J., Summers, P. W., Olson,M. P., and Borys, R. D.: Trajectory analysis of source regions in-fluencing the south Greenland ice sheet during the DYE3 gas andaerosol sampling program, Atmos. Environ., 27A, 2739–2749,1993.
Divine, D., Isaksson, E., Martma, T., Meijer, H. A. J., Moore, J.,Pohjola, V., van de Wal, R. S. W., and Godtliebsen, F.: Thousandyears of winter surface air temperature variations in Svalbard andnorthern Norway reconstructed from ice-core data, Polar Res.,30, 7379, https://doi.org/10.3402/polar.v30i0.7379, 2011.
Eichler, A., Brütsch, S., Olivier, S., Papina, T., and Schwikowski,M.: A 750 year ice core record of past biogenic emissionsfrom Siberian boreal forests, Geophys. Res. Lett., 36, L18813,https://doi.org/10.1029/2009GL038807, 2009.
Eichler, A., Willy, T., Brütsch, S., Olivier, S., Papina, T., andSchwikowski, M.: An ice-core based history of Siberian for-est fires since AD 1250, Quaternary Sci. Rev. 30, 1027e1034,https://doi.org/10.1016/j.quascirev.2011.02.007, 2011.
Engling, G., Carrico, C. M., Kreidenweis, S. M., Collett, J. L.,Day, D. E., Malm, W. C., Lincoln, E., Hao, W. M., Iinuma, Y.,and Herrmann, H.: Determination of levoglucosan in biomasscombustion aerosol by high-performance anion-exchange chro-matography with pulsed amperometric detection, Atmos. Envi-ron., 40, 299–311, 2006.
Fraser, M. P. and Lakshmanan, K.: Using levoglucosan as a molec-ular marker for the long-range transport of biomass combustionaerosols, Environ. Sci. Technol., 34, 4560–4564, 2000.
Fu, P. Q., Kawamura, K., Okuzawa, K., Agarwal, S. G., Wang, G.,Kanaya, Y., and Wang, Z.: Organic molecular compositions andtemporal variations of summertime mountain aerosols over Mt.Tai, North China Plain, J. Geophys. Res.-Atmos., 113, D19107,https://doi.org/10.1029/2008JD009900, 2008.
Fu, P. Q., Kawamura, K., Pavuluri, C. M., Swaminathan, T., andChen, J.: Molecular characterization of urban organic aerosolin tropical India: contributions of primary emissions and sec-ondary photooxidation, Atmos. Chem. Phys., 10, 2663–2689,https://doi.org/10.5194/acp-10-2663-2010, 2010.
Fu, P., Kawamura, K., and Miura, K.: Molecular Characteris-tics of Marine Organic Aerosols Collected during a Round-the-World Cruise, J. Geophys. Res.-Atmos., 116, D13302,https://doi.org/10.1029/2011JD015604, 2011.
Gambaro, A., Zangrando, R., Gabrielli, P., Barbante, C., andCescon, P.: Direct Determination of Levoglucosan at thePicogram per Milliliter Level in Antarctic Ice by High-Performance Liquid Chromatography/Electrospray IonizationTriple Quadrupole Mass Spectrometry, Anal. Chem., 805, 1649–1655, 2008.
Gao, S., Liu, D., Kang, S., Kawamura, K., Wu, G., Zhang, G., andCong, Z.: A new isolation method for biomass-burning tracersin snow: measurements of p-hydroxybenzoic, vanillic, and dehy-droabietic acids, Atmos. Environ., 122, 142–147, 2015.
Grieman, M. M., Greaves, J., and Saltzman, E. S.: A method foranalysis of vanillic acid in polar ice cores, Clim. Past, 11, 227–232, https://doi.org/10.5194/cp-11-227-2015, 2015.
Grieman, M. M., Aydin, M., Fritzsche, D., McConnell, J. R., Opel,T., Sigl, M., and Saltzman, E. S.: Aromatic acids in a EurasianArctic ice core: a 2600-year proxy record of biomass burn-ing, Clim. Past, 13, 395–410, https://doi.org/10.5194/cp-13-395-2017, 2017.
Grieman, M. M., Aydin, M., Isaksson, E., Schwikowski, M., andSaltzman, E. S.: Aromatic acids in an Arctic ice core from Sval-bard: a proxy record of biomass burning, Clim. Past, 14, 637–651, https://doi.org/10.5194/cp-14-637-2018, 2018a.
Grieman, M. M., Aydin, M., McConnell, J. R., and Saltzman,E. S.: Burning-derived vanillic acid in an Arctic ice corefrom Tunu, northeastern Greenland, Clim. Past, 14, 1625–1637,https://doi.org/10.5194/cp-14-1625-2018, 2018b.
Hennigan, C. J., Sullivan, A. P., Collett Jr., J. L., and Robinson,A. L.: Levoglucosan stability in biomass burning particles ex-posed to hydroxyl radicals, Geophys. Res. Lett., 37, L09806,https://doi.org/10.1029/2010GL043088, 2010.
Hoffmann, D., Tilgner A., Iinuma, Y., and Herrmann, H.: At-mospheric stability of levoglucosan: a detailed laboratoryand modeling study. Environ. Sci. Technol., 44, 694–699,https://doi.org/10.1021/es902476f, 2010.
Holdsworth, G., Krouse, H. R., and Nosal, M.: Ice core climatesignals from Mount Logan, Yukon AD. 1700–1987, in: Climatesince AD 1500, edited by: Bradley, R.S. and Jones, P. D., Rout-ledge, New Yourk, NY, 483–504, 1992.
Holdsworth, G., Higuchi, K., Zielinski, G. A., Mayewski, P. A.,Wahlen, M., Deck, B., Chylek, P., Johnson, B., and Damiano, P.:Historical biomass burning: Late 19th century pioneer agricul-ture revolution in northern hemisphere ice core data and its at-mospheric interpretation, J. Geophys. Res., 101, 317–323, 1996.
Isaev, A. S., Korovin, G. N., Bartalev, S. A., Ershow, D.V., and Janetos, A.: Using remote sensing to assess Rus-sian forest fire carbon emissions, Clim. Change, 55, 235e249,https://doi.org/10.1023/A:1020221123884, 2002.
Ivanova, G. A., Ivanov, V. A., Kukavskaya, E. A., and Soja, A. J.:The frequency of forest fires in Scots pine stands of Tuva, Rus-sia, Environ. Res. Lett., 5, 015002, https://doi.org/10.1088/1748-9326/5/1/015002, 2010.
Jordan, T. B., Seen, A. J., and Jacobsen, G. E.: Levoglucosan as anatmospheric tracer for wood smoke, Atmos. Environ., 40, 5316–5321, 2006.
Kaplan, Y., Wake, C. P., Kreutz, K. J., and Whitlow, S. I.: A 1000-yr record of forest fire activity from Eclipse Icefield, Yukon,Canada, The Holocene, 16, 200–209, 2006.
Kaufmann, P., Fundel, F., Fischer, H., Bigler, M., Ruth, U., Udisti,R., Hansson, M., De Angelis, M., Barbante, C., Wolff, E. W.,
Atmos. Chem. Phys., 20, 597–612, 2020 www.atmos-chem-phys.net/20/597/2020/

A. Pokhrel et al.: Ice core records of biomass-burning tracers in the North Pacific Rim 611
Hutterli, M., and Wagenbach, D.: Ammonium and non-sea saltsulfate in the EPICA ice cores as indicator of biological activ-ity in the Southern Ocean, Quaternary Sci. Rev., 29, 313–323,https://doi.org/10.1016/j.quascirev.2009.11.009, 2010.
Kawamura, K., Yokoyama, K., Fujii, Y., and Watanabe, O.: AGreenland ice core record of low molecular weight dicarboxylicacids, ketocarboxylic acids and α-dicarbonyls: A trend from Lit-tle Ice Age to the present (1540 to 1989 A.D.), J. Geophys. Res.,106, 1331–1345, 2001.
Kawamura, K., Izawa, Y., Mochida, M., and Shiraiwa, T.: Icecore records of biomass burning tracers (levoglucosan and de-hydroabietic, vanillic and p-hydroxybenzonic acids) and totalorganic carbon for past 300 years in the Kamchatka Penin-sula, Northeast Asia, Geochim. Cosmochim. Acta., 99, 317–329,https://doi.org/10.1016/j.gca.2012.08.006, 2012.
Kehrwald, N., Zangrando, R., Gabrielli, P., Jaffrezo, J. L., Boutron,C., Barbante, C., and Gambaro, A.: Levoglucosan as a specificmarker of fire events in Greenland snow, Tellus B, 64, 18196,https://doi.org/10.3402/tellusb.v64i0.18196, 2012.
Keywood, M., Kanakidou, M., Stohl, A., Dentener, F., Grassi,G., Meyer, C. P., Torseth, K., Edwards, D., Thompson, A. M.,Lohmann, U., and Burrows, J.: Fire in the Air: Biomass burningimpacts in a changing climate, Crit. Rev. Environ. Sci. Technol,https://doi.org/10.1080/10643389.10642011.10604248, 2011.
Kuo, L. J., Louchouarn, P., and Herbert, B. E.: Influence of combus-tion conditions on yields of solvent-extractable anhydrosugarsand lignin phenols in chars: Implications for characterizations ofbiomass combustion residues, Chemosphere, 85, 797–805, 2011.
Lai, C., Liu, Y., Ma, J., Ma, Q., and He, H.: Degradation ki-netics of levoglucosan initiated by hydroxyl radical under dif-ferent environmental conditions, Atmos. Environ., 91, 32–39,https://doi.org/10.1016/j.atmosenv.2014.03.054, 2014.
Lamarque, J.-F., Bond, T. C., Eyring, V., Granier, C., Heil, A.,Klimont, Z., Lee, D., Liousse, C., Mieville, A., Owen, B.,Schultz, M. G., Shindell, D., Smith, S. J., Stehfest, E., VanAardenne, J., Cooper, O. R., Kainuma, M., Mahowald, N.,McConnell, J. R., Naik, V., Riahi, K., and van Vuuren, D.P.: Historical (1850–2000) gridded anthropogenic and biomassburning emissions of reactive gases and aerosols: methodol-ogy and application, Atmos. Chem. Phys., 10, 7017–7039,https://doi.org/10.5194/acp-10-7017-2010, 2010.
Legrand, M. and De Angelis, M.: Light carboxylic acids in Green-land ice: A record of past forest fires and vegetation emissionsfrom the boreal zone, J. Geophys. Res., 101, 4129–4145, 1996.
Legrand, M. and Mayewski, P. A.: Glaciochemistry of polar icecores: A review, Rev. Geophys., 35, 219–143, 1997.
Legrand, M., De Angelis, M., Staffelbach, T., Neftel, A., and Stauf-fer, B.: Large perturbations of ammonium and organic acids con-tent in the Summit Greenland ice core, fingerprint from forestfires?, Geophys. Res. Lett., 19, 473–475, 1992.
Legrand, M., McConnell, J., Fischer, H., Wolff, E. W., Preunkert,S., Arienzo, M., Chellman, N., Leuenberger, D., Maselli, O.,Place, P., Sigl, M., Schüpbach, S., and Flannigan, M.: Boreal firerecords in Northern Hemisphere ice cores: a review, Clim. Past,12, 2033–2059, https://doi.org/10.5194/cp-12-2033-2016, 2016.
MacDonald, G. M. and Case, R. A.: Variations in the PacificDecadal Oscillation over the past millennium, Geophys. Res.Lett., 32, L08703, https://doi.org/10.1029/2005GL022478, 2005.
Mann, M. E., Zhang, Z., Rutherford, S., Bradley,R., Hughes,M. K., Shindell, D., Ammann, C., Faluvegi, G., and Ni, F.:Global signatures and dynamical origins of the Little Ice Ageand Medieval Climate Anomaly, Science, 326, 1256–1260,https://doi.org/10.1126/science.1177303, 2009.
Mantua, N. J. and Hare, S. R.: The Pacific Decadal Oscillation, J.Oceanogr., 58, 35–44, 2002.
Mantua, N. J., Hare, S. R., Zhang, Y., Wallace, J. M., and Francis,R. C.: A Pacific interdecadal climate oscillation with impacts onsalmon production, Am. Meteorol. Soc., 78, 1069–1079, 1997.
Marlon, J. R., Bartlein, P. J., Carcaillet, C., Gavin, D. G., Har-rison, S. P., Higuera, P. E., Joos, F., Power, M. J., and Pren-tice, I. C.: Climate and human influences on global biomassburning over the past two millennia, Nat. Geosci., 1, 697–702,https://doi.org/10.1038/ngeo313, 2008.
McConnell, J. R., Edwards, P. R., Kok, G. L., Flanner, M. G., Zen-der, C. S., Saltzman, E. S., Banta, J. R., Pasteris, D. R., Carter,M. M., and Kahl, J. D. W.: 20th Century industrial black carbonemissions altered Arctic climate forcing, Science, 317, 1381–1384, https://doi.org/10.1126/science.1144856, 2007.
Meehl, G. A., Hu, A., Arblaster, J. M., Fasullo, J., and Trenberth, K.E.: Externally Forced and Internally Generated Decadal ClimateVariability Associated with the Interdecadal Pacific Oscillation,J. Climate, 26, 7298–7310, https://doi.org/10.1175/JCLI-D-12-00548.1, 2013.
Meehl, A. G., Hu, A., and Santer, D. B.: The mid-1970s cCli-mate shift in the Pacific and the relative roles of forcedversus inherent decadal variability, J. Climate, 22, 780–792,https://doi.org/10.1175/2008JCLI2552.1, 2008.
Müller-Tautges, C., Eichler, A., Schwikowski, M., Pezzatti, G. B.,Conedera, M., and Hoffmann, T.: Historic records of organiccompounds from a high Alpine glacier: influences of biomassburning, anthropogenic emissions, and dust transport, Atmos.Chem. Phys., 16, 1029–1043, https://doi.org/10.5194/acp-16-1029-2016, 2016.
Olivier, S., Blaser, C., Brütsch, S., Frolova, N., Gäggeler, H. W.,Henderson, K. A., Palmer, A. S., Papina, T., and Schwikowski,M.: Temporal variations of mineral dust, biogenic tracers,and anthropogenic species during the past two centuries fromBelukha ice core, Siberian Altai., J. Geophys. Res., 111, D05309,https://doi.org/10.1029/2005JD005830, 2006.
Pokhrel, A.: Studies on ice core records of dicarboxylic acids, ω-oxocarboxylic acids, pyruvic acid, α-dicarbonyls and fatty acidsfrom southern Alaska since 1665 AD: A link to climate changein the Northern Hemisphere, Ph. D thesis, Hokkaido University,HUSCAP 11786, available at: http://hdl.handle.net/2115/59331(last access: 19 November 2019), 2015.
Pokhrel, A., Kawamura, K., Ono, K., Seki, O., Matoba, S., and Shi-raiwa, T.: Ice core profiles of saturated fatty acids (C12:0-C30:0)and oleic acid (C18:1) from southern Alaska since 1734 AD: Alink to climate change in the Northern Hemisphere, Atmos. Env-iron., 100, 201–209, 2015.
Pokhrel, A., Kawamura, K., Ono, K., Seki, O., Matoba, S.,Shiraiwa, T., and Fu, P.: Ice core records of monoterpene-and isoprene-SOA tracers from Aurora Peak in Alaskasince 1660s: Implication for climate change variability inthe North Pacific Rim, Atmos. Environ., 130, 105–112,https://doi.org/10.1016/j.atmosenv.2015.09.063, 2016.
www.atmos-chem-phys.net/20/597/2020/ Atmos. Chem. Phys., 20, 597–612, 2020

612 A. Pokhrel et al.: Ice core records of biomass-burning tracers in the North Pacific Rim
Robock, A.: Surface cooling due to smoke from biomass burning,in: Global biomass burning, edited by: Levine, J. S., MIT press,Cambridge, Mass., 463–476, 1991.
Rubino, M., D’Onofrio, A., Seki, O., and Bendle, J. A.: Ice-corerecords of biomass burning,Anthropocene Rev., 3, 140–162,https://doi.org/10.1177/2053019615605117, 2016.
Savarino, J. and Legrand, M.: High northern latitude forest fires andvegetation emissions over the last millenium inferred from thechemistry of a central Greenland ice core, J. Geophys. Res., 103,8267–8279, 1998.
Shafizadeh, F.: The chemistry of pyrolysis and combustion, Adv.Chem. Ser., 207, 491–529, 1984.
Shen, C., Wang, W. C., Gong, W., and Hao, Z.: A Pacific DecadalOscillation record since 1470 AD reconstructed from proxy dataof summer rainfall over eastern China, Geophy. Res. Lett., 33,L03702, https://doi.org/10.1029/2005GL024804, 2006.
Shi, G., Wang, X. C., Li, Y., Trengove, R., Hu, Z., Mi, M., Li, X.,Yu, J., Hunter, B., and He, T.: Organic tracers from biomass burn-ing in snow from the coast to the ice sheet summit of East Antarc-tica, Atmos. Environ, 201, 231–241, 2019.
Simoneit, B. R. T.: Biomass burning-a review of organic tracers forsmoke from incomplete combustion, Appl. Geochem., 17, 129–162, 2004.
Simoneit, B. R. T. and Elias, V. O.: Detecting organic tracers frombiomass burning in the atmosphere, Mar. Pollut. Bull., 42, 805–810, 2001.
Simoneit, B. R. T., Rogge, W. F., Mazurek, M. A., Standley, L.J., Hildemann, L. M., and Cass, G. R.: Lignin pyrolysis prod-ucts, lignans, and resin acids as specific tracers of plant classesin emissions from biomass combustion, Environ. Sci. Technol.,27, 2533–2541, 1993.
Simoneit, B. R. T., Schauer, J. J., Nolte, C. G., Oros, D. R., Elias, V.O., Fraser, M. P., Rogge, W. F., and Cass, G. R.: Levoglucosan, atracer for cellulose in biomass burning and atmospheric particles,Atmos. Environ., 33, 173–182, 1999.
Trouet, V., Esper, J., Graham, N. E., Baker, A., Scourse, J. D., andFrank, D. C.: Persistent Positive North Atlantic Oscillation modedominated the medieval Climate anomaly, Science, 324, 78–80,https://doi.org/10.1126/science.1166349, 2009.
Tsai, Y. I., Sopajaree, K., Chotruksa, A., Wu, H. C., and Kuo, S.C.: Source indicators of biomass burning associated with in-organic salts and carboxylates in dry season ambient aerosolin Chiang Mai Basin, Thailand, Atmos. Environ., 78, 93–104,https://doi.org/10.1016/j.atmosenv.2012.09.040, 2013.
Tsushima, A.: A study on reconstruction of paleo-environmentalchanges in the northern North Pacific region from an alpineice core, A Doctor’s thesis, Hokkaido University, 78 pp.,https://doi.org/10.14943/doctoral.k11790, 2015.
Tsushima, A., Matoba, S., Shiraiwa, T., Okamoto, S., Sasaki, H.,Solie, D. J., and Yoshikawa, K.: Reconstruction of recent cli-mate change in Alaska from the Aurora Peak ice core, centralAlaska, Clim. Past, 11, 217–226, https://doi.org/10.5194/cp-11-217-2015, 2015.
Verma, S. K., Kawamura, K., Chen, J., Fu, P., and Zhu, C.: Thir-teen years of observations on biomass burning organic tracersover Chichijima Island in the western North Pacific: An outflowregion of Asian aerosols, J. Geophys. Res.-Atmos., 120, 4155–4168, https://doi.org/10.1002/2014JD022224, 2015.
Wallenius, T. H., Pitkänen, A., Kuuluvainen, T., Pennanen, J., andKarttunen, H.: Fire history and forest age distribution of an un-managed Picea abies dominated landscape, Can. J. For. Res., 35,1540e1552, https://doi.org/10.1139/x05-050, 2005.
Whitlow, S., Mayewski, P., Dibb, J., Holdsworth, G., and Twickler,M.: An ice-core-based record of biomass burning in the Arcticand Subarctic, 1750–1980, Tellus, 46, 234–242, 1994.
Wolff, E. W.: Chemical signals of past climate and environmentfrom polar ice cores and firn air, Chem. Soc. Rev., 41, 6247–6258, https://doi.org/10.1039/c2cs35227c, 2012.
Yang, Q., Mayewski, P. A., Whitlow, S., Twickler, M., Morrison,M., Talbot, R., Dibb, J. E., and Linder, E.: Global perspective ofnitrate flux in ice cores, J. Geophys. Res., 100, 5113–5121, 1995.
Yasunari, T. J. and Yamazaki, K.: Origins of air massover an Alaskan glacier and implications for ice corestudies in the North Pacific regions, SOLA, 5, 77–80,https://doi.org/10.2151/sola.2009-020, 2009.
You C and Xu C.: Review of levoglucosan in glacier snow and icestudies: Recent progress and future perspectives, Sci. Total Envi-ron., 616–617, 1533–1539, doi:10.1016/j.scitotenv.2017.10.160,2018.
Zennaro, P., Kehrwald, N., McConnell, J. R., Schüpbach, S.,Maselli, O. J., Marlon, J., Vallelonga, P., Leuenberger, D., Zan-grando, R., Spolaor, A., Borrotti, M., Barbaro, E., Gambaro, A.,and Barbante, C.: Fire in ice: two millennia of boreal forestfire history from the Greenland NEEM ice core, Clim. Past, 10,1905–1924, https://doi.org/10.5194/cp-10-1905-2014, 2014.
Atmos. Chem. Phys., 20, 597–612, 2020 www.atmos-chem-phys.net/20/597/2020/