I Conferencia Nacional de Desenvolvimiento Regional. Financial System and Regional Development /...
32
I CONFERÊNCIA NACIONAL DE DESENVOLVIMENTO REGIONAL MARCO CROCCO LABORATORY OF STUDIES IN MONEY AND SPACE CENTER FOR REGIONAL DEVELOPMENT AND PLANNING - UFMG
-
Upload
eurosocial-ii -
Category
Economy & Finance
-
view
125 -
download
0
Transcript of I Conferencia Nacional de Desenvolvimiento Regional. Financial System and Regional Development /...

I CONFERÊNCIA NACIONAL
DE DESENVOLVIMENTO
REGIONAL MARCO CROCCO
LABORATORY OF STUDIES IN MONEY AND SPACE
CENTER FOR REGIONAL DEVELOPMENT AND PLANNING - UFMG

Main Message
Financial System and Regional Development
It is not a discussion about regional development funds;
Neither a discussion about public banks;
Is a discussion about private financial system and its role on regional
development;

Theories of Regional Development
First Generation Regional Policy
Neoclassical Approach: money are considered as neutral
The Keynesian Approach
Explicitly incorporated the concept of autonomous
investment and effective demand;
The role of money and financial system and understood
based on the theory of loanable funds and/or based on the
horizontalista approach money supply;

Theories of Regional Development
The second and third generations: the focus on competitiveness
A lower role for the state, allowed only to correct market failures;
Emphasis on human capital as a determinant of growth;
Emphasis on competitiveness - measured by international position - as the key to development, implying a focus on innovation, economies of knowledge and mechanisms to facilitate this process: networking, cooperation, contacts face to face, learning regions; Regional Innovation Systems, among others;
Local endogenous development: industrial districts, clusters, delegation of powers to regions
No systematic analysis of the role of monetary and financial system;
Only general indications as part of the national (regional or local) innovation

Monetary Theory for Regional
Development
From the economics side a Seminal contribution of Dow (1996, 1999)
and Chick and Dow (1988):
Capitalists (including banks) don’t only choose between applying in
different assets (financial or industrial circuits) due to uncertainties of the
environment (liquidity preference), but also they choose, by
comparison, in which region they will apply its resources
Liquidity Preference Differentiated across the Space
Determines the willingness to lend (financial system) and / or go into
debt (individuals)

Monetary Theory for Regional
Development
The concept of liquidity preference can be used to increase the understanding of many aspects of the geography of finance, like:
Financial exclusion
The theory of liquidity preference (TLP) of banks can be used to understand both why banks choose to open a branch in a specific region instead of other, and what kind of service should be offered in a specific region;
Financialization
The TLP can help to understand de degree of financialization of a specific region;
Centrality
Resilience
Role of the resilience of regional financial system to the understanding of the resilience of regions;

Empirical Analysis of Brazil

Total Assets / GDP
(Indicator of Financial Deppening)
Regions
0,00
2,00
4,00
6,00
8,00
10,00
12,00
2000 2001 2002 2003 2004 2005 2006 2007 2008 2009 2010
North South Central-West Northeast Southeast
Financial System
Resileience

Liquidity Preference of Banks Branches
Regions
0,000
0,020
0,040
0,060
0,080
0,100
0,120
2000 2001 2002 2003 2004 2005 2006 2007 2008 2009 2010 2011 2012
North South Central-West Northeast Southeast
LPB = Cash Deposits / Supply
of Credit (willingness to
supply credit)
Decrease and
Convergence of
Regional LPB
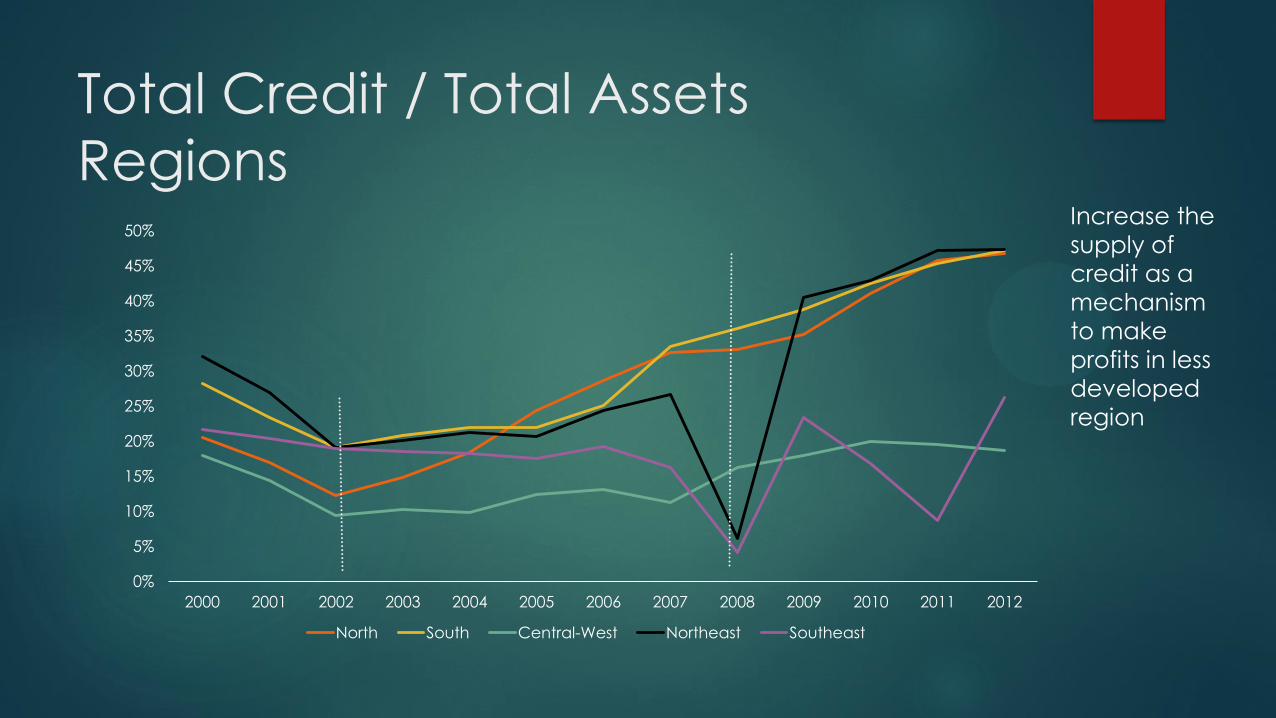
Total Credit / Total Assets
Regions
0%
5%
10%
15%
20%
25%
30%
35%
40%
45%
50%
2000 2001 2002 2003 2004 2005 2006 2007 2008 2009 2010 2011 2012
North South Central-West Northeast Southeast
Increase the
supply of
credit as a
mechanism
to make
profits in less
developed
region

Total Credit by Regions
0,00
200.000,00
400.000,00
600.000,00
800.000,00
1.000.000,00
1.200.000,00
2000 2001 2002 2003 2004 2005 2006 2007 2008 2009 2010 2011 2012
North South Central-West Northeast Southeast

Regional Quotient of Credit
Regions
0,00
0,20
0,40
0,60
0,80
1,00
1,20
1,40
1,60
1,80
2000 2001 2002 2003 2004 2005 2006 2007 2008 2009 2010
North South Central-West Northeast Southeast
Most
developed
regions have a
share in
distribution of
the supply of
credit greater
than their
contribution to
GPD
Futher
regional
disparities

Profits / Assets (Return on Assets
Regions
-5,000
-4,000
-3,000
-2,000
-1,000
0,000
1,000
2,000
3,000
4,000
5,000
2000 2001 2002 2003 2004 2005 2006 2007 2008 2009 2010 2011 2012
North South Central-West Northeast Southeast
After 2005 the less developed regions
become more profitable

ROA and QRC
North Region
-0,500
0,000
0,500
1,000
1,500
2,000
2,500
3,000
3,500
4,000
2000 2001 2002 2003 2004 2005 2006 2007 2008 2009 2010
Profits/ Assts QRC
Little
Functionality
of Financial
System

ROA and QRC
Northeast Region
-1,500
-1,000
-0,500
0,000
0,500
1,000
1,500
2,000
2,500
3,000
3,500
2000 2001 2002 2003 2004 2005 2006 2007 2008 2009 2010
Profits / Assets QRC
Little
Functionality
of Financial
System

ROA and QRC
Southeast Region
-0,600
-0,400
-0,200
0,000
0,200
0,400
0,600
0,800
1,000
1,200
1,400
2000 2001 2002 2003 2004 2005 2006 2007 2008 2009 2010
Profits / Assets QRC

QRC BNDES
Norte e Nordeste

QRC BNDES
Sudeste, Sul e Centro-Oeste

Urban Financial Structure
Supply of Financial Services

Preliminary Conclusions
Financial System (public and private) must be a component in the
analysis of regional development;
Financial crisis shed lights on the regulation of internacional financial
system
The same applies for regulations inside countries;
Take a look on history:
What are the configuration of financial system in cases of succesful
poicies of regional development, as example , third Italy.

Thank You


Anexos

Total Assets / GDP
Degree of Financialization
-
0,500
1,000
1,500
2,000
2,500
3,000
3,500
4,000
4,500
2000 2001 2002 2003 2004 2005 2006 2007 2008 2009 2010
Inexistent Soft Medium Hard

Distribution of Bank Branches
by Degree of Financialization
0,00
10,00
20,00
30,00
40,00
50,00
60,00
2000 2001 2002 2003 2004 2005 2006 2007 2008 2009 2010 2011 2012
Inexistent Soft Medium Hard

Liquidity Preference of Banks Branches
Degree of Financialization
0,000
0,050
0,100
0,150
0,200
0,250
0,300
0,350
2000 2001 2002 2003 2004 2005 2006 2007 2008 2009 2010 2011 2012
Brazil Soft Medium Hard

Total Credit / Total Assets
Degree of Financialization
0%
10%
20%
30%
40%
50%
60%
70%
80%
90%
2000 2001 2002 2003 2004 2005 2006 2007 2008 2009 2010 2011 2012
Brazil Soft Medium Hard

Total Credit by Regions
0,00
200.000,00
400.000,00
600.000,00
800.000,00
1.000.000,00
1.200.000,00
1.400.000,00
2000 2001 2002 2003 2004 2005 2006 2007 2008 2009 2010 2011 2012
Soft Medium Hard

Regional Quotient of Credit
Degree of Financialization
0,0
0,1
0,2
0,3
0,4
0,5
0,6
0,7
1999 2000 2001 2002 2003 2004 2005 2006 2007 2008 2009
Soft Medium Hard
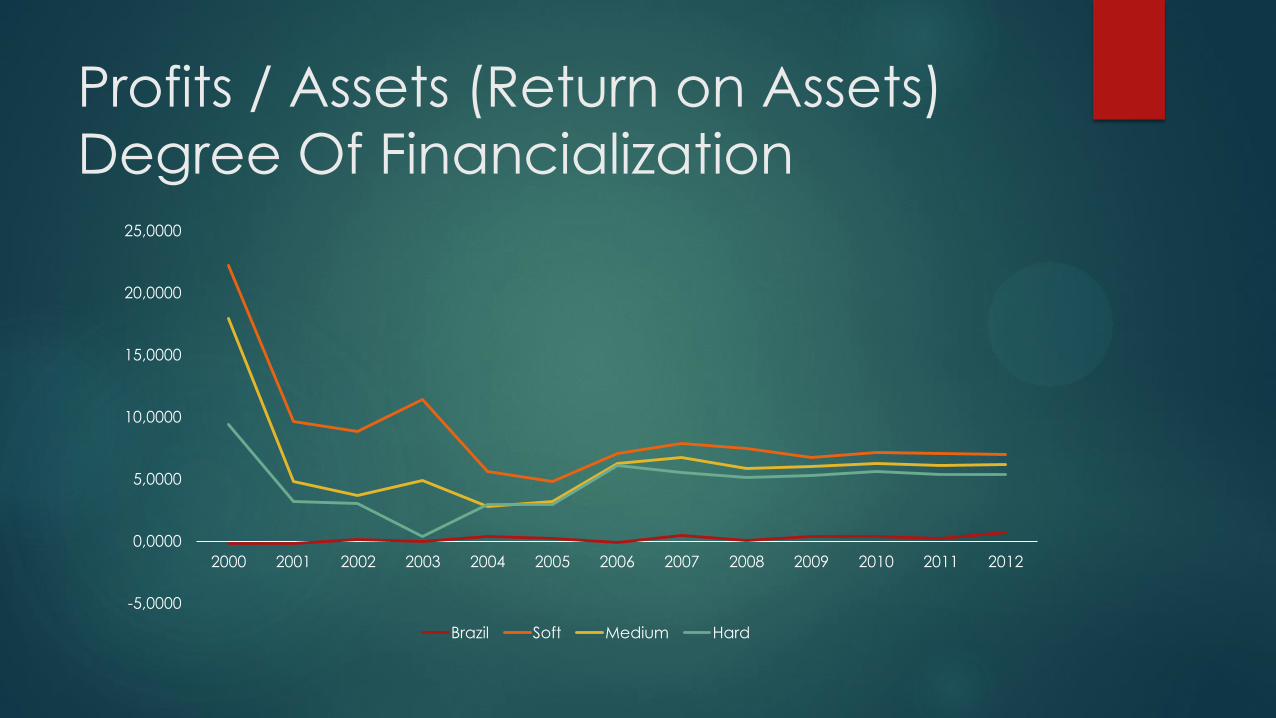
Profits / Assets (Return on Assets)
Degree Of Financialization
-5,0000
0,0000
5,0000
10,0000
15,0000
20,0000
25,0000
2000 2001 2002 2003 2004 2005 2006 2007 2008 2009 2010 2011 2012
Brazil Soft Medium Hard

Regional Distribution of Bank’s
Branches
0,00
10,00
20,00
30,00
40,00
50,00
60,00
2000-2003 2004-2007 2008-2012
Central-West Northeast North Southeast South
Stability of
the
distribution
despite the
financial
crises

Monetary Theory for Regional
Development
Empirical studies
Scarcity of financial data in regional scale;
Due to the short relevance of money to understand the economic
performance of a specific region according to the mainstream theory
(neoclassical);
Brazil is a special case (just a little)
Data of aggregated balance sheet of bank branches by city, monthly since
1988;
Data on employment and type of financial institution by city since 1990;
Make possible to analyse the behaviour of banks and financial system and
their contribution to the understanding of regional disparities ;