Hydra SX40 INDUSTRY - Gilson Eng Manuals/Polysonics/SX30 Rev D .pdf · The Hydra SX30 Dual...
51
Transcript of Hydra SX40 INDUSTRY - Gilson Eng Manuals/Polysonics/SX30 Rev D .pdf · The Hydra SX30 Dual...


Hydra SX40
INDUSTRY APPROVALS
The Polysonics, Hydra SX430 is approved by CSA and CE
NOTICE
Read this manual before working with the product. For personal and systemsafety, and for optimum product performance, make sure you thoroughlyunderstand the contents before installing, using, or maintaining this instru-ment.
For equipment service needs outside the United States, contact your nearestPolysonics representative.
Within the United States, the Polysonics Service Center is your single-pointcontact for all Polysonics equipment service needs. If at any time you are notsure what to do, you have a question about using the product, or you have aservice or support request, call the Center at (281) 879-3700. This contact isyour fastest link to quick and complete answers about any Polysonics productor service.
INSTRUCTION MANUAL
HYDRA SX30PORTABLE DUAL FREQUENCY DOPPLER FLOWMETER
JANUARY 2000REV. D
Polysonics, Inc.10335 Landsbury Dr., Suite 300Houston, TX 77099-3407 USA
Telephone: (281) 879-3700Fax: (281) 498-7721Web: www.polysonics.com
Polysonics, Inc.C

Hydra SX30
Table of Contents1. Guidelines and Checklists .................................................. 1
1.1 Guidelines .......................................................................................... 11.1.1 General Application Guidelines ................................................................... 1
1.2 Checklist ............................................................................................ 11.2.1 Standard Equipment Checklist .................................................................... 1
2. Basic Installation & Operation Procedures ....................... 3
2.1 Install the meter. ................................................................................ 32.1.1 Select an installation location. ..................................................................... 32.1.2 Choose a transducer orientation. ................................................................ 52.1.3 Attach the transducers to the pipe strap. .................................................... 62.1.4 Mount the transducers on the pipe. ............................................................ 7
2.2 Measure flow...................................................................................... 92.2.1 Obtain a flow reading. ................................................................................. 9
3. Hydra SX30 Features Installation and Operation Procedures. .......................... 123.1 Power source procedures. ............................................................. 123.1.1 Recharge the battery. ................................................................................ 123.1.2 Connect an auxiliary DC power source. .................................................... 12
3.2 Screen Contrast............................................................................... 133.2.1 Change the screen contrast. ..................................................................... 13
3.3 Trend ................................................................................................ 133.3.1 View the flow trend. ................................................................................... 133.4.1 Set the totalizer units. ................................................................................ 143.3.2 Change the totalizer multiplier. .................................................................. 143.4.3 Reset the totalizer. ..................................................................................... 14

3.4 Totalizer............................................................................................ 14
3.5 The 4-20 mA Loop ........................................................................... 153.5.2 Range the 4-20 mA loop. .......................................................................... 153.5.3 Calibrate the 4-20 mA loop........................................................................ 17
3.6 Datalogger ....................................................................................... 183.6.1 Set the data logger time and date. ............................................................ 183.6.2 Set up and start the data logger. ............................................................... 193.6.3 Download data from the logger. ............................................................... 213.6.4 Zoom in on data......................................................................................... 223.6.5 Zoom in on a selection of data. ................................................................. 223.6.6 Save the log files. ...................................................................................... 233.6.7 Retrieve a saved file. ................................................................................. 243.6.8 Erase all data in the log files. .................................................................... 25
4. Maintenance ....................................................................... 26
4.1 Flowmeter Maintenance.................................................................. 26
4.3 Upgrade Meter Software ................................................................. 27
5. Troubleshooting................................................................. 28
5.1 Different Modes of Operation......................................................... 28
5.2 Learn Mode Warnings ..................................................................... 28
5.3 Operating Mode Warnings .............................................................. 29
5.4 Service.............................................................................................. 315.4.1 Contacting the Polysonics Service Center ................................................ 315.4.2 Factory Service .......................................................................................... 32

6. Troubleshooting Procedures ............................................ 33
6.1 Check the FFT ................................................................................. 33
6.2 Set the low flow cutoff. ................................................................... 36
6.3 Perform an on-site calibration. ...................................................... 36
6.4 Reset the factory settings. ............................................................. 37
6.5 Set the damping parameter. ........................................................... 37
7. Appendix ............................................................................ 38
7.1 Hydra SX30 Manual Symbol Descriptions .................................... 38
7.2 Pipe ID .............................................................................................. 387.2.1 Obtain the Pipe ID. .................................................................................... 387.2.2 Pipe ID Charts ........................................................................................... 39
7.3 Application Signal Quality and Signal Strength ........................... 42
7.4 Hydra SX30 Meter Specifications .................................................. 43
7.5 Hydra SX 30 menu tree ................................................................... 44


1
1.1.1.1.1. Guidelines and Chec Guidelines and Chec Guidelines and Chec Guidelines and Chec Guidelines and Checklistsklistsklistsklistsklists
1.1 Guidelines1.1 Guidelines1.1 Guidelines1.1 Guidelines1.1 Guidelines
1.1.1 General Application Guidelines
The Hydra SX30 Dual Frequency Doppler (DFD) Portable Flowmeter is suited formeasuring the flow of fluids with undissolved, entrained solids or dispersed gasessuch as:
1.2 Chec1.2 Chec1.2 Chec1.2 Chec1.2 Checklistklistklistklistklist
1.2.1 Standard Equipment Checklist
The following equipment is included with your new Hydra SX30 DFD Flowmeter.
• (1) Hydra SX30 Portable DFD Flowmeter• (1) battery, fully charged• (1) carrying case• (2) non-submersible DFD Transducers• (2) 32 inch pipe straps• (1) 67 inch pipe strap• (1) 120 volt AC battery recharger• (2) 16 foot cables with BNC connectors• (2) 3.5" disk containing HydraLink datalog software• (1) tube of sonic coupling compound• (1) RS232 Cable• (1) 3/8 inch Hex socket driver
Wastewater• primary sludge• activated sludge
Food• dairy• fluidized foods
Industrial• crude oil• dredging

2
A
A
B
CD
EYES
FIGURE 2.1A – RECOMMENDED INSTALLATION LOCATIONS
Do not install the transducers at the following locations:
A – Pipes may not be fullB – Down flowC – Too close to the elbowD – Air collects at the top of horizontal pipeE – Sediment collects at the bottom of horizontal pipe
Conditions existing at these locations can interfere with thetransmission of the ultrasonic wave and yieldinaccurate or unreliable flow readings.

3
2.1.1 Select an installation location.
1. Review Figure 2.1a (Recommended Installation Location), on the facing page.2. Select an installation location using Figure 2.1a and the following guidelines:
• full pipe• flow in the pipe• 5 pipe diameters upstream and 3 pipe diameters downstream from:
- a direction change on the pipe- pipe joints- a narrowing or widening of the pipe
Selecting the proper location to install the transducers is essential to flowmeasurement reliability. Each application is unique and may requirevariations in the installation location.
2.2.2.2.2. Basic Installation & Operation Pr Basic Installation & Operation Pr Basic Installation & Operation Pr Basic Installation & Operation Pr Basic Installation & Operation Proceduresoceduresoceduresoceduresocedures
2.1 Install the meter2.1 Install the meter2.1 Install the meter2.1 Install the meter2.1 Install the meter.....
NOTE
4
39
12
6
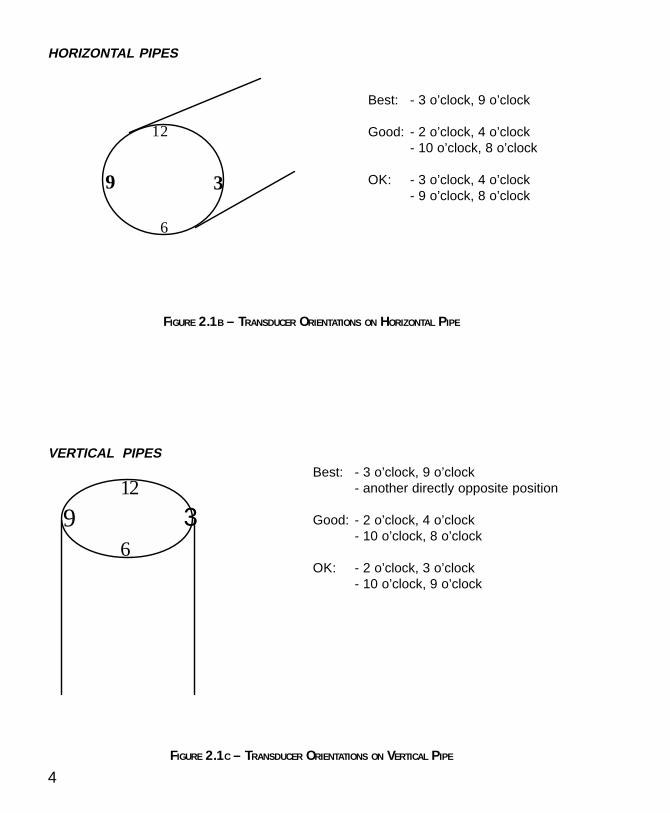
HORIZONTAL PIPES
Best: - 3 o’clock, 9 o’clock
Good: - 2 o’clock, 4 o’clock- 10 o’clock, 8 o’clock
OK: - 3 o’clock, 4 o’clock- 9 o’clock, 8 o’clock
FIGURE 2.1B – TRANSDUCER ORIENTATIONS ON HORIZONTAL PIPE
VERTICAL PIPES
12
396
Best: - 3 o’clock, 9 o’clock- another directly opposite position
Good: - 2 o’clock, 4 o’clock- 10 o’clock, 8 o’clock
OK: - 2 o’clock, 3 o’clock- 10 o’clock, 9 o’clock
FIGURE 2.1C – TRANSDUCER ORIENTATIONS ON VERTICAL PIPE

5
2.1.2 Choose a transducer orientation.
1. Review Figures 2.1b,c (Transducer Orientations on Horizontal and VerticalPipe), on the facing page.
2. Meet the following guidelines to ensure optimum meter performance:
• 3 o’clock and 9’oclock orientation• transducers parallel to one another along the pipe circumference• generous amounts of coupling compound• secure cable connections• tight pipe strap
3. IF your application does not enable you to mount the transducers at therecommended “Best” orientation, THEN choose a “Good” or “OK” transducerorientation OR choose a different location to install the transducers.
Choosing the proper transducer orientation is essential to flowmeasurement reliability. Each application is unique. You may need tovary the orientation with each application, to achieve optimum meterperformance.
NOTE

6
2.1.3 Attach the transducers to the pipe strap.
FIGURE 2.1D – ATTACH TRANSDUCERS TO THE PIPE STRAP
1. See Figure 2.1d - Attach Transducers to the Pipe Strap, below.2. Loosen the mounting screw on each transducer using a screwdriver.3. Slide the lock back on each transducer.4. Place the pipestrap across the mounting.5. Slide the lock back in place.6. Tighten the screw.
4 5
1 2
3

7
2.1.4 Mount the transducers on the pipe.
1. Wrap the pipe strap around the pipe.2. Slide the pipe strap end through the tension nut assembly.3. Pull the strap tight AND clamp the tension nut down to secure the pipe strap to
the pipe.4. Loosen the mounting screw of one transducer.5. Move the transducer at the 3 o’clock position on the pipe. (See Figures 2.1b,c
Transducer Orientations on Horizontal and Vertical Pipe, page 4)6. Tighten the mounting screw to secure the transducer in place.7. Repeat steps 4-6 for the second transducer, now at the 9 o’clock position.8. Remove the pipe strap from the pipe AND generously apply sonic coupling
compound to each transducer surface.9. Put the pipe strap on the pipe, placing the transducers in the proper position.
10. Tighten the tension nut assembly with a 3/8” hex nut driver securing the pipestrap.
Increasing the pipe strap tension improves signal transmission.NOTE

8
FIGURE 2.2B - PIPE ID SCREEN
FIGURE 2.2C - FLOW UNITS SCREEN
FIGURE 2.2A - POLYSONICS HYDRA SX SCREEN

9
2.2 Measure flo2.2 Measure flo2.2 Measure flo2.2 Measure flo2.2 Measure flowwwww
2.2.1 Obtain a flow reading.
1. IF you do not know the pipe ID, THEN go to section 7.2 Pipe ID on page 38.2. Press ON to start the meter.
You are now in Start Up Mode
3. Wait for the Polysonics Hydra SX scren to appear. (See Figure 2.2.a-Hydra SXScreen, facing page)
4. Check the battery life gauge when the Polysonics Hydra SX screen appears(appears for 5 seconds).
5. IF the battery life is less than the anticipated hours of use, THEN seeprocedures 3.1.1-Recharge the battery, OR 3.1.2-Connect an auxiliary DCpower source, on page 12.
6. Wait for the Pipe ID screen to appear. (See Figure 2.2b-Pipe ID Screen, facingpage.)
7. Press SCROLL until the cursor moves to the correct pipe ID units.8. Press ENTER.9. Enter the Pipe ID using the number keys.
10. Press ENTER11. Press the Menu ---> key to the left of Next.12. Wait for the Flow Units screen to appear. (See Figure 2.2c - Flow Units
Screen, facing page)13. Press SCROLL until the cursor moves to the correct volume units.14. Press ENTER.15. Press SCROLL until the cursor moves to the correct time base units.16. Press ENTER.17. Press the Menu ---> key to the left of Next.
Use the BACK-SPACE key, to the right of the number keys, forcorrecting errors when entering numbers.
You must know the pipe internal diameter to ensure reliable flowmeasurements AND there must be flow in the pipe when you start themeter.
NOTE
NOTE

10
FIGURE 2.2D - LEARN MODE SCREEN
FIGURE 2.2E – FLOW SCREEN

11
(procedure 2.2.1 Obtain a flow reading continued.........)
You are now in Learn Mode.
18. Wait for the Learn Mode screen to appear. (See Figure 2.2d - Learn ModeScreen, facing page)
19. Review the diagnostic information that appears in the Learn Mode screen.(appears for 60 seconds)
20. IF any of the following warnings appear:• Invalid Signal, Can’t Learn• No Flow, Can’t Learn• Warning Low S Strength• Warning Poor S StrengthTHEN see section 5.2 (Learn Mode Warning), on page 28.
You are now in Operating Mode
21. Wait for the Flow screen to appear. (See Figure 2.2e - Flow Screen , facingpage)
22. Read the flow.23. IF the flow reading is not accurate, AND you can verify the flow from a
calibrated flowmeter or other certified source, THEN see procedure6.3 - Perform an on-site calibration, on page 36.
24. IF any of the following warnings appear:• Warning• Alarm• Failed/No FlowTHEN see section 5.3 - Operating Mode Warnings, on page 29.
IF you are operating the meter without installing it, THEN press theENTER key four times to bring up the flow screen.NOTE

12
3. Hydra SX30 Features3. Hydra SX30 Features3. Hydra SX30 Features3. Hydra SX30 Features3. Hydra SX30 FeaturesInstallation and Operation PrInstallation and Operation PrInstallation and Operation PrInstallation and Operation PrInstallation and Operation Procedures.ocedures.ocedures.ocedures.ocedures.
3.1 P3.1 P3.1 P3.1 P3.1 Pooooower sourwer sourwer sourwer sourwer source prce prce prce prce procedures.ocedures.ocedures.ocedures.ocedures.
3.1.1 Recharge the battery.
1. IF you need to run the meter at one location for more than 12 hours, THENuse an auxiliary DC power source. (See procedure 3.1.2 Connect an auxiliaryDC power source, below)
2. Plug the power supply cable into the CHARGE socket on the meter face, tothe right of the display window.
3. Charge a depleted battery for 8 hours to fully recharge.
You can recharge the battery while you are operating the meter, evenunder low battery conditions.
Overcharging will degrade the battery. Do not charge the batter for morethan eight hours. The battery is fully charged at the factory.
3.1.2 Connect an auxiliary DC power source.
1. Use a minimum 10.5-volt power supply that supplies 0.25 amps to power theflowmeter.
2. Plug the power supply cable into the appropriate socket on the side of themeter.
The battery will not charge while the meter is operating from an auxiliaryDC power source.
DO NOT use power supplies greater than 18-volts, to avoid damagingthe flometer.
NOTE
NOTE
13
3.2 Screen Contrast3.2 Screen Contrast3.2 Screen Contrast3.2 Screen Contrast3.2 Screen Contrast
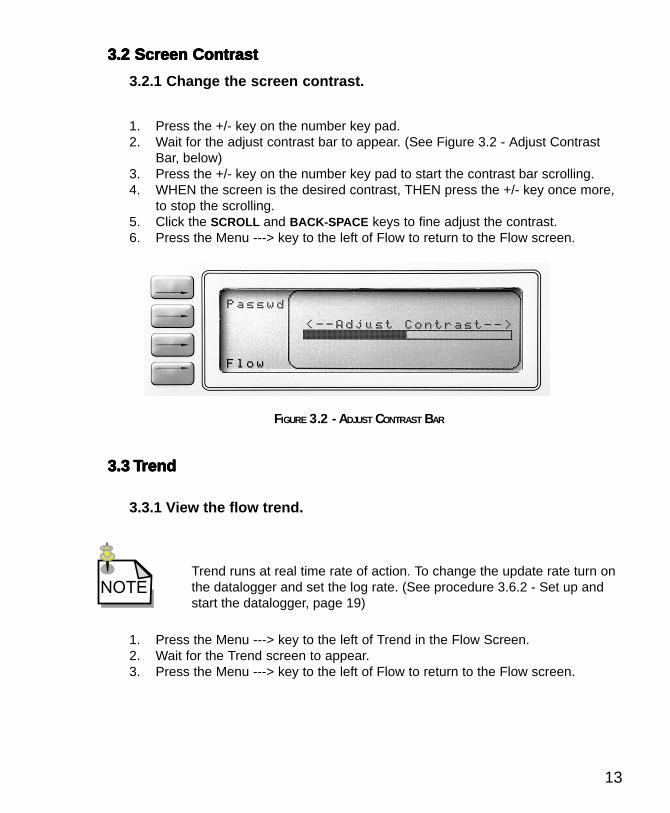
3.2.1 Change the screen contrast.
FIGURE 3.2 - ADJUST CONTRAST BAR
1. Press the +/- key on the number key pad.2. Wait for the adjust contrast bar to appear. (See Figure 3.2 - Adjust Contrast
Bar, below)3. Press the +/- key on the number key pad to start the contrast bar scrolling.4. WHEN the screen is the desired contrast, THEN press the +/- key once more,
to stop the scrolling.5. Click the SCROLL and BACK-SPACE keys to fine adjust the contrast.6. Press the Menu ---> key to the left of Flow to return to the Flow screen.
3.3 3.3 3.3 3.3 3.3 TTTTTrendrendrendrendrend
3.3.1 View the flow trend.
1. Press the Menu ---> key to the left of Trend in the Flow Screen.2. Wait for the Trend screen to appear.3. Press the Menu ---> key to the left of Flow to return to the Flow screen.
Trend runs at real time rate of action. To change the update rate turn onthe datalogger and set the log rate. (See procedure 3.6.2 - Set up andstart the datalogger, page 19)
NOTE

14
3.4.3 Reset the totalizer.
FIGURE 3.4 - TOTALIZER SCREEN
1. Press the Menu ---> key to the left of Diags in the Flow screen.2. Wait for the Limits screen to appear.3. Press the Menu ---> key to the left of Total.4. Wait for the Total screen to appear. (See Figure 3.4 - Totalizer Screen, below)5. Press ENTER twice, to move the cursor to “Reset?”.6. Press the SCROLL key until “Reset?” reads “Yes”.7. Press ENTER.8. Wait while the totalizer resets.9. Press the Menu ---> key to the left of Flow to return to the Flow Screen.
3.4 3.4 3.4 3.4 3.4 TTTTTotalizotalizotalizotalizotalizererererer
3.4.1 Set the totalizer units.
3.3.2 Change the totalizer multiplier.
1. Press the Menu ---> key to the left of Diags in the Flow screen.2. Wait for the Limits screen to appear.3. Press the Menu ---> key to the left of Total.4. Wait for the Total screen to appear. (See Figure 3.4 - Totalizer Screen, below)5. Press SCROLL until the cursor moves to the correct volume units.6. Press ENTER.7. Press the Menu ---> key to the left of Flow to return to the Flow Screen.
1. Press the Menu ---> key to the left of Diags in the Flow screen.2. Wait for the Limits screen to appear.3. Press the Menu ---> key to the left of Total.4. Wait for the Total screen to appear. (See Figure 3.4 - Totalizer Screen, below)5. Press ENTER until the cursor moves to the multiplier box.6. Press SCROLL until the desired multiplier appears in the box.7. Press ENTER, to set the multiplier.8. Press the Menu ---> key to the left of Flow to return to the Flow screen.

15
3.5.1 Range the 4-20 mA loop.
FIGURE 3.5A – 4-20 MA RANGE SCREEN
1. Press the Menu ---> key to the left of 4-20 mA in the Flow screen.2. Wait for the 4-20 mA Range screen to appear. (See Figure 3.5a - 4-20 mA
Range Screen, below)
3. Enter the minimum flow using the number keys.4. Press ENTER.5. Enter the maximum flow using the number keys.6. Press ENTER.7. Press the Menu ---> key to the left of Flow to return to the Flow screen.
Use the BACK-SPACE key, to the right of the number keys, for correctingerrors when entering numbers.
3.5 3.5 3.5 3.5 3.5 The 4-20 mA LoopThe 4-20 mA LoopThe 4-20 mA LoopThe 4-20 mA LoopThe 4-20 mA Loop
NOTE

16
FIGURE 3.5B– CURRENT LOOP
FIGURE 3.5C - 4-20 MA CALIBRATION SCREEN
FIGURE 3.5D - 4-20 MA CALIBRATION TEST SCREEN
Current Loop Terminals
Black Red
+-Remote Device
or Current Meter
+
Battery orPower Supply
-

17
3.5.2 Calibrate the 4-20 mA loop.
1. Set up a calibration current loop. (See Figure 3.5b - Current Loop, facingpage)
2. IF the meter is not on a pipe with flow, THEN press the Menu ---> key to theleft of Next two times, AND press the ENTER key four times to access the Flowscreen.
3. Press the Menu ---> key to the left of 4-20 mA in the Flow Screen.4. Wait for the Range screen to appear. (See Figure 3.5a - 4-20 mA Range
Screen, page 15)5. Press the Menu ---> key to the left of Calib.6. Wait for the Calibration screen to appear. (See Figure 3.5c - 4-20 mA
Calibration Screen, facing page)7. Enter the value, in mA, from the current meter that corresponds to the zero
scale, using the number keys.8. Press ENTER9. Enter the value, in mA, from the current meter that corresponds to the full
scale, using the number keys.10. Press ENTER.11. Wait for the Test screen to appear. (See Figure 3.5d - 4-20 mA Calibration Test
Screen, facing page)12. Press the SCROLL key or the BACK-SPACE key to move the current bar in the
Test screen.13. Verify that the flowmeter follows the changes.14. IF the flowmeter does not follow the changes, THEN press the Menu ---> key
to the left of Calib AND repeat steps 6-13.15. IF the flowmeter follows the changes, THEN press the Menu ---> key to the left
of Flow to return to the Flow screen.
You need a calibrated current meter to perform this procedure. In theloop powered configuration, you will also need a DC power source.
NOTE

18
3.6 Datalog3.6 Datalog3.6 Datalog3.6 Datalog3.6 Dataloggggggererererer
3.6.1 Set the data logger time and date.
1. Press the Menu ---> key to the left of Log in the Flow screen.2. Wait for the Log screen to appear. (See Figure 3.6b - Log Screen, facing page)3. Press the Menu ---> key to the left of Time.4. Wait for the Time screen to appear. (See Figure 3.6a - Time Screen, below)5. Type the correct hour using the number keys.6. Press ENTER.7. Type the correct minutes using the number keys.8. Press ENTER.
9. Type in the day using the number keys.10. Press ENTER.11. Press SCROLL until the correct month appears.12. Press ENTER.13. Type in the correct year using the number keys.14. Press ENTER.15. Press the Menu ---> key to the left of Flow to return to the Flow screen OR Log
to go to the Log screen
FIGURE 3.6A - TIME SCREEN
Use the BACK-SPACE key, to the right of the number keys, to correcterrors when entering numbers.NOTE
19
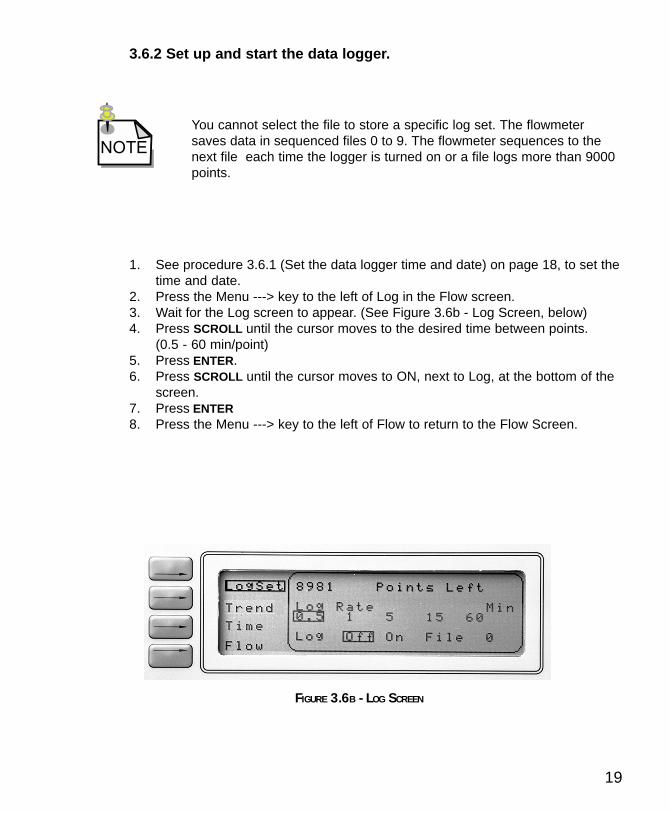
3.6.2 Set up and start the data logger.
1. See procedure 3.6.1 (Set the data logger time and date) on page 18, to set thetime and date.
2. Press the Menu ---> key to the left of Log in the Flow screen.3. Wait for the Log screen to appear. (See Figure 3.6b - Log Screen, below)4. Press SCROLL until the cursor moves to the desired time between points.
(0.5 - 60 min/point)5. Press ENTER.6. Press SCROLL until the cursor moves to ON, next to Log, at the bottom of the
screen.7. Press ENTER8. Press the Menu ---> key to the left of Flow to return to the Flow Screen.
FIGURE 3.6B - LOG SCREEN
You cannot select the file to store a specific log set. The flowmetersaves data in sequenced files 0 to 9. The flowmeter sequences to thenext file each time the logger is turned on or a file logs more than 9000points.
NOTE

20
FIGURE 3.6C- COMM PORT PROPERTIES
FIGURE 3.6D - SELECT LOG FILE

21
3.6.3 Download data from the logger.
1. Connect the communication cable from the flowmeter to the RS232 port onthe computer.
2. Start the HydraLink program.3. Wait for the “Communications Established” window to appear.4. Click on the “OK” button.5. IF the “Communication Established window appears, THEN go the step 11.6. IF the “Communications Failed” window appears, THEN check the security of
the cable, AND make sure the flowmeter is on.7. Click on OK.8. WHEN the CommPort Properties window appears, THEN make sure the
correct comm port number appears in the Port option, AND enter the correctCommPort properties, show in Figure 3.6c - CommPort Properties, on thefacing page.
9. Wait for the “Communication Established” window to appear.10. IF the Communication Established Window still does not appear, THEN
contact your Polysonics representative.11. WHEN the HydraLink window appears, THEN click on the Log File 0 button.
(See Figure 3.6d - Select Log File, facing page)12. Select the log file you want to download.13. Click on the Get Log button in the upper right corner of the HydraLink window.14. Wait for HydraLink to complete downloading.
The following procedure assumes:- HydraLink software is installed- You have basic operating knowledge of computers and Windows
The logger saves data in sequenced files 0 through 9. Once all the filesare full the logger restarts the sequence and overwrites the filesbeginning with log file 0. Perform procedure 3.6.6 (Save the log files), onpage 23, to ensure data is not lost.
NOTE
NOTE

22
FIGURE 3.6E - ZOOM BUTTON
FIGURE 3.6F - DATA ZOOM
3.6.4 Zoom in on data.
3.6.5 Zoom in on a selection of data.
1. Click on the Zoom button. (See Figure 3.6e - Zoom Button, below)2. Press the arrow buttons at the bottom of the data graph to view data.3. Return to the original view by clicking on the Zoom button again.
1. Move the arrow to a point on the screen.2. Depress the mouse button.3. Drag the mouse to enclose a range of data you want to zoom in on. (See
Figure 3.6f - Data Zoom, below)4. Release the mouse button.5. Repeat steps 1-4 until you achieve your desired zoom view.6. Return to the previous view by double clicking on the Zoom button. (See
Figure 3.6e - Zoom Button, below)

23
FIGURE 3.6G SAVE LOG
3.6.6 Save the log files.
1. Perform procedure 3.6.3 (Download data from the logger), on page 21.2. Click on File in the HydraLink window. (See Figure 3.6g - Save Log, below)3. Select “Save Log”.4. Use standard Windows procedures to save the log file on your computer or
floppy disk.
The logger saves data in sequenced files 0 through 9. When all the filesare full the logger restarts the sequence and overwrites the filesbeginning with log file 0.
Saved datalog files are delimited by commas, as it applies to openingthe files into a spread sheet programs.NOTE
NOTE

24
3.6.7 Retrieve a saved file.
FIGURE 3.6H - LOAD LOG
1. Click on File in the HydraLink window. (See Figure 3.6h - Load Log, below)2. Select “Load Log”.3. Use standard Windows procedures to retrieve the log file.
If the meter is not connected to your PC, then click on OK in the“Communications Failed” AND Cancel in the CommPort Properties”windows.
The logger saves data in sequenced files 0 through 9. When all the filesare full the logger restarts the sequence and overwrites the filesbeginning with log file 0.
NOTE
NOTE

25
3.6.8 Erase all data in the log files.
FIGURE 3.6I – ERASE ALL
1. Click on Log in the HydraLink window. (See Figure 3.6i - Erase All, below)2. Select “Erase All” from the pull down menu.3. IF you are sure you want to erase all 10 log files, THEN click on the Yes button
in the Erase All window, AND wait while the logger erases all the files.4. IF you do not want to erase all 10 log files THEN click on the No button in the
Erase All window, AND click on OK in the Erase Aborted Window.
Performing the following procedure erases ALL the log informationstored in the flowmeter. You cannot erase a specific log file.
It is not necessary to create space in log files for new log information byerasing data. The logger saves data in sequenced files 0 through 9.When all the files are full the logger restarts the sequence andoverwrites the files beginning with log file 0. Perform procedure 3.6.6(Save the log files), on page 23to ensure data is not lost.
NOTE

26
4. Maintenance4. Maintenance4. Maintenance4. Maintenance4. Maintenance
4.1 Flo4.1 Flo4.1 Flo4.1 Flo4.1 Flowmeter Maintenancewmeter Maintenancewmeter Maintenancewmeter Maintenancewmeter Maintenance
The Hydra SX30 Portable Flowmeter is easy to maintain. The DFD transducersand flowmeter are factory service only components and maintenance free. Thefollowing Flowmeter Maintenance table describes:
• system components• appropriate maintenance actions• a recommended maintenance schedule
TABLE 4.1 –COMPONENT MAINTENANCE AND SCHEDULE
tnenopmoC ecnanetniaMdednemmoceR netfOwoH
srecudsnarT ! metiecivresasisiht,enon ----
dnuopmocgnilpuoC ! dnuopmoceromdda
:revenehw! sehsinimiddnuopmoc! srecudsnartgninoitisoper! retemgnitacoler
retemwolF ! metiecivresasisiht,enon ----
partsepiP ! nethgit-er ! ylraeyecno
snoitcennocelbaC! eruceserasnoitcennocerusekam! ehtnihtiwpu-dliubeudiserynaevomer
noitcennoc
! s'ytilicafruoyfotrapsaeludehcsecnanetniam

27
4.3 Upgrade Meter Software4.3 Upgrade Meter Software4.3 Upgrade Meter Software4.3 Upgrade Meter Software4.3 Upgrade Meter Software
The most current software is installed in the meter at shipment. Upgrade thesoftware as newer versions become available, using the RS232 port and a remoteterminal. The most current versions of the following software:
• Win Loader - used to upgrade SX30 meter software• SX30 meter software• HydraLink datalogger software,
are available on the Polysonics web-site, at the address below, or contact yourPolysonics Service Representative to inquire about software upgrades.
Polysonics, Inc.Attn: Service Center10335 Landsbury Dr., Suite 300Houston, TX 77099-3407 USA
Telephone: (281) 879-3700Fax: (281) 498-7721Web: www.polysonicsinc.com
28
5.5.5.5.5. TTTTTrrrrroubouboubouboubleshootingleshootingleshootingleshootingleshooting
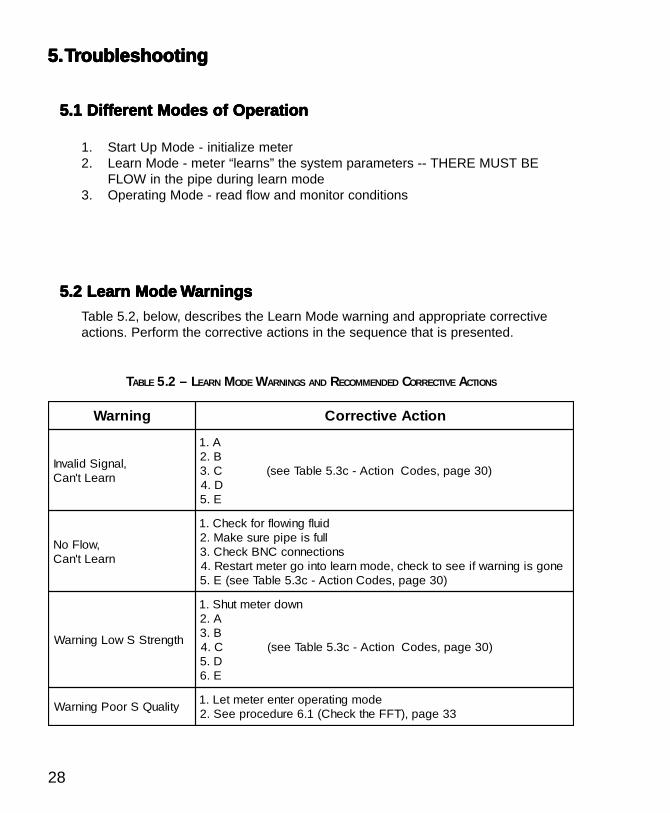
5.1 Diff5.1 Diff5.1 Diff5.1 Diff5.1 Different Modes of Operationerent Modes of Operationerent Modes of Operationerent Modes of Operationerent Modes of Operation
5.2 Learn Mode 5.2 Learn Mode 5.2 Learn Mode 5.2 Learn Mode 5.2 Learn Mode WWWWWarningsarningsarningsarningsarnings
TABLE 5.2 – LEARN MODE WARNINGS AND RECOMMENDED CORRECTIVE ACTIONS
1. Start Up Mode - initialize meter2. Learn Mode - meter “learns” the system parameters -- THERE MUST BE
FLOW in the pipe during learn mode3. Operating Mode - read flow and monitor conditions
Table 5.2, below, describes the Learn Mode warning and appropriate correctiveactions. Perform the corrective actions in the sequence that is presented.
gninraW noitcAevitcerroC
,langiSdilavnInraeLt'naC
A.1B.2
)03egap,sedoCnoitcA-c3.5elbaTees(C.3D.4E.5
,wolFoNnraeLt'naC
diulfgniwolfrofkcehC.1llufsiepiperusekaM.2
snoitcennocCNBkcehC.3enogsigninrawfieesotkcehc,edomnraelotniogretemtratseR.4
)03egap,sedoCnoitcA-c3.5elbaTees(E.5
htgnertSSwoLgninraW
nwodretemtuhS.1A.2B.3
)03egap,sedoCnoitcA-c3.5elbaTees(C.4D.5E.6
ytilauQSrooPgninraWedomgnitareporetneretemteL.1
33egap,)TFFehtkcehC(1.6erudecorpeeS.2

29
5.3 Operating Mode 5.3 Operating Mode 5.3 Operating Mode 5.3 Operating Mode 5.3 Operating Mode WWWWWarningsarningsarningsarningsarnings
TABLE 5.3A – OPERATING MODE WARNINGS AND INDICATED LEVEL OF SEVERITY
In operating mode, the warnings indicate a level of severity and a reason for fault.Table 5.3a (Operating Mode Warnings and Indicated Level of Severity), below,describes:
• operating mode warning messages• the level of severity indicated.
Table 5.3b (Operating Mode Faults & Corrective Actions), on page 30, describes:
• faults that caused the warning• recommended corrective actions.
gninraW ytireveSfoleveL
gninraW ! lanigramsignidaerwolf
mralA ! elbailernusignidaerwolf
wolFoN/deliaF
! wolfdaertonlliwretemeht! sraelctluafehtlitnuwolforezdaeroteunitnoclliwretemeht
.snoitidnocwolf-onrednulamronsigninraw"deliaF"A!ETON.semuserwolfehtnehwrevocerlliwretemehT

30
TABLE 5.3B – OPERATING MODE FAULTS & CORRECTIVE ACTIONS
TABLE 5.3C – ACTION CODES
stluaFsnoitcAevitcerroC
!etoN nihcaerofsnoitcaehtmrofrepnehtraeppastluafehtfoenonahteromfIredro
QPytilauQlangiSrooP
33egap,)TFFkcehC(1.6erudecorpeeS.1)woleb,sedoCnoitcA-c3.5elbaTees(E,D,C,BecneuqesmrofreP.2
SFsutatSlangiSdeliaF
)woleb,sedoCnoitcA-c3.5elbaTees(E,D,C,BecneuqesmrofreP.133egap,)TFFkcehC(1.6erudecorpeeS.2
13egap,)ecivreS(4.5noitceseeS.3
SIlangiSdilavnI
33egap,)TFFkcehC(1.6erudecorpeeS.113egap,)ecivreS(4.5noitceseeS.2
noitcA noitpircseDnoitcA
A
retemffonruT.1dnuopmocgnilpuoceromylppA.2
partsepipnethgiT.3sraelcgninrawfieesretemehttratS.4
B
srecudsnartnoitisopeR.1sesaercnihtgnertslangisfieeS.2
sraelctluaffieeS.3retemehttratseR.4
C
srecudsnartetacoleR.1sesaercnihtgnertslangisfieeS.2
sraelctluaffieeS.3retemehttratseR.4
D
retemffonruT.1ecafrusepipehtdnirgneht,detaocrohguorsiecafrusepipfI.2
srecudsnartehttnuomeR.3sraelcgninrawfieesretemehttratS.4
E13egap,)ecivreS(4.5noitceseeS.1
evitatneserperecivrestcatnoC.2

31
5.4 Ser5.4 Ser5.4 Ser5.4 Ser5.4 Servicevicevicevicevice
To expedite service by helping the service technician to better diagnose theproblem, please have the following information ready before contacting the factory.
1. Signal Strength (%SS - from the bottom of Flow screen)2. Process Temperature3. Transducer Mounting Configuration4. Power Consumption5. Pipe Orientation6. Fluid Type7. Pipe OD and ID8. Pipe Material9. Liner Material
10. Liner Thickness11. Model Number12. Serial Number
Polysonics, Inc.Attn: Service Center10335 Landsbury Dr., Suite 300Houston, TX 77099-3407 USA
Telephone: (281) 879-3700Fax: (281) 498-7721Web: www.polysonicsinc.com
5.4.1 Contacting the Polysonics Service Center

32
(section 5.4 Service continued...........)
5.4.2 Factory Service
If Polysonics determines that the problem cannot be resolved over the phone,return the entire unit to Polysonics.
Contact the Polysonics Service Center before returning an instrument for repair.Mark the RMA number issued by the service representative on the outside ofthe shipping box. The receiving dock will not accept shipments without an RMAnumber.
You must include a letter fully explaining the symptoms of the failure as well asdetails describing the application where the unit was being operated (type of fluid,pipe size, pipe material, fluid velocity, temperature, etc.). Service cannot beadequately performed until the Service Center receives this written information.
To ship an instrument to Polysonics:
1. Ensure that the instrument is well packed (in its original shipping box, ifavailable).
2. Include the letter of explanation.3. Write the RMA number of the outside of the shipping box.4. Send the unit freight-paid to the Service Center:
Polysonics, Inc.Attn: Service Center10335 Landsbury Dr., Suite 300Houston, TX 77099-3407 USA
Telephone: (281) 879-3700Fax: (281) 498-7721Web: www.polysonicsinc.com
33
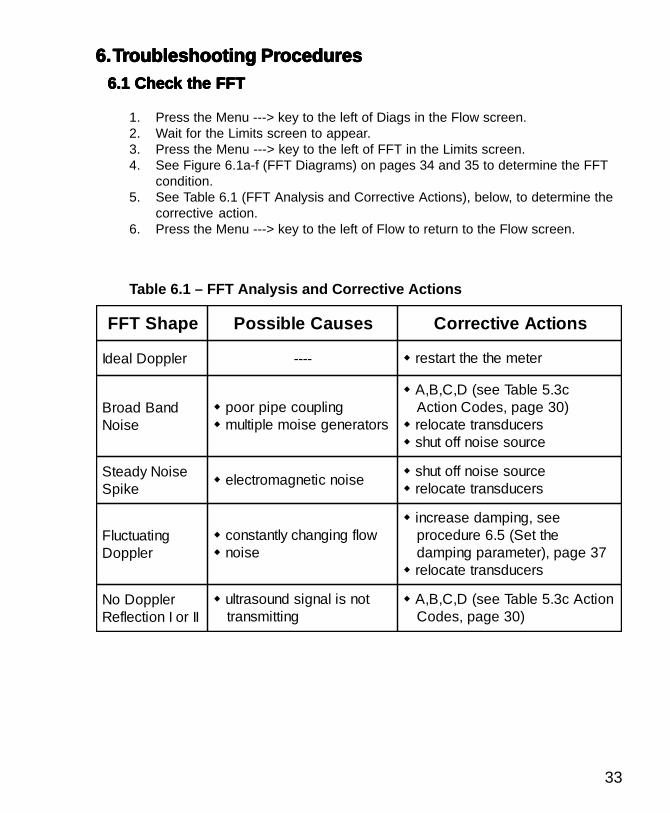
6.6.6.6.6. TTTTTrrrrroubouboubouboubleshooting Prleshooting Prleshooting Prleshooting Prleshooting Proceduresoceduresoceduresoceduresocedures6.1 Chec6.1 Chec6.1 Chec6.1 Chec6.1 Check the FFTk the FFTk the FFTk the FFTk the FFT
Table 6.1 – FFT Analysis and Corrective Actions
1. Press the Menu ---> key to the left of Diags in the Flow screen.2. Wait for the Limits screen to appear.3. Press the Menu ---> key to the left of FFT in the Limits screen.4. See Figure 6.1a-f (FFT Diagrams) on pages 34 and 35 to determine the FFT
condition.5. See Table 6.1 (FFT Analysis and Corrective Actions), below, to determine the
corrective action.6. Press the Menu ---> key to the left of Flow to return to the Flow screen.
epahSTFF sesuaCelbissoP snoitcAevitcerroC
relppoDlaedI ---- ! retemehtehttratser
dnaBdaorBesioN
! gnilpuocepiproop! srotarenegesiomelpitlum
! c3.5elbaTees(D,C,B,A)03egap,sedoCnoitcA
! srecudsnartetacoler! ecruosesionffotuhs
esioNydaetSekipS
! esioncitengamortcele! ecruosesionffotuhs! srecudsnartetacoler
gnitautculFrelppoD
! wolfgnignahcyltnatsnoc! esion
! ees,gnipmadesaercniehtteS(5.6erudecorp
73egap,)retemarapgnipmad! srecudsnartetacoler
relppoDoNIIroInoitcelfeR
! tonsilangisdnuosartlugnittimsnart
! noitcAc3.5elbaTees(D,C,B,A)03egap,sedoC

34
Ideal Doppler shape
Steady noise spike with Doppler
Broad band noise
FIGURES 6.1 A,B,C – FFT DIAGRAMS

35
Fluctuating Doppler profile
No Doppler reflection I
No Doppler reflection II
FIGURES 6.1 D,E,F – FFT DIAGRAMS

36
6.2 Set the lo6.2 Set the lo6.2 Set the lo6.2 Set the lo6.2 Set the low flow flow flow flow flow cutoffw cutoffw cutoffw cutoffw cutoff.....
6.3 P6.3 P6.3 P6.3 P6.3 Perferferferferform an on-site calibration.orm an on-site calibration.orm an on-site calibration.orm an on-site calibration.orm an on-site calibration.
1. Press the Menu ---> key to the left of Diags in the Flow screen.2. Wait for the Limits screen to appear. (See Figure 6.5 - Limits Screen, facing
page)3. Press ENTER until the blinking cursor appears in the Low Flow Cutoff box.4. Enter the rate for low flow using the number keys.5. Press ENTER6. Press the Menu ---> key to the left of Flow to return to the Flow screen.
Determine the flow using another source before performing the followingprocedure.
1. Calculate the site calibration adjustment. (actual flow÷Hydra flow)2. Press the Menu ---> key to the left of Diags in the Flow screen.3. Wait for the Limits screen to appear. (See Figure 6.5 - Limits Screen, facing
page)4. Press ENTER until a cursor appears in the Site Cal box.5. Enter the site calibration adjustment, calculated in step 1.6. Press ENTER7. Press the Menu ---> key to the left of Flow to return to the Flow screen.
NOTE

37
6.5 Set the damping parameter6.5 Set the damping parameter6.5 Set the damping parameter6.5 Set the damping parameter6.5 Set the damping parameter.....
FIGURE 6.5 – LIMITS SCREEN
1. Press the Menu ---> key to the left of Diags in the Flow screen.2. Wait for the Limits screen to appear. (See Figure 6.5 - Limits Screen, below)3. Enter the amount of damping (0-99 units, 1 unit = 15 seconds) using the
number keys.4. Press the Menu ---> key to the left of Flow to return to the Flow screen.
The Smart Filter used by this meter, allows the damping function tosmooth small fluctuations without diminishing the meter’s response tolarge flow changes, even at high damping settings.
6.4 Reset the factor6.4 Reset the factor6.4 Reset the factor6.4 Reset the factor6.4 Reset the factory settings.y settings.y settings.y settings.y settings.
1. Shut off the meter.2. Turn the meter back on.
All of the settings will reset except the 4-20 mA calibration, the pipe IDand the flow units/time baseNOTE
NOTE

38
7. Appendix7. Appendix7. Appendix7. Appendix7. Appendix
7.2 Pipe ID7.2 Pipe ID7.2 Pipe ID7.2 Pipe ID7.2 Pipe ID
7.2.1 Obtain the Pipe ID.
If you do not know the pipe ID, then try to get the Outside Diameter (OD) by one ofthe following methods:
1. Read the pipe Outside Diameter (OD) and schedule on the pipe2. Read the OD and schedule from system drawings3. Measure the pipe circumference using a tape measure, and divide the
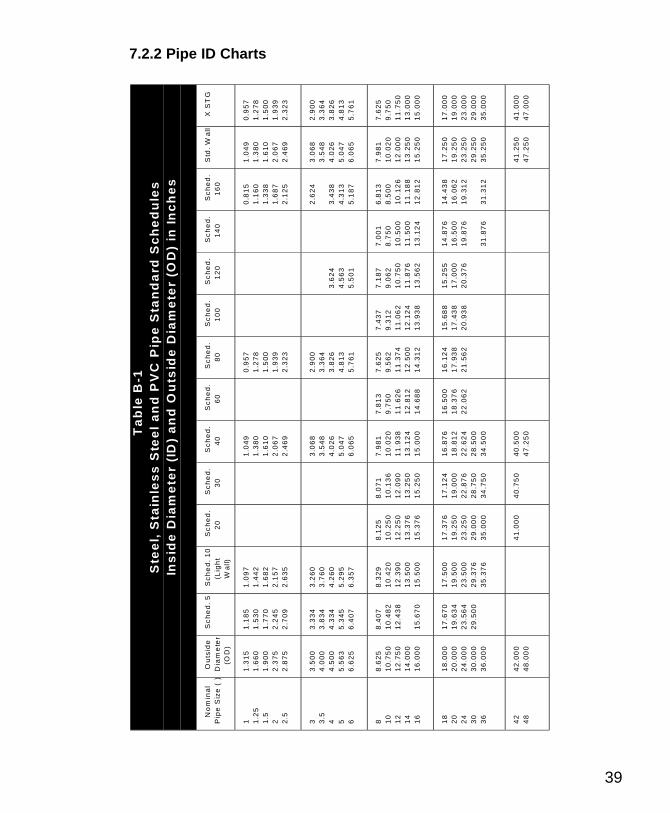
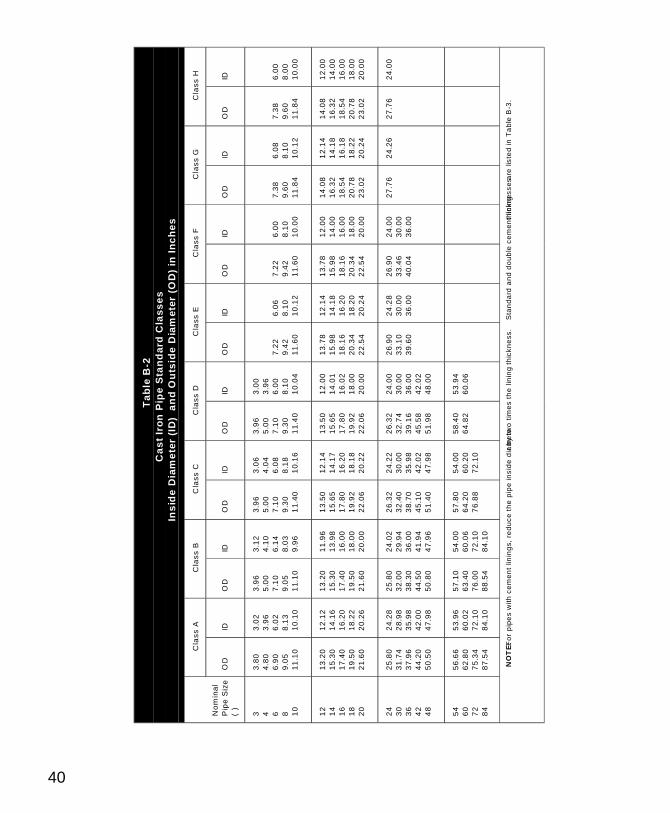
measured circumference by 3.14 (Circumference ÷ 3.14)4. For an approximate pipe ID use the OD with the charts in section 7.2.2 (Pipe
ID Charts), on pages 39-41.5. For a more accurate pipe ID use an ultrasonic pipe thickness gauge (part
#0704/0187, available from Polysonics), AND perform the followingcalculation:
pipe ID = pipe OD – (2 x pipe thickness)
7.1 Hydra SX30 Man7.1 Hydra SX30 Man7.1 Hydra SX30 Man7.1 Hydra SX30 Man7.1 Hydra SX30 Manual Symbol Descriptionsual Symbol Descriptionsual Symbol Descriptionsual Symbol Descriptionsual Symbol Descriptions
lobmyS noitpircseD
etoN noitamrofnisetacidnI:reporpehtroftnatropmisitaht
.tnemurtsniehtfonoitarepo
noituaC noitamrofnisetacidnI:tneverpottnatropmisitaht
.tnemurtsniehtotegamadnoitamrofnilanoitiddaeeS
gninraW setacidnI:ottnatropmisitahtnoitamrofni
rotarepoehtotmrahtneverpehtotegamadro/dna
.tnemurtsniWARNING
NOTE
39
7.2.2 Pipe ID Charts
X S
TG
0.9
57
1.2
78
1.5
00
1.9
39
2.3
23
2.9
00
3.3
64
3.8
26
4.8
13
5.7
61
7.6
25
9.7
50
11
.75
01
3.0
00
15
.00
0
17
.00
01
9.0
00
23
.00
02
9.0
00
35
.00
0
41
.00
04
7.0
00
Std
. W
all
1.0
49
1.3
80
1.6
10
2.0
67
2.4
69
3.0
68
3.5
48
4.0
26
5.0
47
6.0
65
7.9
81
10
.02
01
2.0
00
13
.25
01
5.2
50
17
.25
01
9.2
50
23
.25
02
9.2
50
35
.25
0
41
.25
04
7.2
50
Sc
he
d.
16
0
0.8
15
1.1
60
1.3
38
1.6
87
2.1
25
2.6
24
3.4
38
4.3
13
5.1
87
6.8
13
8.5
00
10
.12
61
1.1
88
12
.81
2
14
.43
81
6.0
62
19
.31
2
31
.31
2
Sc
he
d.
14
0
7.0
01
8.7
50
10
.50
01
1.5
00
13
.12
4
14
.87
61
6.5
00
19
.87
6
31
.87
6
Sc
he
d.
12
0
3.6
24
4.5
63
5.5
01
7.1
87
9.0
62
10
.75
01
1.8
76
13
.56
2
15
.25
51
7.0
00
20
.37
6
Sc
he
d.
10
0
7.4
37
9.3
12
11
.06
21
2.1
24
13
.93
8
15
.68
81
7.4
38
20
.93
8
Sc
he
d.
80
0.9
57
1.2
78
1.5
00
1.9
39
2.3
23
2.9
00
3.3
64
3.8
26
4.8
13
5.7
61
7.6
25
9.5
62
11
.37
41
2.5
00
14
.31
2
16
.12
41
7.9
38
21
.56
2
Sc
he
d.
60
7.8
13
9.7
50
11
.62
61
2.8
12
14
.68
8
16
.50
01
8.3
76
22
.06
2
Sc
he
d.
40
1.0
49
1.3
80
1.6
10
2.0
67
2.4
69
3.0
68
3.5
48
4.0
26
5.0
47
6.0
65
7.9
81
10
.02
01
1.9
38
13
.12
41
5.0
00
16
.87
61
8.8
12
22
.62
42
8.5
00
34
.50
0
40
.50
04
7.2
50
Sc
he
d.
30
8.0
71
10
.13
61
2.0
90
13
.25
01
5.2
50
17
.12
41
9.0
00
22
.87
62
8.7
50
34
.75
0
40
.75
0
Sc
he
d.
20
8.1
25
10
.25
01
2.2
50
13
.37
61
5.3
76
17
.37
61
9.2
50
23
.25
02
9.0
00
35
.00
0
41
.00
0
Sc
he
d.
10
(Lig
ht
Wa
ll)
1.0
97
1.4
42
1.6
82
2.1
57
2.6
35
3.2
60
3.7
60
4.2
60
5.2
95
6.3
57
8.3
29
10
.42
01
2.3
90
13
.50
01
5.5
00
17
.50
01
9.5
00
23
.50
02
9.3
76
35
.37
6
Sc
he
d.
5
1.1
85
1.5
30
1.7
70
2.2
45
2.7
09
3.3
34
3.8
34
4.3
34
5.3
45
6.4
07
8.4
07
10
.48
21
2.4
38
15
.67
0
17
.67
01
9.6
34
23
.56
42
9.5
00
Ou
tsid
eD
iam
ete
r(O
D)
1.3
15
1.6
60
1.9
00
2.3
75
2.8
75
3.5
00
4.0
00
4.5
00
5.5
63
6.6
25
8.6
25
10
.75
01
2.7
50
14
.00
01
6.0
00
18
.00
02
0.0
00
24
.00
03
0.0
00
36
.00
0
42
.00
04
8.0
00
Ta
ble
B-1
Ste
el,
Sta
inle
ss
Ste
el
an
d P
VC
Pip
e S
tan
da
rd S
ch
ed
ule
sIn
sid
e D
iam
ete
r (I
D)
an
d O
uts
ide
Dia
me
ter
(OD
) in
In
ch
es
No
min
al
Pip
e S
ize
()
1 1.2
51
.52 2
.5
3 3.5
4 5 6 8 10
12
14
16
18
20
24
30
36
42
48
40
ID 6.0
08
.00
10
.00
12
.00
14
.00
16
.00
18
.00
20
.00
24
.00
Cla
ss H
OD
7.3
89
.60
11
.84
14
.08
16
.32
18
.54
20
.78
23
.02
27
.76
ID 6.0
88
.10
10
.12
12
.14
14
.18
16
.18
18
.22
20
.24
24
.26
Cla
ss G
OD
7.3
89
.60
11
.84
14
.08
16
.32
18
.54
20
.78
23
.02
27
.76
ID 6.0
08
.10
10
.00
12
.00
14
.00
16
.00
18
.00
20
.00
24
.00
30
.00
36
.00
Cla
ss F
OD
7.2
29
.42
11
.60
13
.78
15
.98
18
.16
20
.34
22
.54
26
.90
33
.46
40
.04
ID 6.0
68
.10
10
.12
12
.14
14
.18
16
.20
18
.20
20
.24
24
.28
30
.00
36
.00
Cla
ss E
OD
7.2
29
.42
11
.60
13
.78
15
.98
18
.16
20
.34
22
.54
26
.90
33
.10
39
.60
ID 3.0
03
.96
6.0
08
.10
10
.04
12
.00
14
.01
16
.02
18
.00
20
.00
24
.00
30
.00
36
.00
42
.02
48
.00
53
.94
60
.06
Cla
ss D
OD
3.9
65
.00
7.1
09
.30
11
.40
13
.50
15
.65
17
.80
19
.92
22
.06
26
.32
32
.74
39
.16
45
.58
51
.98
58
.40
64
.82
ID 3.0
64
.04
6.0
88
.18
10
.16
12
.14
14
.17
16
.20
18
.18
20
.22
24
.22
30
.00
35
.98
42
.02
47
.98
54
.00
60
.20
72
.10
Cla
ss C
OD
3.9
65
.00
7.1
09
.30
11
.40
13
.50
15
.65
17
.80
19
.92
22
.06
26
.32
32
.40
38
.70
45
.10
51
.40
57
.80
64
.20
76
.88
ID 3.1
24
.10
6.1
48
.03
9.9
6
11
.96
13
.98
16
.00
18
.00
20
.00
24
.02
29
.94
36
.00
41
.94
47
.96
54
.00
60
.06
72
.10
84
.10
Cla
ss B
OD
3.9
65
.00
7.1
09
.05
11
.10
13
.20
15
.30
17
.40
19
.50
21
.60
25
.80
32
.00
38
.30
44
.50
50
.80
57
.10
63
.40
76
.00
88
.54
ID 3.0
23
.96
6.0
28
.13
10
.10
12
.12
14
.16
16
.20
18
.22
20
.26
24
.28
28
.98
35
.98
42
.00
47
.98
53
.96
60
.02
72
.10
84
.10
Cla
ss A
OD
3.8
04
.80
6.9
09
.05
11
.10
13
.20
15
.30
17
.40
19
.50
21
.60
25
.80
31
.74
37
.96
44
.20
50
.50
56
.66
62
.80
75
.34
87
.54
Ta
ble
B-2
Ca
st
Iro
n P
ipe
Sta
nd
ard
Cla
sse
sIn
sid
e D
iam
ete
r (I
D)
an
d O
uts
ide
Dia
met
er (
OD
) in
In
ch
es
No
min
al
Pip
e S
ize
()
3 4 6 8 10
12
14
16
18
20
24
30
36
42
48
54
60
72
84
N
OT
E:
F
or
pip
es
with
ce
me
nt
linin
gs,
re
du
ce t
he
pip
e in
sid
e d
iam
ete
r b
y tw
o t
ime
s th
e li
nin
g th
ickn
ess
.
Sta
nd
ard
an
d d
ou
ble
ce
me
nt
linin
g
thic
knes
ses a
re li
ste
d in
Ta
ble
B-3
.

41
Do
ub
leT
hic
kn
es
s
0.2
50
0.3
75
0.5
00
Ce
me
nt
Lin
ing
(S
ee
No
te)
Sta
nd
ard
Th
ick
ne
ss
0.1
25
0.1
87
5
0.2
50
Cla
ss
56
3.1
63
.98
6.0
48
.15
10
.16
12
.22
14
.28
16
.36
18
.44
20
.52
24
.68
30
.74
36
.84
42
.84
48
.94
55
.00
Cla
ss
55
3.2
24
.04
6.1
08
.21
10
.22
12
.28
14
.34
16
.42
18
.50
20
.58
24
.74
30
.82
36
.94
42
.96
49
.08
55
.16
Cla
ss
54
3.2
84
.10
6.1
68
.27
10
.28
12
.34
14
.40
16
.48
18
.56
20
.64
24
.80
30
.90
37
.04
43
.08
49
.22
55
.32
Cla
ss
53
3.3
44
.16
6.2
28
.33
10
.34
12
.40
14
.46
16
.54
18
.62
20
.70
24
.86
30
.98
37
.14
43
.20
49
.36
55
.48
Cla
ss
52
3.4
04
.22
6.2
88
.39
10
.40
12
.46
14
.52
16
.60
18
.68
20
.76
24
.92
31
.06
37
.06
43
.32
49
.50
55
.64
Cla
ss
51
3.4
64
.28
6.3
48
.45
10
.46
12
.52
14
.58
16
.66
18
.74
20
.82
24
.98
31
.14
37
.34
43
.44
49
.64
55
.80
Ins
ide
Dia
me
ter
Cla
ss
50
6.4
08
.51
10
.52
12
.58
14
.64
16
.72
18
.80
20
.88
25
.04
31
.22
37
.44
43
.56
49
.78
55
.96
Ou
tsid
eD
iam
ete
r(O
D)
3.9
64
.80
6.9
09
.05
11
.10
13
.20
15
.30
17
.40
19
.50
21
.60
25
.80
32
.00
38
.30
44
.50
50
.80
57
.10
Ta
ble
B-3
Du
cti
le I
ron
Pip
e S
tan
da
rd C
las
se
sIn
sid
e D
iam
ete
r (I
D)
an
d O
uts
ide
Dia
me
ter
(OD
) in
In
ch
es
No
min
al
Pip
e S
ize
3 4 6 8 10
12
14
16
18
20
24
30
36
42
48
54
No
te:
Fo
r p
ipe
s w
ith c
eme
nt
linin
gs,
re
du
ce t
he
pip
e i
ns
ide
dia
me
ter
by
two
tim
es
th
e li
nin
g t
hic
kne
ss
liste
d a
bo
ve.

42
FIGURE 7.3B – SIGNAL QUALITY/SIGNAL STRENGTH CHART
Failure – the meter is not reading flowAdequate – minimum quality, flow readings may be inconsistent or inaccurateGood – flow readings are fairly accurate and consistentExcellent – flow readings are accurate and consistent
To improve signal quality and signal strength see Table 5.3c (Action Codes), onpage 30.
7.3 Application Signal Quality and Signal Strength7.3 Application Signal Quality and Signal Strength7.3 Application Signal Quality and Signal Strength7.3 Application Signal Quality and Signal Strength7.3 Application Signal Quality and Signal Strength
Signal quality and signal strength are indicators of how well suited an application isto a Doppler flowmeter. To determine the quality of your application:
1. Look at the bottom right corner of the Flow screen.2. Note the SQ number and the %SS number.3. Refer to Figure 7.3b - Signal Quality/Signal Strength Chart, below, to
determine the quality of your application.
Adequate
0.25 2.5 10
Good
Excellent
2.5
3.5
5
Failure
Signal Strength (%SS)
Sign
al Q
ualit
y (S
Q)

43
7.4 Hydra SX30 Meter Specifications7.4 Hydra SX30 Meter Specifications7.4 Hydra SX30 Meter Specifications7.4 Hydra SX30 Meter Specifications7.4 Hydra SX30 Meter Specifications
Ph
ysic
alS
pec
ific
atio
ns
erusolcnE.enelyporpylopremylopoclarutcurtstcapmihgiH
J0514-C-LIM.foorpnoisorrocdnathgitretaW
srecudsnarTelbisrembus-nonrofelbatiuseraelbacdnaerusolcnE
.ecivres
thgieW yrettabruoh-21htiw)gk9.4(sbl11yletamixorppA
egnaRwolF )SPM7.9ot60.0(SPF23ot2.0
ycaruccA snoitidnocdellortnocrednuwolffo%2-/+
eziSepiP" mumixam)m5(ni002" muminim)mm31(ni5.0
Fu
nct
ion
alS
pec
ific
atio
ns
Per
form
ance
Sp
ecif
icat
ion
s
stuptuO " derewopflesropool,detalosiyllacitpoVk5,stib21,)smho001otni(Am02-4" rotcennoc52BDgnisuecafretnilaires232SR
ylppuSrewoP
:ylppusegatlovtupniregrahC" lacipytpma1@tlov51" mumixampma2" ehtfo%01-/+deecxeottonregrahcotsnoitautculfegatlovylppussniam
egatlovylppuslanimon:egatlovylppusyrailixuA
" lacipytpma2@tlov51" ecruosVLESnaebtsum" repsaecruosVLESnamorfdeilppuseraslanimrettupniyrailixua
HxennA1-0101CEI
dapyeK noitcaelitcathtiwyek-91
yalpsiD thgilkcabhtiwyalpsidDCLcihparg06x042
reggolataD.hcaestniop000,9foselif01nistniopatad000,09
depmatsetad/emitsiataD.slavretnietunim06-5.0nielbammargorP
rettimsnarTegnaRerutarepmeT
" 5 o 04otC o devorppaASC,C" 02- o 06+otC o devorppaASCnon,C
recudsnarTegnaRerutarepmeT
" 052+ot04- o 221+ot04-(F o )C" 053+ot04- o skcolbrecudsnarterutarepmethgihlanoitpognisuF
edutitlA m0002mumixaM
egnaRytidimuH gnisnednocnon,ytidimuhevitaler%99ot0
latnemnorivnEgnitarepOsnoitidnoC
" 2:eergednoitulloP" :yrogetacnoitallatsnI I retemrof II regrahcyrettabrof

44
7.5 Hydra SX 30 men7.5 Hydra SX 30 men7.5 Hydra SX 30 men7.5 Hydra SX 30 men7.5 Hydra SX 30 menu treeu treeu treeu treeu treeP
OLY
SON
ICS
PIPE
ID
FLO
W U
NIT
S/TI
ME
BAS
E
LEA
RN
MO
DE
FLO
W
RAN
GE
CAL
IB
TEST
FLO
W
LIM
ITS
FFT
TOTA
LZ
FLO
W
LOG
TREN
D
TIM
E
FLO
W
SET
UP
DIA
GN
LOG
4-20
MA
5 SE
C
ENT
ER
ENT
ER