1 Guidelines and Checklists - Sechangdownload.sechang.com/pds/48/48_44.pdf · 1. Guidelines and...
44
1 1. Guidelines and Checklists Wastewater Food Industrial · primary sludge · activated sludge · raw sewage · dairy · fluidized foods · slurries · crude oil · dredging · pulp processing 1.1 General Application Guidelines The Hydra SX30 Dual Frequency Doppler (DFD) Portable Flowmeter is suited for measuring the flow of fluids with undissolved, entrained solids or 1.2 Standard Equipment Checklist The following equipment is included with your new Hydra SX30 DFD Flowmeter. · (1) Hydra SX30 Portable DFD Flowmeter · (1) battery, fully charged · (1) carrying case · (2) non-submersible DFD Transducers · (2) 32 inch pipe straps · (1) 67 inch pipe strap · (1) 120 volt AC battery recharger · (2) 16 foot cables with BNC connectors · (2) 3.5" disk of datalog software · (1) tube of sonic coupling compound · (1) RS 232 Cable
Transcript of 1 Guidelines and Checklists - Sechangdownload.sechang.com/pds/48/48_44.pdf · 1. Guidelines and...

1
1. Guidelines and Checklists
Wastewater Food Industrial
· primary sludge
· activated sludge
· raw sewage
· dairy
· fluidized foods
· slurries
· crude oil · dredging
· pulp processing
1.1 General Application Guidelines
The Hydra SX30 Dual Frequency Doppler (DFD) Portable Flowmeter is suited for measuring the flow
of fluids with undissolved, entrained solids or
1.2 Standard Equipment Checklist
The following equipment is included with your new
Hydra SX30 DFD Flowmeter.
· (1) Hydra SX30 Portable DFD Flowmeter · (1) battery, fully charged
· (1) carrying case
· (2) non-submersible DFD Transducers
· (2) 32 inch pipe straps
· (1) 67 inch pipe strap
· (1) 120 volt AC battery recharger · (2) 16 foot cables with BNC connectors
· (2) 3.5" disk of datalog software
· (1) tube of sonic coupling compound
· (1) RS 232 Cable
2
AA
B
CD
EYES
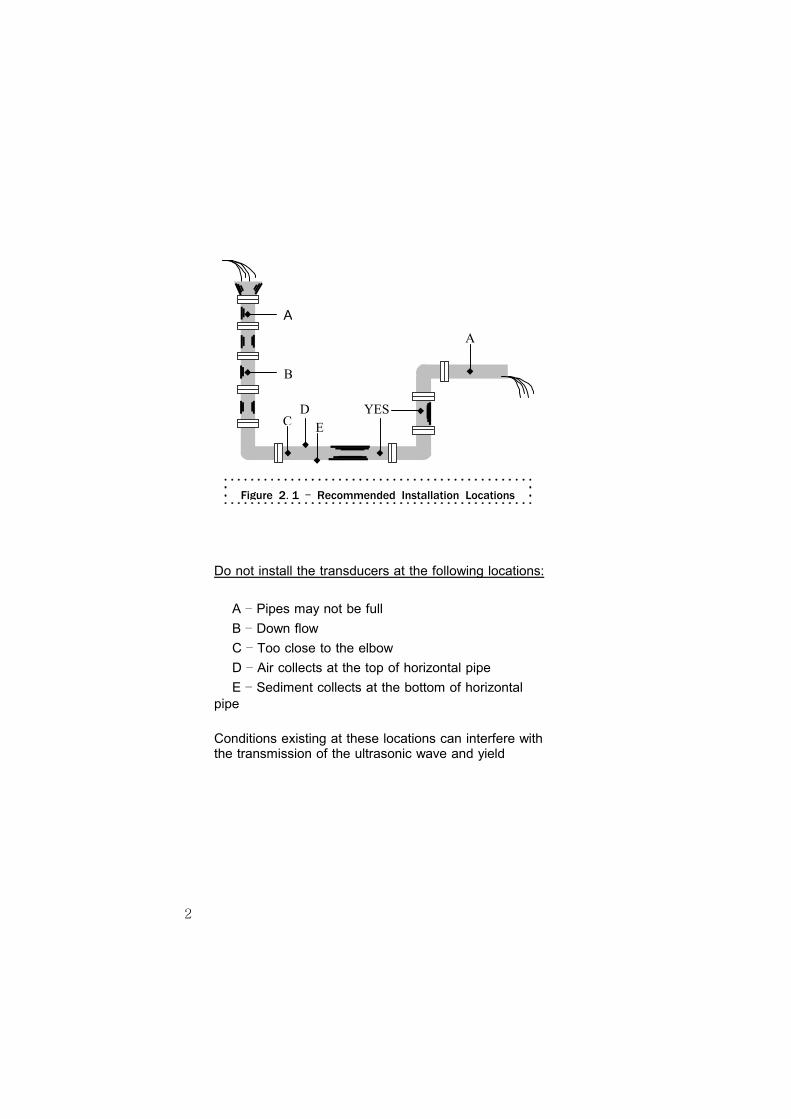
Figure 2.1 – Recommended Installation Locations
Do not install the transducers at the following locations:
A – Pipes may not be full B – Down flow
C – Too close to the elbow
D – Air collects at the top of horizontal pipe
E – Sediment collects at the bottom of horizontal pipe
Conditions existing at these locations can interfere with the transmission of the ultrasonic wave and yield
3
2. Installation and Operation Procedures 2.1 Select an installation location.
1. Review Figure 2.1 (Recommended Installation
Locations), on the facing page.
2. Select an installation location using Figure 2.1
• full pipe • flow in the pipe • 10 pipe diameters upstream and 5 pipe • diameters downstream from: - a direction change on the pipe
- pipe joints
- a narrowing or widening of the pipe
Selecting the proper location to install the transducers is essential to flow measurement reliability. Each application is unique and may require variations in the installation
location.
NOTE
4
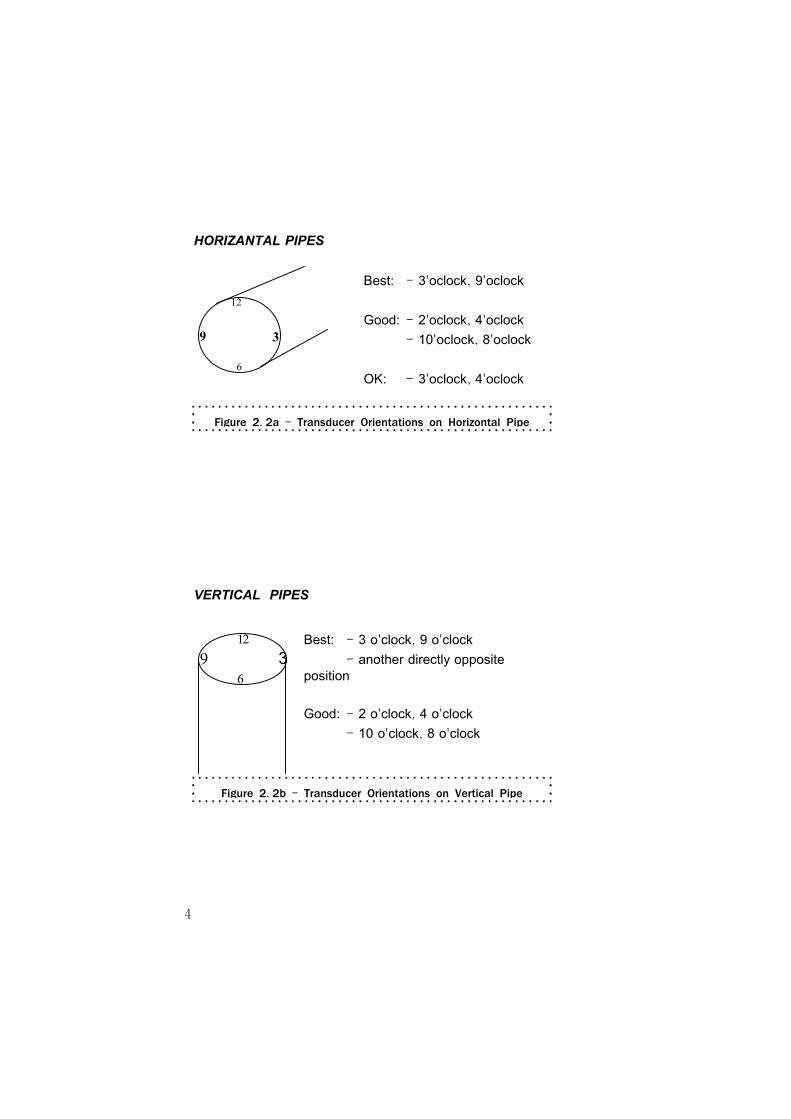
HORIZANTAL PIPES
39
12
6
Best: - 3'oclock, 9'oclock
Good: - 2'oclock, 4'oclock
- 10'oclock, 8'oclock
OK: - 3'oclock, 4'oclock
Figure 2.2a – Transducer Orientations on Horizontal Pipe
1239
6
Best: - 3 o'clock, 9 o'clock
- another directly opposite position
Good: - 2 o'clock, 4 o'clock
- 10 o'clock, 8 o'clock
VERTICAL PIPES
Figure 2.2b – Transducer Orientations on Vertical Pipe

5
2.2 Choose a transducer orientation.
NOTE
Choosing the proper transducer orientation is
essential to flow measurement reliability. Each application is unique. You may need
to vary the orientation with each application,
1. Review Figures 2.2a,b (Transducer Orientations on Horizontal and Vertical Pipe), on the facing page.
2. Meet the following guidelines to ensure optimum meter performance:
· 3'oclock and 9'oclock orientation
· transducers parallel to one another along the pipe circumference
· generous amounts of coupling compound
· secure cable connections
· tight pipe strap
3. IF your application does not enable you to
mount the transducers at the recommended
“Best” orientation, THEN choose a “Good”

6
2.3 Attach the transducers to the pipe strap.
1. See Figure 2.3 (Attach Transducers to the
Pipe Strap), below. 2. Loosen the mounting screw on each
transducer using a screwdriver. 3. Slide the lock back on each transducer. 4. Place the pipe strap across the mounting.
Figure 2.3 – Attach Transducers to the Pipe Strap
4 5
1 2
3
4 5

7
2.4 Mount the transducers on the pipe.
NOTE Increasing the pipe strap tension improves
1. Wrap the pipe strap around the pipe. 2. Slide the pipe strap end through the
tension nut assembly. 3. Pull the strap tight AND clamp the tension
nut down to secure the pipe strap to the
pipe. 4. Loosen the mounting screw of one
transducer. 5. Mount the transducer at the 3'oclock
position on the pipe (See Figures 2.2a,b Transducer Orientations on Horizontal and
Vertical Pipe, page 4). 6. Tighten the mounting screw to secure the
transducer in place.
7. Repeat steps 4 – 6 for the second
transducer, now at the 9'oclock position. 8. Remove the pipe strap from the pipe AND
generously apply sonic coupling compound
to each transducer surface.
9. Re-position the pipe strap on the pipe,

8
POLYSONICS Hydra SX
BATTERY LIFE
1 6 12hrs1 4 8 12hrs
PIPE ID = 0000.00
UNITS: INCHES mm
Pipe ID
Units:
Next
Back
inches mm
PIPE ID = 0000.00
UNITS: INCHES mm
Time Base Flow Units
US gal IMP gal
mgal m^3
ft^3 liter
min sec
day hr
Next
Back
Figure 2.5a - Polysonics Hydra SX Screen
Figure 2.5b - Pipe ID Screen
Figure 2.5c - Flow Units Screen

9
2.5 Obtain a flow reading.
NOTE
You must know the pipe internal diameter to ensure reliable flow measurements AND there must be flow in the pipe when you
1. IF you do not know the pipe ID, THEN go to
section 6.1 Pipe ID on page 34.
2. Press ON to start the meter.
You are now in Start Up Mode
3. Wait for the Polysonics Hydra SX screen to
appear. (See Figure 2.5a-Polysonics Hydra
SX Screen, on facing page). 4. Check the battery life gauge when the
Polysonics screen appears in the meter window (appears for 5 seconds).
5. IF battery life is less than the anticipated
hours of use, THEN see Procedure 2.9
(Recharge the battery) OR Procedure 2.10
(Connect an auxillary DC Power Source) on
NOTE Use the BACK-SPACE key, to the right of the
number keys, for correcting errors when
7. Enter the Pipe ID using the number keys.
8. Press ENTER. 9. Press SCROLL until the cursor moves to the
correct pipe ID units. 10. Press ENTER.
11. Press the Menu à key to the left of Next. 12. Wait for the Flow Units screen to appear. (See
Figure 2.5c-Flow Units Screen, on facing
page.) 13. Press SCROLL until the cursor moves to the
correct volume units.

10
PIPE ID = 0000.00
UNITS: INCHES mm
SETTING RANGE
LEARN 9..8..7.... LEARN MODE COMPLETE
HYDRA Learning Application
Figure 2.5d - Learn Mode Screen
Setup
Diags
Log
4-20mA
259.30 G/min
30029 X10 Gal DIAGNOSTIC MESSAGES WILL APPEAR HERE
LOG* 56% SS 9.1 SQ
Figure 2.5e – Flow Screen
11
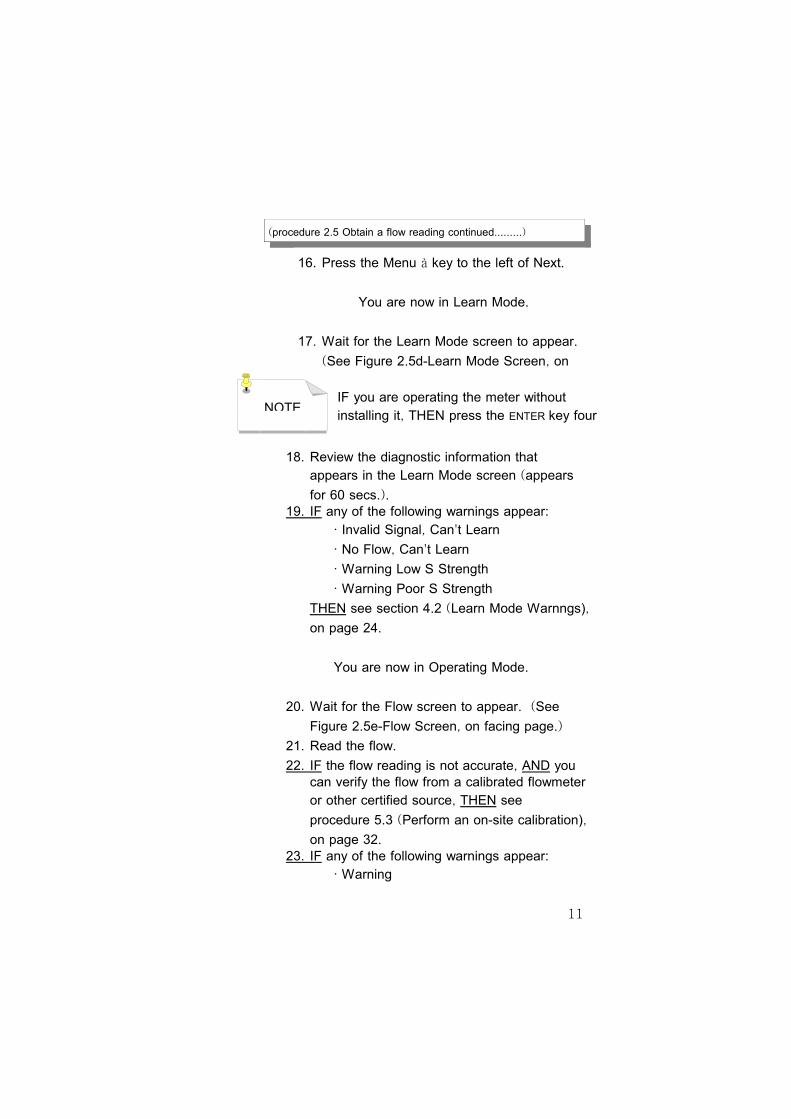
(procedure 2.5 Obtain a flow reading continued.........)
16. Press the Menu à key to the left of Next.
You are now in Learn Mode.
17. Wait for the Learn Mode screen to appear. (See Figure 2.5d-Learn Mode Screen, on
18. Review the diagnostic information that appears in the Learn Mode screen (appears
for 60 secs.). 19. IF any of the following warnings appear:
· Invalid Signal, Can't Learn
· No Flow, Can't Learn
· Warning Low S Strength
· Warning Poor S Strength
THEN see section 4.2 (Learn Mode Warnngs), on page 24.
You are now in Operating Mode.
20. Wait for the Flow screen to appear. (See
Figure 2.5e-Flow Screen, on facing page.)
21. Read the flow.
22. IF the flow reading is not accurate, AND you can verify the flow from a calibrated flowmeter or other certified source, THEN see
procedure 5.3 (Perform an on-site calibration), on page 32.
23. IF any of the following warnings appear: · Warning
NOTE IF you are operating the meter without installing it, THEN press the ENTER key four
12
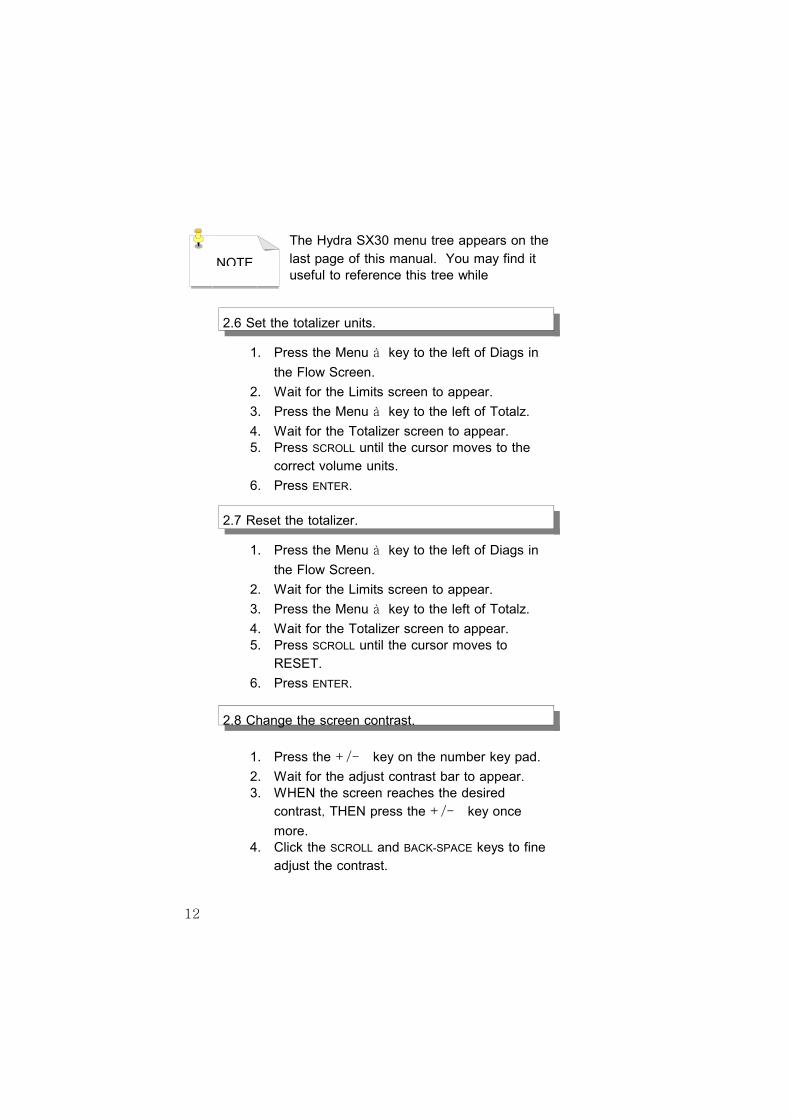
NOTE
The Hydra SX30 menu tree appears on the
last page of this manual. You may find it useful to reference this tree while
2.6 Set the totalizer units.
1. Press the Menu à key to the left of Diags in
the Flow Screen.
2. Wait for the Limits screen to appear. 3. Press the Menu à key to the left of Totalz.
4. Wait for the Totalizer screen to appear. 5. Press SCROLL until the cursor moves to the
correct volume units.
6. Press ENTER.
1. Press the Menu à key to the left of Diags in
the Flow Screen.
2. Wait for the Limits screen to appear. 3. Press the Menu à key to the left of Totalz.
4. Wait for the Totalizer screen to appear. 5. Press SCROLL until a box appears around
RESET.
6. Press ENTER.
7. Press the Menu à key to the left of Flow to
2.7 Reset the totalizer.
1. Press the Menu à key to the left of Diags in
the Flow Screen.
2. Wait for the Limits screen to appear. 3. Press the Menu à key to the left of Totalz.
4. Wait for the Totalizer screen to appear. 5. Press SCROLL until the cursor moves to
RESET.
6. Press ENTER.
2.8 Change the screen contrast.
1. Press the +/- key on the number key pad.
2. Wait for the adjust contrast bar to appear. 3. WHEN the screen reaches the desired
contrast, THEN press the +/- key once
more. 4. Click the SCROLL and BACK-SPACE keys to fine
adjust the contrast.

13
2.9 Recharge the battery.
1. IF you need to run the meter at one location
for more than 12 hours, THEN use an
auxiliary DC power source. (See procedure
2.10 Connect an auxiliary DC power source,
below.) 2. Plug the power supply cable into the
CHARGE socket on the meter face, to the
right of the display window.
1. Use a minimum 10.5-volt power supply that supplies 0.25 amps to power the flowmeter.
2. Plug the power supply cable into the
appropriate socket on the side of the meter.
NOTE You can recharge the battery while you are
operating the meter, even under low
STOP!
Over charging will degrade the battery. Do not charge the battery for more than eight hours. The battery is fully charged at the
2.10 Connect an auxiliary DC power source.
NOTE The battery will not charge while operating
STOP! DO NOT use power supplies greater than
14
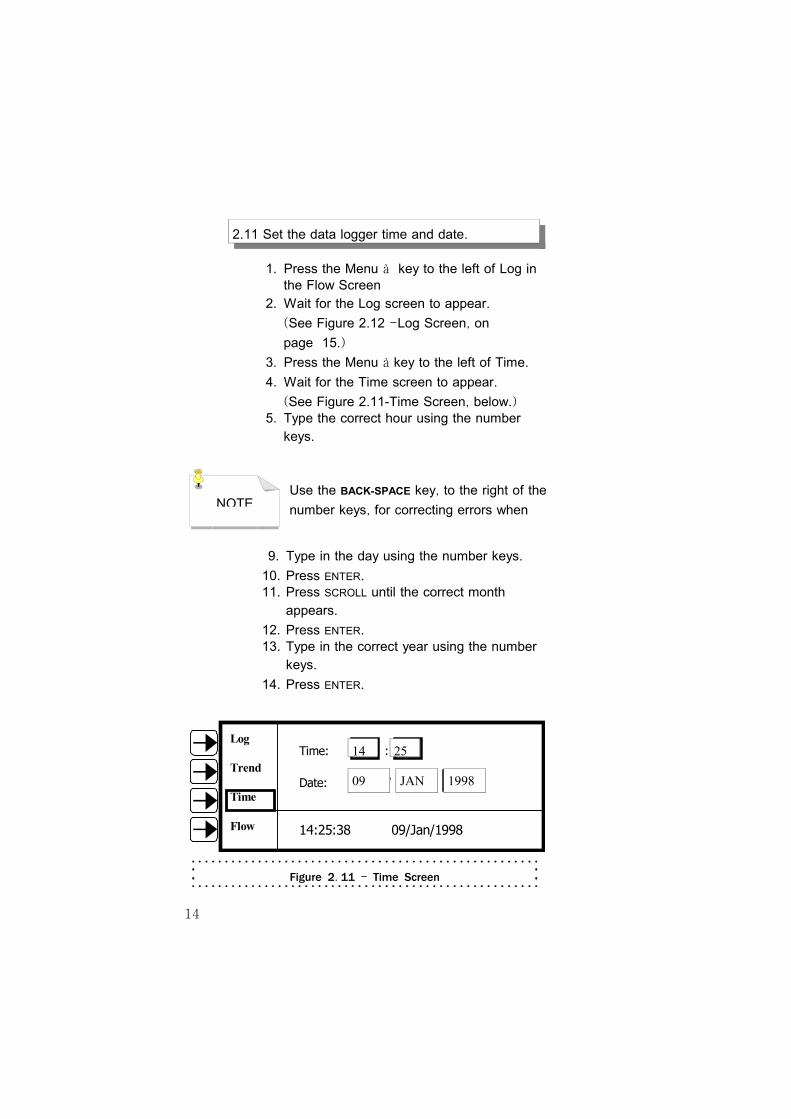
2.11 Set the data logger time and date.
1. Press the Menu à key to the left of Log in the Flow Screen
2. Wait for the Log screen to appear. (See Figure 2.12 -Log Screen, on
page 15.)
3. Press the Menu à key to the left of Time.
4. Wait for the Time screen to appear. (See Figure 2.11-Time Screen, below.)
5. Type the correct hour using the number keys.
NOTE Use the BACK-SPACE key, to the right of the
number keys, for correcting errors when
9. Type in the day using the number keys.
10. Press ENTER. 11. Press SCROLL until the correct month
appears.
12. Press ENTER. 13. Type in the correct year using the number
keys.
14. Press ENTER.
Time: 14 : 25
Date: 09 / JUN / 1998
Log
Trend
Time
Flow 14:25:38 09/Jan/1998
Figure 2.11 – Time Screen
14 25
09 JAN 1998
15
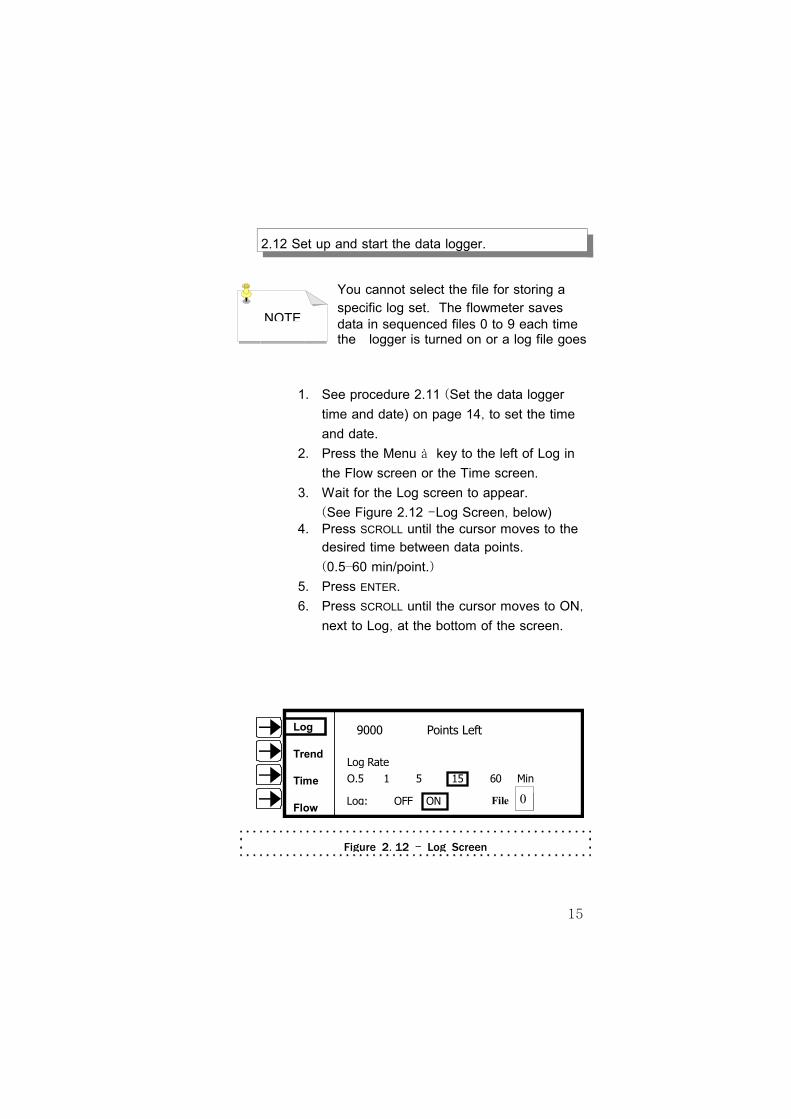
2.12 Set up and start the data logger.
NOTE
You cannot select the file for storing a
specific log set. The flowmeter saves data in sequenced files 0 to 9 each time the logger is turned on or a log file goes
1. See procedure 2.11 (Set the data logger time and date) on page 14, to set the time
and date.
2. Press the Menu à key to the left of Log in
the Flow screen or the Time screen.
3. Wait for the Log screen to appear. (See Figure 2.12 -Log Screen, below)
4. Press SCROLL until the cursor moves to the
desired time between data points.
(0.5–60 min/point.) 5. Press ENTER.
6. Press SCROLL until the cursor moves to ON,
next to Log, at the bottom of the screen.
9000 Points Left
O.5 1 5 15 60 Min
Log: OFF ON
Log Rate
File 0
Log
Trend
Time
Flow
Figure 2.12 – Log Screen
0

16
Figure 2.13a - Comm Port Properties
Figure 2.13b - Select Log File
17
NOTE
The following procedure assumes: - HydraLink software is installed
- you have basic operating
2.13 Download data from the logger.
1. Connect the communication cable from the
flowmeter to the RS 232 port on the computer. 2. Start the HydraLink program.
3. Wait for the "Communications Established"
window to appear. 4. Click on the "OK" button.
5. IF the “Communications Established window
appears, THEN go to step 11.
6. IF the "Communications Failed" window
appears, THEN check the security of the
cable, AND make sure the flowmeter is on.
7. Click on OK. 8. WHEN the CommPort Properties window
appears, THEN make sure the correct comm
port number appears in the Port option, AND
enter the correct CommPort properties,
shown in Figure 2.13a – CommPort Properties, on the facing page.
9. Wait for the "Communication Established"
window to appear. 10. IF the Communication Established Window
still does not appear, THEN contact your Polysonics service representative.
11. WHEN the HydraLink window appears, THEN
NOTE
The logger saves data in sequenced files 0
through 9. When all the files are full the logger restarts the sequence by overwriting
the files beginning with log file 0. Perform
procedure 2.16 (Save the log files), on

18
2.15 Zoom in on a selection of data.
1. Move the arrow to a point on the screen.
2. Depress the mouse button. 3. Drag the mouse to enclose a range of data
you want to zoom in on. (See Figure
2.15a - Data Zoom, below) 4. Release the mouse button. 5. Repeat steps 1-4 until you achieve your
desired zoom view. 6. Return to the previous view by double
Figure 2.15a - Data Zoom
2.14 Zoom in on data.
1. Click on the Zoom button. (See Figure
2.15b - Zoom Button, below.) 2. Press the scroll buttons at the bottom of the
data graph to view data.
Figure 2.15b - Zoom Button

19
1. Perform procedure 2.13 (Download data
from the logger), on page 17.
2. Click on File in the HydraLink window.
(See Figure 2.16 – Save Log, below.)
3. Select “Save Log”.
2.16 Save the log files.
NOTE
The logger saves data in sequenced files 0
through 9. When all the files are full the logger restarts the sequence by overwriting
Figure 2.16 Save Log
20
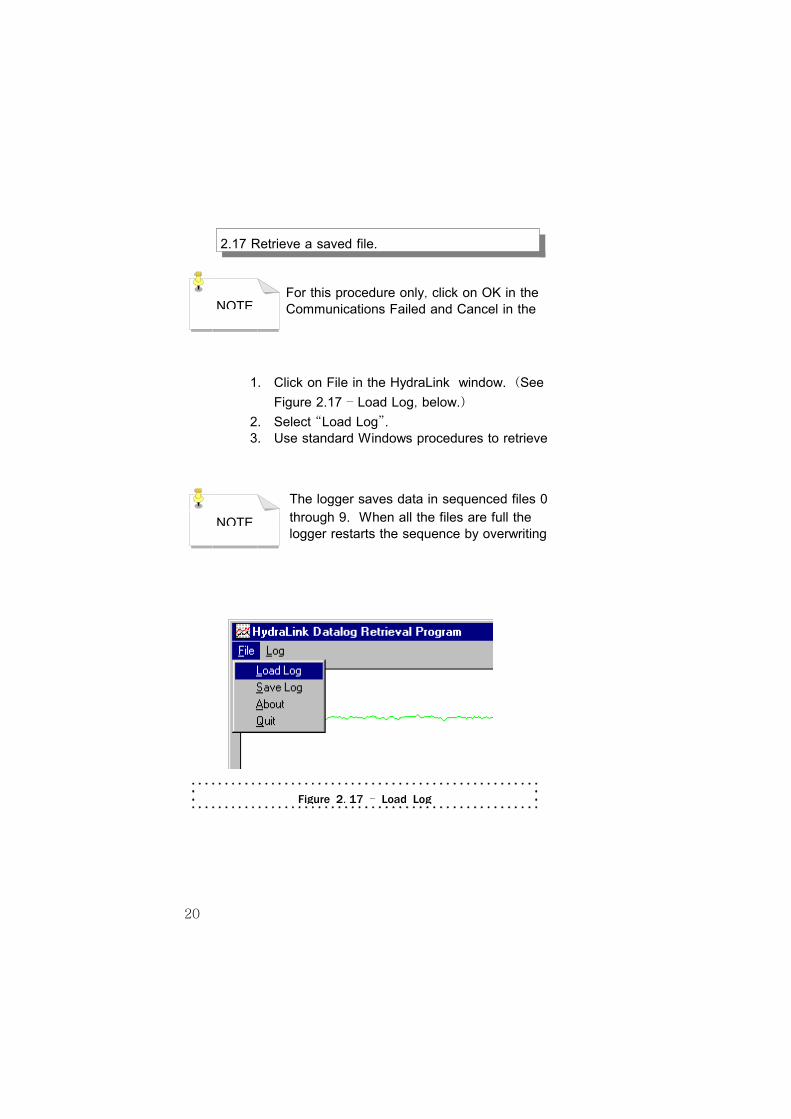
1. Click on File in the HydraLink window. (See
Figure 2.17 – Load Log, below.)
2. Select “Load Log”. 3. Use standard Windows procedures to retrieve
2.17 Retrieve a saved file.
NOTE
The logger saves data in sequenced files 0
through 9. When all the files are full the logger restarts the sequence by overwriting
NOTE For this procedure only, click on OK in the Communications Failed and Cancel in the
Figure 2.17 - Load Log
21
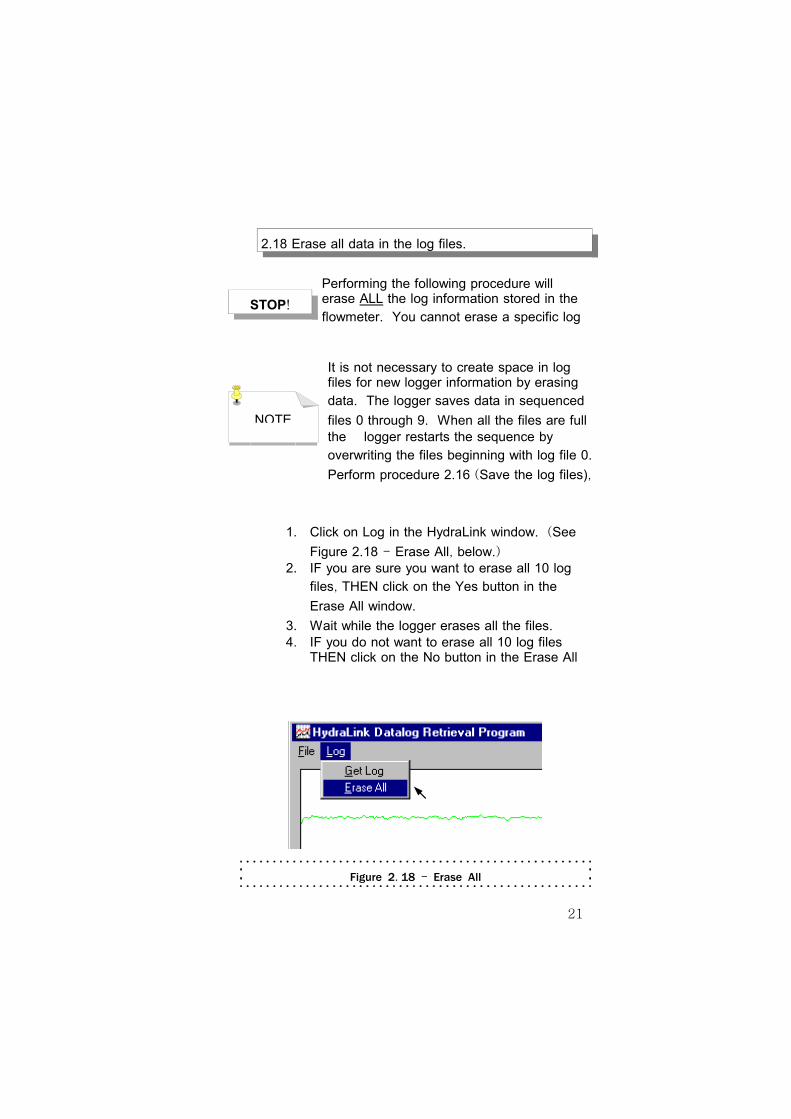
NOTE
It is not necessary to create space in log files for new logger information by erasing
data. The logger saves data in sequenced
files 0 through 9. When all the files are full the logger restarts the sequence by overwriting the files beginning with log file 0.
Perform procedure 2.16 (Save the log files),
2.18 Erase all data in the log files.
STOP!
Performing the following procedure will erase ALL the log information stored in the
flowmeter. You cannot erase a specific log
Figure 2.18 – Erase All
1. Click on Log in the HydraLink window. (See
Figure 2.18 - Erase All, below.) 2. IF you are sure you want to erase all 10 log
files, THEN click on the Yes button in the
Erase All window.
3. Wait while the logger erases all the files. 4. IF you do not want to erase all 10 log files
THEN click on the No button in the Erase All
22
NOTE Use the BACK-SPACE key, to the right of the
number keys, for correcting errors when
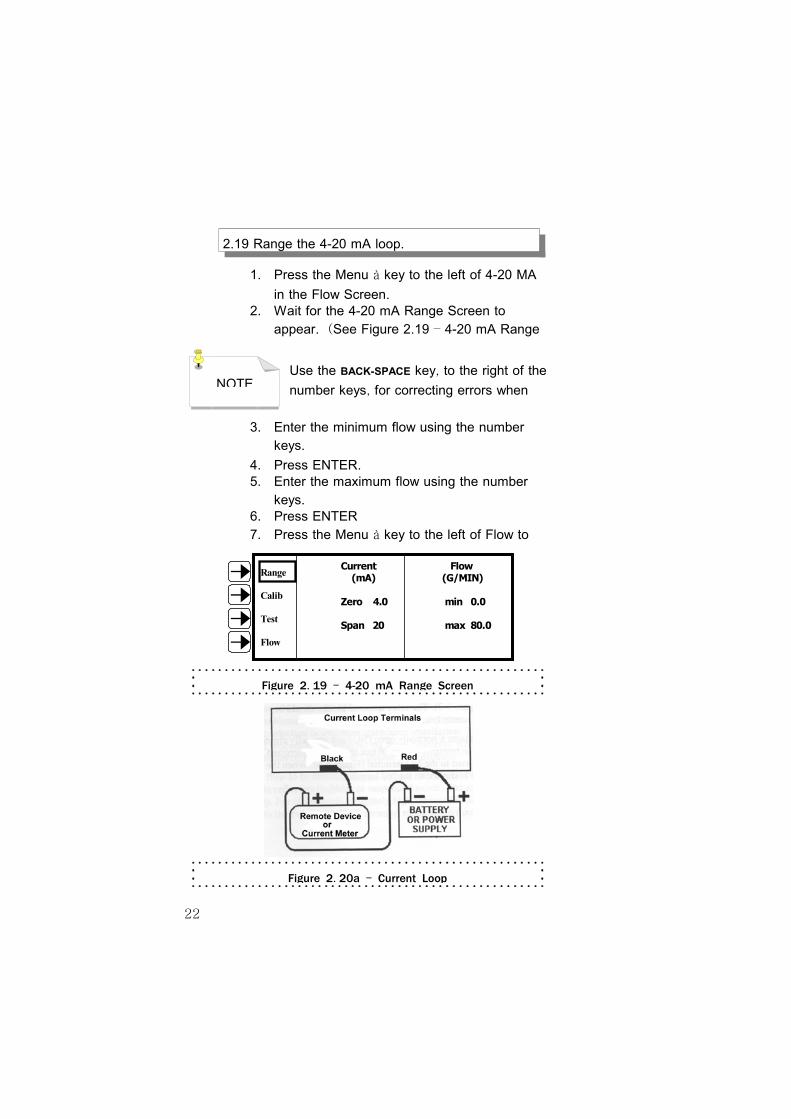
2.19 Range the 4-20 mA loop.
1. Press the Menu à key to the left of 4-20 MA
in the Flow Screen. 2. Wait for the 4-20 mA Range Screen to
appear. (See Figure 2.19 – 4-20 mA Range
3. Enter the minimum flow using the number keys.
4. Press ENTER. 5. Enter the maximum flow using the number
keys. 6. Press ENTER
7. Press the Menu à key to the left of Flow to
Range
Calib
Test
Flow
Current Flow (mA) (G/MIN)
Zero 4.0 min 0.0
Span 20 max 80.0
Figure 2.19 – 4-20 mA Range Screen
Figure 2.20a – Current Loop

23
You need a calibrated current meter and a separate DC power source to perform this
procedure.
2.20 Calibrate the 4-20 mA loop.
NOTE You need a calibrated current meter and a separate power source to perform this
1. Set up a calibration current loop. (See Figure
2.20a- Current Loop, on page 22.)
2. IF the meter is not on a pipe with flow, THEN
press the Menu à key to the left of Next two times, AND press the ENTER key four times to access
the flow screen.
3. Press the Menu à key to the left of 4-20 mA in
the Flow Screen.
4. Wait for the Range screen to appear. (See
Figure 2.19 – 4-20 mA Range Screen, on page
22.)
5. Press the Menu à key to the left of Calib.
6. Wait for the Calibration screen to appear. (See
Figure 2.20b – Calibration Screen, below.)
7. Enter the value, in mA, from the current meter that corresponds to the zero scale, using the
number keys. 8. Press ENTER
9. Enter the value, in mA, from the current meter that corresponds to the full scale, using the
number keys.
R a n ge
C a lib
T est
F low
Ente r M ea sure d C u rre nt
Z e ro S ca le 4 .00 m A
Fu ll S ca le 2 0 .0 0 m A
Figure 2.20b - Calibration Screen
24
3.1 Flowmeter Maintenance
3. Maintenance
The Hydra SX30 Portable Flowmeter is easy to
maintain. The DFD transducers and flowmeter are factory service only components and
maintenance free. The following Flowmeter Maintenance table describes: · system components
· appropriate maintenance actions
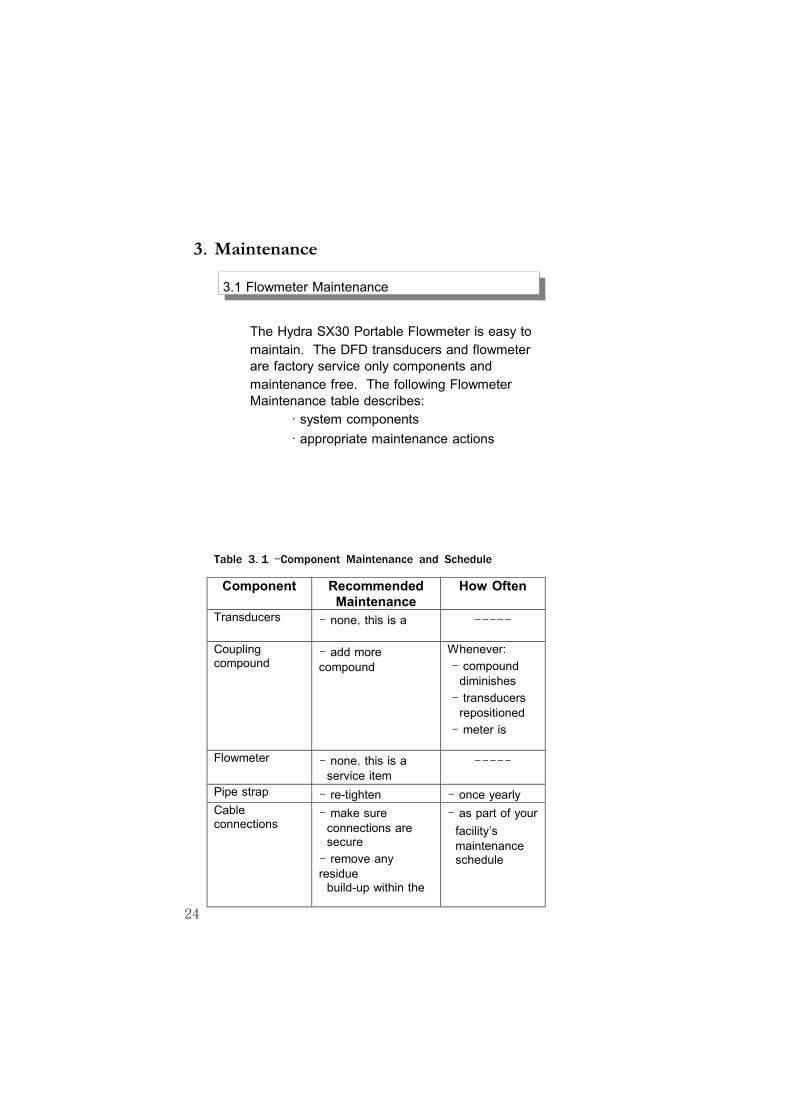
Component Recommended Maintenance
How Often
Transducers - none, this is a -----
Coupling compound
- add more compound
Whenever: - compound diminishes
- transducers repositioned
- meter is
Flowmeter - none, this is a service item
-----
Pipe strap - re-tighten - once yearly Cable connections
- make sure connections are secure
- remove any residue build-up within the
- as part of your facility's maintenance schedule
Table 3.1 –Component Maintenance and Schedule
25
3.2 Upgrade Meter Software
The most current software is installed in the
meter prior to shipment. You can upgrade the
software as newer versions become available,
using the RS232 port and a remote terminal. Contact your local Polysonics Service Representative to inquire about software
upgrades.
Polysonics, Inc. Attn: Service Center 10335 Landsbury Dr., Suite 300
Houston, TX 77099-3407 USA

26
4. Troubleshooting
Warning Corrective Action
Invalid Signal, Can't Learn
1. A
2. B
3. C (see Table 4.3c
No Flow,
Can't Learn
1. Check for flowing fluid
2. Make sure pipe is full 3. Check BNC connections
4. Restart meter go into learn
mode, check to see if warning is gone
Warning Low S Strength
1. Shut meter down
2. A
3. B
4. C (see Table 4.3c
Warning Poor S Quality
1. Let meter enter operating mode
2. See procedure 5.1 (Check the
4.2 Learn Mode Warnings
Table 4.2 below describes the Learn Mode
warnings and the appropriate corrective actions. Perform the corrective actions in the sequence
4.1 Different Modes of Operation
1. Start Up Mode – initialize meter 2. Learn Mode – meter "learns" the system's
parameters - - There MUST BE FLOW in
the pipe during learn mode.
Table 4.2 – Learn Mode Warnings and Recommended
27
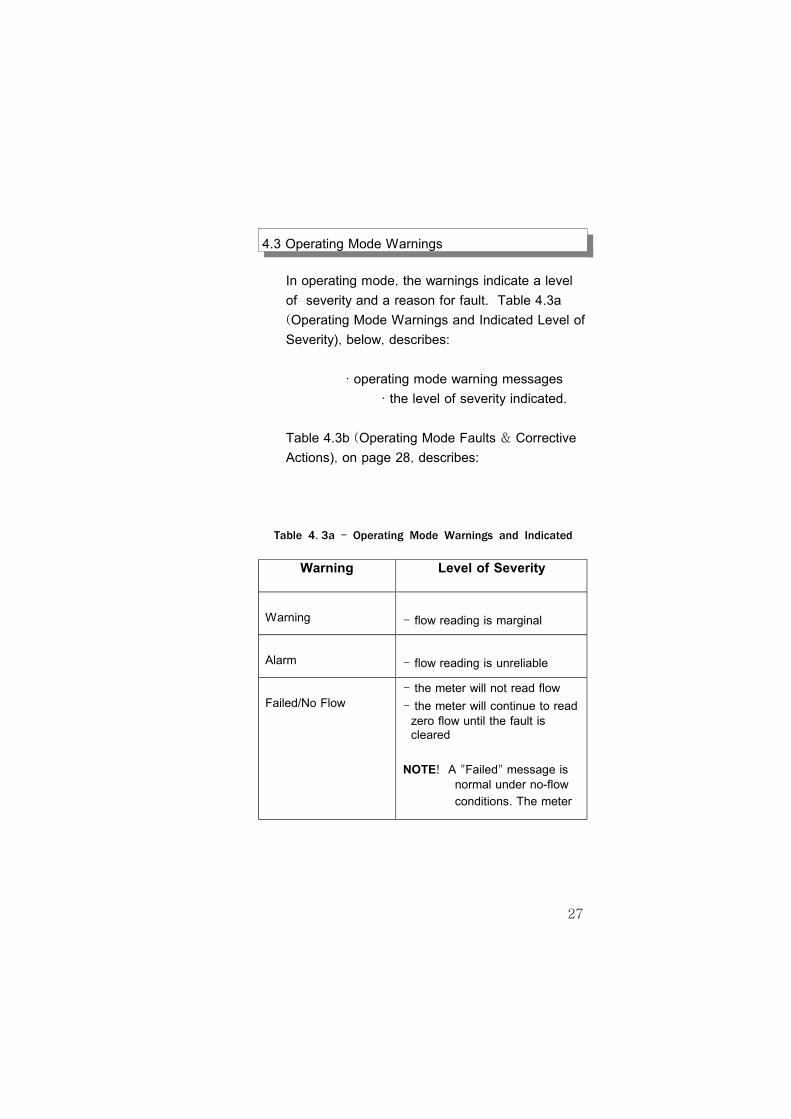
4.3 Operating Mode Warnings
In operating mode, the warnings indicate a level of severity and a reason for fault. Table 4.3a
(Operating Mode Warnings and Indicated Level of Severity), below, describes:
· operating mode warning messages
· the level of severity indicated.
Table 4.3b (Operating Mode Faults & Corrective
Actions), on page 28, describes:
Table 4.3a – Operating Mode Warnings and Indicated
Warning Level of Severity
Warning
- flow reading is marginal
Alarm
- flow reading is unreliable
Failed/No Flow
- the meter will not read flow
- the meter will continue to read zero flow until the fault is cleared
NOTE! A "Failed" message is normal under no-flow
conditions. The meter

28
Table 4.3c – Action Codes
Faults
Corrective Action
Note! If more than one of the faults appear then perform the actions for each in order.
PQ
- Poor Signal Quality
1. See procedure 5.1 (Check the FFT), page 31
2. Perform sequence B,C,D,E
(see Table 4.3c Action Codes,
FS
- Failed Signal Status
1. Perform sequence A,B,C,D
(see Table 4.3c Action Codes, below) 2. See procedure 5.1 (Check the FFT), page 31
IS
- Invalid Signal 1. See procedure 5.1 (Check the FFT), page 31
Action Action Description A 1. Turn off meter
2. Apply more coupling compound
3. Tighten pipe strap
4. Remove and reconnect BNC
B 1. Reposition transducers to another position
2. See if signal strength increases
3. See if fault clears
C 1. Try a new pipe location
2. See if signal strength increases
3. See if fault clears
D 1. Turn off meter 2. If pipe surface is rough or coated, then grind the pipe surface
3. Remount the transducers
E 1. See section 4.4 (Service), page 29
Table 4.3b – Operating Mode Faults & Corrective Actions
29
4.4 Service
4.4.1 Contacting the Polysonics Service Center
To expedite service by helping the service
technician to better diagnose the problem, please have the following information ready before contacting the factory.
1. Signal Strength
%SS - from the bottom of Flow screen
2. Process Temperature
3. Transducer Mounting Configuration
4. Power Consumption
5. Pipe Orientation
6. Fluid Type
7. Pipe OD and ID
8. Pipe Material 9. Liner Material 10. Liner Thickness
11. Model Number 12. Serial Number
Polysonics, Inc. Attn: Service Center 10335 Landsbury Dr., Suite 300
Houston, TX 77099-3407 USA
Telephone: (281) 879-3700
Fax: (281) 498-7721
Web: www.peekmeas.com
30
(section 4.4 Service continued...........)
4.4.2 Factory Service
If Polysonics determines that the problem cannot be resolved over the phone, return the entire unit to Polysonics.
Contact the Polysonics Service Center before
returning an instrument for repair. Mark the RMA number issued by the service representative
on the outside of the shipping box. The receiving dock will not accept shipments without an RMA number. You must include a letter fully explaining the symptoms of the failure as well as details describing the application where the unit was
being operated (type of fluid, pipe size, pipe
material, fluid velocity, temperature, etc.). Service cannot be adequately performed until the
Service Center receives this written information.
To ship an instrument to Polysonics: 1. Ensure that the instrument is well packed
(in its original shipping box, if available). 2. Include the letter of explanation. 3. Write the RMA number of the outside of the
shipping box. 4. Send the unit freight-paid to the Service
Center:
Polysonics, Inc. Attn: Service Center 10335 Landsbury Dr., Suite 300

31
5.1 Check the FFT
5. Troubleshooting Procedures
1. Press the Menu à key to the left of Diags in
the Flow screen.
2. Wait for the Limits screen to appear. 3. Press the Menu à key to the left of FFT in
the Limits screen.
4. See Figures 5.1 a-f (FFT Diagrams), on
pages 32,33 to determine the FFT condition.
5. See Table 5.1 (FFT Analysis and Corrective
Actions), below, to determine the corrective
FFT shape Possible Causes Corrective Actions
Ideal Doppler
-----
- restart the meter
Broad Band Noise
- poor pipe coupling
- multiple noise generators
- A,B,C,D (see Table
4.3c Action Codes, page 28) - relocate transducer - shut off noise
Steady Noise Spike
- electromagnetic noise
- shut off noise source
- relocate transducer
Fluctuating Doppler
- constantly changing flow
- noise
- increase damping,
see procedure 5.5
(Set the damping
parameter), page 35
No Doppler Reflection I & II
- ultrasound signal is not transmitting
- A,B,C,D,E
(see Table 4.3c
Action Codes,
Table 5.1 – FFT Analysis and Corrective Actions

32
Ideal Doppler shape
Steady noise spike with Doppler
Broad band noise
Figures 5.1 a,b,c – FFT Diagrams

33
Fluctuating Doppler profile
No Doppler reflection I
No Doppler reflection II
Figures 5.1 d,e,f – FFT Diagrams

34
NOTE Determine the flow using another source
5.2 Set the low flow cutoff.
1. Press the Menu à key to the left of Diags in
the Flow screen.
2. Wait for the Limits screen to appear. (See Figure 5.5 – Limits Screen, on page 35)
3. Press ENTER until the blinking cursor appears in the Low Flow Cutoff box.
4. Enter the rate for low flow using the number keys.
5.3 Perform an on-site calibration.
1. Calculate the site calibration adjustment. (actual flow¸Hydra flow)
2. Press the Menu à key to the left of Diags
in the Flow screen.
3. Wait for the Limits screen to appear. (See
Figure 5.5 – Limits Screen, on page 35) 4. Press ENTER until a cursor appears in the
Site Cal box.
5. Enter the site calibration adjustment.
5.4 Reset the factory settings.
1. Shut off the meter.
NOTE
All of the settings will reset except:
• 4-20 mA calibration • pipe ID

35
NOTE
The Smart Filter used by this meter, allows the damping function to smooth small fluctuations without diminishing the
meter's response to large flow changes,
5.5 Set the damping parameter.
1. Press the Menu à key to the left of Diags in
the Flow screen.
2. Wait for the Limits screen to appear. (See Figure 5.5-Limits Screen, below)
3. Enter the amount of damping (0-99 units,
4. Press the Menu à key to the left of FLOW
Figure 5.5 – Limits Screen
Limits
FFT
Totalz
Flow
Low Flow Cutoff 5.00 gal/min
Site Cal 1.00
Damp 10 m Vel. 14.8 fps10
5.00
Low Flow
1.00

36
6.1 Pipe ID
6.1.1 Obtain the Pipe ID.
If you do not know the pipe ID, then try to
get the Outside Diameter (OD) by one of the following methods:
1. Read the pipe Outside Diameter (OD) and schedule on the pipe
2. Read the OD and schedule from system drawings
3. Measure the pipe circumference using a
tape measure, and divide the measured
circumference by 3.14 4. For an approximate pipe ID use the OD
with the charts in section 6.1.2 (Pipe ID
Charts), on pages 37-39. 5. For a more accurate pipe ID use an
ultrasonic pipe thickness gauge (part #0704/0187, available from Polysonics), AND perform the following calculation:
pipe ID = pipe OD – (2 x pipe thickness)
6. Appendix

37
6.1.2 Pipe ID Charts
X ST
G
0.95
7 1.
278
1.50
0 1.
939
2.32
3
2.90
0 3.
364
3.82
6 4.
813
5.76
1
7.62
5 9.
750
11.7
50
13.0
00
15.0
00
17.0
00
19.0
00
23.0
00
29.0
00
35.0
00
41.0
00
47.0
00
Std.
Wal
l
1.04
9 1.
380
1.61
0 2.
067
2.46
9
3.06
8 3.
548
4.02
6 5.
047
6.06
5
7.98
1 10
.020
12
.000
13
.250
15
.250
17.2
50
19.2
50
23.2
50
29.2
50
35.2
50
41.2
50
47.2
50
Sche
d.
160
0.81
5 1.
160
1.33
8 1.
687
2.12
5
2.62
4 3.
438
4.31
3 5.
187
6.81
3 8.
500
10.1
26
11.1
88
12.8
12
14.4
38
16.0
62
19.3
12
31.3
12
Sche
d.
140
7.00
1 8.
750
10.5
00
11.5
00
13.1
24
14.8
76
16.5
00
19.8
76
31.8
76
Sche
d.
120
3.62
4 4.
563
5.50
1
7.18
7 9.
062
10.7
50
11.8
76
13.5
62
15.2
55
17.0
00
20.3
76
Sche
d.
100
7.43
7 9.
312
11.0
62
12.1
24
13.9
38
15.6
88
17.4
38
20.9
38
Sche
d.
80
0.95
7 1.
278
1.50
0 1.
939
2.32
3
2.90
0 3.
364
3.82
6 4.
813
5.76
1
7.62
5 9.
562
11.3
74
12.5
00
14.3
12
16.1
24
17.9
38
21.5
62
Sche
d.
60
7.81
3 9.
750
11.6
26
12.8
12
14.6
88
16.5
00
18.3
76
22.0
62
Sche
d.
40
1.04
9 1.
380
1.61
0 2.
067
2.46
9
3.06
8 3.
548
4.02
6 5.
047
6.06
5
7.98
1 10
.020
11
.938
13
.124
15
.000
16.8
76
18.8
12
22.6
24
28.5
00
34.5
00
40.5
00
47.2
50
Sche
d.
30
8.07
1 10
.136
12
.090
13
.250
15
.250
17.1
24
19.0
00
22.8
76
28.7
50
34.7
50
40.7
50
Sche
d.
20
8.12
5 10
.250
12
.250
13
.376
15
.376
17.3
76
19.2
50
23.2
50
29.0
00
35.0
00
41.0
00
Sche
d. 1
0 (L
ight
W
all)
1.09
7 1.
442
1.68
2 2.
157
2.63
5
3.26
0 3.
760
4.26
0 5.
295
6.35
7
8.32
9 10
.420
12
.390
13
.500
15
.500
17.5
00
19.5
00
23.5
00
29.3
76
35.3
76
Sche
d. 5
1.18
5 1.
530
1.77
0 2.
245
2.70
9
3.33
4 3.
834
4.33
4 5.
345
6.40
7
8.40
7 10
.482
12
.438
15
.670
17.6
70
19.6
34
23.5
64
29.5
00
Out
side
D
iam
eter
(O
D)
1.31
5 1.
660
1.90
0 2.
375
2.87
5
3.50
0 4.
000
4.50
0 5.
563
6.62
5
8.62
5 10
.750
12
.750
14
.000
16
.000
18.0
00
20.0
00
24.0
00
30.0
00
36.0
00
42.0
00
48.0
00
Tabl
e B
-1
Stee
l, St
ainl
ess
Stee
l and
PVC
Pip
e St
anda
rd S
ched
ules
In
side
Dia
met
er (I
D) a
nd O
utsi
de D
iam
eter
(OD
) in
Inch
es
Nom
inal
Pi
pe S
ize
(“)
1 1.25
1.
5 2 2.
5
3 3.5
4 5 6 8 10
12
14
16
18
20
24
30
36
42
48
38
ID
6.00
8.
00
10.0
0
12.0
0 14
.00
16.0
0 18
.00
20.0
0
24.0
0
Cla
ss H
OD
7.38
9.
60
11.8
4
14.0
8 16
.32
18.5
4 20
.78
23.0
2
27.7
6
ID
6.08
8.
10
10.1
2
12.1
4 14
.18
16.1
8 18
.22
20.2
4
24.2
6
Cla
ss G
OD
7.38
9.
60
11.8
4
14.0
8 16
.32
18.5
4 20
.78
23.0
2
27.7
6
ID
6.00
8.
10
10.0
0
12.0
0 14
.00
16.0
0 18
.00
20.0
0
24.0
0 30
.00
36.0
0
Cla
ss F
OD
7.22
9.
42
11.6
0
13.7
8 15
.98
18.1
6 20
.34
22.5
4
26.9
0 33
.46
40.0
4
ID
6.06
8.
10
10.1
2
12.1
4 14
.18
16.2
0 18
.20
20.2
4
24.2
8 30
.00
36.0
0
Cla
ss E
OD
7.22
9.
42
11.6
0
13.7
8 15
.98
18.1
6 20
.34
22.5
4
26.9
0 33
.10
39.6
0
ID
3.00
3.
96
6.00
8.
10
10.0
4
12.0
0 14
.01
16.0
2 18
.00
20.0
0
24.0
0 30
.00
36.0
0 42
.02
48.0
0
53.9
4 60
.06
Cla
ss D
OD
3.96
5.
00
7.10
9.
30
11.4
0
13.5
0 15
.65
17.8
0 19
.92
22.0
6
26.3
2 32
.74
39.1
6 45
.58
51.9
8
58.4
0 64
.82
ID
3.06
4.
04
6.08
8.
18
10.1
6
12.1
4 14
.17
16.2
0 18
.18
20.2
2
24.2
2 30
.00
35.9
8 42
.02
47.9
8
54.0
0 60
.20
72.1
0
Cla
ss C
OD
3.96
5.
00
7.10
9.
30
11.4
0
13.5
0 15
.65
17.8
0 19
.92
22.0
6
26.3
2 32
.40
38.7
0 45
.10
51.4
0
57.8
0 64
.20
76.8
8
ID
3.12
4.
10
6.14
8.
03
9.96
11.9
6 13
.98
16.0
0 18
.00
20.0
0
24.0
2 29
.94
36.0
0 41
.94
47.9
6
54.0
0 60
.06
72.1
0 84
.10
Cla
ss B
OD
3.96
5.
00
7.10
9.
05
11.1
0
13.2
0 15
.30
17.4
0 19
.50
21.6
0
25.8
0 32
.00
38.3
0 44
.50
50.8
0
57.1
0 63
.40
76.0
0 88
.54
ID
3.02
3.
96
6.02
8.
13
10.1
0
12.1
2 14
.16
16.2
0 18
.22
20.2
6
24.2
8 28
.98
35.9
8 42
.00
47.9
8
53.9
6 60
.02
72.1
0 84
.10
Cla
ss A
OD
3.80
4.
80
6.90
9.
05
11.1
0
13.2
0 15
.30
17.4
0 19
.50
21.6
0
25.8
0 31
.74
37.9
6 44
.20
50.5
0
56.6
6 62
.80
75.3
4 87
.54
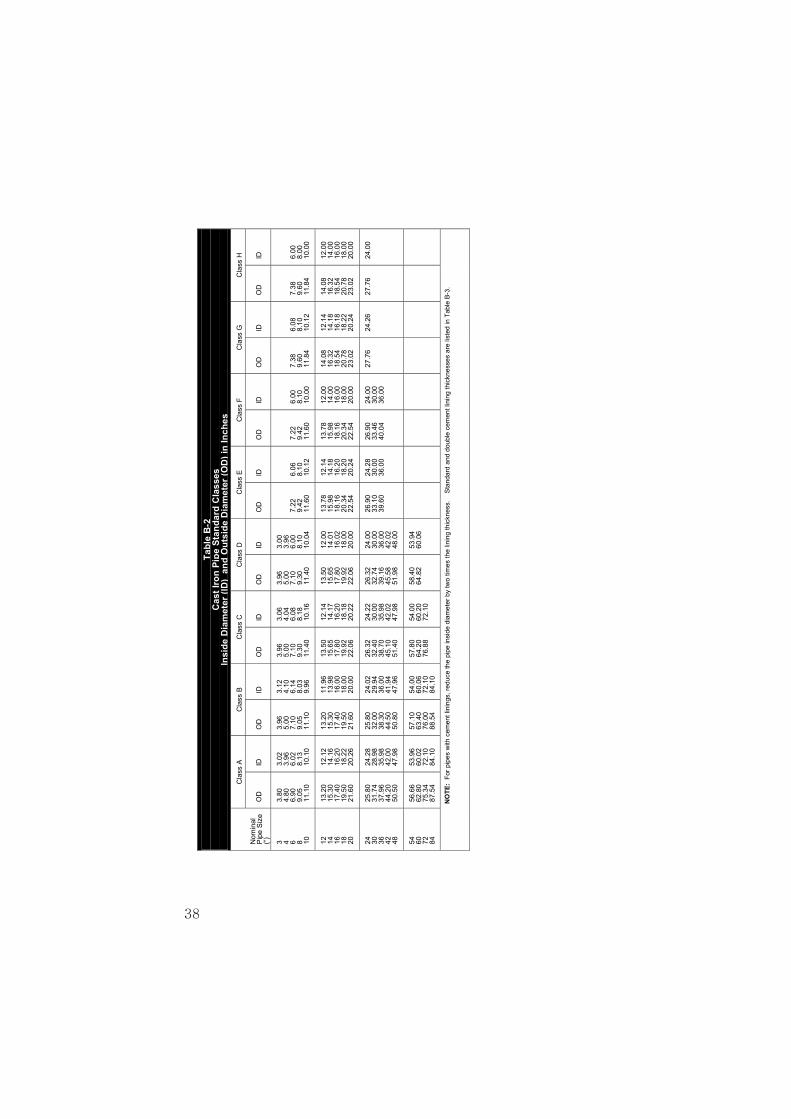
Tabl
e B
-2
Cas
t Iro
n Pi
pe S
tand
ard
Cla
sses
In
side
Dia
met
er (I
D)
and
Out
side
Dia
met
er (O
D) i
n In
ches
Nom
inal
Pi
pe S
ize
(“)
3 4 6 8 10
12
14
16
18
20
24
30
36
42
48
54
60
72
84
N
OTE
: Fo
r pip
es w
ith c
emen
t lin
ings
, red
uce
the
pipe
insi
de d
iam
eter
by
two
times
the
linin
g th
ickn
ess.
S
tand
ard
and
doub
le c
emen
t lin
ing
thic
knes
ses
are
liste
d in
Tab
le B
-3.

39
Dou
ble
Thic
knes
s
0.25
0
0.37
5
0.50
0
Cem
ent L
inin
g (S
ee N
ote)
Stan
dard
Th
ickn
ess
0.12
5
0.18
75
0.25
0
Cla
ss 5
6
3.16
3.
98
6.04
8.
15
10.1
6 12
.22
14.2
8 16
.36
18.4
4 20
.52
24.6
8
30.7
4 36
.84
42.8
4 48
.94
55.0
0
Cla
ss 5
5
3.22
4.
04
6.10
8.
21
10.2
2 12
.28
14.3
4 16
.42
18.5
0 20
.58
24.7
4
30.8
2 36
.94
42.9
6 49
.08
55.1
6
Cla
ss 5
4
3.28
4.
10
6.16
8.
27
10.2
8 12
.34
14.4
0 16
.48
18.5
6 20
.64
24.8
0
30.9
0 37
.04
43.0
8 49
.22
55.3
2
Cla
ss 5
3
3.34
4.
16
6.22
8.
33
10.3
4 12
.40
14.4
6 16
.54
18.6
2 20
.70
24.8
6
30.9
8 37
.14
43.2
0 49
.36
55.4
8
Cla
ss 5
2
3.40
4.
22
6.28
8.
39
10.4
0 12
.46
14.5
2 16
.60
18.6
8 20
.76
24.9
2
31.0
6 37
.06
43.3
2 49
.50
55.6
4
Cla
ss 5
1
3.46
4.
28
6.34
8.
45
10.4
6 12
.52
14.5
8 16
.66
18.7
4 20
.82
24.9
8
31.1
4 37
.34
43.4
4 49
.64
55.8
0
Insi
de D
iam
eter
Cla
ss 5
0
6.40
8.
51
10.5
2 12
.58
14.6
4 16
.72
18.8
0 20
.88
25.0
4
31.2
2 37
.44
43.5
6 49
.78
55.9
6
Out
side
D
iam
eter
(O
D)
3.96
4.
80
6.90
9.
05
11.1
0 13
.20
15.3
0 17
.40
19.5
0 21
.60
25.8
0
32.0
0 38
.30
44.5
0 50
.80
57.1
0
Tabl
e B
-3
Duc
tile
Iron
Pipe
Sta
ndar
d C
lass
es
Insi
de D
iam
eter
(ID
) and
Out
side
Dia
met
er (O
D) i
n In
ches
Nom
inal
Pi
pe S
ize
3 4 6 8 10
12
14
16
18
20
24
30
36
42
48
54
Not
e: F
or p
ipes
with
cem
ent l
inin
gs, r
educ
e th
e pi
pe in
side
dia
met
er b
y tw
o tim
es th
e lin
ing
thic
knes
s lis
ted
abov
e.
40
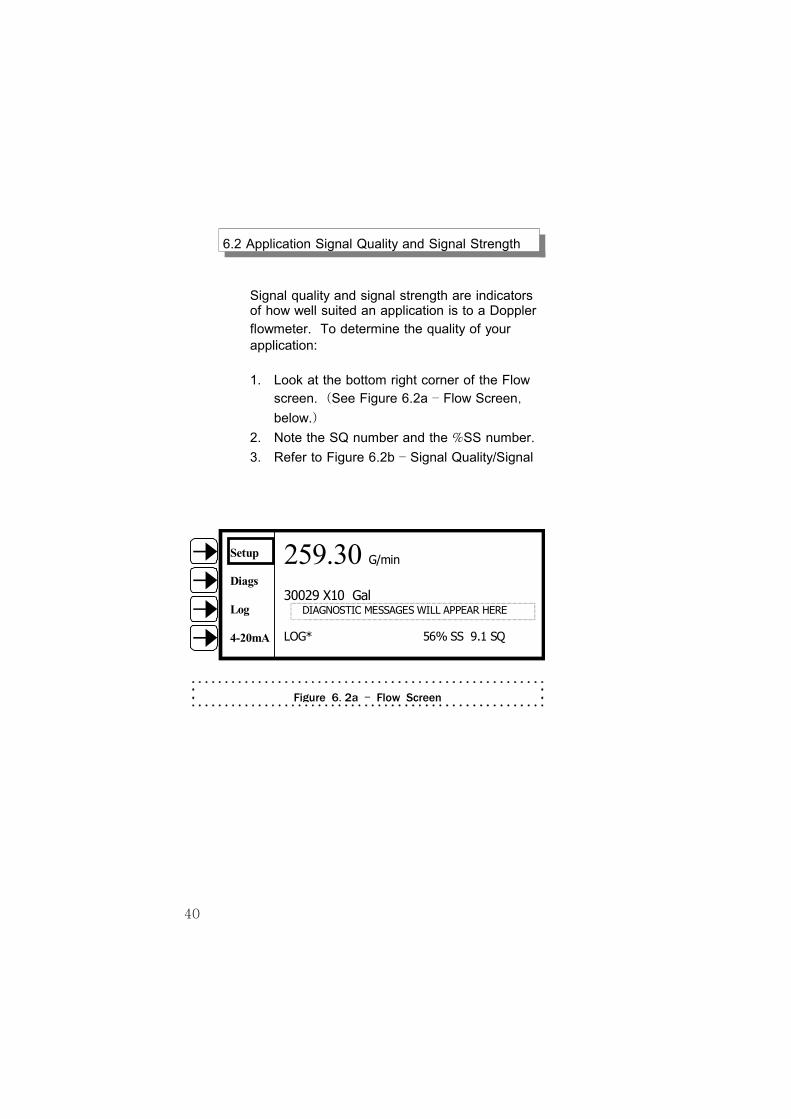
6.2 Application Signal Quality and Signal Strength
Signal quality and signal strength are indicators of how well suited an application is to a Doppler flowmeter. To determine the quality of your application: 1. Look at the bottom right corner of the Flow
screen. (See Figure 6.2a – Flow Screen,
below.)
2. Note the SQ number and the %SS number. 3. Refer to Figure 6.2b – Signal Quality/Signal
Setup
Diags
Log
4-20mA
259.30 G/min
30029 X10 Gal DIAGNOSTIC MESSAGES WILL APPEAR HERE
LOG* 56% SS 9.1 SQ
Figure 6.2a – Flow Screen

41
(section 6.2 Application Signal Quality and Signal Strength
Figure 6.2b – Signal Quality/Signal Strength Chart
Failure – the meter is not reading flow
Adequate – minimum quality, flow readings may be inconsistent or inaccurate
Good – flow readings are fairly accurate and consistent
Adequate
0.25 2.5 10
Good
Excellent
2.5
3.5
5
Failure
Signal Strength (%SS)
Sign
al Q
ualit
y (S
Q)
42
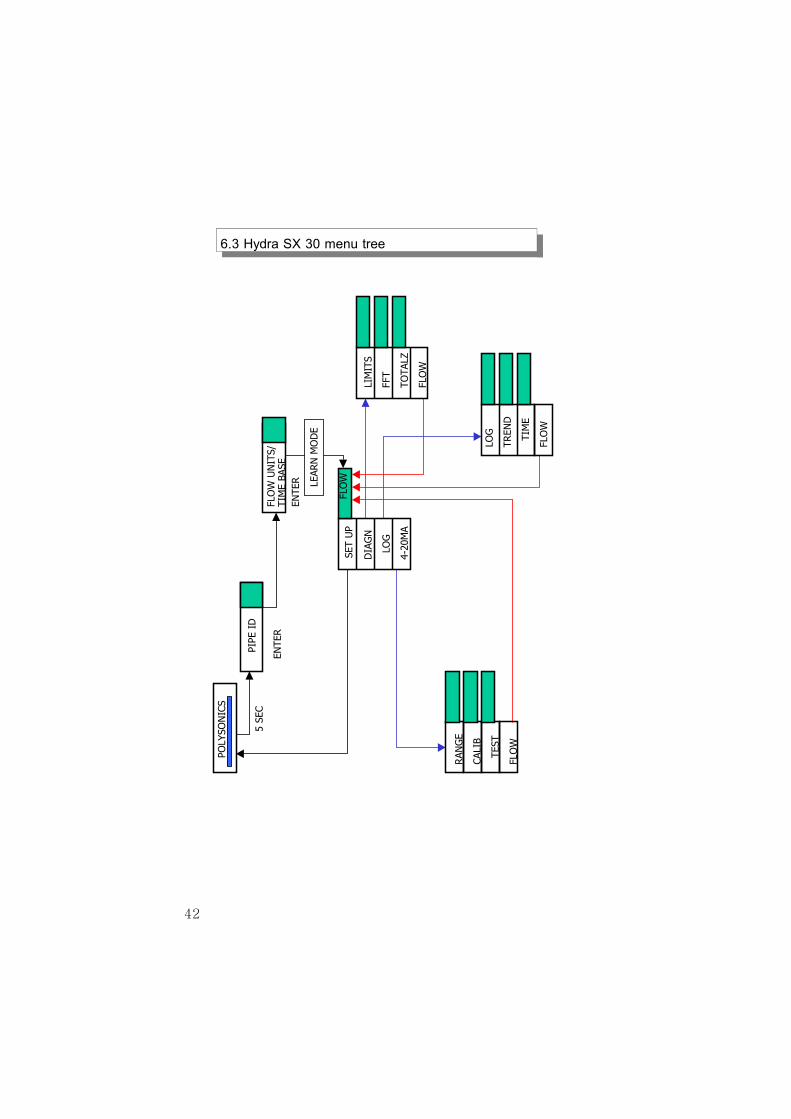
6.3 Hydra SX 30 menu tree
POLY
SON
ICS
PIPE
ID
FLO
W U
NIT
S/TI
ME
BASE
LEAR
N M
OD
E
FLO
W
RAN
GE
CALI
B
TEST
FLO
W
LIM
ITS
FFT
TOTA
LZ
FLO
W
LOG
TREN
D
TIM
E
FLO
W
SET
UP
DIA
GN
LOG
4-20
MA
5 SE
C
ENTE
R
ENTE
R

43

44