


Human granulocyte and monocyte isolation procedures...
43
Human granulocyte and monocyte isolation procedures: impact on 1 functional studies 2 3 Lu Zhou 1,2# , Rajesh Somasundaram 3# , Rosa F. Nederhof 1 , Gerard Dijkstra 1 , Klaas Nico 4 Faber 1 , Maikel P. Peppelenbosch 3 , Gwenny M. Fuhler 3* 5 6 1 Department of Gastroenterology and Hepatology, University Medical Center Groningen, 7 University of Groningen, Groningen, the Netherlands 8 2 Department of Gastroenterology and Hepatology, Tianjin Medical University General 9 Hospital, Tianjin Medical University, Tianjin, P.R. China 10 3 Department of Gastroenterology and Hepatology, Erasmus Medical Center, Erasmus 11 University of Rotterdam, Rotterdam, the Netherlands 12 13 # These authors contributed equally 14 15 * Correspondence to: Dr. Gwenny M. Fuhler, Department of Gastroenterology and 16 Hepatology, Erasmus Medical Center, Erasmus University of Rotterdam, ‘s 17 Gravendijkwal 230, 3015CE, Rotterdam, the Netherlands; Email: [email protected]; 18 Tel: +31-10-7035821; Fax: +31-10-7031793 19 20 Running title: Comparison of granulocyte and monocyte isolation methods 21 22 Copyright © 2012, American Society for Microbiology. All Rights Reserved. Clin. Vaccine Immunol. doi:10.1128/CVI.05715-11 CVI Accepts, published online ahead of print on 2 May 2012 on May 6, 2018 by guest http://cvi.asm.org/ Downloaded from
Transcript of Human granulocyte and monocyte isolation procedures...

Human granulocyte and monocyte isolation procedures: impact on 1
functional studies 2
3
Lu Zhou1,2#, Rajesh Somasundaram3#, Rosa F. Nederhof1, Gerard Dijkstra1, Klaas Nico 4
Faber1, Maikel P. Peppelenbosch3, Gwenny M. Fuhler3* 5
6
1Department of Gastroenterology and Hepatology, University Medical Center Groningen, 7
University of Groningen, Groningen, the Netherlands 8
2Department of Gastroenterology and Hepatology, Tianjin Medical University General 9
Hospital, Tianjin Medical University, Tianjin, P.R. China 10
3Department of Gastroenterology and Hepatology, Erasmus Medical Center, Erasmus 11
University of Rotterdam, Rotterdam, the Netherlands 12
13
# These authors contributed equally 14
15
* Correspondence to: Dr. Gwenny M. Fuhler, Department of Gastroenterology and 16
Hepatology, Erasmus Medical Center, Erasmus University of Rotterdam, ‘s 17
Gravendijkwal 230, 3015CE, Rotterdam, the Netherlands; Email: [email protected]; 18
Tel: +31-10-7035821; Fax: +31-10-7031793 19
20
Running title: Comparison of granulocyte and monocyte isolation methods 21
22
Copyright © 2012, American Society for Microbiology. All Rights Reserved.Clin. Vaccine Immunol. doi:10.1128/CVI.05715-11 CVI Accepts, published online ahead of print on 2 May 2012
on May 6, 2018 by guest
http://cvi.asm.org/
Dow
nloaded from

2
ABSTRACT 23
One of the first lines of defense against infection is the activation of the innate immune 24
system. It is becoming clear that autoimmune diseases such as rheumatoid arthritis and 25
Crohn’s disease may be caused by a disturbed innate immunity, and relating granulocyte 26
and monocyte function to patient genotype has become an important part of 27
contemporary research. Although essential to move this field forward, a systematic study 28
comparing the efficacy and suitability for functional studies of the various available 29
protocols for the isolation of these immune cells has not been performed. Here, we 30
compare human granulocyte functionality upon three enrichment protocols; 1) Ficoll 31
density gradient centrifugation, 2) anti-CD15 antibody conjugated microbeads (positive 32
selection) and 3) PolymorphoprepTM. Primary monocytes were isolated in parallel using 33
1) anti-CD14 magnetic microbeads, 2) non-monocyte depletion by antibody conjugated 34
magnetic microbeads (negative selection), 3) RosetteSepTM antibody cocktail, and 4) the 35
classical adherence protocol. Best results in terms of purity and cell functionality were 36
obtained with positive selection by magnetic microbeads for both human granulocytes 37
and monocytes. Whereas phagocytosis of E. coli bacteria was identical in all isolation 38
procedures tested, granulocyte respiratory burst was higher in positively selected cells. In 39
addition, different granulocyte enrichment procedures affect cell surface receptor 40
expression to a different extent. In toto, we propose that positive selection of granulocytes 41
and monocytes be adopted as the procedure of choice for studies on human granulocyte 42
and monocyte function, but caution investigators to be aware of possible alterations in 43
cell phenotypes upon different isolation procedures. 44
45
on May 6, 2018 by guest
http://cvi.asm.org/
Dow
nloaded from

3
INTRODUCTION 46
Monocytes represent 3-7 percent of total white blood cells (absolute monocyte count 1.5-47
7 ×10⁸/ liter blood) in healthy human adults. Circulating monocytes, which are derived 48
from myelomonocytic stem cells in bone marrow, have two main functions in the 49
immune system: (1) to replenish resident macrophages and dendritic cells in peripheral 50
tissues under normal states, and (2) to patrol healthy tissues through long-range crawling 51
on the resting endothelium [10]. In response to inflammatory signals, monocytes quickly 52
move to sites of infection in the tissues, engage in phagocytosis of foreign substances, 53
and initiate an early immune response through the recruitment of neutrophils and other 54
polymorphonuclear leukocytes (PMNs). PMNs constitute the most abundant of peripheral 55
white blood cells, i.e. 40 to 60% (absolute count 25-750×108/ liter blood). Their 56
bactericidal activity is essential in the proper clearance of infectious agents, and stems 57
from their exocytosis of lysozyme and protease-containing granules, phagocytosis of 58
bacteria and the concomitant production of reactive oxygen species (ROS, respiratory 59
burst). Extravasation of PMNs to the site of inflammation in turn precedes a second wave 60
of migrating monocytes to remove rapidly apoptotic PMNs. Monocytes, macrophages 61
and dendritic cells are also capable of eliciting adaptive immune response via antigen 62
presentation, a role which has also been attributed to granulocytes in inflammatory 63
settings [6;22]. Therefore, PMN and monocytes play a pivotal role in keeping the 64
dynamic balance of human immune system [29]. 65
Interest in measuring innate immune cell functionality has substantially increased, 66
especially because of a growing acceptance of the notion that defects in innate immunity 67
contribute to the pathogenesis of autoimmune diseases. Examples of those are rheumatoid 68
on May 6, 2018 by guest
http://cvi.asm.org/
Dow
nloaded from

4
arthritis (RA), systemic lupus erythematosis (SLE), an autoimmunity against DNA, and 69
the pathogenesis of Crohn’s disease (CD), an often severe autoimmunity towards the 70
resident gut flora. CD patients exhibit a phagocyte immunodeficiency that combines a 71
primary macrophage defect and a secondary granulocytic defect [2-5;24]. Macrophages 72
from these patients demonstrate impaired cytokine secretion in response to E.coli loading 73
[24]. Furthermore, after acute trauma in the gut mucosa and skin, PMN recruitment, 74
bacterial clearance and ROS production are attenuated [20;23;25]. With respect to 75
rheumatoid arthritis, granulocytes play an important role in the induction of disease and 76
disease progression, as depletion of PMN alleviates disease [28]. One of the mechanisms 77
through which granulocytes may exacerbate disease is by the deposition of autoantibodies 78
to the joints, although relatively little is known about this phenomenon [21]. In SLE, 79
granulocytes may enhance immunological reactions by the formation of neutrophil 80
extracellular traps (NETs) which forms immune complexes consisting of DNA, 81
antimicrobial peptides and autoantibodies, which subsequently activate plasmacytoid 82
dendritic cells [13;14]. In addition, monocyte function and morphology in SLE has been 83
reported to be altered; however, phagocytosis of bacteria may be either decreased or 84
enhanced, and more studies in order to assess the real contribution of these innate 85
immunity cells have been called for [15;18]. 86
Taken together, the body of contemporary biomedical literature strongly supports 87
the concept that innate immune cell dysfunction is associated with the pathogenesis of 88
many autoimmunities [29], triggering investigations into the properties of innate immune 89
cells in patients, and comparison of their phenotype to the genotype of risk genes relevant 90
for autoimmunity. The results of such studies may well depend on the protocols 91
on May 6, 2018 by guest
http://cvi.asm.org/
Dow
nloaded from

5
employed for isolation of the immune cells. A comparison of both the yield and 92
specificity of the available protocols for monocyte and PMN isolation from patient 93
peripheral blood, as well as the relative performance of cells isolated using these 94
protocols in subsequent functional experimentation, is urgently called for. 95
These considerations prompted us to perform a systemic evaluation of the most 96
frequently used methodologies for the isolation of granulocytes and monocytes from 97
human peripheral blood. PMN were isolated in parallel using (1) Ficoll density gradient 98
centrifugation, (2) polymorphprepTM density gradient centrifugation, and (3) anti-CD15 99
antibody conjugated magnetic microbeads (positive selection), after which PMN 100
functionality was assessed by in vitro phagocytosis and ROS production assays. 101
Monocytes were isolated from peripheral blood in parallel using (1) anti-CD14 antibody 102
conjugated magnetic microbeads (positive selection), (2) non-monocyte depletion by 103
antibody conjugated magnetic microbeads (negative selection), (3) immunorosette based 104
RosetteSepTM antibody cocktail (RosetteSepTM), and (4) adherence, aiming to assess their 105
suitability for in vitro phagocytosis analysis. We conclude that positive selection of 106
granulocytes and monocytes by anti-CD15 and anti-CD14 antibody conjugated magnetic 107
microbeads, respectively, are best suited for studies in which purity is imperative, but that 108
in general the isolation method of choice should depend on the type of functional assay to 109
be used. 110
111
112
on May 6, 2018 by guest
http://cvi.asm.org/
Dow
nloaded from

6
MATERIALS AND METHODS 113
114
Granulocyte isolation from human peripheral blood 115
Heparin and EDTA anti-coagulated blood was obtained from healthy volunteers after 116
informed consent, and in regulation with the ethical guidelines of the institution. 117
Neutrophils were isolated as described previously [9]. In short, mononuclear cells were 118
removed by centrifugation of heparinized blood over Ficoll-Paque (Amersham), followed 119
by erythrocyte lysis with ice-cold NH4Cl solution. For positive selection, granulocytes 120
obtained from Ficoll density gradient centrifugation were subsequently subjected to anti-121
CD15 microbead isolation (Miltenyi Biotech, Amsterdam, the Netherlands), using 122
manual columns, according to the manufacturers’ instruction. Additionally, PMN were 123
isolated from EDTA anti-coagulated blood using PolymorphPrepTM (Axis-Shield, 124
Norway). When present, erythrocytes were lysed with ice-cold NH4Cl solution. Before 125
functional testing, PMN were allowed to recover for 30 minutes at 37ºC in RPMI 1640 126
supplemented with 0.5% human serum albumin (HSA; Sanquin, The Netherlands). Cells 127
were resuspended in incubation buffer (20mM HEPES, 132mM Nacl, 6mM KCl, 1mM 128
MgSO4, 1.2mM KH2PO4, 5mM glucose, 1 mM CaCl2, and 0.5% HSA) prior to subjecting 129
them to functional assays. All isolation procedures were done in parallel per healthy 130
donor. 131
132
ROS production assay 133
ROS production was performed as described [8]. Shortly, PMN (2x10⁶ cells/ml) were 134
incubated with Dihydrorhodamine 123 (DHR 123) for 15 minutes and stimulated with 135
on May 6, 2018 by guest
http://cvi.asm.org/
Dow
nloaded from

7
1µM N-formyl-methionine-leucine-phenylalanine (fMLP) for 30 minutes. For priming 136
experiments, cells were pretreated with 5ng/ml GM-CSF for 15 minutes prior to fMLP 137
stimulation. Stimulation of PMN with fMLP was terminated by washing the cells with 138
ice-cold PBS containing 1% HSA and placing them on ice. Oxidation of DHR123 to the 139
fluorescent Rhodamine 123 was measured by FACS-analysis within 30 minutes after 140
termination of stimulation. 141
142
Monocyte isolation from human peripheral blood 143
Heparinized blood was obtained from healthy volunteers after informed consent. In order 144
to optimize monocyte isolation method, monocytes from the same healthy donor were 145
isolated by four different strategies in parallel. In short, monocyte positive selection by 146
monoclonal CD14 antibody (isotype: mouse IgG2a) conjugated microbeads (Miltenyi 147
Biotec, Germany) and monocyte negative selection by monocyte isolation kit II (Miltenyi 148
Biotec) were performed with manual columns strictly according to the manufacturer’s 149
protocol, as was monocyte isolation by RosetteSepTM (Stemcell technologies, France). 150
Monocyte isolation by adherence method was performed as described previously [7]. 151
Briefly, peripheral blood mononuclear cells were isolated immediately after collection 152
using LymphoprepTM gradients (Axis-Shield PoC As, Norway). Monocytes were further 153
enriched by virtue of their attachment to a culture plate for 2 hours, washed 3 times with 154
warm phosphate buffered saline (PBS) to remove non-adherent cells, the adherent 155
monocytes were recovered by cell scraper. The purity of monocytes was evaluated by 156
fluorescent staining with CD14-PE monoclonal antibody (UCHM1, murine IgG2a, IQ 157
on May 6, 2018 by guest
http://cvi.asm.org/
Dow
nloaded from

8
products, Netherlands) and FACS analysis. The recovery of monocytes was evaluated by 158
Trypan blue staining and counted using a Zeiss microscope. 159
160
Cell culture 161
Monocytes were cultured in complete medium consisting of RPMI1640 (PAA 162
laboratories, Austria) supplemented with 10% heat-inactivated FCS (PPA) and 10 μg/ml 163
Gentamicine (Centrafarm, Netherlands) at 37°C in 5% CO2 humidified air. 164
165
Phagocytosis assay 166
GFP expression vector was transformed into E.Coli and grown in LB media until OD of 167
400 was reached. Bacteria were fixed using 4% formaldehyde. Isolated PMN were 168
resuspended (2 x10⁶/ml) in RPMI containing 10% FCS and 1x10⁶ bacteria were subjected 169
to PMN phagocytosis at 37°C for 15 minutes. The percentage of phagocytosing PMN 170
was determined by flow cytometry by analyzing the percentage of GFP positive PMN. 171
Phagocytosis at 0°C was used as negative control for each experiment. No FITC positive 172
PMN were observed under this condition, confirming active phagocytosis of bacteria 173
rather than attachment of bacteria to PMN membranes. Alternatively, 4% formaldehyde-174
fixed E. coli were labeled with FITC fluorescence by incubation in 1mg/ml FITC solution 175
containing 0.1M Na2CO3 pH 9.5 for 1 hour followed by complete washing. The 176
efficiency of labeling was tested by FACS analysis (see below). Bacterium concentration 177
was quantified using Quantimet HR550 image analysis software (Leica) to analyze 178
microscopic images of FITC-E. coli taken with a Leica (Wetzlar, Germany) DMRXA 179
epifluorescence microscope [30]. For monocytes, the phagocytosis assay was performed 180
on May 6, 2018 by guest
http://cvi.asm.org/
Dow
nloaded from

9
according to Mandell and Hook [19]. In short, monocytes (1× 10⁴/ml) were incubated 181
with FITC-E. coli at a 1:5 ratio for 5 or 15 minutes at 37 °C in RPMI1640 medium 182
containing 10% heat-inactivated FCS. Thereafter, phagocytosis was evaluated 183
microscopically by counting both the number of monocytes exhibiting phagocytosis and 184
the number of bacteria phagocytosed per monocyte. At least 300 cells were counted for 185
each slide. The engulfment rather then attachment of E. coli to PMN and monocytes was 186
confirmed by confocal microscope (LSM 700, Carl Zeiss, Jena, Germany) and cultures at 187
4 oC. 188
189
FACS analysis 190
Isolated PMN or whole blood after red cell lysis were stained resuspended in 191
PBS/EDTA/1%FCS). After blocking with FcR blocking reagent from Miltenyi Biotech 192
(Amsterdam, the Netherlands) for 15 minutes, cells were labeled with anti-CD14-PerCP-193
Cy5.5 (clone M5E2), anti-CD66b-PerCP-Cy5.5 (G10F5), anti-CD15-PE (clone HI98), 194
anti-TLR2-Alexa 647 (clone TL2.1), anti-TLR4-PE (clone HTA125), anti-CD62L-195
Alexafluor647 (clone DREG56) (all from Biolegend, San Diego, CA). No FcR blocking 196
was performed when staining for FcReceptors using anti-CD16-PE (clone 3G8, 197
Biolegend), anti-CD64-PE (clone 10.1, Biolegend) or anti-CD32-FITC (clone FL18.26 198
from BD Bioscience, Franklin Lakes, NJ). After washing with PBS, fluorescence was 199
measured by flow cytometry (FACSCanto, BD Bioscience Franklin Lakes, NJ). 200
201
Analysis of purity 202
on May 6, 2018 by guest
http://cvi.asm.org/
Dow
nloaded from

10
Analysis of the purities of granulocytes and monocytes by FACS was performed using 203
PerCP-Cy5-labeled CD66b (Clone G10F5, Biolegend) and PE-labeled CD14 monoclonal 204
antibody (clone UCHM1, murine IgG2a, IQ products, Netherlands), respectively. In 205
short, cells were incubated with appropriate antibodies (10 μl per 5 × 10⁵ cells) for 30 206
minutes on ice. Cells were washed twice in PBS/0.1% BSA before FACS analysis. For 207
identifying the platelet contaminants and observing the cytoskeleton of monocytes, 208
enriched monocytes were further stained intracellularly with TRITC conjugated 209
phalloidin (Sigma-aldrich). In short, cells were fixed in PBS/4% formaldehyde for 10 210
minutes, washed twice in PBS, permeabilized in PBS/0.1% Triton X-100 (Sigma-211
Aldrich), treated with TRITC conjugated phalloidin (25μg/ml) for 30 minutes in dark, 212
and washed three times in PBS. Platelets were identified by their morphology under 213
fluorescence microscopy. Contaminating cells in granulocyte isolates were discriminates 214
using anti-CD19-PE, clone IB19 (B-cell), anti-CD3-Amcyan clone SK7 (T-cell) and anti-215
CD14-PerCP clone M5E2 (Monocyte) antibodies. DAPI was used to exclude dead cells. 216
217
Statistics 218
For comparison of multiple isolation methods, differences between the means of the 219
groups were tested by non-parametric test for related samples (Friedman test) or unpaired 220
samples (Kruskal-Wallis). Where variance between the means of groups was found by 221
Friedman test, post-hoc analysis was performed by Wilcoxon signed Ranks testing, to 222
determine which of the groups differed from each other. Wilcoxon signed Rank non-223
parametric test for paired samples was also used for comparisons between two groups, 224
on May 6, 2018 by guest
http://cvi.asm.org/
Dow
nloaded from

11
such as the comparison of fMLP-stimulated ROS production with and without priming 225
with GM-CSF. 226
227
on May 6, 2018 by guest
http://cvi.asm.org/
Dow
nloaded from

12
RESULTS 228
229
Comparison of three commonly used isolation protocols for purity of enriched 230
granulocytes. 231
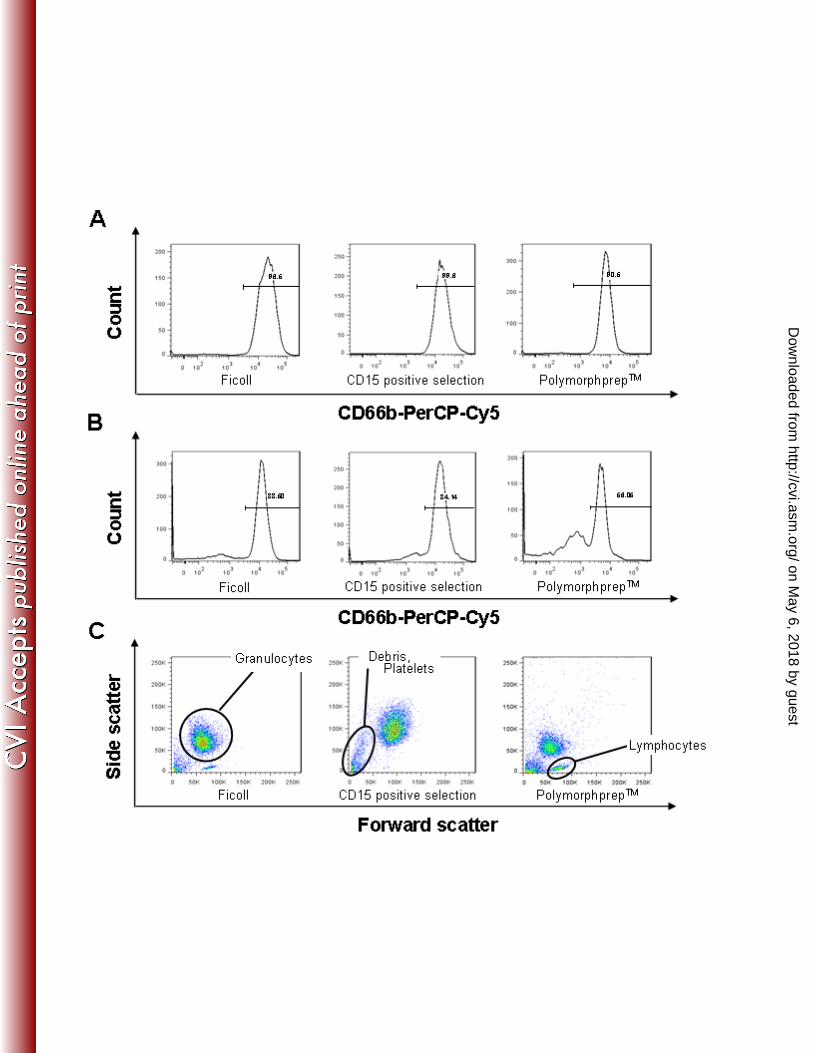
PMN were isolated from blood from healthy volunteers using, in parallel, three of the 232
most commonly used methods in literature. Purity of isolates was analyzed by flow 233
cytometry, and proved to be 96.2±2, 99.5±0.5 and 91.4±4.9% of nucleated cells for 234
Ficoll, anti-CD15 microbead positive selection and PolymorphprepTM isolation methods, 235
respectively (Figure 1A, Table 1). This measure, however, excludes non-nucleated cells 236
(erythrocytes and thrombocytes) as well as ghosts derived from necrotic cells. Hence, we 237
also determined the percentage of CD66b positive cells as a function of all cell-like 238
particles (i.e. all particles in which Ø >0,5 μM). When results were expressed this way, 239
Ficoll density gradient centrifugation yielded 87±3% granulocyte purity, compared to 240
88±5% for positive selection (see Figure 1B for representative example). 241
PolymorphprepTM isolation method resulted on average in 76±19% purity, largely due to 242
a higher amount of contaminating debris particles and lymphocytes (Figure 1C). Also, in 243
our hands, the highest variability in purity between isolations was observed when using 244
PolymorphprepTM, suggesting that this method is somewhat more sensitive to small day 245
to day variations. We also noticed a donor to donor variation in adherence of the 246
lymphocyte ring to the plastic disposables after centrifugation, which may account for 247
some of the contamination variability observed. When analyzing the nature of this 248
contaminating mononuclear cell fraction, these were found to be mainly CD3-positive T-249
cells, with little or no CD19+ B-cell or CD14+ monocytes (not shown). 250
on May 6, 2018 by guest
http://cvi.asm.org/
Dow
nloaded from

13
PMN are amongst the most short-lived cells in the body. They are extremely 251
fragile cells, and prone to apoptosis upon withdrawal from the blood. Importantly, 252
however, no more than 3.7% dying cells were identified by 7AAD (Fig 2D) or DAPI 253
staining (not shown) as determined by FACS analysis of any of the isolation methods 254
used, indicating that no significant cell death was induced during isolation procedures. 255
In conclusion, the best results in terms of granulocyte purity were obtained using 256
anti-CD15 microbead positive selection methods. 257
258
Comparison of granulocyte yield obtained using the three most commonly used 259
PMN isolation protocols 260
The absolute recovery rates of PMN after the three isolation procedures are shown in 261
Table 1. Typically, isolation of PMN by positive selection, though leading to the highest 262
purity, also yielded the lowest recovery rates; 9.6×10⁵/ml peripheral blood were obtained, 263
which was significantly less then the yields obtained using either Ficoll centrifugation 264
(16×105/ml peripheral blood) or PolymorphprepTM (14.8×10⁵/ml peripheral blood). With 265
a purity of 95.2% and the highest overall yield, granulocyte enrichment by Ficoll 266
centrifugation seems the optimal method when high numbers of cells are required. 267
268
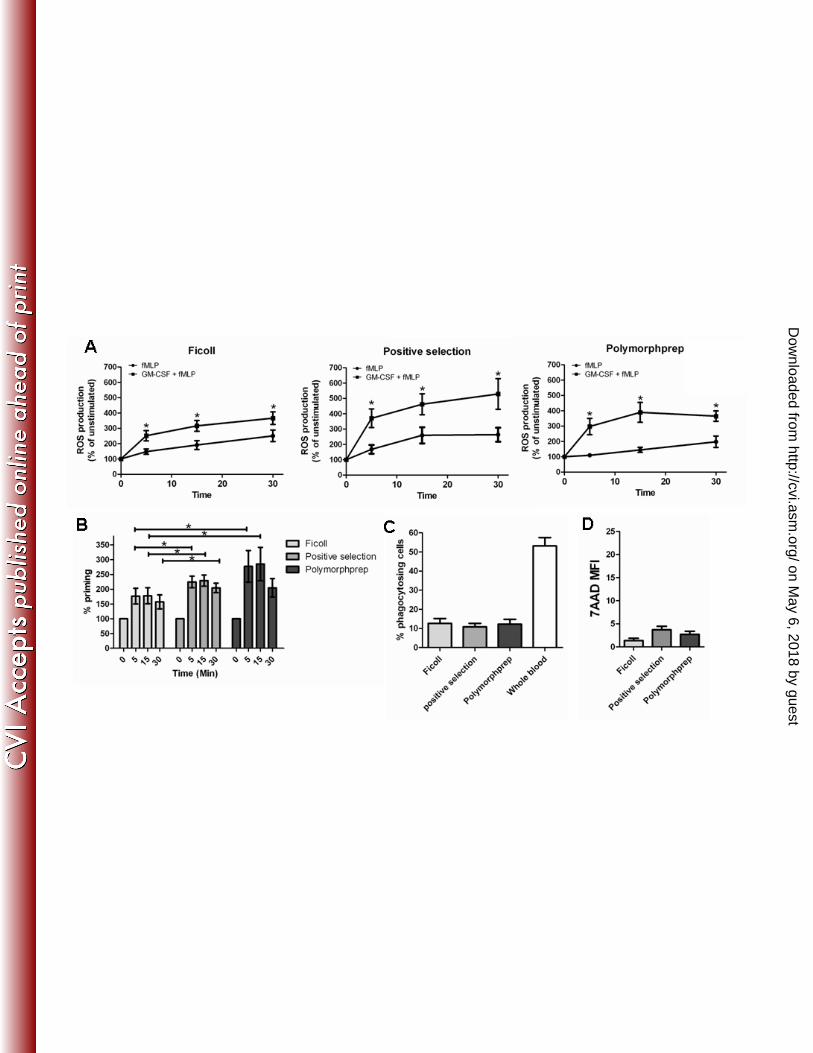
Granulocyte functionality in a ROS production assay following different isolation 269
protocols 270
PMN are easily activated by trace amounts of bacterial lipopolysaccharides or mechanical 271
stressors. To determine whether our different isolation methods give unwanted activation 272
of PMN, we studied their ROS production. Spontaneous PMN ROS production was not 273
on May 6, 2018 by guest
http://cvi.asm.org/
Dow
nloaded from

14
different between isolation procedures (data not shown). In addition, expression of the 274
neutrophil activation marker L-selectin (CD62L), shedding of which is associated with 275
PMN activation [26], was similar between groups, comfirming that there was no bias in 276
activation of PMN between isolation methods (Figure 3A, upper left panel). 277
ROS production can be triggered by the bacterial peptide analogue fMLP, and 278
fMLP-induced ROS production is significantly enhanced in GM-CSF-primed PMN. 279
Significant differences were observed when comparing fMLP-triggered ROS production 280
between isolation methods (p=0.042 by Friedman Test). These were caused by the fact 281
that PMN isolated by PolymorphprepTM showed a lag in fMLP-induced ROS production 282
when compared to either Ficoll or positive selection methods (109±8% vs 148±18 and 283
168±28, respectively, at t=5 min, Figure 2A). Pretreatment of PMN with GM-CSF 284
resulted in a significant enhancement ROS production for all isolation methods tested. 285
However, we observed significant differences between the groups (p=0.042 by Friedman 286
Test), with PMN isolated by positive selection showing a significantly higher ROS 287
production than the other two isolation methods. These results suggest that the ability of 288
PMN to be primed for ROS production is highest in PMN isolated by positive selection, 289
which may argue for lower activation status upon isolation in these cells. Indeed, when 290
the priming of ROS production was compared between groups, significant differences 291
were observed between isolation methods (p = 0.009 by Friedman Test), with cells 292
isolated by positive selection showing a significantly higher priming capacity then PMN 293
isolated by Ficoll. Polymophprep isolation induced a higher variability in priming of ROS 294
production, but due to its lag in fMLP-induced ROS production, priming in this group 295
on May 6, 2018 by guest
http://cvi.asm.org/
Dow
nloaded from

15
was higher when compared to Ficoll-isolated PMN (figure 2B). Therefore, for ROS 296
production analysis, positive selection of PMN may be the best option. 297
298
Granulocyte functionality in an Escherichia coli phagocytosis assay following 299
different isolation protocols 300
Ficoll has been shown to change PMN shape and migratory capacity, indicating an effect 301
on cytoskeletal rearrangement [11]. Phagocytosis is dependent on the actin cytoskeleton, 302
and as such may be affected by Ficoll isolation procedures. Positive selection of 303
neutrophils relies on the antibody binding of CD15, a carbohydrate adhesion molecule. 304
Ligation of CD15 antibodies to this integrin-associated molecule may potentially affect 305
phagocytosis and adhesion of PMN [16]. We therefore studied the E. coli phagocytosing 306
capacity of PMN isolated by different methods, using phagocytosis of PMN in whole 307
blood as control. To distinguish PMN in whole blood samples, cells were stained for 308
CD15, and the percentage of PMN containing GFP-positive E.Coli was determined by 309
FACS analysis. As expected, phagocytosis of non-isolated PMN is more efficient than 310
that of isolated granulocytes, with more than 53±4% of granulocytes taking up GFP-311
positive bacteria. No significant differences in the percentage of phagocytosing cells were 312
observed in PMN isolated by Ficoll centrifugation, positive selection or 313
PolymorphprepTM (12.6±3%, 10.8±2% and 12.2±3%, respectively, n=6; p = .55, Figure 314
2C). Engulfment of bacteria rather then adhesion to PMN cell surface was confirmed by 315
confocal microscopy (supplementary movie 1). In addition, the amount of bacteria taken 316
up per cell, as determined by mean fluorescence intensity (MFI) of GFP-positive PMN, 317
on May 6, 2018 by guest
http://cvi.asm.org/
Dow
nloaded from

16
did not differ per isolation method used (MFI of 1172, 1054 and 1231 for Ficoll 318
centrifugation, positive selection or PolymorphprepTM, respectively, not shown, p=0.819). 319
320
321
Expression of PMN cell surface markers following different isolation procedures. 322
Isolation of granulocytes may affect their expression of cell surface receptors and other 323
molecules, and thereby alter specific granulocyte functions. CD15, CD66b and CD62L 324
(L-selectin) are adhesion molecules involved in PMN phagocytosis and chemotaxis. 325
Analysis of CD15 expression upon different isolation procedures reveals a slight but 326
significant decrease in CD15 and CD66b expression upon PolymorphprepTM isolation as 327
compared to Ficoll isolation and positive selection, respectively. Whereas CD62L 328
expression was comparable between groups, expression of CD66b was highest on PMN 329
isolated by positive selection, followed by Ficoll and Polymorphprep. Although this is 330
not likely to affect phagocytosis (as seen above), it is conceivable that other, untested 331
functions (e.g. migration), could potentially be affected. 332
We also assessed expression of the CD64 FcγRI, the CD32 FcγRII and the low 333
affinity FcRIII, CD16. Although CD64 expression was higher in positively selected PMN 334
as compared to PMN isolated by Ficoll, significant differences between groups were only 335
observed for CD16. PMN isolated by positive selection showed a small but significant 336
increase in CD16 expression as compared to either Ficoll or PolymorphprepTM isolates. 337
No differences in CD32 expression were observed between isolation protocols. Next, we 338
analyzed the expression of Toll like receptor (TLR) 2, TLR4 and co-receptor CD14, 339
which bind lipopolisaccharise (LPS), the major component of the outer membrane of 340
on May 6, 2018 by guest
http://cvi.asm.org/
Dow
nloaded from

17
Gram-negative bacteria such as E. coli [12]. A dramatic increase in TLR2 and TLR4 341
expression was observed on PMN isolated by positive selection. This could have 342
substantial consequences for studies into the function of these receptors as well as studies 343
into functional LPS responses, and isolation procedures should therefore be carefully 344
considered by investigators undertaking such studies. 345
346
Comparison of the four most commonly-used isolation protocols for purity of 347
enriched monocyte cultures 348
Monocytes of healthy individuals were isolated from peripheral blood in parallel by the 349
four procedures most commonly used in the literature. First we decided to assess the 350
purity of the monocyte fraction following the four different types of enrichment as a 351
percentage of all nucleated cells using FACS. Using this measure, it was observed that 352
monocytes were obtained with purities of 98.5%, 97.0%, 67.3% and 64.2% by positive 353
selection, negative selection, adherence and RosetteSepTM, respectively (Fig. 4A). 354
Furthermore, visual inspection of monocyte cultures revealed the presence of non-355
nucleated particles. When results were expressed as percentage of all recorded events (Ø 356
>0,5 μM) the monocyte purity obtained was 95.4%, 48.7%, 58.5% and 35.9% for 357
respectively positive selection, negative selection, adherence and RosetteSepTM (Fig. 4B, 358
representative example). Thus with regard to purity, positive selection yields the bests 359
results for monocyte isolation, both judged by the monocyte fraction of all nucleated cells 360
and as fraction of all cell-like bodies. Importantly, after positive selection procedures 361
during which monocytes were labeled with antibodies for CD14 receptors, abundant 362
on May 6, 2018 by guest
http://cvi.asm.org/
Dow
nloaded from
18
CD14 expression was still detected by anti-CD14 PE, indicating a functional condition of 363
these cells with respect to CD14 (Fig. 4D). 364
Next, we analyzed the nature of the contaminants in the enriched samples obtained using 365
the four different isolation procedures. As shown in Fig. 4C, compared to samples 366
obtained through positive selection, large amounts of platelets remained in the enriched 367
monocyte cultures after negative selection. After adherent isolation procedure, the major 368
contaminants are lymphocytes and platelets. After RosetteSepTM procedures, we observed 369
large amounts of lymphocytes, platelets, and non-specific cellular aggregates, which 370
significantly compromise the purity of this monocyte culture. 371
372
Comparison of monocyte yield obtained using the four most commonly-used 373
monocyte isolation protocols 374
The absolute recovery rates of monocytes after the four isolation procedures are depicted 375
in Table 2. The purities and recoveries of monocytes after positive selection, negative 376
selection, and RosetteSepTM procedures were highly reproducible. During the enrichment 377
procedure by adherence, due to the difficulties to standardize the washing steps by which 378
monocytes and lymphocytes are separated, outcomes were more variable, at least in our 379
hands. In this respect, we observed that this methodology is sensitive to inadequate 380
washing of cultures resulting in significantly compromised monocyte purity, whereas 381
excess washing has substantial consequences with respect to monocyte recovery yield 382
(not shown). Nevertheless, typically, isolation by adherence enriched monocytes to a 383
purity of 68.1% and a recovery of 2.0×10⁵/ml peripheral blood, which is not markedly 384
different from the yields obtained using either positive or negative selection. The 385
on May 6, 2018 by guest
http://cvi.asm.org/
Dow
nloaded from

19
RosetteSepTM procedure leads to substantially better results in this respect and takes less 386
time, but the cultures obtained suffer from impurities (see above) and on a per monocyte 387
basis, it remains slightly more expensive (Table 2). Viability of monocytes in all isolates 388
was >99%, as determined by fluorescence microscopy of DAPI stained nuclei (for 389
example, see Fig. 4D). 390
391
Monocyte functionality in a Escherichia coli phagocytosis assay following different 392
monocyte isolation protocols 393
Along with TLR4, CD14 acts as a co-receptor on monocytes, detecting bacterial LPS. In 394
order to evaluate the effect of CD14 antibody binding during positive selection 395
procedures on phagocytic capacity of enriched monocytes, we challenged monocytes 396
enriched by positive selection or negative selection with FITC-labeled E. coli. 397
Phagocytosis index is significantly influenced by bacteria/monocyte ratio [17]. For the 398
studies aiming to compare phagocytic capacity of monocytes, cells were challenged with 399
a bacteria/monocytes ratio of 5:1 for 5 minutes to induce uptake of E.Coli in 50%-80% of 400
all monocytes, an optimal set-up to show the maximal differences between samples. 401
Phagocytosis index was calculated as the percentage of monocytes exhibiting E. coli 402
ingestion as determined by fluorescence microscopy. Importantly, E. coli phagocytosis 403
of monocytes does not show significant differences, regardless of the isolation procedure 404
used (although positive selection was slightly superior (n=3, p>0.05) (Fig. 5A). Culturing 405
monocytes isolated by positive selection for 16 hrs instead of 2 hrs prior to phagocytosis 406
assay had no impact on E. coli phagocytic capacity, nor did the time of E.Coli challenge 407
(a 2:1 bacteria/monocytes ratio was employed to allow for a longer time of E. coli 408
on May 6, 2018 by guest
http://cvi.asm.org/
Dow
nloaded from

20
challenging without risking monocyte saturation) (Fig. 5B). The engulfment of E.coli by 409
monocytes rather than attachment to the cell surface was confirmed by confocal 410
microscopy (Fig. 5C and Supplementary movie 2). Importantly, we also observed active 411
phagocytosis of platelets and ghosts (Supplementary Fig. 1), potentially suggesting 412
competing effects between E. coli and platelets and stressing the importance of an 413
isolation procedure that does not yield such contaminants in the culture. Therefore, in 414
toto, the anti-CD14 antibody-conjugated magnetic microbeads (positive selection) 415
protocol appears the best suited monocyte isolation method for this type of phagocytosis 416
analysis. 417
418
on May 6, 2018 by guest
http://cvi.asm.org/
Dow
nloaded from

21
DISCUSSION 419
Although some studies into cell-populations may be performed on whole blood, thus 420
preventing the need for potentially cell-activating isolation procedures, for many studies, 421
including those on the involvement of granulocytes or monocytes in the pathogenesis of 422
autoimmune diseases, isolation of a pure population of cells is essential. Although all four 423
monocyte isolation procedures tested in this study yielded functional phagocytosis-424
competent monocytes, results with respect to purity and recovery are markedly different 425
for the different procedures. We view especially purity as a concern, as this may be 426
important for functional studies. We observed when challenging monocyte cultures with 427
FITC-labeled E. coli, that contaminating lymphocytes markedly compromise the 428
accuracy of phagocytosis quantification. This was due to two reasons: first, as a result of 429
the extremely similar morphology of monocytes and lymphocytes, quantifying the 430
percentage of phagocytosing monocytes by fluorescence microscopy is markedly 431
disturbed by lymphocyte contamination. Second, we observed that lymphocytes are also 432
able to adhere E. coli to their cell surface (data not shown), which may further hamper 433
quantification. This is especially obvious when monocytes are mixed with a large 434
population of lymphocytes (eg. PBMC) or a large amount of bacteria is loaded. 435
Furthermore, we observe that co-purified thrombocytes and cell ghosts are also subject to 436
phagocytosis, with unknown effects on monocyte physiology and thus possibly 437
compromising experimentation. In addition, it has been shown that isolating a pure cell 438
population is important for other functional studies of monocytes, e.g. antigen 439
presentation and cytokine production. For these reasons, isolation of monocytes 440
employing positive selection and anti-CD14 conjugated microbeads appears the 441
on May 6, 2018 by guest
http://cvi.asm.org/
Dow
nloaded from

22
technology of choice, at least for phagocytosis analysis. However, due to the high costs of 442
commercial reagents and required instruments for positive selection, in studies where the 443
purity of monocytes is not strictly required, traditional adherent isolation procedures 444
remain an option. For instance, in studies using monocyte-derived dendritic cells, the 445
lymphocyte contaminants may be less important as the latter will not survive for longer 446
than 1 week in the absence of IL2. 447
With respect to the absolute yields obtained, the RosetteSepTM comes out 448
superior, but does not yield pure cultures. The other technologies are comparable, 449
including the traditional adherence protocol, the latter is subject to substantial 450
experimentator- and day-to-day-dependent variability, hampering its application and 451
comparison of results. Negative selection yields less pure cultures and is more expensive 452
per monocyte and thus appears to be a less attractive choice. 453
Regarding PMN isolation, comparison of three widely used methods showed that 454
isolation by positive selection yielded isolates with the highest purity, followed closely by 455
Ficoll centrifugation. PolymorphprepTM isolates showed the highest impurities, which can 456
be problematic in certain experiments. Another considerable drawback in the use of 457
PolymorphprepTM is that relatively high purities can only be reached when using EDTA 458
as anticoagulation agent, which may not always be practical. Theoretically, the main 459
advantage of PolymorphprepTM is the elimination of erythrocyte lysis steps. However, red 460
blood cell contamination of the PMN ring is often observed (up to 6% of isolate, as per 461
manufacturer’s datasheet), and a mild yet potentially cell-activating lysis step may 462
therefore nonetheless be required. 463
on May 6, 2018 by guest
http://cvi.asm.org/
Dow
nloaded from

23
Isolates from positive selection methods showed the highest ROS production in 464
response to GM-CSF + fMLP treatment, which may imply that this method of isolation 465
induces the least desensitization of PMN. Hence, positive selection seems the method of 466
choice for studying ROS production, closely followed by Ficoll isolation. ROS 467
production is dependent on the actin cytoskeleton, in that disruption of actin 468
polymerization results in increased ROS levels [25]. As CD15 ligation may affect 469
cytoskeletal rearrangement, it is theoretically possible that positive selection using CD15 470
antibodies can enhance ROS production or affect phagocytosis. However, phagocytosis 471
of E. Coli was similar in all three methods tested, and fMLP-induced ROS production in 472
positively selected isolates was equal to that in isolates from Ficoll centrifugation, 473
indicating that CD15 engagement in positive selection procedures at least does not affect 474
these functions. Although no differences in the PMN activation marker CD62L were 475
observed, our results did clearly show an upregulation of the toll like receptors TLR2 and 476
TLR4 on PMN isolated by positive selection. Although this is not likely to affect either 477
the ROS production or E.Coli phagocytosis tested here, this increase may nevertheless 478
influence other cellular assays investigators into innate immunity may want to study. 479
Careful consideration of different neutrophil isolation techniques is therefore required for 480
every functional study considered by investigators, and may depend on the type of assay 481
desired. 482
In this study, we have compared 4 widely used monocyte isolation 483
procedures, and 3 commonly used granulocyte isolation methods. However, other 484
isolation procedures have been described that were not covered in this study. For 485
instance, monocytes may be isolated by CD14-positive selection in the magnet-based 486
on May 6, 2018 by guest
http://cvi.asm.org/
Dow
nloaded from

24
MagCellect system from R&D Systems. However, this company does not at this time 487
offer granulocyte isolation kits. In addition, using Elutra™ separator, isolates by which 488
monocytes are enriched on the basis of size and to a lesser extent density from an entire 489
apheresis product have been described to result in approximately 75% purity of 490
monocytes. However, this procedure requires an automated system, and may therefore 491
not be suitable for every laboratory. For granulocytes, EasySep® magnetic isolation kits 492
based on CD66 expression are available from Stemcell technologies. How these different 493
isolation procedures (CD15 versus CD66b positive selection) affect PMN cell function 494
remains to be investigated. 495
In conclusion, if high purity of cells is required, and limited cells are needed, we 496
would consider that PMN and monocyte isolation using positive selection is the most 497
suitable method. Where high purity of PMN or monocytes is not strictly required, Ficoll 498
density gradient centrifugation and the traditional adherent isolation procedure remain 499
good options for PMN and monocytes purification, respectively. However, investigators 500
into innate cell functions should be well aware of possible alterations in cell phenotypes 501
upon different isolation procedures, and the best isolation procedure may depend on the 502
assays planned to be used. 503
504
on May 6, 2018 by guest
http://cvi.asm.org/
Dow
nloaded from
25
Acknowledgement: G.M.F. was supported by the Dutch Cancer Society (grant EMCR 505
2010-4737). 506
507
on May 6, 2018 by guest
http://cvi.asm.org/
Dow
nloaded from

26
FIGURE LEGENDS 508
Figure 1. The purities of enriched granulocytes. (A) Representative flow cytometry 509
histograms (of n=4) showing the purity of enriched granulocyte isolates, obtained by 510
either 1) Ficoll density centrifugation, 2) anti-CD15 antibody conjugated magnetic 511
microbeads (positive selection), 3) Density centrifugation using PolymorphprepTM. 512
Histograms represent CD66b positive cells after gating for nucleated cells using forward 513
and sidescatter profiles. (B) The purities of granulocytes after isolation are expressed as 514
fraction of all cell-like particles (including nucleated cells, non-nucleated cells, and 515
ghosts) after enrichment. (C) Forward and side scatter plots of the enriched samples 516
showing the nature of contaminants as identified using traditional forward and side 517
scatter morphology. 518
519
on May 6, 2018 by guest
http://cvi.asm.org/
Dow
nloaded from

27
Figure 2. Functional testing of enriched granulocyte fractions. (A) Granulocytes 520
isolated by Ficoll density centrifugation, anti-CD15 antibody conjugated magnetic 521
microbeads (positive selection) or density centrifugation using PolymorphprepTM were 522
subjected to ROS production analysis. Stimulation with fMLP results in low production 523
of ROS, indicative of resting cells, whereas priming of cells with GM-CSF yields the 524
highest fMLP-induced ROS production in granulocytes isolated by CD15- microbeads 525
positive selection. Mean ± SEM of 6 experiments is shown. Asterisks indicate 526
significantly higher ROS production in GM-CSF+fMLP stimulated cells as compared to 527
fMLP alone (P<0.05). (B) Priming capacity was determined by expressing ROS 528
production in GM-CSF cells as a percentage of ROS production in unprimed, fMLP-529
stimulated granulocytes (Mean ± SEM of 6 experiments). (C) Enriched granulocytes 530
were challenged with FITC-expressing E.Coli for 15 min, after which FITC fluorescence 531
of isolates was determined by FACS analysis. Whole blood was used as positive control 532
(Mean ± SEM of 6 experiments). (D) Cell viability of enriched PMN was determined by 533
measuring the percentage of 7AAD positive PMN by flow cytometry. (Mean ± SEM of 6 534
experiments) 535
536
on May 6, 2018 by guest
http://cvi.asm.org/
Dow
nloaded from

28
Figure 3. Expression of cell surface markers on isolated granulocytes. 537
Granulocytes isolated by Ficoll density centrifugation, anti-CD15 antibody conjugated 538
magnetic microbeads (positive selection) or density centrifugation using 539
PolymorphprepTM were subsequently stained for CD62L, CD15, CD66b, CD64, CD16, 540
CD32, CD14, TLR2 and TLR4. Except for 7AAD staining, which was present in less 541
then 5% of PMN, all other markers were present on >98% of all isolated cells, and the 542
median fluorescence intensities of these markers was determined. Mean ± SEM of 6 543
experiments is shown. 544
545
on May 6, 2018 by guest
http://cvi.asm.org/
Dow
nloaded from

29
Figure 4. The purities of enriched monocytes. (A) Representative flow cytometry 546
histrograms (of n=3) showing the purity of enriched monocyte cultures, obtained by 547
either 1) anti-CD14 antibody conjugated magnetic microbeads (positive selection), (2) 548
non-monocyte depletion by antibody conjugated magnetic microbeads (negative 549
selection), (3) a classical adherence protocol, and (4) immunorosette based RosetteSepTM 550
antibody cocktail, as percentage of monocytes out of nucleated cells. (B) The purities of 551
monocytes after isolation are expressed as fraction of all cell-like particles (including 552
nucleated cells, non-nucleated cells, and ghosts) after enrichment. (C) Analysis of the 553
nature of contaminants in the enriched samples as identified using traditional forward and 554
side scatter methodology. (D) Monocytes purified by positive selection were stained for 555
CD14 and nuclei using anti-CD14 PE antibody (red) and DAPI (blue). 556
557
on May 6, 2018 by guest
http://cvi.asm.org/
Dow
nloaded from

30
Figure 5. Phagocytic capacity of monocytes. (A) Monocytes obtained through the 558
positive selection and negative selection procedures were challenged with FITC-labeled 559
E. coli for 5 minutes, in parallel. Phagocytosis of E. coli is expressed as the percentage of 560
monocytes displaying phagocytosis. E. coli phagocytosis of monocytes after the two 561
isolation procedures did not show significant difference, although the level of 562
phagocytosis in negative selection group is slightly lower (n=3, p>0.05, values were 563
presented with Mean±SEM) (B) After positive selection procedure, monocytes after 16 564
hour culture exhibit the same E. coli phagocytotic capacity compared to the 2 hour 565
culture (representative of 3 independent experiments). (C) A representative trans-566
sectional image of monocytes by confocal microscope confirming that E. coli are 567
engulfed rather by attached to monocytes, red: cytoskeleton of monocytes (F-actin) 568
stained by TRITC-phalloidin; green: FITC-labed E.coli. 569
570
on May 6, 2018 by guest
http://cvi.asm.org/
Dow
nloaded from

31
Reference List 571
572
(1) Bengtsson, T., Orselius, K., Wettero, J. 2006. Role of the actin cytoskeleton during 573
respiratory burst in chemoattractant-stimulated neutrophils. Cell. Biol. Int. 30: 574
154-163. 575
(2) Braat, H., Peppelenbosch, M.P., Hommes, D.W. 2006. Immunology of Crohn's 576
disease. Ann. N. Y. Acad. Sci. 1072: 135-154. 577
(3) Carroll, M. 2001. Innate immunity in the etiopathology of autoimmunity. Nat. 578
Immunol. 2: 1089-1090. 579
(4) Casanova, J.L., Abel, L. 2009. Revisiting Crohn's disease as a primary 580
immunodeficiency of macrophages. J Exp Med. 206:1839-1843. 581
(5) Cooney, R., Baker, J., Brain, O., Danis, B., Pichulik, T., Allan, P., Ferguson, 582
D.J., Campbell, B.J., Jewell, D., Simmons, A. 2010. NOD2 stimulation induces 583
autophagy in dendritic cells influencing bacterial handling and antigen 584
presentation. Nat Med.16:90-97. 585
(6) Cross, A., Bucknall, R.C., Cassatella, M.A., Edwards, S.W., Moots, R.J. 2003. 586
Synovial fluid neutrophils transcribe and express class II major histocompatibility 587
complex molecules in rheumatoid arthritis. Arthritis. Rheum. 48: 2796-2806. 588
(7) Freundlich, B., Avdalovic, N. 1983. Use of gelatin/plasma coated flasks for 589
isolating human peripheral blood monocytes. J. Immunol. Methods 62: 31-37. 590
on May 6, 2018 by guest
http://cvi.asm.org/
Dow
nloaded from

32
(8) Fuhler, G.M., Blom, N.R., Drayer, A.L., Vellenga, E. 2007. The reduced GM-591
CSF priming of ROS production in granulocytes from patients with 592
myelodysplasia is associated with an impaired lipid raft formation. J. Leuk. Biol. 593
81: 449-457 594
(9) Fuhler, G.M., Hooijenga, F., Drayer, A.L., Vellenga, E. 2003. Reduced 595
expression of flavocytochrome b558, a component of the NADPH oxidase 596
complex, in neutrophils from patients with myelodysplasia. Exp. Hematol. 31: 597
752-759. 598
(10) Geissmann, F., Gordon, S., Hume, D.A., Mowat, A.M., Randolph, G.J. 2010. 599
Unravelling mononuclear phagocyte heterogeneity. Nat. Rev. Immunol.10: 453-600
460. 601
(11) Haslett, C., Guthrie, L.A., Kopaniak, M.M., Johnston, R.B., Jr., Henson, 602
P.M. 1985. Modulation of multiple neutrophil functions by preparative methods 603
or trace concentrations of bacterial lipopolysaccharide. Am. J. Pathol.119: 101-604
110. 605
(12) Haziot, A., Hijiya, N., Gangloff, S.C., Silver, J., Goyert, S.M. 2001. Induction 606
of a novel mechanism of accelerated bacterial clearance by lipopolysaccharide in 607
CD14-deficient and Toll-like receptor 4-deficient mice. J Immunol 166:1075-608
1078. 609
(13) Hakkim, A., Fürnrohr, B.G., Amann. K., Laube, B., Abed, U.A., Brinkmann, 610
V., Hermann, M., Voll, R.E., Zychlinsky, A. 2010. Impairment of neutrophil 611
on May 6, 2018 by guest
http://cvi.asm.org/
Dow
nloaded from

33
extracellular trap degradation is associated with lupus nephritis. Proc. Natl. Acad. 612
Sci. USA. 107; 9813-9818. 613
(14) Kaplan, M.J. Neutrophils in the pathogenesis and manifestations of SLE. 2011. 614
Nat Rev. Rhematol. 7: 691-699. 615
(15) Katsiari, C.G., Liossis, S-N.C., Sfikakis, P.P. 2010. The pathophysiological role 616
of monocytes and macrophages in systemic lups erythematosus: a reappraisal. 617
Sem. Art. Rheum. 39: 491-503. 618
(16) Kerr, M.A., Stocks, S.C. 1992. The role of CD15-(Le(X))-related carbohydrates 619
in neutrophil adhesion. Histochem. J. 24: 811-826. 620
(17) Leijh, P.C., van den Barselaar, M.T., van Furth R. 1981. Kinetics of 621
phagocytosis and intracellular killing of Staphylococcus aureus and Escherichia 622
coli by human monocytes. Scan. J. Immunol. 13: 159-174. 623
(18) Li, Y., Lee, P.Y., Reeves, W.H. 2010. Monocyte and macrophage abnormalities in 624
systemic lupus erythematosus. Arch. Immunol. Ther. Exp. 58: 355-364. 625
(19) Mandell, G.L., Hook, E.W. 1969. Leukocyte function in chronic granulomatous 626
disease of childhood. Studies on a seventeen year old boy. Am. J. Med. 47: 473-627
486. 628
(20) Marks, D.J., Harbord, M.W., MacAllister, R., Rahman, F.Z., Young, J., Al-629
Lazikani, B., Lees, W., Novelli, M., Bloom, S., Segal, A.W. 2006. Defective 630
on May 6, 2018 by guest
http://cvi.asm.org/
Dow
nloaded from

34
acute inflammation in Crohn's disease: a clinical investigation. Lancet 367: 668-631
678. 632
(21) Nemeth, T., Mócsai, A. 2012. The role of neutrophils in autoimmune diseases. 633
Immunol Lett. DOI10.1016/j.imlet.2012.01.013. 634
(22) Radsak, M., Iking-Konert, C., Stegmaier, S., Andrassy, K., Hansch, G.M. 635
2000. Polymorphonuclear neutrophils as accessory cells for T-cell activation: 636
major histocompatibility complex class II restricted antigen-dependent induction 637
of T-cell proliferation. Immunology 101: 521-530. 638
(23) Rumsey, J., Valentine, J.F., Naser, S.A. 2006. Inhibition of phagosome 639
maturation and survival of Mycobacterium avium subspecies paratuberculosis in 640
polymorphonuclear leukocytes from Crohn's disease patients. Med. Sci. Monit. 641
12: BR130-BR139. 642
(24) Smith, A.M., Rahman, F.Z., Hayee, B., Graham, S.J., Marks, D.J., Sewell, 643
G.W., Palmer, C.D., Wilde, J., Foxwell, B.M., Gloger, I.S., Sweeting, T., 644
Marsh, M., Walker, A.P., Bloom, S.L., Segal, A.W. 2009. Disordered 645
macrophage cytokine secretion underlies impaired acute inflammation and 646
bacterial clearance in Crohn's disease. J Exp Med. 206:1883-1897. 647
(25) Solis-Herruzo, J.A., Fernandez, B., Vilalta-Castell, E., Munoz-Yague, M.T., 648
Hernandez-Munoz, I., de la Torre-Merino, M.P., Balsinde, J. 1993. 649
Diminished cytochrome b content and toxic oxygen metabolite production in 650
on May 6, 2018 by guest
http://cvi.asm.org/
Dow
nloaded from

35
circulating neutrophils from patients with Crohn's disease. Dig. Dis. Sci. 38: 651
1631-1637. 652
(26) Toledo, K.A., Scwartz, C., Oliveira, A.F., ConrodaM.C., Bernardes, E.S., 653
Fernandes, L.C., Roqua-Barreira M.C., Pereira-da-Silva, G., Moreno, A.N. 654
2009. Neutrophil activation induced by ArtinM: release of inflammatory 655
mediators and enhancement of effector functions. Immunol. Lett. 123: 14-20. 656
(27) van Beelen, A.J., Zelinkova, Z., Taanman-Kueter, E.W., Muller, F.J., Hommes, 657
D.W., Zaat, S.A., Kapsenberg, M.L., de Jong, E.C. 2007. Stimulation of the 658
intracellular bacterial sensor NOD2 programs dendritic cells to promote 659
interleukin-17 production in human memory T cells. Immunity 27: 660-669. 660
(28) Wipke, B.T., Allen, P.M. 2001. Essential role of neutrophil in the initiation and 661
progression of a murine model of rheumatoid arthritis. J. Immunol. 167:1601-662
1608/ 663
(29) Yona, S., Jung,S. 2010. Monocytes: subsets, origins, fates and functions. Curr. 664
Opin. Hematol. 17: 53-59. 665
(30) Zhou, L., Braat, H., Faber, K.N., Dijkstra, G., Peppelenbosch, M.P. 2009. 666
Monocytes and their pathophysiological role in Crohn's disease. Cell. Mol. Life 667
Sci. 66: 192-202. 668
(31) Zoetendal, E.G., Ben-Amor, K., Harmsen, H.J., Schut, F., Akkermans, A.D., 669
de Vos, W.M. 2002. Quantification of uncultured Ruminococcus obeum-like 670
bacteria in human fecal samples by fluorescent in situ hybridization and flow 671
on May 6, 2018 by guest
http://cvi.asm.org/
Dow
nloaded from

36
cytometry using 16S rRNA-targeted probes. Appl. Environ. Microbiol. 68: 4225-672
4232. 673
on May 6, 2018 by guest
http://cvi.asm.org/
Dow
nloaded from
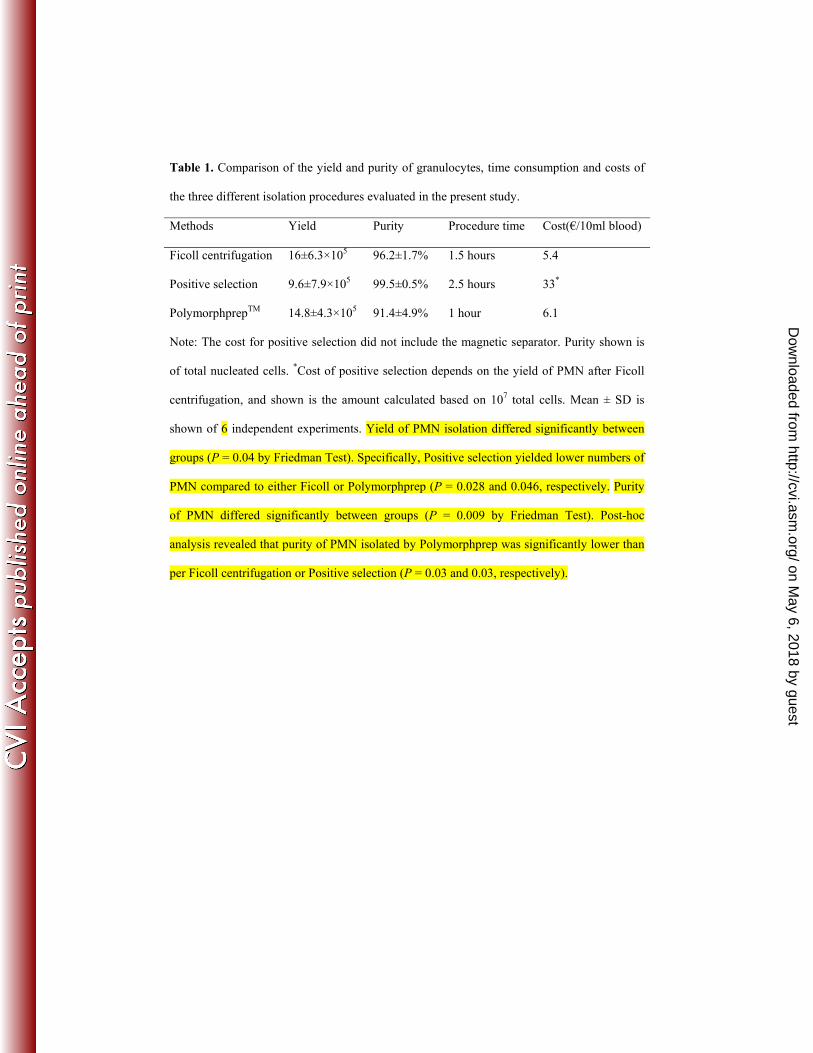
Table 1. Comparison of the yield and purity of granulocytes, time consumption and costs of
the three different isolation procedures evaluated in the present study.
Methods Yield Purity Procedure time Cost(€/10ml blood)
Ficoll centrifugation 16±6.3×10⁵ 96.2±1.7% 1.5 hours 5.4
Positive selection 9.6±7.9×10⁵ 99.5±0.5% 2.5 hours 33*
PolymorphprepTM 14.8±4.3×10⁵ 91.4±4.9% 1 hour 6.1
Note: The cost for positive selection did not include the magnetic separator. Purity shown is
of total nucleated cells. *Cost of positive selection depends on the yield of PMN after Ficoll
centrifugation, and shown is the amount calculated based on 107 total cells. Mean ± SD is
shown of 6 independent experiments. Yield of PMN isolation differed significantly between
groups (P = 0.04 by Friedman Test). Specifically, Positive selection yielded lower numbers of
PMN compared to either Ficoll or Polymorphprep (P = 0.028 and 0.046, respectively. Purity
of PMN differed significantly between groups (P = 0.009 by Friedman Test). Post-hoc
analysis revealed that purity of PMN isolated by Polymorphprep was significantly lower than
per Ficoll centrifugation or Positive selection (P = 0.03 and 0.03, respectively).
on May 6, 2018 by guest
http://cvi.asm.org/
Dow
nloaded from

Table 2. Comparison of the yield and purity of monocytes, time consumption and costs of the
four different isolation procedures evaluated in the present study.
Methods Yield Purity Procedure time Cost (€/10 ml blood)
Positive selection 2.2±0.3×10⁵ 98.5±0.4% 2.5 hours 23
Negative selection 2.2±0.3×10⁵ 97±0.7% 3 hours 26
Adherence 1.9±0.6×10⁵ 67.3±3.6% 4 hours 8
RosetteSep® 4.2±0.6×10⁵ 64.2±4.3% 1.5 hours 46
Note: The cost for positive selection and negative selection did not include the magnetic
separator. The yield of monocytes enriched by adherence was shown for the optimal washing
condition. Purity shown is of total nucleated cells. Mean of 5 experiments ± SD is shown. The
yield and purity of monocytes were significantly different among procedures (P = 0.009 and
P = 0.001, respectively by Kruskal-Wallis test).
on May 6, 2018 by guest
http://cvi.asm.org/
Dow
nloaded from


![Hematological malignancies - БГМУHematological malignancies Leukemia is a malignant proliferation of white blood cells (lymphoid cells [lymphocytes] or myeloid cells [granulocytes](https://static.fdocuments.us/doc/165x107/5f0624c37e708231d416825d/hematological-malignancies-oe-hematological-malignancies-leukemia-is-a-malignant.jpg)