
How the Fed’s Asymmetric Policy in 200 Led to a Panic in 2008dandolfa/Espinosa.pdf · 55 Chai...
40
55 Chain Reaction How the Fed’s Asymmetric Policy in 2003 Led to a Panic in 2008 Diego Espinosa 3 My daughter came home from school one day and said, “Daddy, what’s a financial crisis?” And without trying to be funny, I said, “It’s the type of thing that happens every five, ten, seven, years.” And she said: “Why is everybody so surprised?” So we shouldn’t be surprised . . . —JPMorgan CEO Jamie Dimon THE U. S . ECONOMY has been subject to many financial crises over the past thirty years. In the 1980s, there was the Latin debt crisis, the sav- ings & loan crisis, and a major stock market crash. In the 1990s, there was a credit crunch and a bond market crisis, followed a few years later by the stock market crash of the early 2000s. All of these events are evidence that JPMorgan Chase & Co. CEO Jamie Dimon could point to in support of his view that financial crises are not uncommon in the United States. 1 Yet in an important way, Dimon was wrong. What happened in 2008 was more than just a finan- cial crisis; it was a banking panic. Banking panics are systemic events that adversely affect an entire economy. ey are often associated with deflation and debt restructuring that can take years to resolve. None of the “crises” discussed above, however, led to a systemic panic. In fact, such panics have been absent from the U.S. economy since the early 1930s. is relative finan- cial stability, however, came to a screeching halt in 2008. Why this sudden 1. Video, Testimony of Jamie Dimon before the Financial Crisis Inquiry Commission, January 13, 2010.
Transcript of How the Fed’s Asymmetric Policy in 200 Led to a Panic in 2008dandolfa/Espinosa.pdf · 55 Chai...

55
Chain Reaction
How the Fed’s Asymmetric Policy
in 2003 Led to a Panic in 2008
Diego Espinosa
3
My daughter came home from school one day and said, “Daddy, what’s a financial crisis?” And without trying to be funny, I said, “It’s the type of thing that happens every five, ten, seven, years.” And she said: “Why is everybody so surprised?” So we shouldn’t be surprised . . . —JPMorgan CEO Jamie Dimon
t he u.s. econom y has been subject to many financial crises over the past thirty years. In the 1980s, there was the Latin debt crisis, the sav-ings & loan crisis, and a major stock market crash. In the 1990s, there was a credit crunch and a bond market crisis, followed a few years later by the stock market crash of the early 2000s. All of these events are evidence that JPMorgan Chase & Co. CEO Jamie Dimon could point to in support of his view that financial crises are not uncommon in the United States.1 Yet in an important way, Dimon was wrong. What happened in 2008 was more than just a finan-cial crisis; it was a banking panic. Banking panics are systemic events that adversely affect an entire economy. They are often associated with deflation and debt restructuring that can take years to resolve. None of the “crises” discussed above, however, led to a systemic panic. In fact, such panics have been absent from the U.S. economy since the early 1930s. This relative finan-cial stability, however, came to a screeching halt in 2008. Why this sudden
1. Video, Testimony of Jamie Dimon before the Financial Crisis Inquiry Commission, January 13, 2010.

56 | Chain Reaction
change? What caused the end of the seventy-plus–year run of no systemic banking panics in the United States?
In this paper, I argue that the root cause of the 2008 banking panic was a change in the character of the U.S. Federal Reserve (“the Fed”) monetary policy in 2002–2003, the years when the Fed extended the goals of policy to a guarantee that deflation would not occur. In support of that goal, and for the first time, the Fed signaled it would do the following: always provide liquidity to protect the financial system from a precipitous fall in asset prices; keep interest rates low for a long time; and afterwards, only raise rates at a predictable pace. These promises created new incentives that changed the workings of the U.S. financial system in three important ways.
First, investors within the shadow banking system responded by crafting an optimal investment portfolio: not one with risky assets, but one with low-risk, collateralized assets. For the Fed had just told them that they could make a predictable spread on safe investments and depend on the liquidity of the collateral to mitigate risk. Consequently, these “banks” went to the financial system and said, “Please send us more low-risk assets to invest in.” The finan-cial system—in particular, large banks and investment houses—responded by taking loans and converting them into largely AAA-rated securities through the production process of structured finance, i.e., tranching and pooling.
Second, at the other end of the financial system, where credit originated, the signal was clear: “Send us more loan ‘raw material’ to convert to AAA.” The suppliers of subprime, Alt-A, home equity and commercial mortgages responded by ramping up origination volumes. They could only do so, how-ever, by lowering underwriting standards. Falling standards and low-payment loans effectively minted new buyers, creating higher demand, higher prices, lower defaults, and justification for even lower standards.
Finally, the result was the ballooning of portfolios invested in processed AAA-rated securities. The missing element in the optimal portfolio was lever-age, for leverage transformed meager returns into attractive ones. To lever the portfolios, the shadow banking system used repo (and other short-term) funding in a form of “carry trade.” Essentially, they accessed overnight repo “deposits” that were collateralized with the same processed AAA-rated securi-ties. It was concern over the safety of this repo collateral—concern sparked by

Diego Espinosa | 57
rising delinquencies—that set off the modern-day version of a run on bank deposits, which in turn led to the banking panic (Gorton 2010).2
It is important to note that these changes had underpinnings that were not new. The originate-and-securitize model for asset-backed securities existed since the mid-eighties without causing much instability. Wall Street greed has always been with us. Low-income-housing incentives had been in place for decades. The repo market dates back to the eighties. Arguably, the com-petence of banking system regulators did not change, nor did their lack of immunity to “regulatory capture.” The credit cycle existed during the entire post-FDIC era without producing a banking panic. Finally, the government-sponsored enterprises (“GSEs”)—Fannie Mae and Freddie Mac—that were important purchasers of subprime securities, had been around for decades. Though these factors were necessary conditions for the boom-bust cycle in the financial system to occur, they did not combine to form a reaction until a catalyst appeared. That catalyst was a change in Fed policy.
In the sections that follow, I explain how the Fed’s actions led to the build - up of financial system fragility that eventually paved the way for the bank-ing panic. The focus is on tracing the ripple effects of Fed policy through the system, from the creation of shadow bank investment portfolios to the formulation of lending standards and, ultimately, to the run on the liabilities of the shadow banking system.
The Fed’s New Role: Carry Trade Enabler
One of the difficult parts of any Fed official’s job is to weather perennial second-guessing over the Fed’s policy stance. The experience of the last decade is no exception, as some blame the Fed for causing the housing bubble by holding rates down below optimal “rules-based” levels when emerging from the 2001 recession, while others argue that the Fed tightened too much after 2005 and precipitated the crisis. This type of criticism—too easy/too tight—is something that could be leveled at any Fed at any time during its existence.
2. Gary Gorton, Slapped by the Invisible Hand: The Panic of 2007 (New York: Oxford Uni-versity Press: 2010).

58 | Chain Reaction
It therefore misses the fact that, early in the decade, the Fed was engaging in something new, a change in the character of policy that also gave birth to a different set of risks for the financial system. This “new thing” was the Fed’s attempt to fight deflation by making a set of commitments about future policy actions to the financial markets.
The genesis for the Fed’s policy change was the fall in U.S. core inflation that occurred after the 2001 recession, coupled with the consensus percep-tion that the Bank of Japan, by allowing deflation, was responsible for Japan’s painful “lost decade.” As it had following previous episodes, U.S. core CPI steadily declined in the months following the 2001 recession. The difference was that core inflation started from a lower base, so that by April of 2003, the economy experienced three consecutive months of zero or near-zero core CPI. The fall in inflation was ominous in the wider context of Japan. Regarding the threat of deflation in the United States, the Fed Chairman Ben Bernanke wrote in a 2002 speech: “That this concern is not purely hypothetical is brought home to us whenever we read newspaper reports about Japan, where what seems to be a relatively moderate deflation—a decline in consumer prices of about 1 percent per year—has been associated with years of painfully slow growth. . . . While it is difficult to sort out cause from effect, the consensus view is that deflation has been an important negative factor in the Japanese slump.”3
Given this “consensus view” and the deflationary threats of Long-Term Capital Management (“LTCM”) in 1998, the 2000 Nasdaq crash, the 2001 recession, and the 9/11 attacks, it is no surprise that the Fed adopted an explicit policy of fighting not only deflation, but deflation risk. The result was twofold:
First, monetary policy became asymmetric in support of asset prices. The Fed promised to make deflation fighting its priority, and to keep it that way as long as the deflationary environment persisted. Steep asset market corrections signal heightened deflationary risk. So, logically, markets should expect the Fed to ease aggressively in reaction to asset market sell-offs. In Bernanke’s words: “As suggested by a number of studies, when inflation is already low and the fundamentals of the economy suddenly deteriorate, the central bank should act more preemptively and more aggressively than usual
3. Ben S. Bernanke, “Deflation: Making Sure ‘It’ Doesn’t Happen Here,” (speech, Na-tional Economists Club, Washington, D.C., 2002).

Diego Espinosa | 59
in cutting rates. . . . By moving decisively and early, the Fed may be able to prevent the economy from slipping into deflation, with the special problems that entails.”4 Admittedly, the market’s idea of a commitment by the Fed to ease in response to falling asset prices dates back to former Fed Chair-man Alan Greenspan’s rapid intervention following the stock market crash of 1987, followed by similar actions taken during the 1998 LTCM crisis. This “Greenspan Put,” however, was now a more identifiable policy rationale for defending asset prices—avoiding deflation risk. The Fed itself admitted that inflation-fighting did not require capping asset prices. In the market’s mind, this asymmetry led to the natural expectation that the Fed would support asset prices but not “pop” bubbles. Further, as long as deflation risk prevailed, even slow growth was a reason to hold rates down.
Second, the Fed became much more explicit in defining the path of pol-icy. In an effort to shape expectations, the Fed began to tell markets what it planned to do under a reasonable range of forecasts. This was new. Prior to 1999, the Fed gave very little information about the future path of policy beyond an intermeeting bias toward easing or firming. Following the LTCM crisis, the Fed moved to an indication of whether the balance of risks in the economy was weighted toward inflation or a slowdown. In May 2003, the Fed highlighted the risk of an “unwelcome substantial fall in inflation,” and moved toward longer-term guidance on its deflation-fighting plans. Despite a relatively benign view on economic growth prospects, the Committee stated that be-cause of the potential for deflation, the balance of risks was “weighted towards weakness over the foreseeable future.” By August, the Committee had explicitly committed to interest rates staying low for a “considerable period.”5 In a July speech, Bernanke thought the change in communications tactics important enough to highlight:
A crucial element of the statement was an implicit commitment about future monetary policy; namely, a strong indication that . . . monetary policy will maintain an easy stance. Particularly at very low inflation rates, a central bank’s ability to make clear and credible commitments
4. Bernanke, “Deflation.”5. FOMC meeting statement (August 12, 2003), http://www.federalreserve.gov/board docs/press/monetary/2003/20030812/default.htm
60 | Chain Reaction
about future policy actions . . . is crucial for influencing longer-term inter-est rates and other asset prices, which are themselves key transmission channels of monetary policy. . . . [with] short-term nominal interest rates are at historical lows, the success of monetary policy depends more on how well the central bank communicates its plans and objectives than on any other single factor.6 [Emphasis added]
Bernanke, above, specifically cites long-term interest rates and asset prices as the target of the Fed’s new approach. How exactly would a “clear and cred-ible commitment” affect those targets? He doesn’t say, but it is reasonable to assume that a mechanism for translating the commitment into both lower long-term rates and higher asset prices is what traders call the “carry trade.”
A carry trade is simply when a speculator borrows overnight in a low- yielding currency to invest in an asset with a higher return. There are essen-tially two types of carry trades involving low-risk assets. The first involves exploiting “maturity transformation,” or the spread between very short dura-tion funding and a longer-term investment—in essence, the yield curve. A hedge fund might borrow overnight from a prime broker at just over 1 percent and invest in five-year Treasuries at over 3 percent—an unlevered spread of around two percentage points, one that could produce returns of 20 percent with leverage of ten times. The risk for this trade was the possibility that the Fed would raise short-term rates faster than anticipated, or so-called “duration risk.” The second takes advantage of “liquidity transformation,” or using over-night funding to invest in a longer-maturity floating-rate asset. For example, the off-balance sheet vehicle (a conduit or “SIV”) of a commercial bank might use commercial paper paying LIBOR+.25 percent to fund AAA-rated CDOs (along with a fixed-to-floating interest rate swap) paying LIBOR+.75 percent. The small spread of .50 percent in that admittedly simplified example could produce returns of 15 percent with leverage of thirty times. In this case the risk to the trade was “liquidity risk,” or the inability to roll over short-term funding, which would force the trader to liquidate the longer-term maturity asset at a discount.
6. Ben S. Bernanke (remarks made before the Economics Roundtable, University of California, San Diego, La Jolla, California, 2003).
Diego Espinosa | 61
How did the Fed’s policy commitments affect these carry trades? To a banker, a central bank’s commitment to hold down rates is an attractive in-ducement to make a marginal loan. To a speculator, the effect of the commit-ment is an order of magnitude greater. It provides the fundamental rationale for entering into a trade. Getting direction and timing right equals profit, and the Fed was almost guaranteeing the timing of the trade. Using the maturity transformation carry trade example above, a promise by the Fed not to raise rates quickly effectively removed much of the key risk (duration risk) during the period covered by the Fed’s promise. In the liquidity transformation ex-ample, the Fed’s promise to ease—thus providing liquidity for sales of longer maturity assets—also seemingly erased much of that trade’s risk (liquidity risk) for that time. Moreover, by seeming to want to support asset prices, the Fed was also virtually eliminating the already-low risk that AAA-rated col-lateral might suffer a ratings downgrade in the period. The result of each of these factors was that carry traders could employ more and more leverage as they gained faith in the Fed’s commitments.
In the Fed’s own view, the May 2003 change in communications strategy was successful in setting market expectations. Vince Reinhart, a Fed econo-mist, offered the FOMC an update on the behavior of Fed funds futures—the market’s predictions about future Fed rate actions—during the September 2003 meeting.7 In it, he describes how the volatility of expected Fed funds rates has fallen, and how it tends to be stable even in the face of positive economic data. The markets now expect the Fed to keep rates steady for about one year. He concludes: “Taken together, this suggests that the Committee has been able to anchor expectations about the very near term course of policy—in effect making them less volatile and less sensitive to revisions to the expected path of the economy.”
In other words, asymmetric policy was having a direct impact on market expectations; because that was the case, it follows that traders would act on these same expectations. The carry trade was “on.”
Various Fed officials have countered the charge that they fueled specula-tion by pointing out that much of the “froth” occurred when the Fed was
7. Transcript, FOMC Meeting, September 16, 2003, 75.”

62 | Chain Reaction
already raising rates. However, this ignores the character of carry trades that we outlined above. As long as markets could predict when and how the Fed would raise rates, the timing was still a known variable and duration risk was manageable. In fact, this was the effect of the Fed’s “measured pace” language in describing future rate hikes. Interestingly, the FOMC debated the beneficial impact of the words “measured pace” on financial markets for twenty-five pages of the roughly one hundred pages of the May 5, 2004, FOMC meeting transcripts. Changing the behavior of financial markets was not a by-product of Fed policy; rather, it was the intended effect. Douglas Diamond and Raghuram Rajan reach a similar conclusion: 8
Our model suggests that the crisis of 2007–2009 may not be unrelated to the actions of the Federal Reserve earlier in the decade, not only in con-vincing the market that interest rates would remain low for a sustained period following the dot-com bust because of its fears of deflation, but also in promising to intervene to pick up the pieces in case of an asset price collapse—the so-called Greenspan put. The behavior of the central bank may have contributed to bank investment in illiquid assets (the now infamous mortgage-backed securities as well as vehicles such as SIVs and conduits) as well as bank leverage. . . .
Think of the Fed’s actions in the context of insurance. Traders make deci-sions based on simplified concepts about expected future events—narratives of likely cause and effect, or heuristics. Without these narratives, the sheer com-plexity of future scenarios, and “unknown unknowns,” would swamp traders’ abilities to make decisions.9 This doesn’t mean that traders totally ignore tail risk (the risk that an asset or portfolio of assets will move more than three standard deviations away from its current price); instead, they hedge against it with some form of insurance. Excess liquidity on an investment-bank balance
8. Douglas W. Diamond and Raghuram Rajan, “Illiquidity and interest rate policy” (NBER Working Paper 15197, 2009), 33, http://www.nber.org/papers/w151979. “Knightian Uncertainty and the Resilience-Stability Trade-off,” Macroeconomic Resilience Blog, January 30, 2010, http://www.macroresilience.com/2010/01/30/knightian -uncertainty-and-the-resilience-stability-trade-off/

Diego Espinosa | 63
sheet, for instance, is insurance against unknown future systemic risk, as is the decision by a hedge fund to maintain sub-optimal leverage or days-to-liquidate.
In a deflationary environment, the problem is that hedging activity can create an adverse feedback loop, one in which traders hedge against uncer-tainty by reducing leverage, which begets asset sales and lower prices, which create margin calls and further reduces leverage, all leading to lower velocity and ever higher deflation risk. So it is logical to believe that the Fed’s com-munication strategy targeted, directly, the appetite of carry traders for insur-ance in order to reduce deflation risk. In doing so, it rendered the system less liquid, more levered, and more susceptible to tail risk.
The above discussion is somewhat academic, but my personal experience during the time of the crisis is that the Greenspan Put (later the “Fed Put”) heuristic was dominant during the decade. “Negative skew” bets were the norm from 2003–2007; that is, traders sought out low-volatility assets and levered them up to the hilt, and in return accepted the tail risk of being wiped out—after all, the Fed stood ready to prevent that tail “event” from occurring. To an investor in shadow banking institutions, negative skew bets seemed like “safe” forms of arbitrage; products of the genius of the carry traders. These investors shunned vehicles with volatile returns and poured more funds into carry trade vehicles, which in turn helped “squeeze out” more and more (downside) volatil-ity. In this environment, shorting credit or stocks was the truly “risky” trade.
Now that the carry trade and the Fed’s potential effect on it have been outlined, the question remains: who were the carry traders? In 2003, “carry trade” could be used to describe the activity of the so called shadow banking system: hedge funds, off-balance sheet special investment vehicles (“SIVs”) and conduits, investment bank prime brokerage and prop desks, and non-bank mortgage originators. All of these shadow bank components were created explicitly to employ leverage to profit from the potential spread between short-term funding and long-term assets.
The point is that while the business of the banking system is banking, the business of the shadow banking system is speculation through carry trades. It was this horsepower that the Fed harnessed in pursuit of its deflation-fighting goals. What was the impact on the shadow banking system itself?
64 | Chain Reaction
Impact on the Shadow Banking System: A Marked Acceleration in Asset Growth
The thesis that Fed policy fueled the carry trade implies there should have been a rather distinct kink—an acceleration in growth—in the charts depict-ing shadow banking system assets around 2002, when the Fed first made deflation fighting its priority. We will now look at the asset growth of three shadow banking system components: investment banks, mortgage originators, and hedge funds.
Investment Banks
The locus of the financial panic was investment bank balance sheets, in-cluding the investment banking portion of large commercial banks. Lehman Brothers and Bear Stearns obviously failed, but concerns also surfaced over the viability of Merrill Lynch, Morgan Stanley, and Citigroup during the fall of 2008, not to mention non-U.S. institutions such as UBS.
Investment banks were a critical part of the shadow banking system. They were, in fact, the “factory” that produced carry trade securities. As a by-product of securitization, investment bank balance sheets held securities that were in the process of being sold. Given the short holding period needed to securitize a pool of assets, we can assume that this activity was not the major contributor to investment bank balance sheet growth. Instead, two other activities were mostly responsible: carry trade assets that were held either short term (classi-fied as “trading” or “held for sale”) or long term (classified as “held for invest-ment”). Diamond and Rajan, when examining bank holdings of mortgage securities, came to a similar conclusion: “The amounts of MBS held seemed too high to be purely inventory. Some holdings could have been portions of the package they could not sell, but then this would not explain why banks held on to AAA-rated securities, which seemed to be the most highly demanded of mortgage-backed securities. The real answer seems to be that bankers thought these securities were worthwhile investments, despite their risk.”10
10. Douglas W. Diamond and Raghuram Rajan, “The Credit Crisis: Conjectures about Causes and Remedies” (NBER Working Paper 14739, 2009), 4. http://www.nber.org/ papers/w14739.

Diego Espinosa | 65
As stated earlier, we use as evidence of the Fed’s impact the timing of any acceleration in the expansion of bank balance sheets. Figure 3.1 shows that total assets for the largest stand-alone investment banks (Lehman Brothers, Morgan Stanley, Goldman Sachs, Merrill Lynch, and Bear Stearns) did, in fact, reach an inflection point as the Fed adopted asymmetric policy.
Assets grew by about 60 percent from 1997 to 2002, and in the next five years they climbed 140 percent. The percentage growth, however, does not tell the whole story. By the end of the second period, assets were 45 percent of bank credit compared with 17 percent in 2002. The post-asymmetric-policy asset growth was—relative to the traditional banking system—much stronger.
Some would argue that a 2004 rule change relaxing leverage requirements drove investment bank growth. While important, this rule change did not hap-pen in a vacuum: It was requested by the securities firms themselves (arguing
Figure 3.1. Total Assets of Major Stand-alone Investment BanksSource: Company SEC filings, Federal Reserve H.8 Report
4500
4000
3500
3000
2500
2000
1500
1000
500
0
Tot
al a
sset
s as a
% o
f ban
k cr
edit T
otal assets in $$ billions
Ibank Total Assets % of Bank Credit
60%
50%
40%
30%
20%
10%
0
Figure 3.1
1997 1998 1999 2000 2001 2002 2003 2004 2005 2006 2007

66 | Chain Reaction
leverage ceilings put them at a disadvantage versus European Union competi-tors), and it came on the back of strong asset growth, rather than preceding it. The impact of the rule change was significant in some cases and negligible in others. Bear Stearns, for instance, maintained gross leverage of around 28 throughout the period (until it jumped in 2007 due to write-offs). Goldman Sachs, on the other hand, saw its leverage climb from 17 in 2002 to 26 in 2007.
We also note that Figure 3.1 counters the commonly heard argument that the “originate and securitize” model provided an incentive for securitizers to reduce lending standards. As was the case with the mortgage originators (see “Mortgage Originators” section below), securities firms were retaining sig-nificant exposure to securitized assets through carry trades. Merrill Lynch, for instance, had approximately $27 billion of (mostly AAA-rated) subprime collateralized debt obligations (CDO) and ABS exposure in the months lead-ing up to its sale to Bank of America. Clearly, it had an incentive to construct quality CDO portfolios.
Hedge Funds
Hedge funds are the most unfettered of the classes of carry traders we exam-ine. They are somewhat constrained by the broad mandate they use to attract funds—macro, fixed income, long-short equity, etc. Beyond that, they are free to invest in whatever the manager chooses. Hedge funds are also components of the shadow banking system in that they lever themselves with short-term collateralized funding (from investment banks) and supply funds for longer-dated securities.
Not all hedge funds employ pure carry-trade strategies, but even the ones that do not employ them saw their activities lubricated by the carry trade. For example, corporations drew on low-cost, bridge financing from investment banks to complete mergers; “event” hedge funds, in turn, profited from engag-ing in a related “merger arbitrage” equity trade. Perhaps more important, all hedge funds were able to borrow more cheaply and readily from investment bank prime brokerage arms, which in turn funded themselves using overnight repos. As evidence of the importance of hedge funds to their lenders, we note that Fitch Ratings (2005) estimated that hedge funds drove up to 25 percent of the earnings of the larger investment banks.
Diego Espinosa | 67
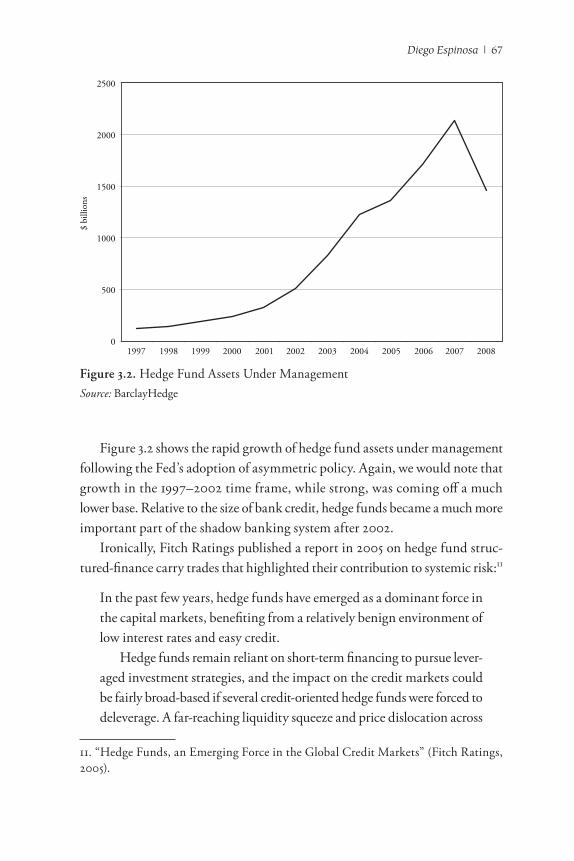
Figure 3.2 shows the rapid growth of hedge fund assets under management following the Fed’s adoption of asymmetric policy. Again, we would note that growth in the 1997–2002 time frame, while strong, was coming off a much lower base. Relative to the size of bank credit, hedge funds became a much more important part of the shadow banking system after 2002.
Ironically, Fitch Ratings published a report in 2005 on hedge fund struc-tured-finance carry trades that highlighted their contribution to systemic risk:11
In the past few years, hedge funds have emerged as a dominant force in the capital markets, benefiting from a relatively benign environment of low interest rates and easy credit. Hedge funds remain reliant on short-term financing to pursue lever-aged investment strategies, and the impact on the credit markets could be fairly broad-based if several credit-oriented hedge funds were forced to deleverage. A far-reaching liquidity squeeze and price dislocation across
11. “Hedge Funds, an Emerging Force in the Global Credit Markets” (Fitch Ratings, 2005).
Figure 3.2. Hedge Fund Assets Under Management Source: BarclayHedge
2500
2000
1500
1000
500
01997 1998 1999 2000 2001 2002 2003 2004 2005 2006 2007 2008
Figure 3.2
$ bi
llion
s
68 | Chain Reaction
multiple, interlocking credit markets could ensue simply due to hedge funds’ presence in most, if not all, of the major segments of the credit markets. The effects of such an event would be felt first and foremost in the form of price declines and credit spread widening across multiple sectors of the credit markets. In turn, this could present challenges to some market value structures with mark-to-market and deleveraging triggers. Beyond potential trading losses, including among some prime brokerage banks, cost-effective financing for all forms of credit could be adversely affected.
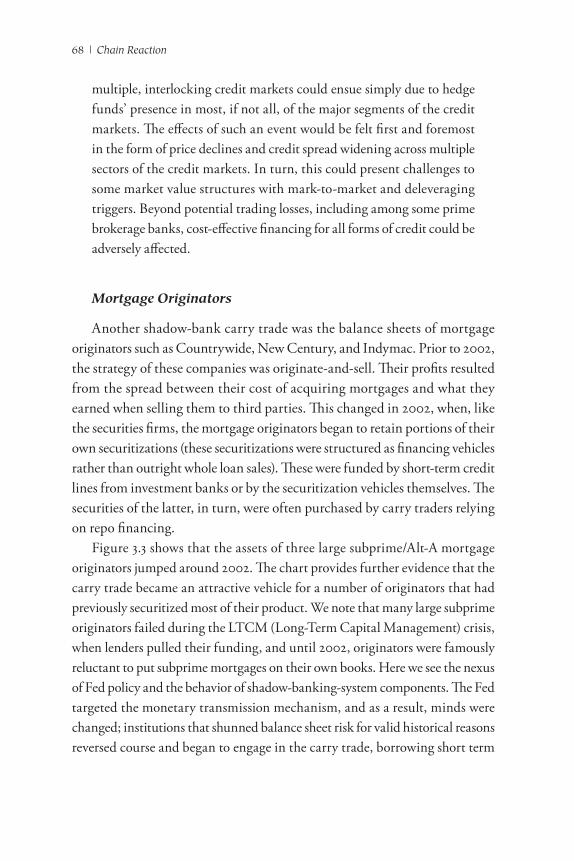
Mortgage Originators
Another shadow-bank carry trade was the balance sheets of mortgage originators such as Countrywide, New Century, and Indymac. Prior to 2002, the strategy of these companies was originate-and-sell. Their profits resulted from the spread between their cost of acquiring mortgages and what they earned when selling them to third parties. This changed in 2002, when, like the securities firms, the mortgage originators began to retain portions of their own securitizations (these securitizations were structured as financing vehicles rather than outright whole loan sales). These were funded by short-term credit lines from investment banks or by the securitization vehicles themselves. The securities of the latter, in turn, were often purchased by carry traders relying on repo financing.
Figure 3.3 shows that the assets of three large subprime/Alt-A mortgage originators jumped around 2002. The chart provides further evidence that the carry trade became an attractive vehicle for a number of originators that had previously securitized most of their product. We note that many large subprime originators failed during the LTCM (Long-Term Capital Management) crisis, when lenders pulled their funding, and until 2002, originators were famously reluctant to put subprime mortgages on their own books. Here we see the nexus of Fed policy and the behavior of shadow-banking-system components. The Fed targeted the monetary transmission mechanism, and as a result, minds were changed; institutions that shunned balance sheet risk for valid historical reasons reversed course and began to engage in the carry trade, borrowing short term

Diego Espinosa | 69
to invest in their own securitizations. In short, leaving aside considerations of whether the quality of the securitizations themselves was suspect, this was a case in which the Fed achieved its stated aim.
GSE-Retained Portfolios—An Exception
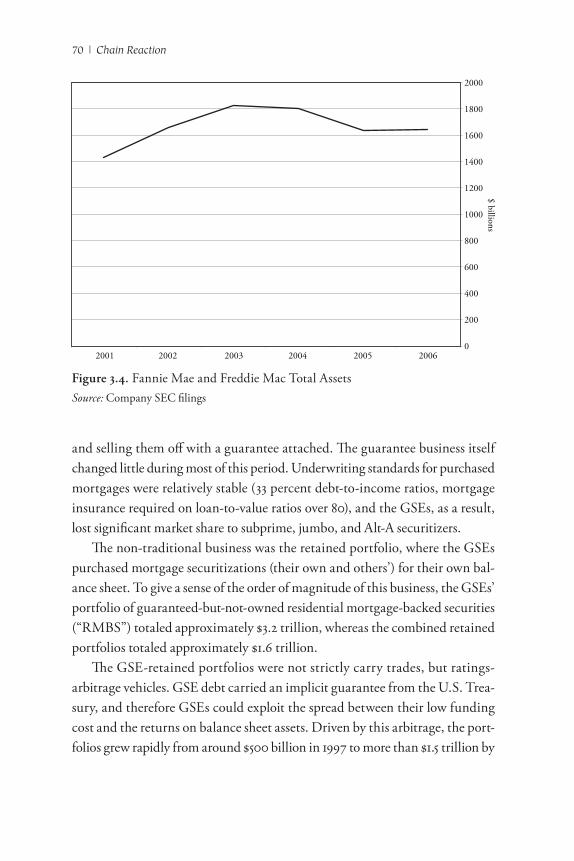
Was there a group of large shadow-banking components that did not respond to the change in Fed policy? At first glance, the GSEs (government-sponsored enterprises)—Fannie Mae and Freddie Mac—seem to fit that bill. Figure 3.4 shows that GSE total assets remained stable after 2002. This would seem to challenge our thesis that asymmetric policy had an impact on all carry traders. However, a closer look tells us that the GSEs were the exception that proves the rule. Before we get to that, it is useful to understand that GSEs were made up of two distinct businesses, one traditional and one relatively new.
The traditional part of the GSEs was the guarantee business—purchas-ing and pooling mortgages that met their standards, and then securitizing
Figure 3.3. Total Assets of Countrywide, New Century, IndymacSource: Company SEC filings
250
200
150
100
50
01997 1998 1999 2000 2001 2002 2003 2004 2005
Figure 3.3
$ billions
70 | Chain Reaction
and selling them off with a guarantee attached. The guarantee business itself changed little during most of this period. Underwriting standards for purchased mortgages were relatively stable (33 percent debt-to-income ratios, mortgage insurance required on loan-to-value ratios over 80), and the GSEs, as a result, lost significant market share to subprime, jumbo, and Alt-A securitizers.
The non-traditional business was the retained portfolio, where the GSEs purchased mortgage securitizations (their own and others’) for their own bal-ance sheet. To give a sense of the order of magnitude of this business, the GSEs’ portfolio of guaranteed-but-not-owned residential mortgage-backed securities (“RMBS”) totaled approximately $3.2 trillion, whereas the combined retained portfolios totaled approximately $1.6 trillion.
The GSE-retained portfolios were not strictly carry trades, but ratings- arbitrage vehicles. GSE debt carried an implicit guarantee from the U.S. Trea-sury, and therefore GSEs could exploit the spread between their low funding cost and the returns on balance sheet assets. Driven by this arbitrage, the port-folios grew rapidly from around $500 billion in 1997 to more than $1.5 trillion by
Figure 3.4. Fannie Mae and Freddie Mac Total AssetsSource: Company SEC filings
2000
1800
1600
1400
1200
1000
800
600
400
200
0 2001 2002 2003 2004 2005 2006
Figure 3.4
$ billions

Diego Espinosa | 71
2003. In that year, the GSEs voluntarily curtailed the growth of the portfolios in reaction to a series of accounting scandals. Finally, after the scandals were re-solved, Congress decided to formally cap the size of the portfolios in early 2006. The result of these two factors was a stagnation of total GSE assets after 2003.
Why then was the GSE the exception that proved the rule? First, the Fed-engineered reduction in liquidity risk gave the GSEs an incentive to invest in slightly-higher yielding, less-liquid AAA-rated assets while still remaining within the cap on assets; and second, the effect of Fed policy was arguably to reduce the profit from ratings arbitrage on plain-vanilla mortgages (the agency funding cost advantage over, say, investment banks, shrank as credit spreads fell). The GSEs reacted by purchasing AAA-rated non-agency mortgage securitizations. Accord-ing to company filings, close to 100 percent of Fannie Mae’s retained portfolio subprime and Alt-A holdings were rated AAA. They were able to find these low-risk securities because, as I argue below, Fed-induced demand for low-risk investments is what led to the growth of subprime and Alt-A mortgage issuance. Finally, note that this view runs counter to arguments that low-income housing mandates forced Fannie and Freddie to buy or securitize non-prime mortgages (Wallison 2009). Occam’s Razor applies here: The simplest explanation is that the profit motive drove the GSEs’ actions, and that the Fed, plus the implicit guarantee and wildly excessive leverage, made the “trade” an attractive one.
In this section, the case was made that several classes of shadow banks stepped up their carry-trade activities in response to the Fed’s intended policy of stimulating the financial system. In the case of Fannie and Freddie, we begin to see how much of this carry trade was targeted at low-risk assets. I now turn to the question of why and how these low-risk assets were produced, and, more important, how this production affected mortgage underwriting standards.
At the Heart of the Carry Trade: A Search for AAA-Rated Securities
Carry trades drove shadow-banking-system asset growth following the intro-duction of asymmetric monetary policy. Equally important is how these carry trades were executed. A common conception, even among those that ascribe a share of blame to asymmetric policy, is that the “Greenspan Put” led to increased

72 | Chain Reaction
risk-taking on the part of the shadow banking system. This is somewhat cor-rect: The all-important carry trade involved taking on additional duration and liquidity risk for incremental yield. However, what this concept misses is that, at the core of the shadow banking system, actors sought to take on very little incremental credit risk. In fact, they invested in the safest securities they could find beyond sovereign (or sovereign-guaranteed) debt. These were AAA-rated securities produced through structured finance.
A credit crisis caused by firms seeking only a marginal increase in credit risk is counterintuitive. However, it is less so when viewed through the lens of the carry trade. The Fed provided incremental information about the future path of interest rates. Given this information, the purest form of arbitrage involved borrowing as short-term as possible and investing in longer-duration securities with non-volatile returns. Adding more return volatility—in the form of credit risk—would have diluted the value of that marginal piece of information. The greatest potential arbitrage was “funding short,” “lending long and safe,” and using leverage to raise expected returns.
I am not arguing that the Fed did not encourage risk-taking. My own ex-perience is that the “Greenspan Put” was a part of the conventional wisdom cited by traders as a rationale for entering into riskier trades (“Don’t fight the Fed” was another trader nostrum). Instead, I argue that the sequence of events matters. First, Fed policy encouraged a pure arbitrage of the expected path of future policy rates; then the demand for low-risk securities climbed; then the price of assets financed by those securities boomed and the appetite for risk-taking—an aspect of any credit cycle—boomed. In the end, investors were flocking to payment-in-kind (PIK), highly leveraged, covenant-light, buyout loans that allowed leveraged buyout firms to defer interest payments during a recession. This extreme of risk-taking was achieved in 2007, during the peak of market exuberance, and not in 2003. In hindsight, the years leading up to the financial crisis seem compressed and simultaneous; at the time, to traders with daily P&Ls, they stretched ahead like eras. As a result, some of the causality leading up to a crisis tends to get washed out as the distance increases between the observer and the event.
Below, we look at the state of the market for AAA-rated securities before and after the Fed’s change in policy.

Diego Espinosa | 73
AAA-Rated Securities Prior to Asymmetric Policy
What information does an AAA rating confer? Ironically, the ratings agen-cies make few outright representations. The rating is relative and generally means that the issuer or security has the top rating among a group of peers. Further, the ratings agencies provide some guidance of what the range of ratings have meant historically. According to Moody’s Investors Service, “The average default rate from 1970–2000 for AAA-rated securities over a ten-year period was only 0.67 percent. . . . However, as one descends the rating scale into the speculative-grade section, the default rate increases dramatically. For B-rated securities, the ten-year probability of default is 44.57 percent.”12
For a trader with a short horizon, the probability of suffering a collateral loss on an AAA-rated security was close to zero, making it an attractive vehicle for carry trades. Prior to 2002, however, the supply of AAA-rated securities was relatively fixed. The bulk of securities sharing that rating in the United States were either direct U.S. government obligations (Treasuries, Ginnie Maes) or those holding a quasi-government guarantee (agencies and GSE-guaranteed mortgages). The percentage of non-government AAA-rated securities was negligible, and according to Fitch, included only about 1 percent of corporate bonds outstanding.
From 1996 to 2001, the stock of AAA-rated Treasuries, agencies, and GSE RMBS grew from $7.1 trillion to about $9.5 trillion—or 6 percent per annum—with most of that growth supplied by the need to finance the expansion of the GSE retained portfolios.
AAA-Rated Securities Outstanding Surge Following Adoption of Asymmetric Policy
Following asymmetric easing, the stock of governmental non-mortgage AAA-rated debt grew as a function of the U.S. fiscal deficit. Together, Trea-sury and agency debt outstanding grew from about $5.3 trillion in 2001 to about $7.5 trillion in 2006. Of this $2.2 trillion increase, a substantial por-
12. Moody’s Investor Service, “Moody’s Ratings Definitions” (2010), http://www.moodys korea.com/english/definition.asp#7

74 | Chain Reaction
tion satisfied demand for AAA-rated securities from reserve-accumulating countries: China alone accumulated about $700 billion by the end of 2006.13
Thus, the shadow banking system was presented with a problem starting in 2002. The Fed had begun to encourage the carry trade through its low- interest-rate policy. However, not only was the stock of government-issued AAA-rated securities relatively fixed, but the private markets faced competition for those securities from Japan, China, and other reserve accumulators. These foreign exchange reserves, in turn, were growing partly as a function of the need for fixed-exchange-rate countries to recycle their balance of payment surpluses (it is not a stretch to tie those same surpluses back to Fed policy, but that argument lies outside the scope of this chapter).
The shadow banking system responded to the demand for safe investments by manufacturing them. Enter structured finance, in which the cash flow from a pool of underlying securities is securitized into different tranches, each with a different loss position. The first loss, or mezzanine tranche, is hit for any initial shortfalls in cash flow due to credit losses; once the mezzanine tranche is depleted, the BBB-rated tranche absorbs any losses, and so on, until, finally, losses may accrue to the AAA-rated tranche. This “waterfall” loss exposure means that the AAA tranche is protected by the subordination of all lower-rated tranches. In structured finance, virtually any pool of securities, no matter how risky the underlying loans, may be securitized to produce a sizeable AAA-rated tranche. It was just a matter of making the subordinated tranches large enough to reduce the probability of a loss accruing to the AAA-rated tranche.
The surprising outcome of this manufacturing process was that around 80 percent of the value of a typical subprime ABS securitization was rated AAA by the ratings agencies.14 This means that for every dollar of risky loans origi-nators supplied to securities firms, they produced eighty cents of lowest-risk securities. Clearly, from the investor’s perspective, without foreknowledge, the purpose of subprime loan origination was to supply the market with safe investments. In their thorough study of structured finance credit ratings and subsequent downgrades, Efraim Benmelech and Jennifer Dlugosz concur: “If
13. Brad W. Setser and Arpana Pandey, “China’s $1.5 Trillion Bet: Understanding China’s External Portfolio” (Council on Foreign Relations Working Paper, 2009), 16.14. Adam B. Ashcraft and Til Schuermann, “Understanding the Securitization of Sub-prime Mortgage Credit” (Staff Report 318, Federal Reserve Bank of New Yorks, 2008).

Diego Espinosa | 75
investors use heuristics to classify assets . . . and only AAA-rated securities are perceived to be riskless, then issuers would cater to investor demand by carv-ing out large portions of their deals as AAA. [We] argue that the uniformity of CDO structures suggest that investor demand in general is an important determinant of deal structures.”15
Figure 3.5 shows the growth of non-agency, mortgage-related securitizations (comprising mostly subprime, Alt-A, commercial real estate, jumbo loans, and home equity lines) estimated to have been rated AAA. From about $1 trillion in 2002, the amount grew to over $2.7 trillion by 2006. Approximately $800 billion of this increase came from the growth in subprime loans outstanding,
15. Efraim Benmelech and Jennifer Dlugosz, “The Credit Rating Crisis” (Working Pa-per 15045, 2009), http://www.nber.org/papers/w15045
Figure 3.5. AAA-Rated Asset-Backed Securities OutstandingSource: Fitch, Sifma
ABS Growth3000
2500
2000
1500
1000
500
0
$ bi
llion
s
Outstandings % of Treasuries
60%
50%
40%
30%
20%
10%
0 2000 2001 2002 2003 2004 2005 2006
Figure 3.5

76 | Chain Reaction
with more coming from subprime CDOs (not including double-counting, as the purpose of CDOs was to use pooling and diversification to achieve yet more AAA-rated tranching). For purposes of comparison, $2.7 trillion amounted to 57 percent of Treasuries outstanding in 2006. By that measure, the shadow banking system’s expansion of available AAA-rated investments was a ringing success.
The Originators’ Response: “To Make More AAA, We Need More Bodies”
In 2006, as a hedge fund manager, I attended a “beauty contest”—a series of hedge fund “pitches” to an audience of wealthy clients and institutional inves-tors. The sponsoring securities firm also brought in one of its structured finance specialists to discuss, with a panel of fixed income hedge funds, the prospects for subprime securitizations. This managing director, in her introductory speech, made a comment that seemed important enough to note down: “We expect that the pipeline of subprime originations will continue to be strong, mostly because we see such a big appetite from technical buyers.”16
The other panelists concurred and went on to discuss the bright prospects for their subprime investments. This concept of technical demand was, at the time, a bit of a mystery to me. What did it mean? Later, it became clear that “technical” meant “arising from CDO issuance.” The speaker was say-ing that the surging demand for CDOs (collateral debt obligations) was crea-ting demand for more originations, and not the other way around.
A second anecdote: Later I went to visit the management of a San Diego–based subprime originator. I asked one of the executives, “How do you set production targets for any given month?” The response was, “It depends on the demand for our paper—our capital markets group is always in touch with securities firms to gauge the appetite.” Again, the same message: It was investor demand for subprime securitizations (which in turn, according to that invest-ment bank managing director, came from demand for CDOs) that drove their origination volumes.
16. Presentation, Bank of America Prime Brokerage Conference, San Francisco, March, 2006.
Diego Espinosa | 77
How did an originator with already significant market share “turn the dial” on near-term production volumes? Paying out more commissions to mortgage brokers was one possibility, although it also reduced origination margins. The more profitable alternative was to reduce underwriting stan-dards and/or allow for more exceptions to those “guidelines.” According to the New Century Bankruptcy Examiner (who interviewed most of the prin-cipals), this is exactly what happened.
The Examiner cites among the factors behind the bankruptcy, “New Cen-tury’s increasing origination, from 2004 onward, of increasingly risky products, such as stated income loans . . . . 80/20 loans, with such higher-risk features often combined through a so-called layering of risks.”17
In 2004, the year the Examiner cites, industry subprime outstandings jumped by 40 percent. The report contains charts noting the progression of no-doc loans, 80/20 loans, and interest-only payment loans, all increasing over this period. The clear implication is that, as demand for subprime se-curitizations from investors seeking safe investments rose, the originators responded by reducing standards to bring in more applicants. The Examiner, after studying a litany of weak credit processes and internal audit capabili-ties, concluded: “New Century measured loan quality primarily in terms of whether it was successful in selling loans to investors. So long as investors continued to purchase New Century loans, New Century did not believe it needed to significantly improve loan quality . . .”18
Was New Century different from other originators? Its securitizations did suffer from above-average credit losses; however, the company was not far ahead of the curve in terms of setting loan underwriting standards. The indus-try as a whole moved toward setting guidelines that eliminated the principal barriers that restricted the applicant pool:
• Not enough money for a down payment (solved by 80/20, no-money-down loans).
• Not enough verifiable income to qualify (solved by stated-income loans).
17. Michael J. Missal, “Examiner’s Report: Final Report of Michael J. Missal, Bankruptcy Court Examiner” (United States Bankruptcy Court for the District Delaware, In re: New Century TRS Holdings, Inc., a Delaware corporation, et al., 2008).18. Missal, “Examiner’ Report.”

78 | Chain Reaction
• Not enough actual income to make monthly payments (solved by interest-only payments).
By 2006, the three classes of volume “solutions” accounted for the follow-ing percent of subprime dollar issuance: 80/20, 25 percent; stated income, 45 percent; interest only, 33 percent. Of course, the three were not mutually exclu-sive, but layered together to bring in the most marginal borrower. Meanwhile, the solutions penetrated upward into the prime space: Alt-A mortgages with those attributes were used to increase the pool of high-FICO buyers who could purchase ever-more expensive homes.
To summarize: The Fed aimed to activate the monetary transmission mechanism with asymmetric policy; carry traders responded by demanding AAA-rated assets; demand for AAA-rated securities led to structured finance demand for subprime and Alt-A loans; and surging demand for those loans caused originators to reduce standards in order to boost the applicant pool.
We will look at one more link in the chain reaction before returning to the banking panic itself. It is the impact of declining standards on house prices.
Standards: “If You Lower Them, They Will Buy”
The effect of reducing standards to bring in more applicants was to shift out the demand curve for houses. At any given house price, more buyers were available to make a purchase than before. The analysis of the California hous-ing market below, which I undertook in 2005, underscores just how powerful this effect was on the state’s house prices.
The question is: how many more potential buyers did the lower standards in California create? First, using a no-money-down product, we include all buyers regardless of available savings for a down payment. Second, by allowing for stated income, we bring in all buyers regardless of ability to qualify based on income. The only remaining filter is actual ability to pay, which is where the lower-payment products come in. By the first quarter of 2005, according to Corelogic, a firm that tracks mortgage lending for the industry, roughly two-thirds of California ARM [adjustable rate mortgages] purchase mortgages were interest only, up from 10 percent in 2002. More surprising—even in hindsight—was that over a quarter of these had a negative amortization fea-

Diego Espinosa | 79
ture (option ARMs) in which the borrower made a low-cash interest payment (1 percent–2 percent) and deferred the remaining interest, which was then added to the principal balance. Overall, interest only mortgages comprised 44 percent of total California (ARM and fixed rate) purchase mortgages for the full year in 2005.
The median house price in California in 2005 was around $570,000. Let us first see how much annual income was required to make the payment on this mortgage (based on a mortgage, taxes and insurance payment of 33 percent of gross income) under the different payment products (each with a successively lower payment due to the interest reset feature).
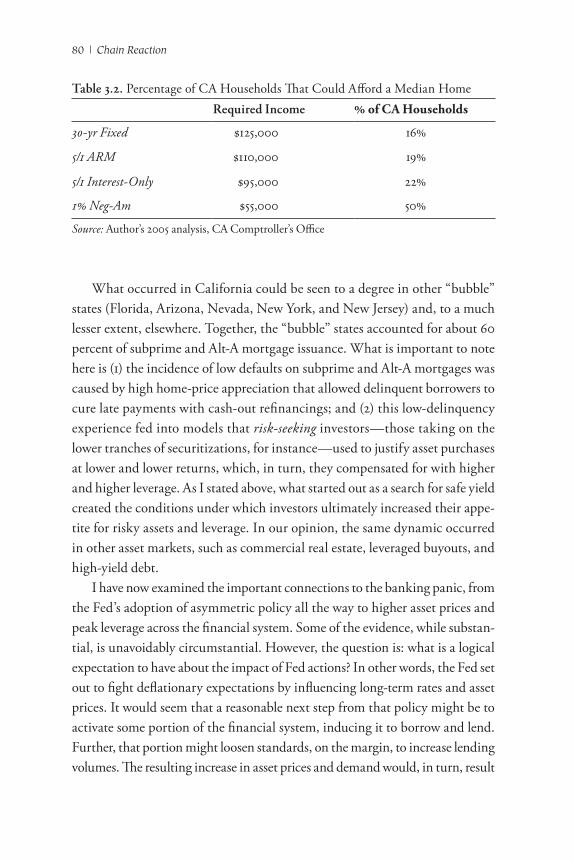
Table 3.1 shows that to purchase a median home, a borrower needed an annual gross income of only $55,000 with an option ARM mortgage. This is roughly half the income needed for a conventional thirty-year mortgage. The next question is: how many more California borrowers did the option ARM mortgage bring in? In other words, at the same price—$570,000—how far did the demand curve shift to the right as a result of the lowest-payment product? The calculations below were based on California household income distribu-tion data:
Table 3.2 shows that 50 percent of California households had incomes over $55,000 and could afford the payment on the option ARM mortgage, whereas only 16 percent of households could make the payment on the conventional thirty-year mortgage. In other words, the effect of option ARM loans was to triple the number of households that could potentially buy a home in California. This is why the California home-price-to-income ratio was more than three standard deviations higher than the historical mean in 2005.
Table 3.1. Annual Income Required to Purchase a Median Home Monthly Payment Annual Income Required
30yr Fixed $3,300 $125,000
5/1 ARM $3,100 $110,000
5/1 InterestOnly $2,600 $95,000
1% NegAm $1,300 $55,000
Source: Author’s 2005 analysis based on published mortgage rates
80 | Chain Reaction
What occurred in California could be seen to a degree in other “bubble” states (Florida, Arizona, Nevada, New York, and New Jersey) and, to a much lesser extent, elsewhere. Together, the “bubble” states accounted for about 60 percent of subprime and Alt-A mortgage issuance. What is important to note here is (1) the incidence of low defaults on subprime and Alt-A mortgages was caused by high home-price appreciation that allowed delinquent borrowers to cure late payments with cash-out refinancings; and (2) this low-delinquency experience fed into models that riskseeking investors—those taking on the lower tranches of securitizations, for instance—used to justify asset purchases at lower and lower returns, which, in turn, they compensated for with higher and higher leverage. As I stated above, what started out as a search for safe yield created the conditions under which investors ultimately increased their appe-tite for risky assets and leverage. In our opinion, the same dynamic occurred in other asset markets, such as commercial real estate, leveraged buyouts, and high-yield debt.
I have now examined the important connections to the banking panic, from the Fed’s adoption of asymmetric policy all the way to higher asset prices and peak leverage across the financial system. Some of the evidence, while substan-tial, is unavoidably circumstantial. However, the question is: what is a logical expectation to have about the impact of Fed actions? In other words, the Fed set out to fight deflationary expectations by influencing long-term rates and asset prices. It would seem that a reasonable next step from that policy might be to activate some portion of the financial system, inducing it to borrow and lend. Further, that portion might loosen standards, on the margin, to increase lending volumes. The resulting increase in asset prices and demand would, in turn, result
Table 3.2. Percentage of CA Households That Could Afford a Median Home Required Income % of ca households
30yr Fixed $125,000 16%
5/1 ARM $110,000 19%
5/1 InterestOnly $95,000 22%
1% NegAm $55,000 50%
Source: Author’s 2005 analysis, CA Comptroller’s Office

Diego Espinosa | 81
in more leverage and yet further lending, creating additional demand and finally allaying deflation fears. In other words, much of what happened from 2002 to 2007 happened as intended for the risktaking channel in the first place. In fact, Fed officials did not much protest developments as they unfolded; instead, they frequently took pains to downplay the buildup of risk in the financial system (Greenspan’s famous “housing froth” quote), and in the early years of the hous-ing recovery they correctly identified that a strong housing sector was leading the way into a more robust recovery (FOMC transcripts 2003). It was not until early 2006, months after California house prices had peaked, that the Fed finally eliminated the word “measured” from its meeting-statement release.
Full Circle: AAA-Rated Mortgage Collateral + Flat Home Prices = Banking Panic
I open this section with a final anecdote from my own experience. The ques-tion for any investor—particularly one using leverage—is not how events will unfold, but when. Timing is critical, and markets are littered with the bodies of speculators who attempted to time the bursting of various investment bubbles and failed. Knowing this, I needed a reliable indicator of when housing equi-ties might reverse. It came out of the analysis of Southern California lending standards.
The option ARM was the ultimate mortgage product in terms of bringing in marginal buyers. Where could the industry go next? A zero-payment mortgage was not that different from a 1-percent option ARM, so the number of buyers that change could attract was small, even if it were practical (investors did have some standards). Cash-out refinancings at 120 percent were tentatively tried out, but only by fringe lenders and not for securitization. The answer to the above question is, “nowhere”: a 1 percent stated-income, no-down-payment, negatively amortizing (option-Arm) mortgage was the final innovation possible. Therefore, once the penetration of option ARM mortgages into the California market lev-eled off, the industry would have finished expanding the demand curve for hous-ing, and house prices would, at the very least, stabilize. Armed with this view, I used a major option ARM originator—Countrywide Financial—as a proxy. Whenever Countrywide’s percentage of option ARM originations (released monthly by the company) flattened, it was a signal that the turn in housing was

82 | Chain Reaction
near. This did, in fact, occur in the summer of 2005, which coincided with the peak in California home prices.
Once house prices stabilized, I expected that subprime borrowers could no longer “cure” delinquencies with cash-out refinancings. Data from New Century showed that California subprime delinquencies were below 2 percent at the time, compared with the mid-teens in Midwestern states without high home-price appreciation. Therefore, it was reasonable to expect that California (and other bubble state) delinquencies would spike once prices leveled. Once those delinquencies spiked, it was not difficult to envision a chain of events—falling demand for securitizations, tighter loan standards, lower housing de-mand, falling house prices, more credit losses, levered, illiquid shadow bank failures—that would ultimately threaten the financial system.
I recount this experience because it helps to directly establish causality. As I detail later in the chapter, a run on shadow banking system liabilities, caused by concerns over AAA-rated collateral, directly resulted in the banking panic.19 The question is, did a Fed policy error (excessively tight monetary policy) result in deflationary fears that then drove the concerns over collateral; or did concerns over collateral cause a panic, which then resulted in a crash of inflation expectations in late 2008? If the former is true, the Fed caused the panic by being too tight in the months before Lehman Brothers failed. If the latter is true, the Fed erred by, years earlier, creating a system vulnerable to even a slight shock.
The impact of level house-price appreciation and rising delinquencies was a string of ratings downgrades. These appeared first in the lower subprime tranches (BBB) and progressed up the capital structure until finally hitting the highest tranche before the Lehman Brothers failure. A total of 11,327 down-grades of AAA-rated securities occurred in the first three quarters of 2008. As of October of that year, the downgrades of predominantly AAA CDO exposure at AIG, Citigroup and Merrill alone totaled close to $90 billion.20
If a collapse in growth expectations was sufficient to cause the downgrade of AAA collateral, then one would expect those downgrades to also have af-
19. Gorton, Slapped by the Invisible Hand.20. Benmelech and Dlugosz, “The Credit Rating Crisis.”
Diego Espinosa | 83
fected AAA-rated securities in other sectors of the economy. In fact, very few, if any, AAA-rated corporate bonds were downgraded in 2008.21
A similar phenomenon occurred in collateral backing a short-term fund-ing “cousin” of the repo market, the asset-backed commercial paper (ABCP) market, where outstandings had fallen by 33 percent in the twelve months prior to August 2008 (due to collateral concerns), while non-ABCP remained stable. In fact, in that August, a year after BNP Paribas suspended withdrawals from three money market funds due to ABCP issues, the spread of non-ABCP over Fed funds remained close to zero.22
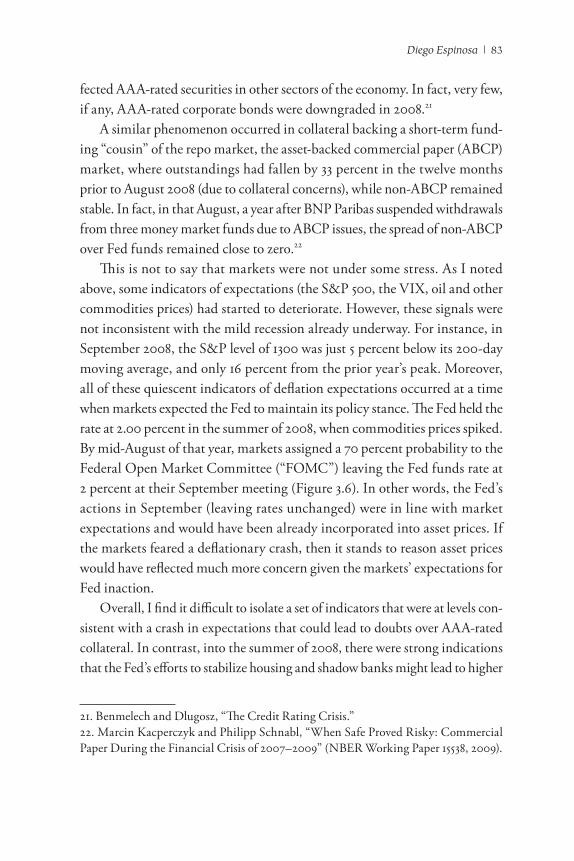
This is not to say that markets were not under some stress. As I noted above, some indicators of expectations (the S&P 500, the VIX, oil and other commodities prices) had started to deteriorate. However, these signals were not inconsistent with the mild recession already underway. For instance, in September 2008, the S&P level of 1300 was just 5 percent below its 200-day moving average, and only 16 percent from the prior year’s peak. Moreover, all of these quiescent indicators of deflation expectations occurred at a time when markets expected the Fed to maintain its policy stance. The Fed held the rate at 2.00 percent in the summer of 2008, when commodities prices spiked. By mid-August of that year, markets assigned a 70 percent probability to the Federal Open Market Committee (“FOMC”) leaving the Fed funds rate at 2 percent at their September meeting (Figure 3.6). In other words, the Fed’s actions in September (leaving rates unchanged) were in line with market expectations and would have been already incorporated into asset prices. If the markets feared a deflationary crash, then it stands to reason asset prices would have reflected much more concern given the markets’ expectations for Fed inaction.
Overall, I find it difficult to isolate a set of indicators that were at levels con-sistent with a crash in expectations that could lead to doubts over AAA-rated collateral. In contrast, into the summer of 2008, there were strong indications that the Fed’s efforts to stabilize housing and shadow banks might lead to higher
21. Benmelech and Dlugosz, “The Credit Rating Crisis.”22. Marcin Kacperczyk and Philipp Schnabl, “When Safe Proved Risky: Commercial Paper During the Financial Crisis of 2007–2009” (NBER Working Paper 15538, 2009).

84 | Chain Reaction
inflation. The 60 percent move in the CRB commodities index that occurred from late 2006 to the summer of 2008 was the steepest rise since 1973, the dol-lar was relatively weak, and many emerging markets stock markets—hardly deflation beneficiaries—were hitting new highs.
Stepping back, we can see that 2008 was quite different from 1933, or even December 1930, the month that the Bank of the United States became the first large bank casualty of the Great Depression. In 2008, a panic of national importance arose—one that threatened virtually all the major banks—within months of a peak in the inflation rate, money growth and commodity prices; and during a normal stock market correction. By the fall of 1930, in contrast, the price level, commodities prices, monetary aggregates, and output had con-tracted significantly, and the stock market was down 37 percent from its peak.
In short, it appears that the system was exposed to an event as benign as a year or so of level house-price appreciation, and that this development resulted in a panic not seen for seventy years. What I have attempted in this chapter is to trace the cause of this fragility back to the Fed’s attempts to target the
Figure 3.6. September 2008 FOMC Meeting Outcome Probabilities, August 15/08Source: Federal Reserve Bank of Cleveland
Figure 3.6
–10%
0
10%
20%
30%
40%
50%
60%
70%
80%
175 200 225
5/14
/200
8
5/21
/200
8
5/29
/200
8
6/5/
2008
6/12
/200
8
6/19
/200
8
6/26
/200
8
7/3/
2008
7/11
/200
8
7/18
/200
8
7/25
/200
8
8/1/
2008
8/8/
2008
8/15
/200
8

Diego Espinosa | 85
expectations of carry traders and their shadow banking institutions—the new elements of the monetary transmission channel. Our final step is to tie the shadow banking system’s response to Fed policy directly to the mechanism of the banking panic itself: the run on the repo and other short-term funding for the system.
The Mechanics of the Panic: A Run On Repos
The previous section dealt mostly with the performance of AAA-rated assets on the asset side of the shadow banking system balance sheet. For purposes of actually identifying the proximate cause of the 2008 banking panic, the liability side is what is important. The common feature of any systemic banking panic is a “run” on that system’s liabilities. A run results from individual depositors doubting the safety of collateral backing their deposits, which in turn leads them to demand their funds back from an individual bank before that bank’s access to liquid funds is exhausted by other depositors demanding the same. The rush by individuals to withdraw funds leads, in aggregate, to the system running short of funds to pay depositors, which in turn leads banks to engage in fire sales of assets, which lowers the prices of collateral and creates further doubts over their safety.
Prior to the establishment of the FDIC, banking rested on the “informa-tion insensitivity” of deposits.23 The depositor did not need to know about the quality of a bank’s loan book, or its overall health, before deciding to make a deposit. During the onset of a recession, deposits would lose this informa-tion insensitivity as banks’ loan portfolios became suspect. In the absence of more information about which loans, and which banks, were most affected, depositors would withdraw funds from the banking system, hoarding currency and precipitating a panic. FDIC insurance provided, of course, a means of maintaining the information insensitivity of deposits even during a deep reces-sion. The success of the insurance mechanism governing the deposits of the traditional banking system explains the prolonged absence of banking panics.
By 2008, the insurance mechanism described above was no longer effec-tive in guaranteeing the immunity of the financial system to panics. This
23. Gorton, Slapped by the Invisible Hand.

86 | Chain Reaction
was simply because, as percentage of total short-term system liabilities, the non-insured portion grew to a critical mass. The most important instrument in that non-insured portion was the short-term repo, the primary funding mechanism for the shadow banking system. Short-term repos were essentially collateralized loans, with the AAA-rated assets described earlier serving as collateral. Not surprisingly, the growth in overnight repos mirrored the same “kink,” or acceleration, exhibited by shadow banking system assets following the Fed’s 2003 policy shift. While banks used repos for years prior to 2002, what clearly stands out in this cycle is how repo financing exploded begin-ning in that year (Figure 3.7). At its peak, repo funding was roughly twice the deposits of the banking system).24 Further, investment banks increasingly relied on overnight funding, with the use of overnight repos doubling between 2000 and 2007.25
24. Joseph S. Tracy, “What the Fed Did and Why” (remarks at the Westchester County Bankers Association, New York, 2010).25. Markus K. Brunnermeier, “Deciphering the Liquidity and Credit Crunch 2007–2008,” Journal of Economic Perspectives 23 (Winter 2009): 80.
Figure 3.7. Total Primary Dealer Repos OutstandingSource: Federal Reserve Bank of New York
4500
4000
3500
3000
2500
2000
1500
1000
500
0
$ bi
llion
s
1996 1997 1998 1999 2000 2001 2002 2003 2004 2005 2006 2007 2008
Figure 3.7

Diego Espinosa | 87
If the repo was the critical funding vehicle for the shadow banking system, then the impact of structured finance was to manufacture more “information insensitive” collateral for repos. Repo depositors did not discriminate between classes of AAA collateral pre-crisis.26 In fact, the Federal Reserve Bank of New York (“NY Fed”) estimated that “illiquid collateral” (a substantial portion of which was structured finance) backed 55 percent of all primary dealer repos by 2006.27 Thus, the web of repo transactions that connected shadow bank-ing institutions with each other would have been suffused with structured finance product.
To come full circle, I have described above how the Fed’s policy shift en-couraged carry trades, how this led to rapid growth in shadow banking system AAA-rated assets, and how this growth in turn reduced the quality of AAA-rated collateral. The result of all of those asset-side reactions was an increase in the use of repo and other non-insured financing for the financial system, to the point that the system was no longer protected from runs by the deposit insurance mechanism. This brings us to 2007, when concerns over AAA-rated subprime mortgages first began to impact banking system funding.
The presence of small-scale “runs” on financial institution liabilities be-gan in August 2007. In that month, rising subprime defaults and ratings culminated in BNP Paribas’s suspension of investor withdrawals from three subprime-related funds. The significance of the announcement was that BNP argued it could not ascertain the value of the (mostly AAA-rated and AA-rated) subprime securities in its fund portfolios. In essence, BNP was announcing to the markets that AAA-rated subprime collateral was now “information sensitive.” As a result, interbank lending spreads spiked and the Asset Backed Commercial Paper and repo markets experienced collateral calls.
Stepping back, the question is why a more generalized run on financial sys-tem liabilities did not begin in August 2007, but only happened once Lehman failed a year later? One can think of the chain of events as a continuous process, one in which concern over AAA-rated repo and ABCP collateral caused brief,
26. Gorton, Slapped by the Invisible Hand, 35.27. Tobias Adrian, Christopher R. Burke, and James J. McAndrews, “The Federal Re-serve’s Primary Dealer Credit Facility,” Currency Issues in Economics and Finance 15, no. 4 (2009).

88 | Chain Reaction
localized “runs” on successive shadow banking institutions: starting with the off-balance sheet carry trade vehicles of banks (conduits, SIV’s) through the fall of 2007, and then moving to the balance sheets of investment banks (Bear Stearns) in the spring of 2008, to the GSEs (summer), and finally, to Lehman, Merrill, and Morgan Stanley (September), then broadening out to money market funds, GSE debt, derivatives books, AIG; and then culminating in the threat of a wide-scale, generalized run on the non-insured liabilities of the financial system in October, 2008. At each step of the way, the Fed tried to contain the runs by acting to reduce the information sensitivity of shadow bank collateral through “backstopping.”28 This started with a coordinated (with the ECB (European Central Bank) and BOJ (Bank of Japan)), public liquidity injection in August, 2007, and then was followed by rate cuts; the establish-ment of short-term lending vehicles (TALF (Term Asset-Backed Securities Loan Facility), PDCF (Primary Dealer Credit Facility) to replace lost repo and other short-term financing; the bailout of Bear Stearns and GSE credi-tors; and finally, the commitment to purchase repo collateral directly and in size (through the Fed’s $1.25 trillion in mortgage purchases).
In the end, the Fed and the Treasury won the battle and stemmed the run on the system, preventing a full-blown panic. The panic that did occur, how-ever, cost the financial system and the economy dearly. The shadow banking system has contracted in size, from $20 trillion in credit outstanding to $16 trillion (NY Fed 2010, 65); and it became virtually absent from performing some of its earlier functions (i.e., providing mortgage lending). Despite the Fed-engineered growth in bank reserves, traditional bank credit continued to contract well into 2010. Perhaps most important, borrowers, especially house-holds, remain saddled with debt contracts that were entered into at higher asset prices, inducing them to de-lever. This de-levering, in turn, depresses the recov-ery in nominal spending. All of these factors continue to weigh on the fragile recovery from the 2008 recession, such that the overall cost to the economy of the banking panic still remains to be tallied.
28. Adrian et al., Shadow Banking, Staff Report No. 458, Federal Reserve Bank of New York, July, 2010, pp. 58–64.

Diego Espinosa | 89
Counterfactual: No Panic Without Asymmetric Policy
I turn to the question of what the Fed should have done differently before the crisis. Given our thesis, to eliminate the possibility of a bank panic in the fall of 2008, the Fed had a few obvious choices. Any scheme that did not rescue structured finance AAA-rated securities would not fix the repo (and ABCP) collateral problem. It was unlikely that deeper cuts to the Fed funds rate in the spring of 2008 would have prevented expectations for additional ratings downgrades. The same applies to any pre-panic attempt to formally raise inflation expectations that did not also commit the Fed to raising home prices and/or rents (after all, shelter is approximately 40 percent of core CPI), or if not, then reigniting the spike in commodities prices and headline CPI. Both of those tactics would have risked the “bag of chips” effect, where pull-ing harder on both sides of the bag to open it results in nothing until finally, by exerting enough force, the bag bursts open, raining chips into the air (the “chips” in this case being inflation).
Compare the above pre-panic prescriptions to the following counterfac-tual: What would have happened if instead of opting for asymmetry, the Fed made no commitments regarding the path of policy in 2003? It is possible that deflationary expectations might have taken hold; and yet, just a few years later, the risk of those expectations was to come back with a vengeance anyway. Argua bly, the financial system was in much better shape to take on deflation-ary risk without outsized intervention in 2003 than in 2008. Household bal-ance sheets were in better shape, and, as I have shown, the shadow banking system was much smaller. Asset prices—particularly those of Nasdaq stocks and high-yield communications sector bonds—were in the process of clearing without creating systemic risk in the shadow banking system.
The interaction between policy and the soup of other variables is too murky for counterfactuals to be anything more than indicative. Perhaps the cost of not withdrawing uncertainty under the deflationary threat was higher than I perceive. Regardless, the more important point, the one I set out to prove, is that without asymmetric policy, the shadow banking system, and its unin-sured liabilities, would not have grown in such a way as to ultimately produce a banking panic.
90 | Chain Reaction
Conclusion: To Improve Policy, Recognize Its Limitations
I leave specific policy recommendations to other chapters of this book. The implication of this chapter, however, is that any proposed policy regime should take into account the limits of Fed power. I have argued that Fed policy can cause chain reactions in markets that can lead to systemic risk and financial panics. Below, I look briefly at two other limitations: (1) the inherent conflict between the Fed’s deflation-fighting goals and risk management; and (2) the Fed’s own organizational shortcomings.
Today, the Fed remains in deflation-fighting mode. It may be too easy or too tight, but one thing is certain: By holding rates at zero and engaging in Quantitative Easing, the Fed is implicitly trying to convince carry traders to once again reduce insurance (against deflation and illiquidity) and take on leverage. To be successful, this policy has to allow carry traders to profit from the trade for as long as it takes to tame deflation risk. The problem is that, if the Fed is successful in avoiding deflation, it may again create system fragility in the medium term. How can the Fed communicate to markets so as to reduce insurance taking, while at the same time controlling the risks associated with too-low insurance? It is not clear that the Fed can be both weatherman (issuing sunny forecasts) and flood control manager (in charge of the building of levies). Any policy regime that targets market expectations to manufacture stability should take this conflict into account.
The second limitation on policy involves organizational culture. Is the Fed capable of gauging and managing the tail risk? On its face, the evidence from the past twelve years or so is not encouraging: The Fed repeatedly failed to an-ticipate the crisis-inducing failures of over-levered shadow banking institutions (LTCM (Long-Term Capital Management), Bear Stearns, Lehman Brothers). Yet the issue goes deeper than the Fed’s ability to “see around” any single cor-ner. The Fed seems unable to recognize the limits of its own understanding. If known unknowns are questions for which they do not have an answer; then unknown unknowns are questions they are unable to formulate (Morris 2010).29 The Fed shows signs of a chronic inability to ask the right questions.
29. Errol Morris, “The Anosognosic’s Dilemma: Something’s Wrong But You’ll Never Know What It Is (Part 1),” New York Times, June 20, 2010.

Diego Espinosa | 91
Fed Vice-Chairman Kohn, for instance, has defended the Fed by argu-ing that bubbles are hard to identify before they crash (Kohn 2008).30 This is beside the point. The question is not whether we can identify bubbles, but whether we can measure and control shadow-banking-system fragility (high leverage, reliance on overnight funding, and rising carry trader demand for correlated, leveraged bets are all reliable indicators). Unfortunately, there is little evidence that the Fed is engaged in a thorough examination of this ques-tion. A San Francisco Fed economist recently published a paper dismissing the notion that low rates might produce imbalances31 by saying that the link between the two is “quite erratic and poorly understood.” To us, it sounds like the Fed official is saying, “If we do not understand something, we can afford to ignore it.” Further, there is a body of research that does establish the link for emerging economies.32
Bernanke himself believes that the financial crisis was mostly a failure of regulation.33 This is inarguable. Less numbers of stated-income loans would have been a good thing. However, in 2005, prohibiting California stated-income loans would have caused house prices there to fall, and fall hard. No regulator wanted to be blamed, at the time, for harming homeowners. So the question is: can we count on regulators to make the right trade-offs when we give them discretion? Again, there is little sign that the question is being asked.
I noted that in the 1980s, a wave of social science research culminated in the idea that government bureaucrats were incapable of forecasting the follow-on effects of their policies on individuals and society. Somehow, the post-1970s Fed was exempted from that view. Perhaps it is time to remove that exemption.
30. Donald L. Kohn, “Monetary Policy and Asset Prices Revisited” (presentation at the Cato Institute’s 26th Annual Monetary Policy Conference, Washington, D.C., 2008).31. Glenn D. Rudebusch, “The Fed’s Exit Strategy for Monetary Policy,” FRBSF Economic Letter (2010): 18.32. Moritz Schularick and Alan M. Taylor, “Credit Booms Gone Bust: Monetary Policy, Leverage Cycles and Financial Crises, 1870–2008” (NBER Working Paper 15512, 2009), http://www.nber.org/papers/w15512.33. Ben S. Bernanke, “Monetary Policy and the Housing Bubble” (speech given at the Annual Meeting of the American Economic Association, Atlanta, Georgia, 2010), http:// www.federalreserve.gov/newsevents/speech/bernanke20100103a.htm.
92 | Chain Reaction
I have looked at three limits on policy: (1) chain reactions; (2) conflicts between policy goals and risk-taking; and (3) organizational limitations. To us, the three limits argue that the Fed should use extreme caution when ex-panding the commitments—such as no more deep recessions—that it makes to markets and society at large. Without this caution, we risk creating a repeat of the shadow banking panic of 2008.
References
Adrian, Tobias, Christopher R. Burke, and James J. McAndrews. 2009. The Federal Reserve’s primary dealer credit facility. Currency Issues in Economics and Finance. 15 (4).
Adrian, Tobias and Hyun Song Shin. 2008. Liquidity, monetary policy, and financial cycles. Current Issues in Economics and Finance. 14 (1).
Ashcraft, Adam B. and Til Schuermann. 2008. Understanding the Securitization of Subprime Mortgage Credit. Staff Report 318. Federal Reserve Bank of New York. New York.
Benmelech, Efraim and Jennifer Dlugosz. 2009a. The credit rating crisis. Working Paper 15045. http://www.nber.org/papers/w15045
. 2009b. The alchemy of CDO credit ratings. NBER Working Paper 14878. http://www.nber.org/papers/w14878
Bernanke, Ben S. 2002. Deflation: Making Sure “It” Doesn’t Happen Here. Speech given at the National Economists Club, Washington, D.C.
. 2003. Remarks made before the Economics Roundtable, University of Cali-fornia, San Diego, La Jolla, California
. 2010. Monetary Policy and the Housing Bubble. Speech given at the Annual Meeting of the American Economic Association, Atlanta, Georgia. http://www .federalreserve.gov/newsevents/speech/bernanke20100103a.htm
Brunnermeier, Markus, K. Deciphering the liquidity and credit crunch 2007–2008. 2009. Journal of Economic Perspectives. 23 (Winter): 77–100.
Diamond, Douglas W. and Raghuram Rajan. Illiquidity and interest rate policy. 2009. NBER Working Paper 15197. http://www.nber.org/papers/w15197

Diego Espinosa | 93
. 2009. The credit crisis: conjectures about causes and remedies. NBER Work-ing Paper 14739. http://www.nber.org/papers/w14739.
Examiner’s Report. 2008. Final Report of Michael J. Missal, Bankruptcy Court Examiner. United States Bankruptcy Court for the District Delaware. In re: New Century TRS Holdings, Inc., a Delaware corporation, et al.
Fitch Ratings. 2005. Hedge Funds, an Emerging Force in the Global Credit Markets.
FOMC meeting statement. May 6, 2003. http://www.federalreserve.gov/boarddocs/ press/monetary/2003/20030506/default.htm
. May 6, 2003. http://www.federalreserve.gov/monetarypolicy/files/FOMC 20030506meeting.pdf
. August 12, 2003. http://www.federalreserve.gov/boarddocs/press/monetary/ 2003/20030812/default.htm
. May 4, 2004. http://www.federalreserve.gov/monetarypolicy/files/FOMC 20040504meeting.pdf
Gorton, Gary B. 2010. Slapped by the Invisible Hand: The Panic of 2007. New York: Oxford University Press.
Kacperczyk, Marcin and Philipp Schnabl. 2009. When Safe Proved Risky: Com-mercial Paper During the Financial Crisis of 2007–2009. NBER Working Paper 15538.
Kohn, Donald L. 2008. Monetary Policy and Asset Prices Revisited. Presented at the Cato Institute’s 26th Annual Monetary Policy Conference. Washington, D.C.
Macroeconomic Resilience blog. Knightian uncertainty and the resilience-stability trade-off. http://www.macroresilience.com/2010/01/30/knightian-uncertainty -and-the-resilience-stability-trade-off/
Moody’s Ratings Definitions. 2010. Moody’s Investor Service. http://www.moodys korea.com/english/definition.asp#7
Morris, Errol. The Anosognosic’s Dilemma: Something’s Wrong But You’ll Never Know What It Is (part 1). New York Times, June 20, 2010.
Pozsar, Zoltan, Tobias Adrian, Adam Ashcraft, and Hayley Boesky. 2010. Shadow Banking. Federal Reserve Bank of New York Staff Reports, no. 458 July 2010.
Rudebusch, Glenn D. 2010. The Fed’s Exit Strategy for Monetary Policy. FRBSF Economic Letter. 2010–18.

94 | Chain Reaction
Schularick, Moritz and Alan M. Taylor. 2009. Credit Booms Gone Bust: Monetary Policy, Leverage Cycles and Financial Crises, 1870–2008. NBER Working Paper 15512. http://www.nber.org/papers/w15512
Setser, Brad W. and Arpana Pandey. 2009. China’s $1.5 Trillion Bet: Understanding China’s External Portfolio. Council on Foreign Relations Working Paper.
Tracy, Joseph S. 2010. What the Fed Did and Why. Remarks at the Westchester County Bankers Association. New York.
Wallison, Peter J. The Price for Fannie and Freddie Keeps Going Up. Wall Street Journal, December 29, 2009.


![[Panic Away] Successfully Overcoming Panic Attacks](https://static.fdocuments.us/doc/165x107/559a31ed1a28ab96478b473a/panic-away-successfully-overcoming-panic-attacks.jpg)
![[Panic Away] Knowing How to Cure Panic Attacks](https://static.fdocuments.us/doc/165x107/55ae07b21a28abbb788b469c/panic-away-knowing-how-to-cure-panic-attacks.jpg)
![[Panic Away] EFT - Dealing with Panic Attacks](https://static.fdocuments.us/doc/165x107/55ae087c1a28abab788b476b/panic-away-eft-dealing-with-panic-attacks.jpg)


![[Panic Away] Menopause and Panic Attacks](https://static.fdocuments.us/doc/165x107/559482191a28abc67b8b4606/panic-away-menopause-and-panic-attacks.jpg)

![[Panic Away] Getting a Grip On Your Panic Disorder](https://static.fdocuments.us/doc/165x107/5591889d1a28abbb4c8b46cd/panic-away-getting-a-grip-on-your-panic-disorder.jpg)


![[Panic Away] Curing Panic Attacks Fast](https://static.fdocuments.us/doc/165x107/556e4069d8b42a16278b4d4b/panic-away-curing-panic-attacks-fast.jpg)
![[Panic Away] How to Avoid Panic Attacks](https://static.fdocuments.us/doc/165x107/55ae07841a28abc8788b4660/panic-away-how-to-avoid-panic-attacks.jpg)