Home ECG Test Kit University of Pittsburgh Senior Design – BioE 1160/1161 James Cook Carmen Hayes...
30
Home ECG Test Kit University of Pittsburgh Senior Design – BioE 1160/1161 James Cook Carmen Hayes Joe Konwinski April 18, 2005 Mentor: Mingui Sun, PhD
-
Upload
clifton-hubbard -
Category
Documents
-
view
213 -
download
1
Transcript of Home ECG Test Kit University of Pittsburgh Senior Design – BioE 1160/1161 James Cook Carmen Hayes...

Home ECG Test Kit
University of PittsburghSenior Design – BioE 1160/1161
James CookCarmen HayesJoe Konwinski
April 18, 2005
Mentor: Mingui Sun, PhD

Problem Statement
Heart disease• 2nd leading cause of death
• Number 1 killer of women
Limitation of Diagnosis• In 2003, of the 700,000 Americans that
died, only 148,000 were diagnosed
• Individuals remain unaware of the symptoms of heart attack or dismiss them

Introduction
Develop a small device that can:• Cleanly amplify the electric activity of the
heart
• Save the amplified signal onto a portable memory solution
Produce a program that can:• Analyze the ECG data and give heart-risk
feedback to the user
Be Sold Over-the-Counter Be User Friendly and Safe

Purpose
Purpose is:• To assess heart risk of seemingly HEALTHY, middle to upper aged individuals
• To give a cheaper/ less demanding alternative for healthy patients
Purpose is NOT:• To replace a health professional in assessing heart
risk of ILL or HEAVY RISK individuals

Let Us Be Frank….

Market
What’s There…• Marquette MARS® PC Holter Monitoring &
Review System--$11,500
• Burdick Vision® Holter Analysis System
--$6,000
All Marketed Devices are For Use By Health Care Professionals

Market Size
Based on the 2000 Census, the population of both sexes ages 40+ was 119,386,252 (42% of population). Family history Hypertension (estimated 28 million adults) Obesity (estimated 41 million adults) Smoking (estimated 20 million adults)

Constraints
Economic• Time
• Money
Regulatory• False positive
• False negative
• Patient misuse

Project Outline
Hardware Group• Develop Miniature ECG Amplifier
• Decide Proper Electrode Placement/Management
• Research Methods on Implementing a Portable Memory Solution
Software Group• Understand the Mechanism behind ECG
diagnoses
• Develop a Computer Algorithm to Interpret Imported ECG Signal

Hardware Development
Develop a Miniature ECG Amplifier

Hardware Development
Development of Miniature ECG Amplifier
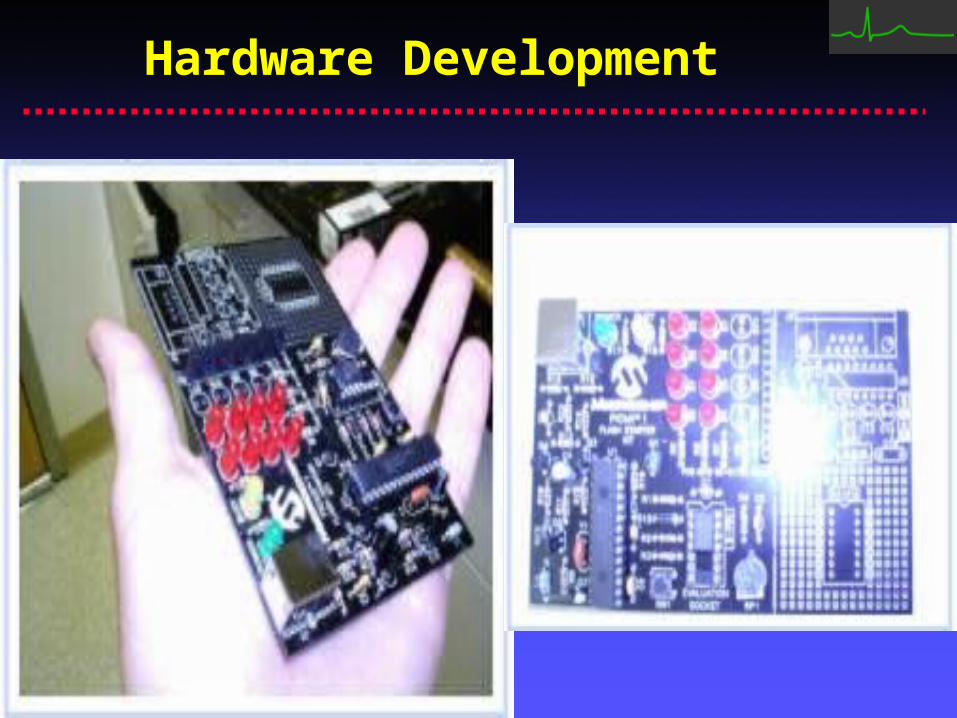
• Deciding on Chips
• Bread-Board Model
• PCB development
• Testing PCB model
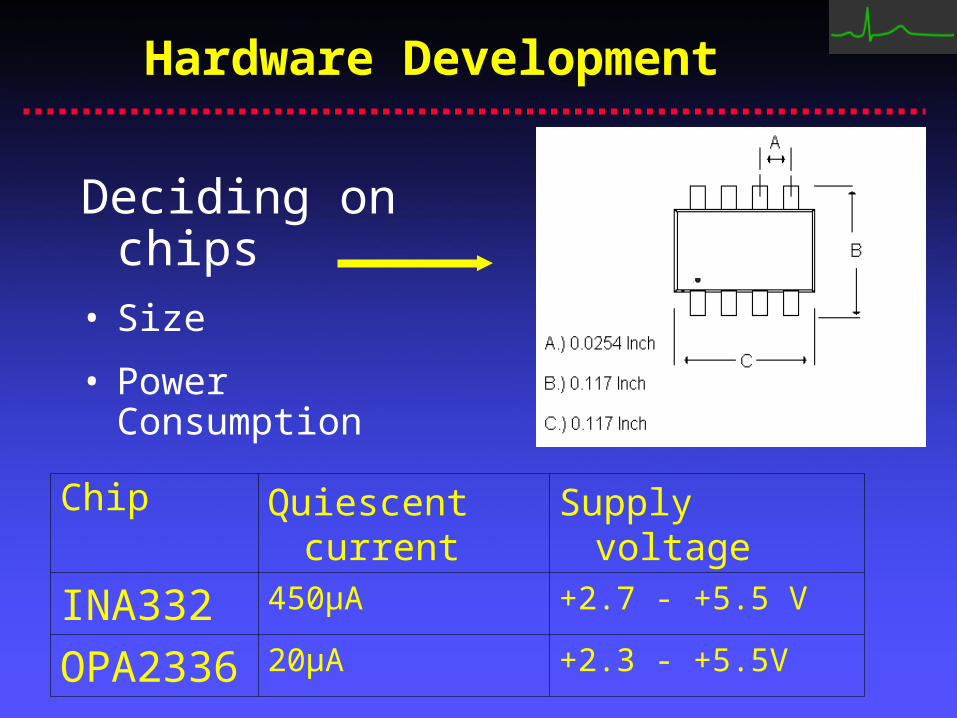
Hardware Development
Deciding on chips• Size
• Power Consumption
Chip Quiescent current Supply voltage
INA332 450µA +2.7 - +5.5 V
OPA2336 20µA +2.3 - +5.5V

Hardware Development
Breadboard PCB

Hardware Development
Electrode placement• Normally has 12 leads,
each one takes a “picture” of the heart from a different aspect.

Hardware Development
Normal Recording

Hardware Development
Einthoven’s Triangle

Hardware Development
Goal: Detect P, R, S, and T waves Signal
-0.4
-0.3
-0.2
-0.1
0
0.1
0.2
0.3
0.4
40 40.5 41 41.5 42 42.5
P
R
S
T

Hardware Development
Implementing Portable Memory
Current Solution:• Microchip’s PIC18F2455
• 10-bit A/D Converter
Hardware Development

Hardware Development

Hardware Development

Heart Disease & ECG Timing
Heart block (1st,2nd,3rd degree) • Timing irregularity in PR interval
Bundle branch block• Long QRS interval
Arrhythmia• Heart rate too fast or slow (<60; >100 BPM)
Myocardial Ischemia• Depressed ST segment
Clinically, the electrocardiogram is a powerful tool in diagnosing certain types of heart disease.

MuscleContraction
Software Development
Moving median filter (n=fs) to calculate baseline
Locate areas of muscle contraction using threshold detector (±0.4V from baseline)
Find largest gap of continuous data between contractions for use in further analysis
If largest gap is smaller than 12 sec, prompt user to recollect data and to try to relax his/her body
Subtract baseline from data
Use Butterworth 2nd order lowpass (fl =15 Hz) to remove high frequency noise
Signal Conditioning

Q
P, noise
R
Q, P, noise
T
S
Software Development
K-means cluster analysis locates cluster centroids and groups data points with centroids to minimize sum of squares Heuristics based on derivatives, amplitudes, and relative locations of peaks/valleys give each cluster a label (i.e. P, Q, R, S, T)
•Need to test at least 40 “normal” patients before this step is complete
ECG Analysis
Peak-detector algorithm locates peaks/valleys in the ECG along with their amplitudes and derivatives

Software Development
User is given feedback consisting of:
Type Subtype Risk WeightHeart Block 1st degree 92% 2%
1st degree heart block is caused by…It results in…It is usually treated by…
2nd degree 10% 5%
2nd degree heart block…
3rd degree 0.2% 40%
3rd degree heart block…
…
TOTAL RISK 11%
User Feedback Calculate peak-to-peak timing and important slopes of ECG Statistical analysis calculates a percent risk of each disease and, by weighting each disease, a total risk of disease
1st degree heart block is diagnosed when the PR interval is greater than 0.2 seconds
Criteria for Success
Design of on-chest ECG hardware
Ability to detect peak-to-peak time intervals
programmatically
Completing:

Successes
Nearing completion of the computer program
Developed a miniature ECG amplifier
Verified that signal peaks can be detected with chest-mounted electrodes

Future Work
Finish computer program
Design and implement flash memory storage
Create a working prototype

Acknowledgements
Dr. Mingui Sun
Dr. Marc Simon
Drs. Hal Wrigley and Linda Baker for their generous donation

Questions?