
BIOE 505: Computational Bioengineering
59
BIOE 505: Computational Bioengineering What this class is all about?
Transcript of BIOE 505: Computational Bioengineering
BIOE 505:Computational Bioengineering
What this class is all about?

Instructor
2
Name: Sergei Maslov
Professor of Bioengineering,Physics, Carl R. Woese
Institute for Genomic Biology, and National Center for Supercomputing Applications
Office: 3406 Carl Woese Institute for Genomic Biology and sometimes 3146C EverittLaboratory (both by appointment)
E-mail: [email protected]
Phone: 217-265-5705
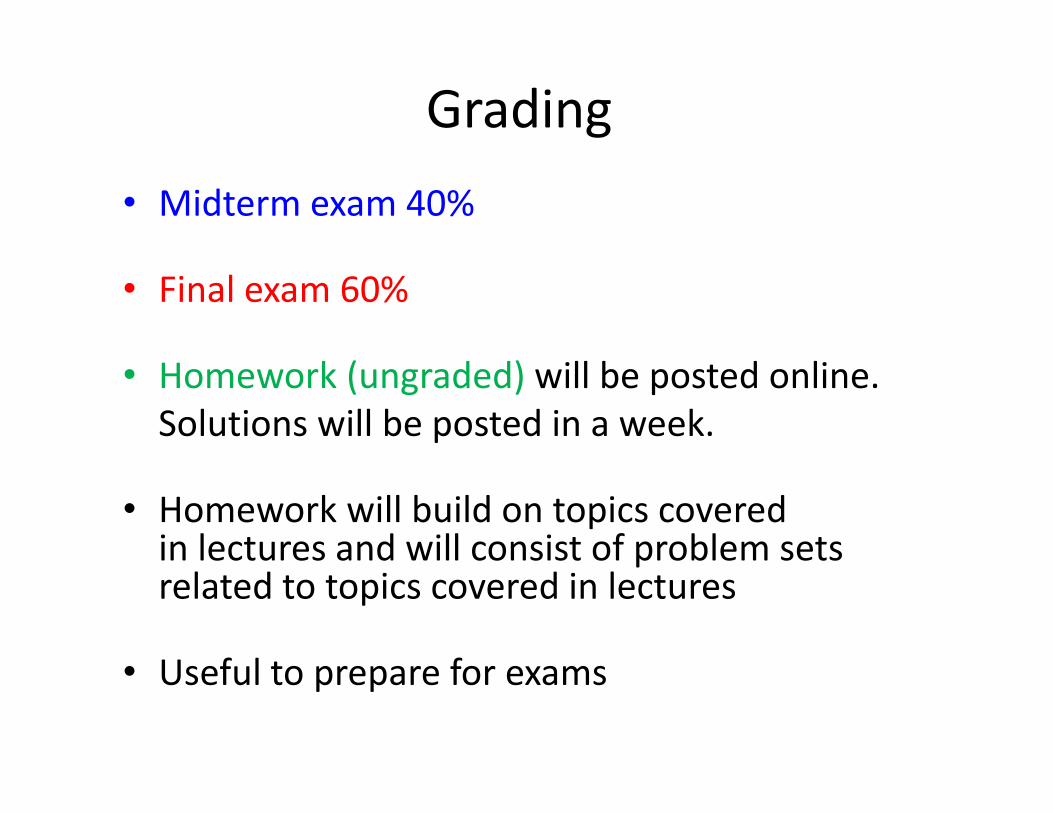
Grading• Midterm exam 40%
• Final exam 60%
• Homework (ungraded) will be posted online. Solutions will be posted in a week.
• Homework will build on topics coveredin lectures and will consist of problem sets related to topics covered in lectures
• Useful to prepare for exams
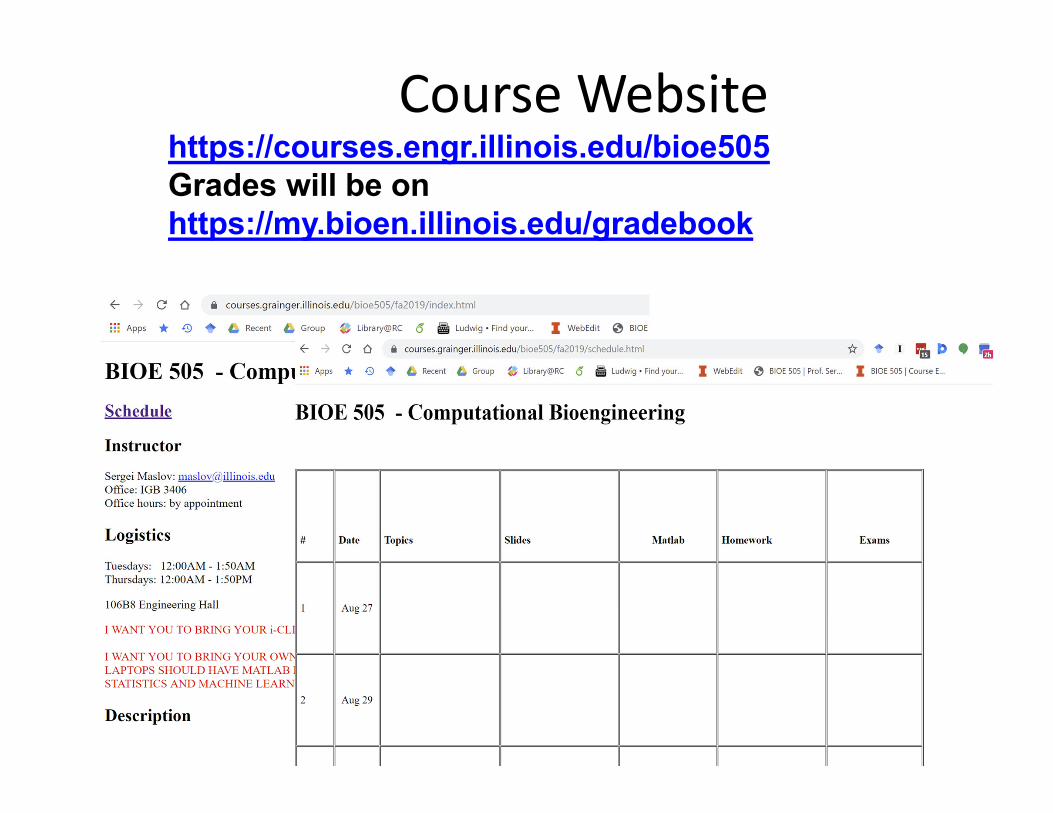
Course Website
5
https://courses.engr.illinois.edu/bioe505Grades will be on https://my.bioen.illinois.edu/gradebook
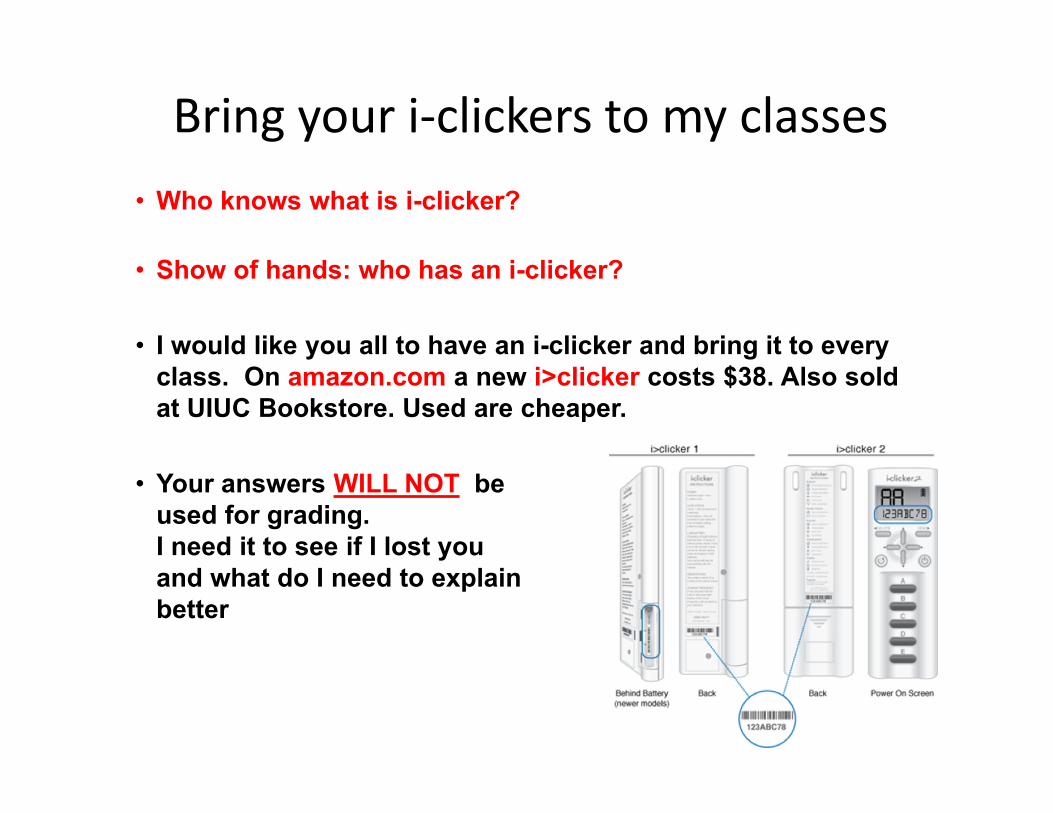
Bring your i‐clickers to my classes• Who knows what is i-clicker?
• Show of hands: who has an i-clicker?
• I would like you all to have an i-clicker and bring it to every class. On amazon.com a new i>clicker costs $38. Also sold at UIUC Bookstore. Used are cheaper.
• Your answers WILL NOT be used for grading. I need it to see if I lost you and what do I need to explain better
We will use Matlab in class• Bring your laptops to class • Poll: who hasMatlab?• Need to have Matlab installed and know the basic user interface (inline commands, plotting)
• We will use Statistics and Machine Learning Toolbox and Bioinformatics Toolboxes
• You can use CITRIX for UIUC students and connect to EWS Windows Lab Software
• .m files and .mat with Matlab commands and data will be on the website after the lecture
8
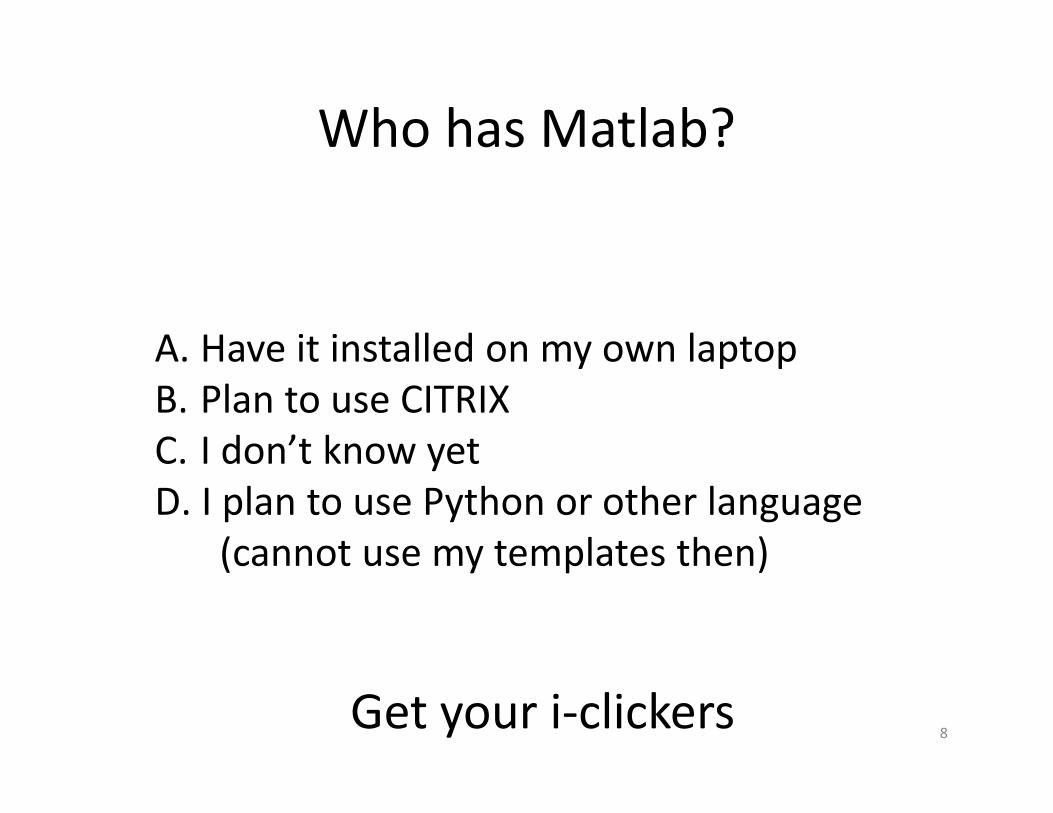
Who has Matlab?
A. Have it installed on my own laptopB. Plan to use CITRIXC. I don’t know yetD. I plan to use Python or other language
(cannot use my templates then)
Get your i‐clickers
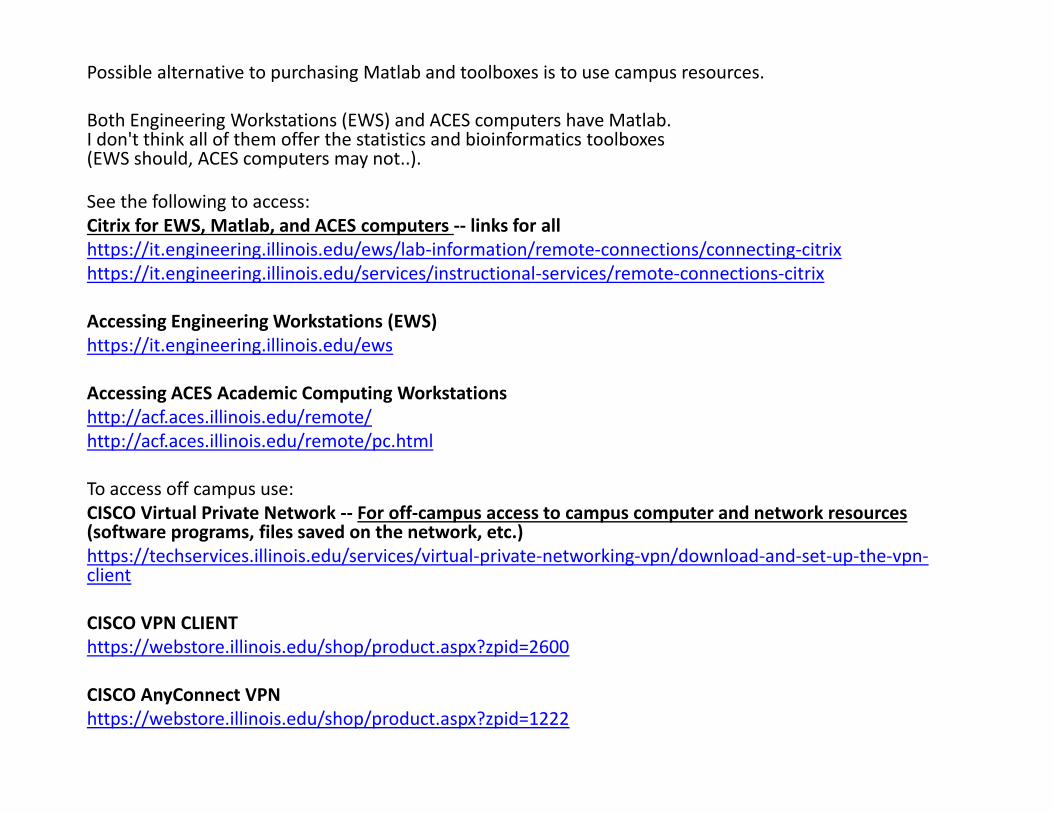
Possible alternative to purchasing Matlab and toolboxes is to use campus resources.
Both Engineering Workstations (EWS) and ACES computers have Matlab. I don't think all of them offer the statistics and bioinformatics toolboxes (EWS should, ACES computers may not..).
See the following to access:Citrix for EWS, Matlab, and ACES computers ‐‐ links for allhttps://it.engineering.illinois.edu/ews/lab‐information/remote‐connections/connecting‐citrixhttps://it.engineering.illinois.edu/services/instructional‐services/remote‐connections‐citrix
Accessing Engineering Workstations (EWS)https://it.engineering.illinois.edu/ews
Accessing ACES Academic Computing Workstationshttp://acf.aces.illinois.edu/remote/ http://acf.aces.illinois.edu/remote/pc.html
To access off campus use:CISCO Virtual Private Network ‐‐ For off‐campus access to campus computer and network resources(software programs, files saved on the network, etc.)https://techservices.illinois.edu/services/virtual‐private‐networking‐vpn/download‐and‐set‐up‐the‐vpn‐client
CISCO VPN CLIENThttps://webstore.illinois.edu/shop/product.aspx?zpid=2600
CISCO AnyConnect VPNhttps://webstore.illinois.edu/shop/product.aspx?zpid=1222
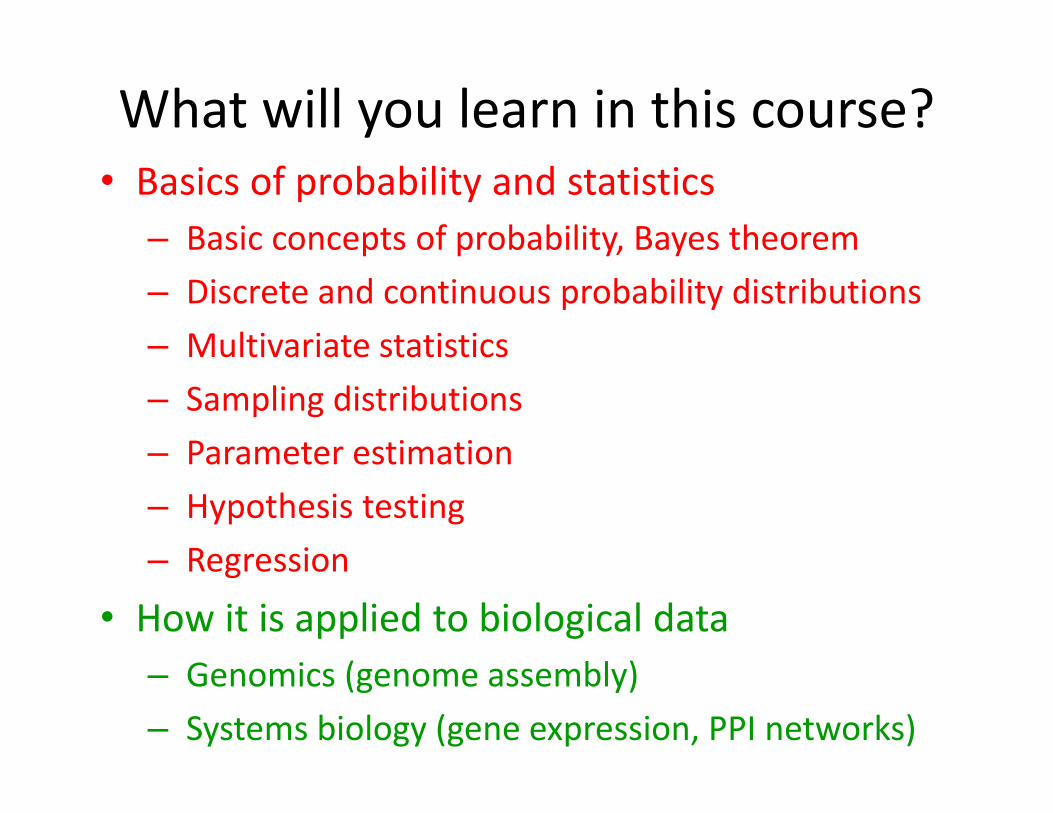
What will you learn in this course?• Basics of probability and statistics
– Basic concepts of probability, Bayes theorem– Discrete and continuous probability distributions– Multivariate statistics– Sampling distributions– Parameter estimation– Hypothesis testing– Regression
• How it is applied to biological data– Genomics (genome assembly)– Systems biology (gene expression, PPI networks)
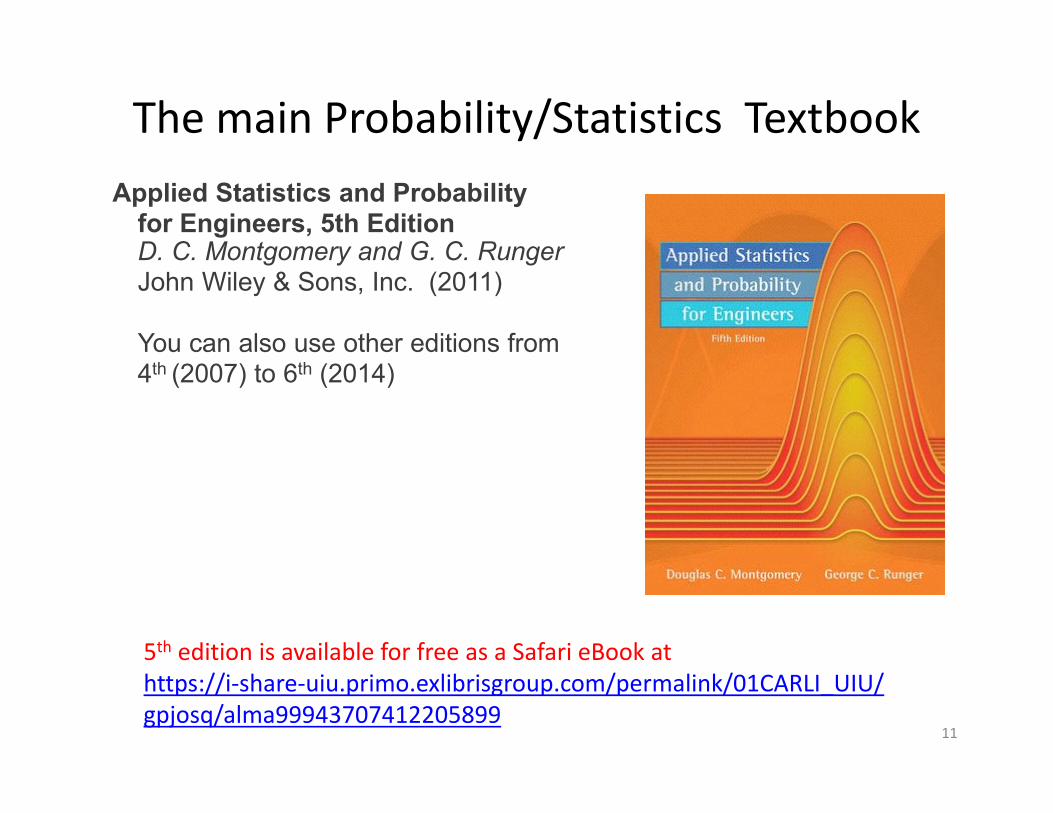
Applied Statistics and Probability for Engineers, 5th EditionD. C. Montgomery and G. C. RungerJohn Wiley & Sons, Inc. (2011)
You can also use other editions from 4th (2007) to 6th (2014)
11
5th edition is available for free as a Safari eBook at https://i‐share‐uiu.primo.exlibrisgroup.com/permalink/01CARLI_UIU/gpjosq/alma99943707412205899
The main Probability/Statistics Textbook
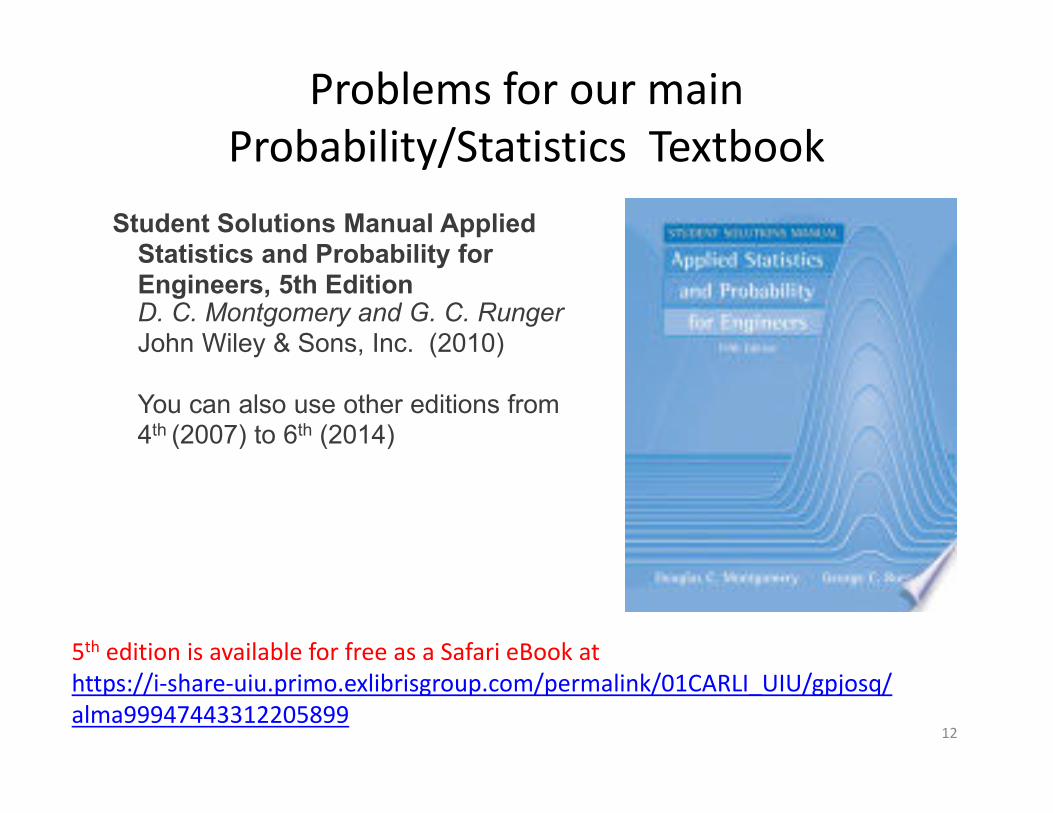
Student Solutions Manual Applied Statistics and Probability for Engineers, 5th EditionD. C. Montgomery and G. C. RungerJohn Wiley & Sons, Inc. (2010)
You can also use other editions from 4th (2007) to 6th (2014)
12
5th edition is available for free as a Safari eBook at https://i‐share‐uiu.primo.exlibrisgroup.com/permalink/01CARLI_UIU/gpjosq/alma99947443312205899
Problems for our main Probability/Statistics Textbook
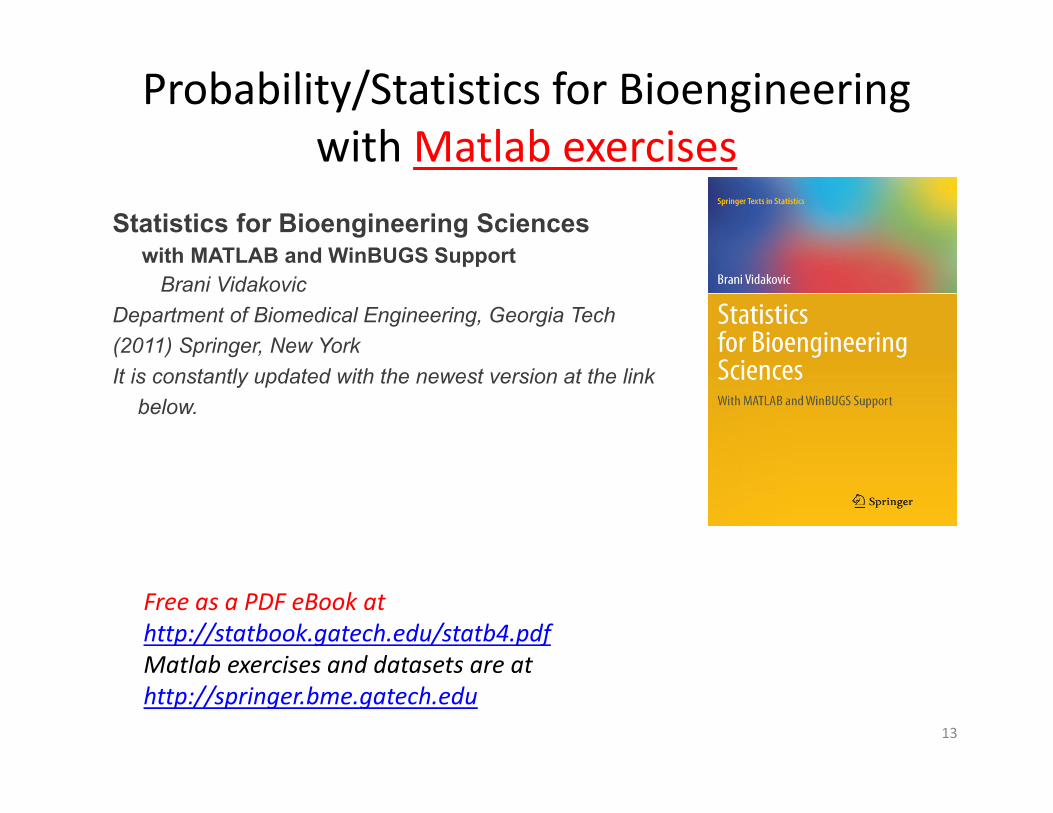
Statistics for Bioengineering Scienceswith MATLAB and WinBUGS Support
Brani VidakovicDepartment of Biomedical Engineering, Georgia Tech(2011) Springer, New YorkIt is constantly updated with the newest version at the link
below.
13
Free as a PDF eBook at http://statbook.gatech.edu/statb4.pdfMatlab exercises and datasets are at http://springer.bme.gatech.edu
Probability/Statistics for Bioengineering with Matlab exercises
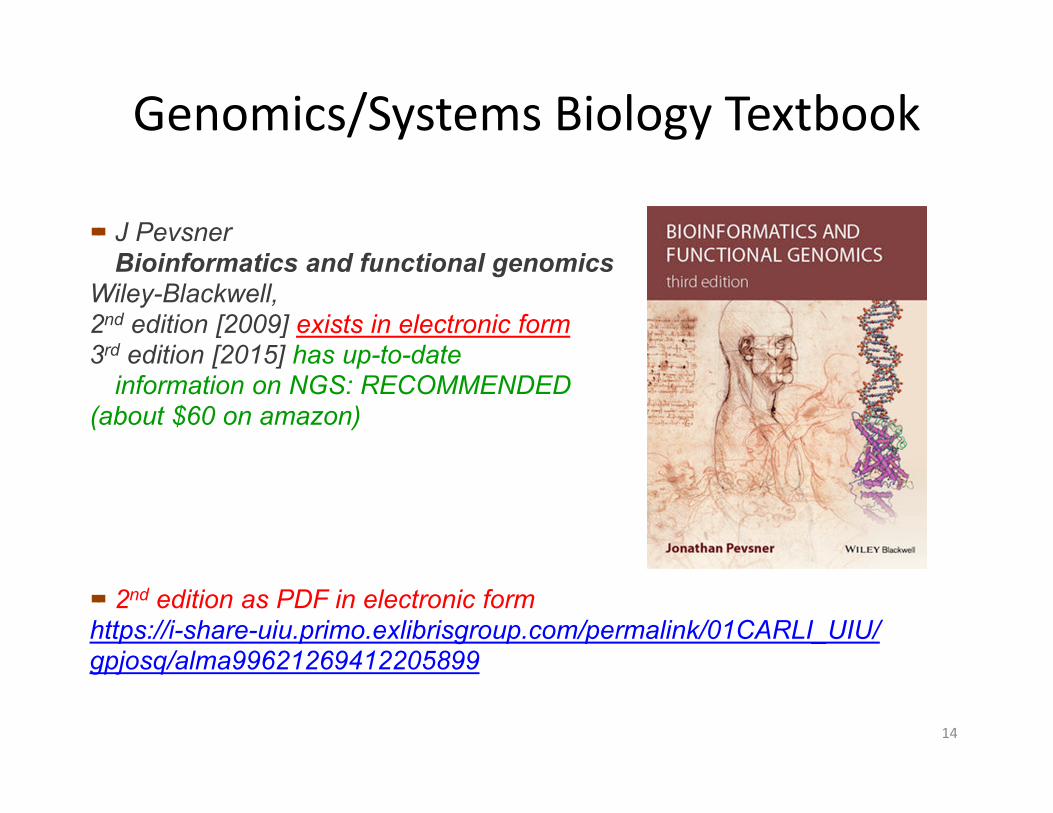
J PevsnerBioinformatics and functional genomics
Wiley-Blackwell, 2nd edition [2009] exists in electronic form3rd edition [2015] has up-to-date
information on NGS: RECOMMENDED (about $60 on amazon)
2nd edition as PDF in electronic formhttps://i-share-uiu.primo.exlibrisgroup.com/permalink/01CARLI_UIU/gpjosq/alma99621269412205899
Genomics/Systems Biology Textbook
14
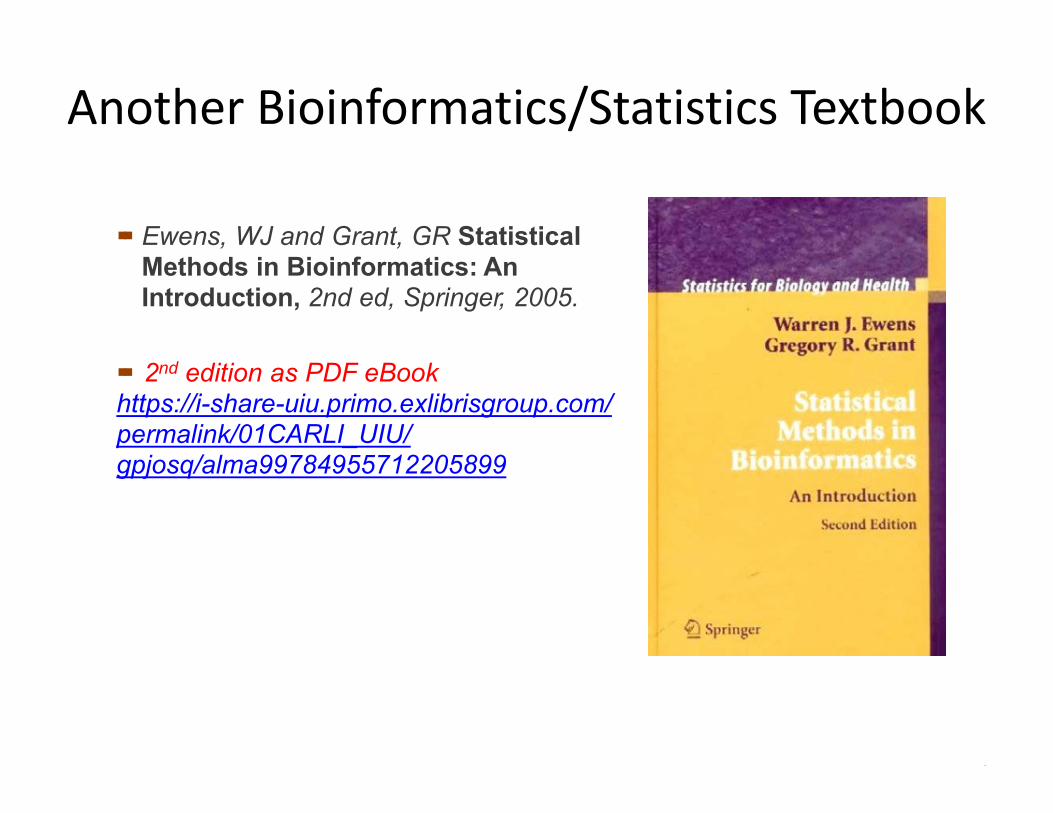
Ewens, WJ and Grant, GR Statistical Methods in Bioinformatics: An Introduction, 2nd ed, Springer, 2005.
2nd edition as PDF eBookhttps://i-share-uiu.primo.exlibrisgroup.com/permalink/01CARLI_UIU/gpjosq/alma99784955712205899
1
Another Bioinformatics/Statistics Textbook
Credit: XKCD comics
This course is about biological data and probability theory and statisticsconcepts needed for its analysis
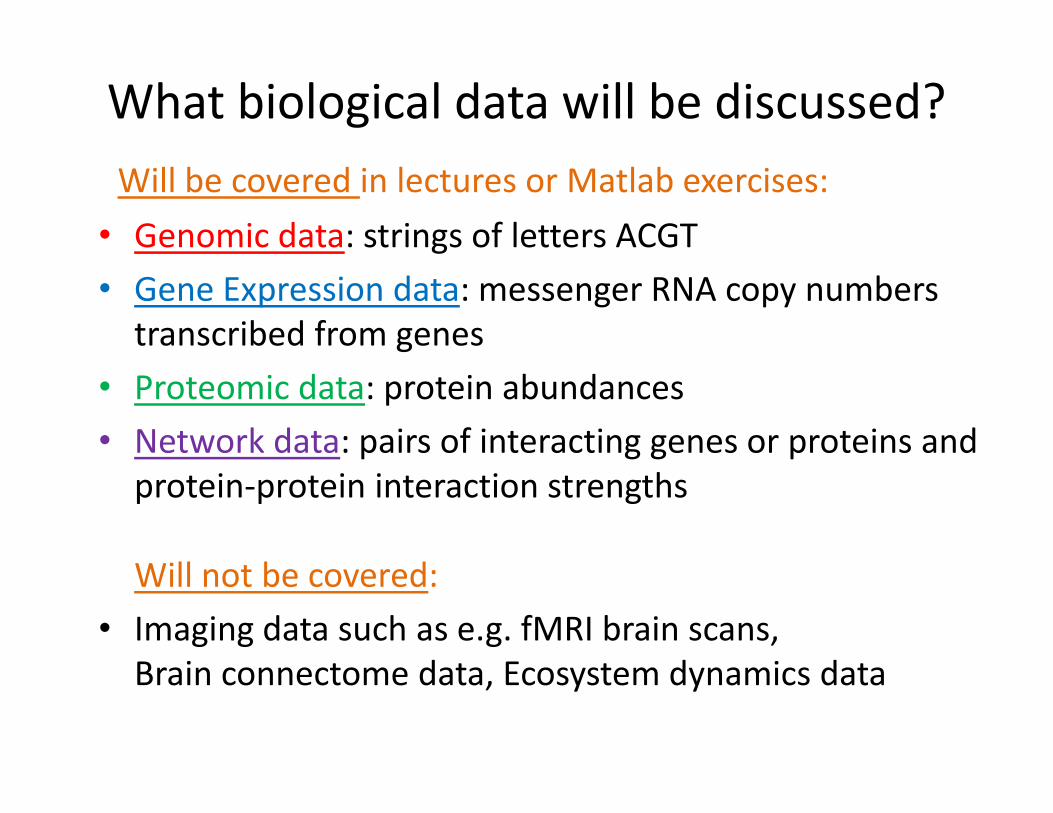
What biological data will be discussed?Will be covered in lectures or Matlab exercises:
• Genomic data: strings of letters ACGT • Gene Expression data: messenger RNA copy numbers transcribed from genes
• Proteomic data: protein abundances• Network data: pairs of interacting genes or proteins and protein‐protein interaction strengths
Will not be covered:• Imaging data such as e.g. fMRI brain scans, Brain connectome data, Ecosystem dynamics data
Why do you need probability and statistics
to analyzemodern biological data?
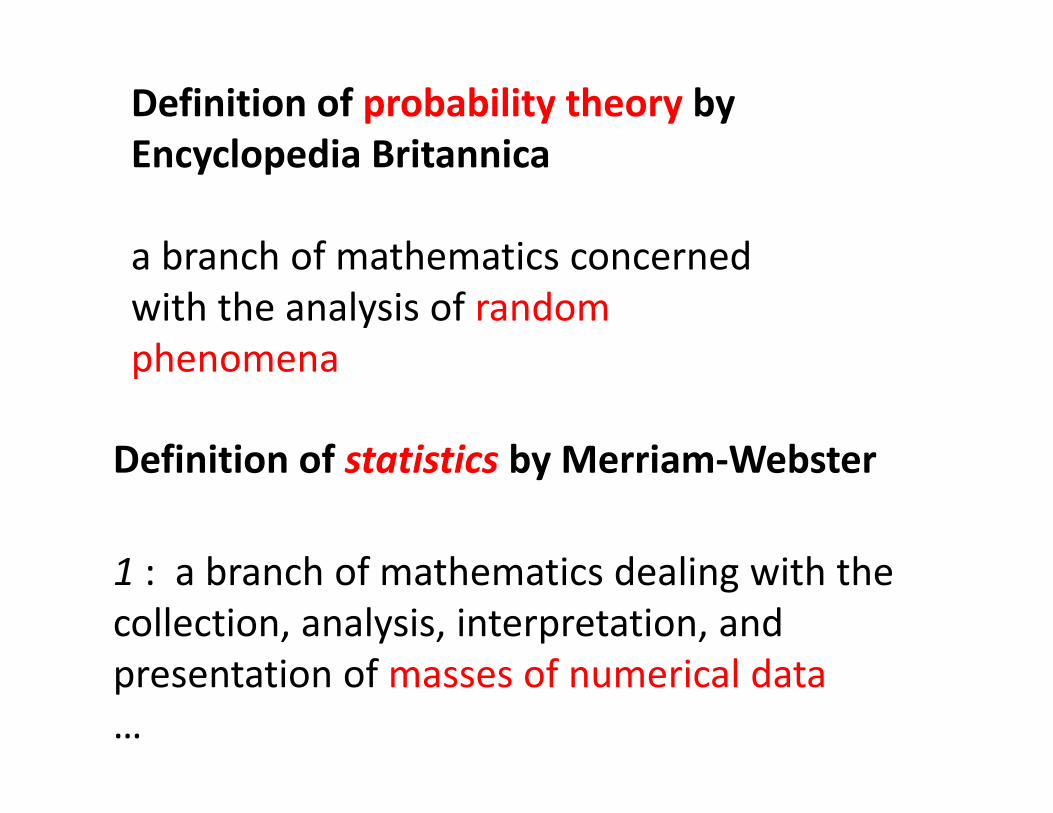
Definition of statistics by Merriam‐Webster
1 : a branch of mathematics dealing with the collection, analysis, interpretation, and presentation of masses of numerical data…
Definition of probability theory by Encyclopedia Britannica
a branch of mathematics concerned with the analysis of random phenomena
Why do you need probability and statistics
to analyzemodern biological data?
Reason 1: Biology now has Lots of Data
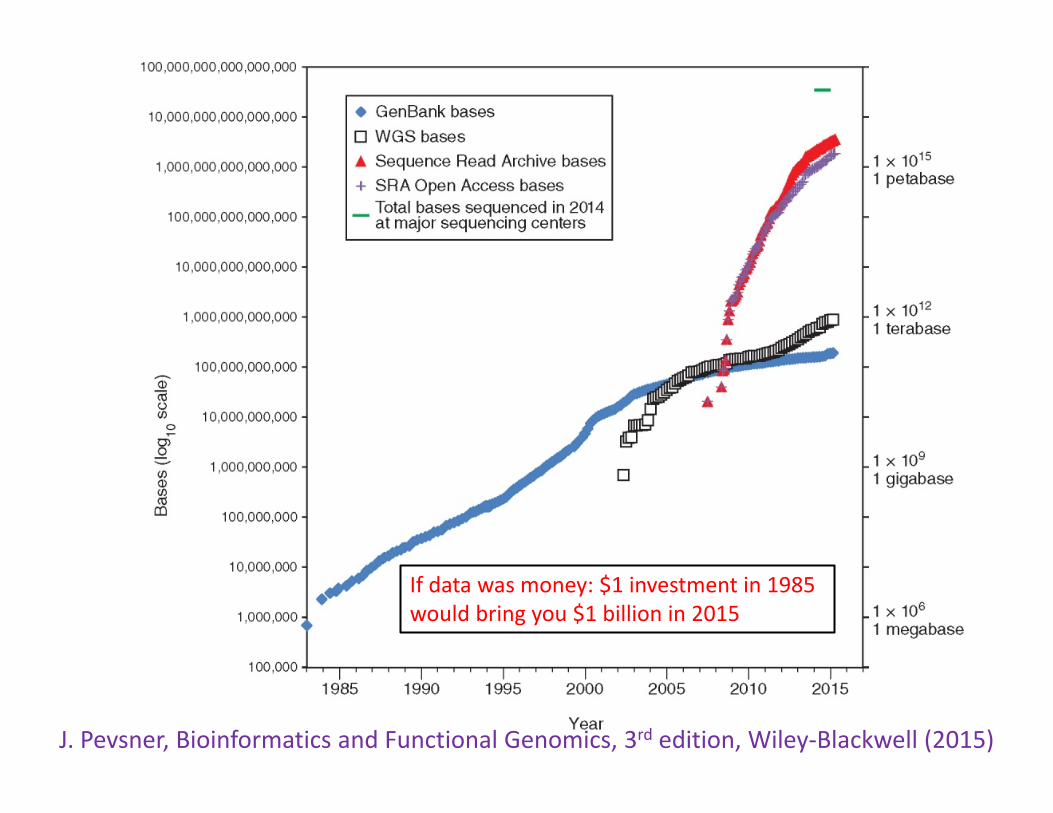
J. Pevsner, Bioinformatics and Functional Genomics, 3rd edition, Wiley‐Blackwell (2015)
If data was money: $1 investment in 1985 would bring you $1 billion in 2015
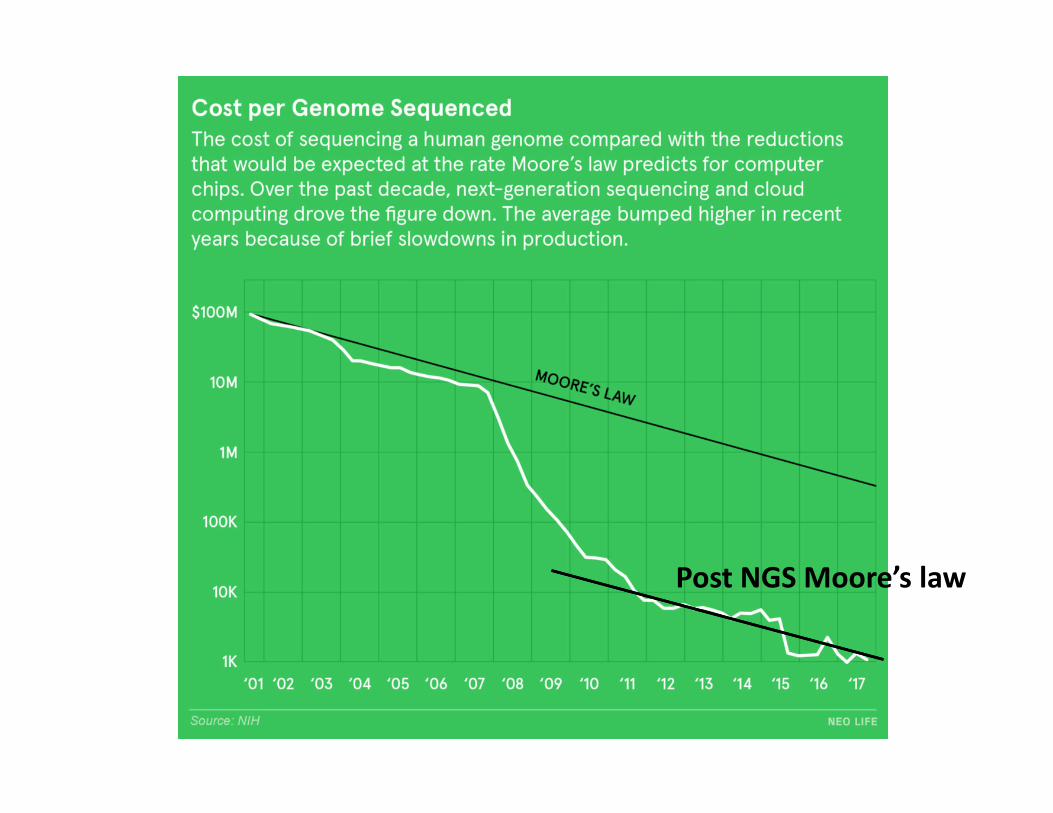
Post NGS Moore’s law
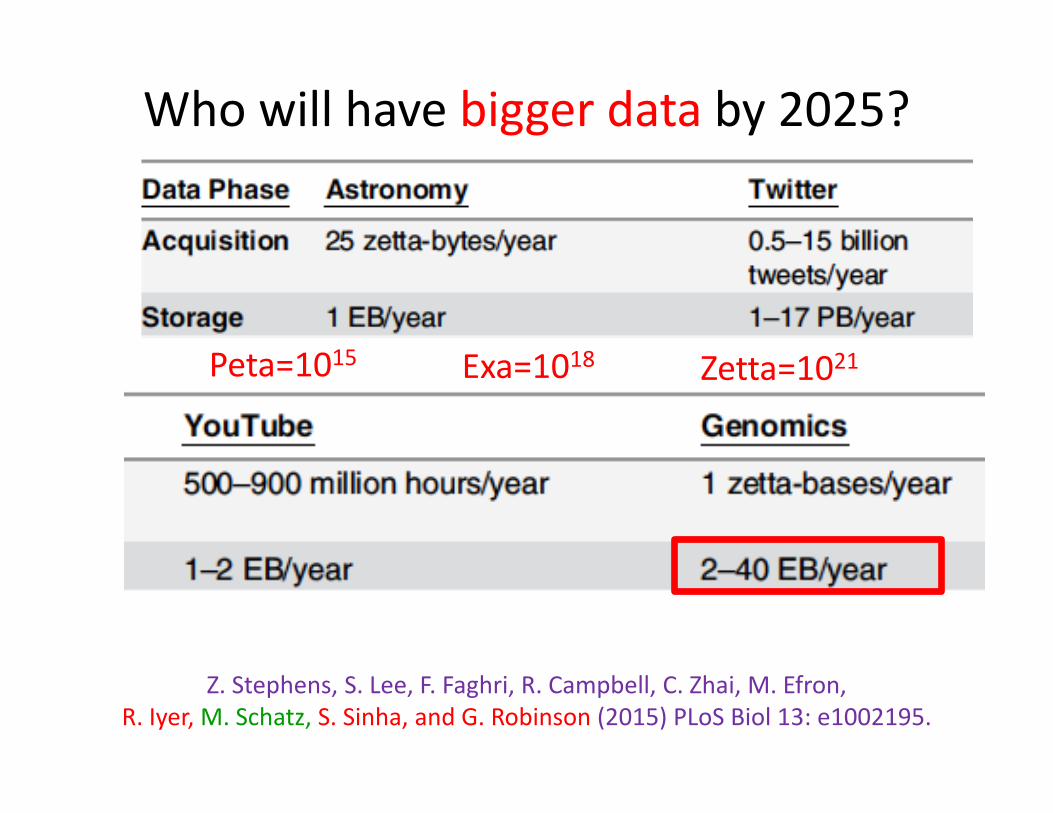
Z. Stephens, S. Lee, F. Faghri, R. Campbell, C. Zhai, M. Efron, R. Iyer, M. Schatz, S. Sinha, and G. Robinson (2015) PLoS Biol 13: e1002195.
Who will have bigger data by 2025?
Zetta=1021Exa=1018Peta=1015
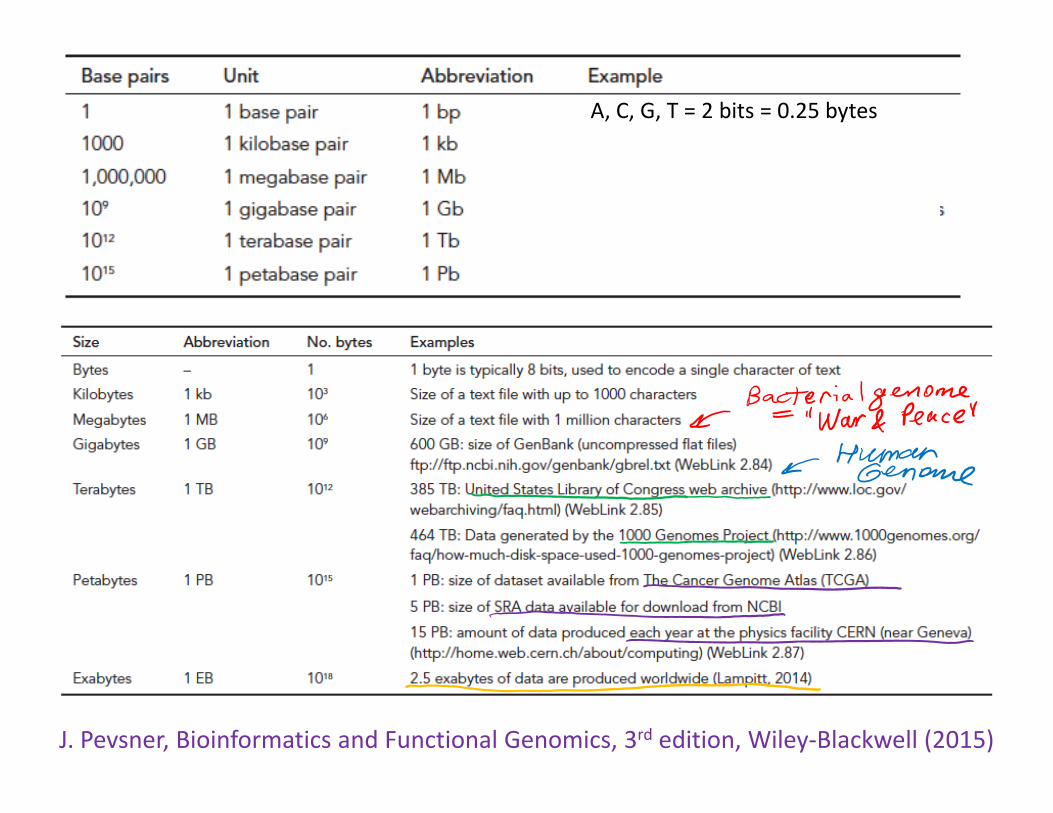
J. Pevsner, Bioinformatics and Functional Genomics, 3rd edition, Wiley‐Blackwell (2015)
A, C, G, T = 2 bits = 0.25 bytes
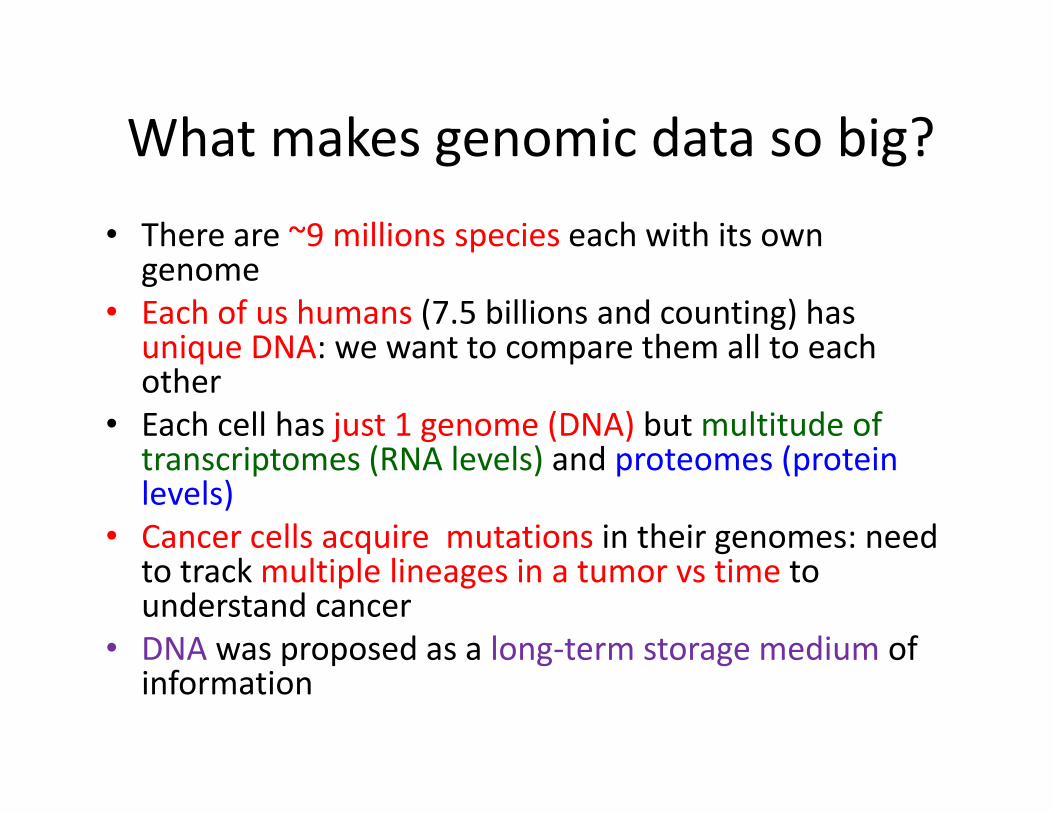
What makes genomic data so big?• There are ~9 millions species each with its own genome
• Each of us humans (7.5 billions and counting) has unique DNA: we want to compare them all to each other
• Each cell has just 1 genome (DNA) but multitude of transcriptomes (RNA levels) and proteomes (protein levels)
• Cancer cells acquire mutations in their genomes: need to track multiple lineages in a tumor vs time to understand cancer
• DNA was proposed as a long‐term storage medium of information
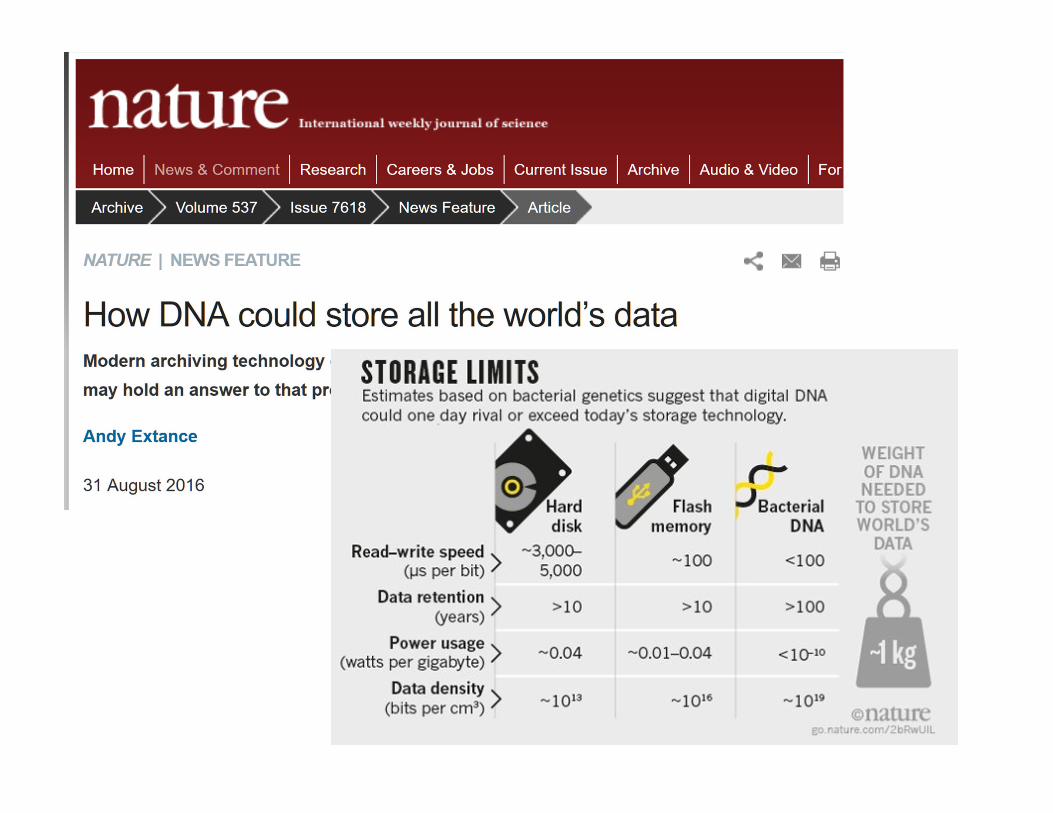
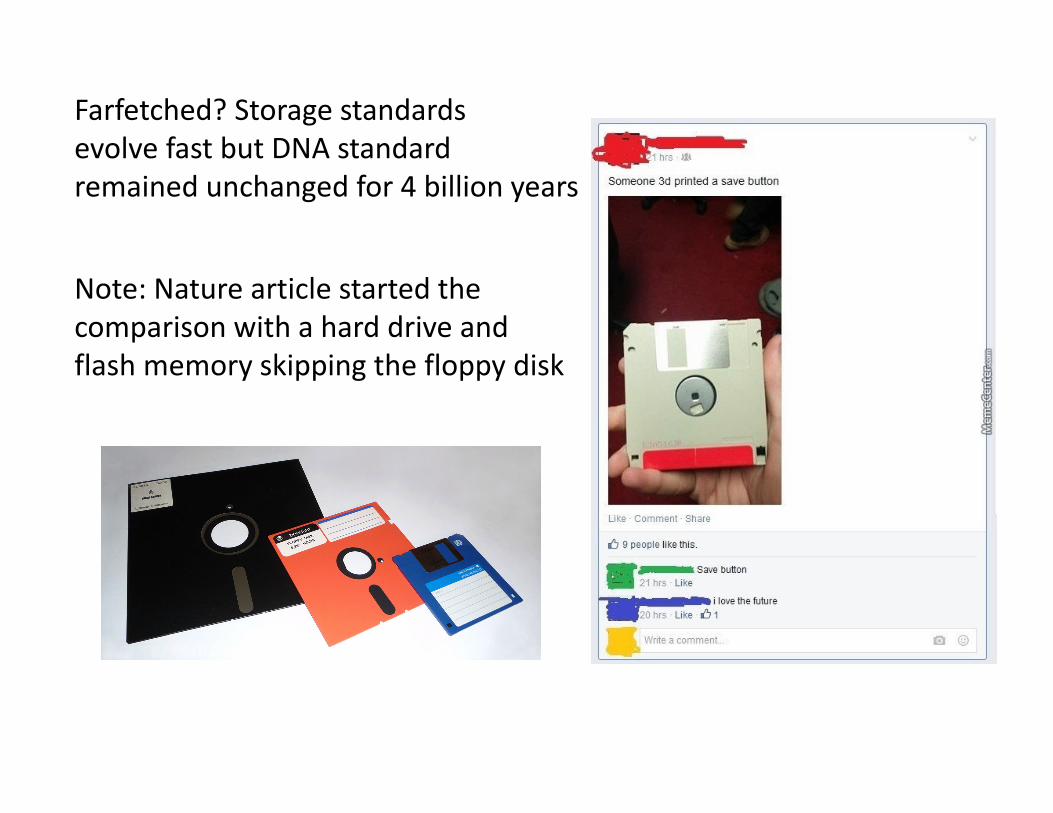
Farfetched? Storage standards evolve fast but DNA standard remained unchanged for 4 billion years
Note: Nature article started the comparison with a hard drive and flash memory skipping the floppy disk
• Prof Olgica Milenkovic from Electrical and Computer Engineering UIUC is a local expert on this topic
• Profs. George Church and Sri Kosuri (Harvard Medical School) explains a potential use of DNA as storage medium
• https://www.youtube.com/watch?v=IJAdqAVjQqY

Why do you needprobability and statistics ?
Reason 1.5: It is necessary to rationally
manage the COVID‐19 epidemic

Shameless bragging slideI was one of 28 people who received the University of Illinois Presidential Award and Medallion Past recipients include:‐William Daley, 2011chief of staff to President Barack Obama‐ Thomas M. Siebel, 2001Founder, chairman and CEO of Siebel Systems, Inc., and a major donor‐ Arthur C. Clarke, 1997Science fiction author of "2001: A Space Odyssey“‐ David W. Grainger, 1989Friend of the university and generous donor
During March and April 2020, testing was inadequate to track COVID‐19 in
Illinois …
33
During March and April 2020, testing was inadequate to track COVID‐19 in
Illinois …… The only way to see the disease was through mathematics and
modeling
34
During March and April, testing was inadequate to track COVID‐19 in
Illinois …… The only way to see the disease
was through mathematics
35
Even through the number of reported cases was small, we could predict the
dramatic effect of a pre‐emptive stay‐at‐home order
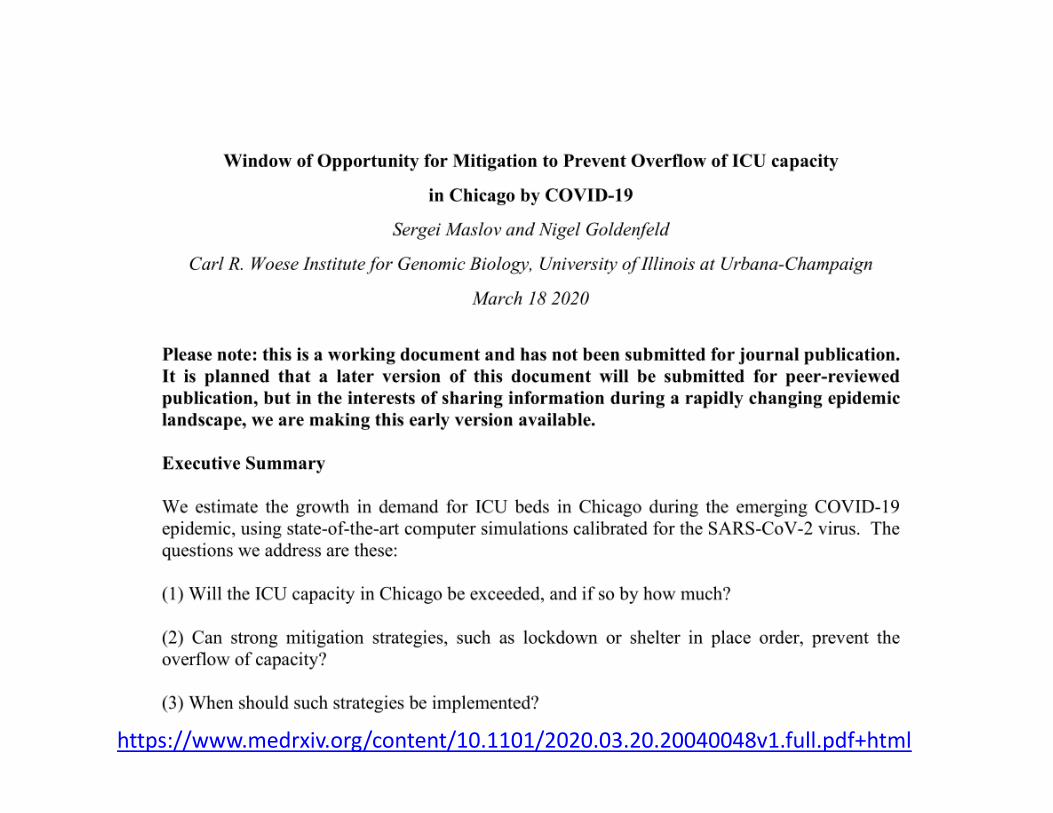
36https://www.medrxiv.org/content/10.1101/2020.03.20.20040048v1.full.pdf+html

37
Wuhan‐levelimplemented at different times
Early mitigation makes a big difference!
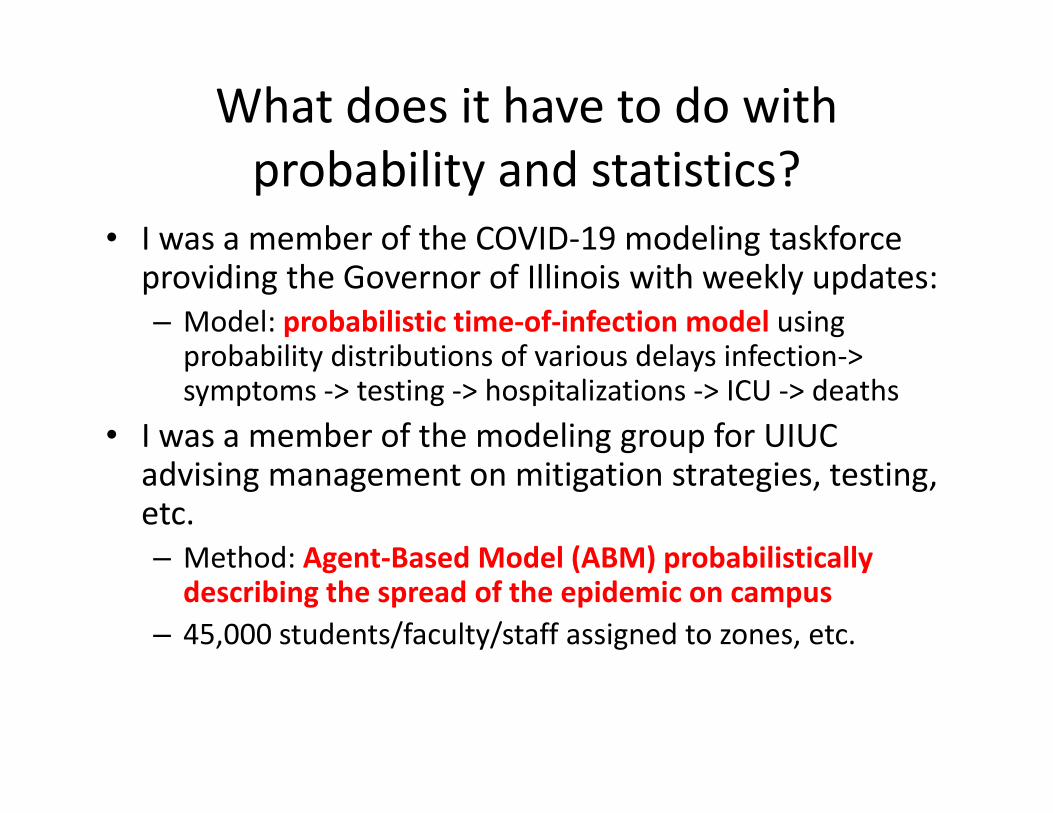
What does it have to do with probability and statistics?
• I was a member of the COVID‐19 modeling taskforce providing the Governor of Illinois with weekly updates:– Model: probabilistic time‐of‐infection model using probability distributions of various delays infection‐> symptoms ‐> testing ‐> hospitalizations ‐> ICU ‐> deaths
• I was a member of the modeling group for UIUC advising management on mitigation strategies, testing,etc.– Method: Agent‐Based Model (ABM) probabilistically describing the spread of the epidemic on campus
– 45,000 students/faculty/staff assigned to zones, etc.
SEEING THE COVID‐19 EPIDEMIC WITHMATHEMATICS AND COMPUTER SIMULATIONS
Sergei Maslov (UIUC Bioengineering) Nigel Goldenfeld (UIUC Physics)
COVID‐19 MODELLING GROUP
Ahmed Elbanna (Civil Eng.), Zach Weiner (Physics), George Wong (Physics), Tong
Wang (Physics),
Alexei TkachenkoBrookhaven National Laboratory
39
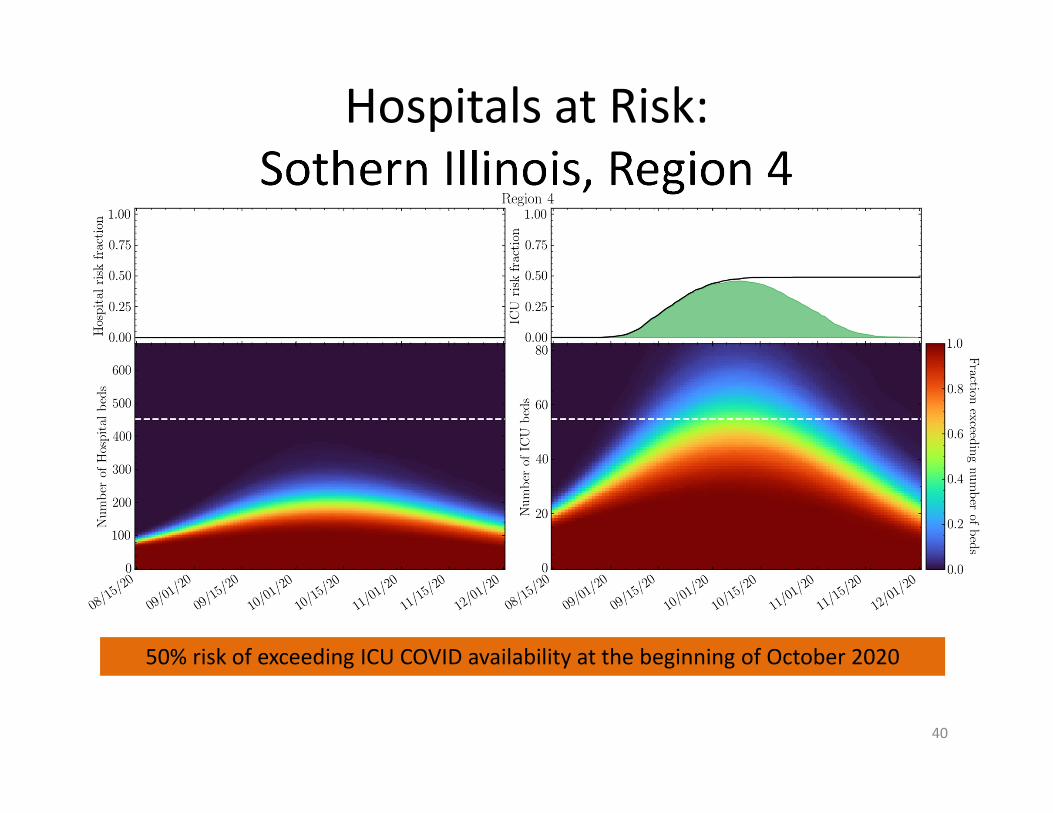
Hospitals at Risk: Sothern Illinois, Region 4
40
50% risk of exceeding ICU COVID availability at the beginning of October 2020
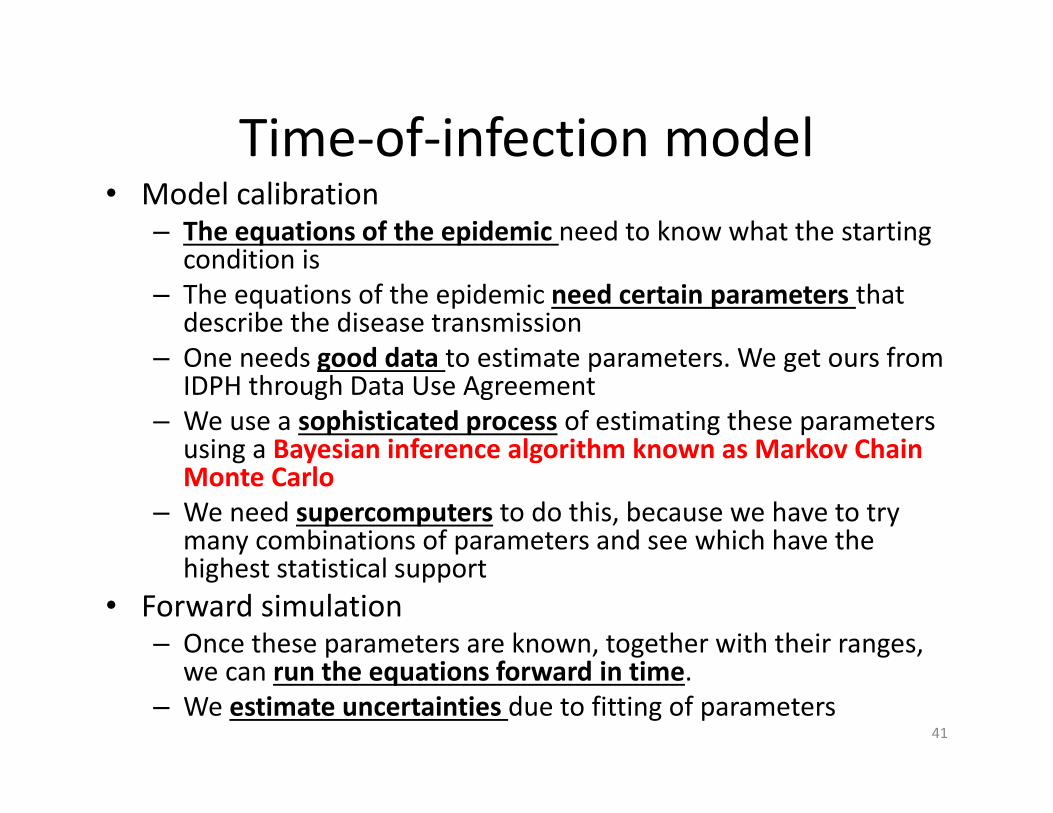
Time‐of‐infection model• Model calibration
– The equations of the epidemic need to know what the starting condition is
– The equations of the epidemic need certain parameters that describe the disease transmission
– One needs good data to estimate parameters. We get ours from IDPH through Data Use Agreement
– We use a sophisticated process of estimating these parameters using a Bayesian inference algorithm known as Markov Chain Monte Carlo
– We need supercomputers to do this, because we have to try many combinations of parameters and see which have the highest statistical support
• Forward simulation– Once these parameters are known, together with their ranges,
we can run the equations forward in time.– We estimate uncertainties due to fitting of parameters
41
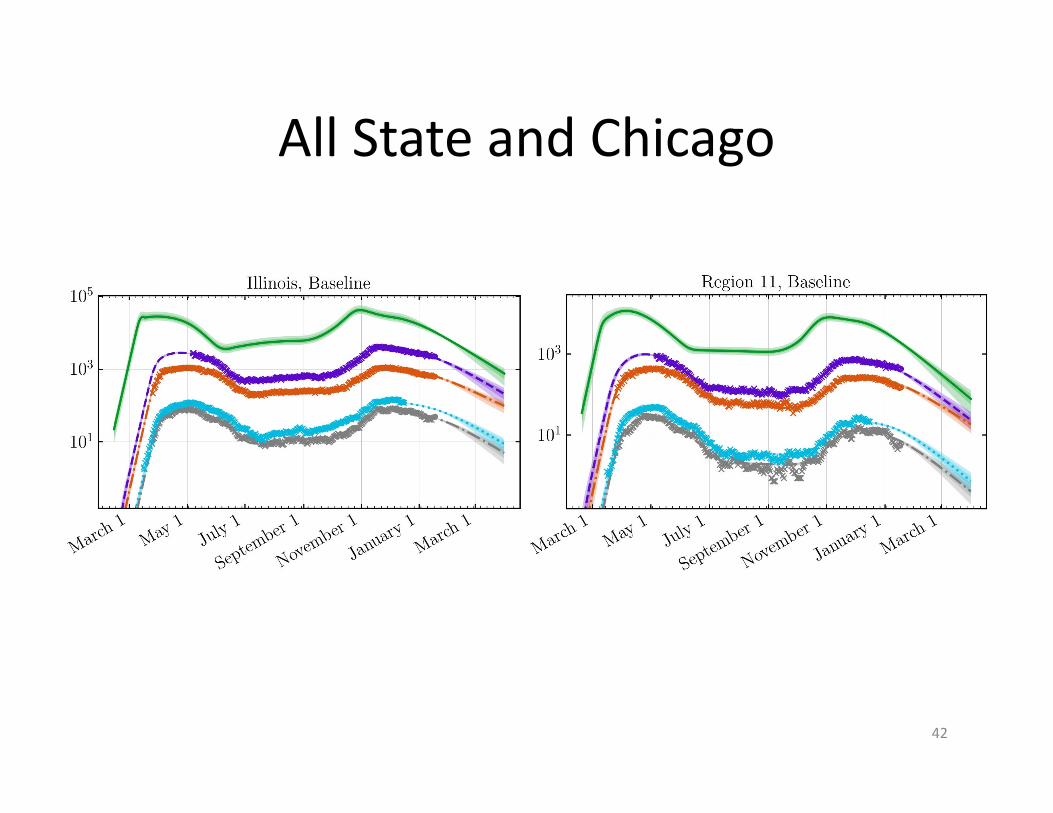
All State and Chicago
42
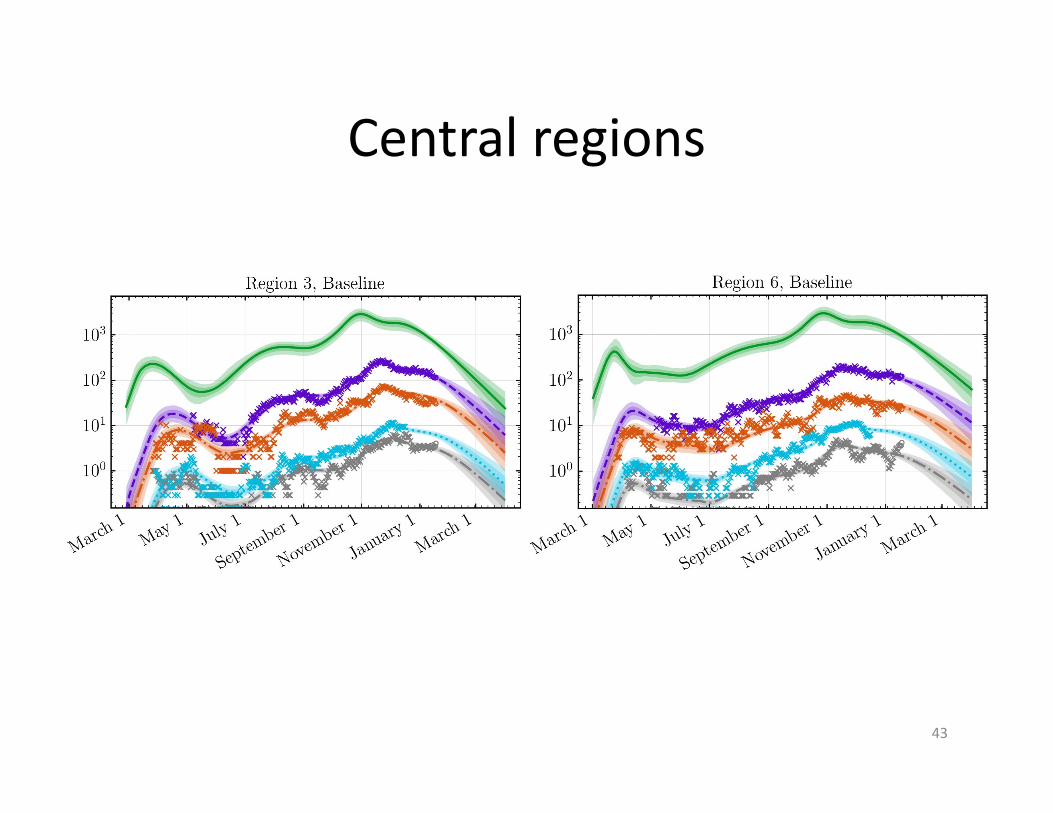
Central regions
43
Agent Based Model of COVID‐19 epidemic at our University
• Special feature of the University is that students and professors come together at specific times and places for classes– Agents (40,000 or more = students + workers)– Zones (classrooms, bars, restaurants, dorms, coffee shops, library, parties)
• Data input: we constructed the network of students and classroom zones from anonymized data of all students at UIUC in Fall 2019
44
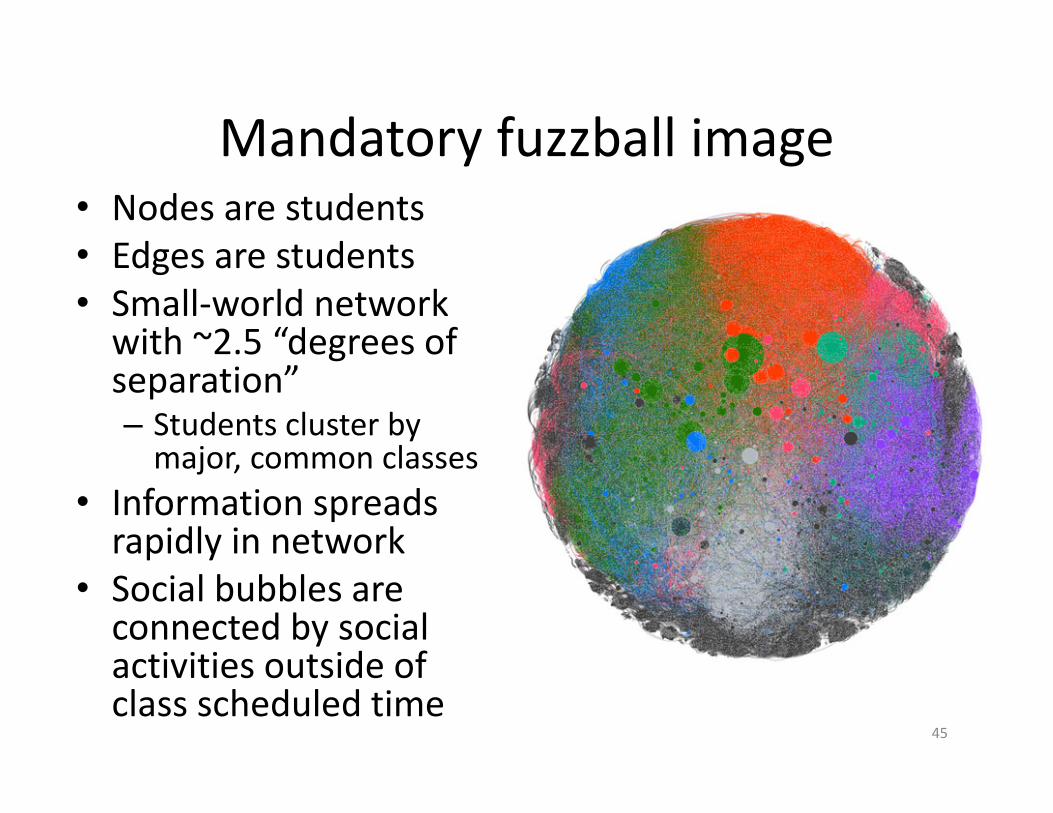
Mandatory fuzzball image• Nodes are students• Edges are students• Small‐world network with ~2.5 “degrees of separation”– Students cluster by major, common classes
• Information spreads rapidly in network
• Social bubbles are connected by social activities outside of class scheduled time
45
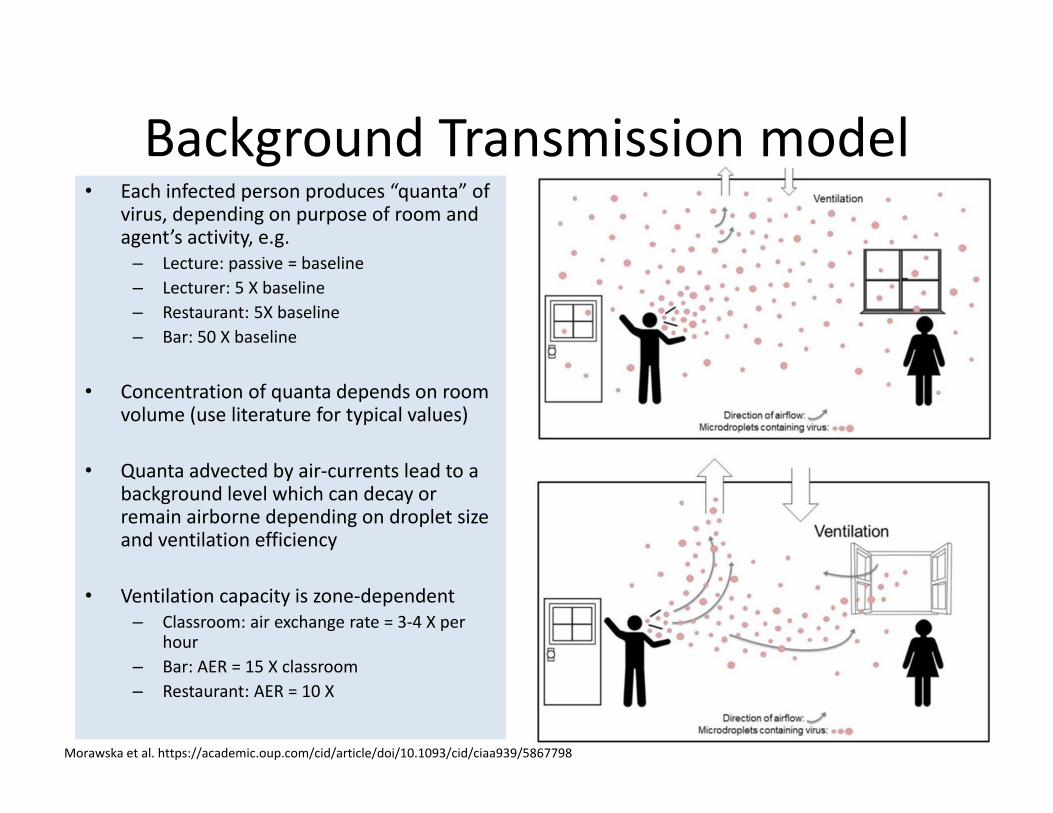
Background Transmission model• Each infected person produces “quanta” of
virus, depending on purpose of room and agent’s activity, e.g.
– Lecture: passive = baseline– Lecturer: 5 X baseline– Restaurant: 5X baseline– Bar: 50 X baseline
• Concentration of quanta depends on room volume (use literature for typical values)
• Quanta advected by air‐currents lead to a background level which can decay or remain airborne depending on droplet size and ventilation efficiency
• Ventilation capacity is zone‐dependent– Classroom: air exchange rate = 3‐4 X per
hour– Bar: AER = 15 X classroom– Restaurant: AER = 10 X
46Morawska et al. https://academic.oup.com/cid/article/doi/10.1093/cid/ciaa939/5867798
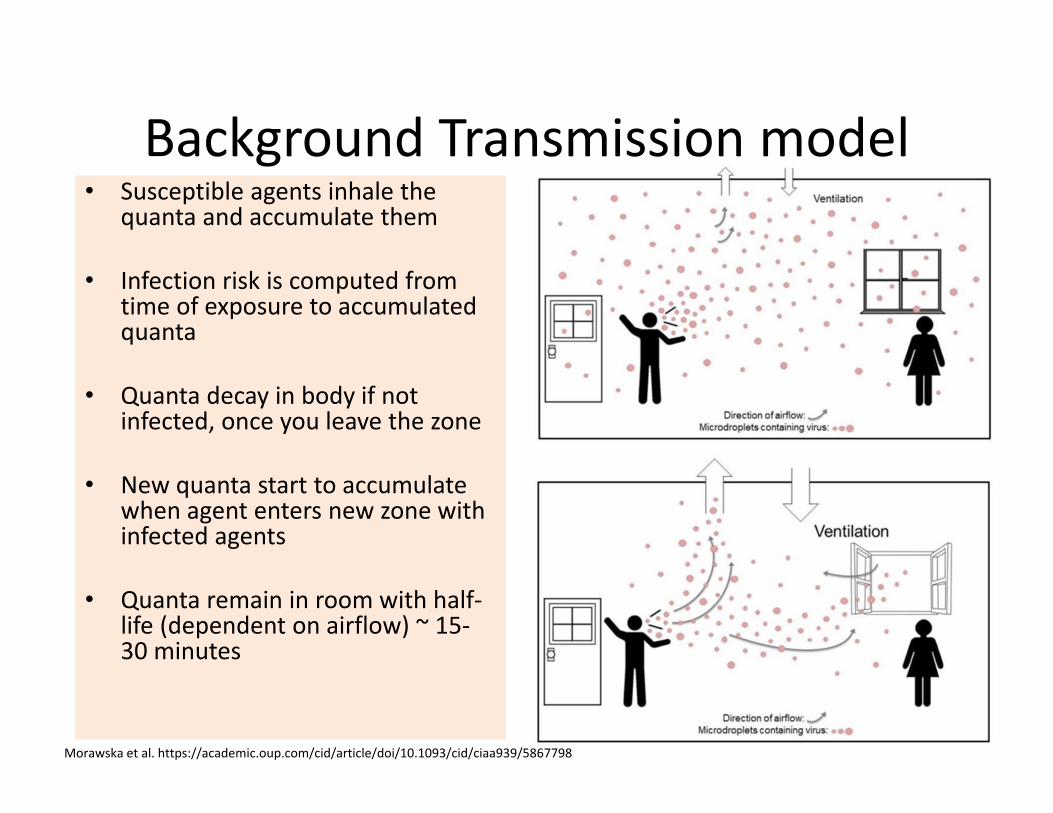
Background Transmission model• Susceptible agents inhale the
quanta and accumulate them
• Infection risk is computed from time of exposure to accumulated quanta
• Quanta decay in body if not infected, once you leave the zone
• New quanta start to accumulate when agent enters new zone with infected agents
• Quanta remain in room with half‐life (dependent on airflow) ~ 15‐30 minutes
47Morawska et al. https://academic.oup.com/cid/article/doi/10.1093/cid/ciaa939/5867798
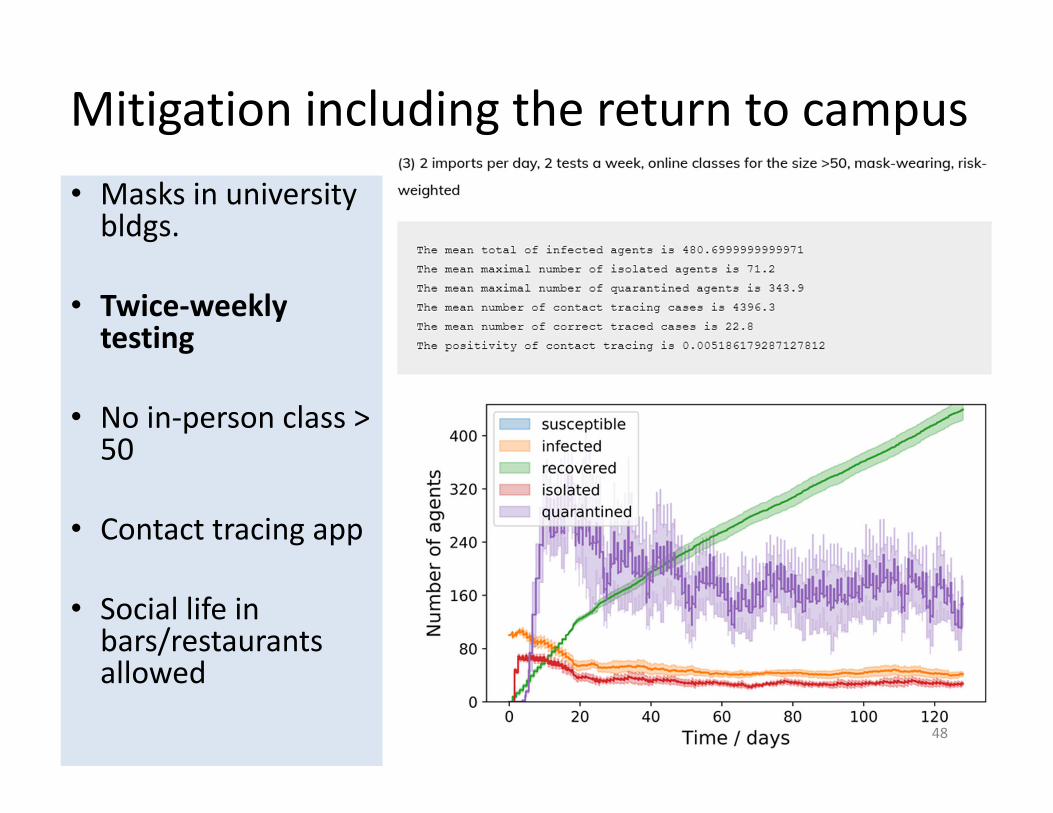
Mitigation including the return to campus
48
• Masks in university bldgs.
• Twice‐weekly testing
• No in‐person class > 50
• Contact tracing app
• Social life in bars/restaurants allowed
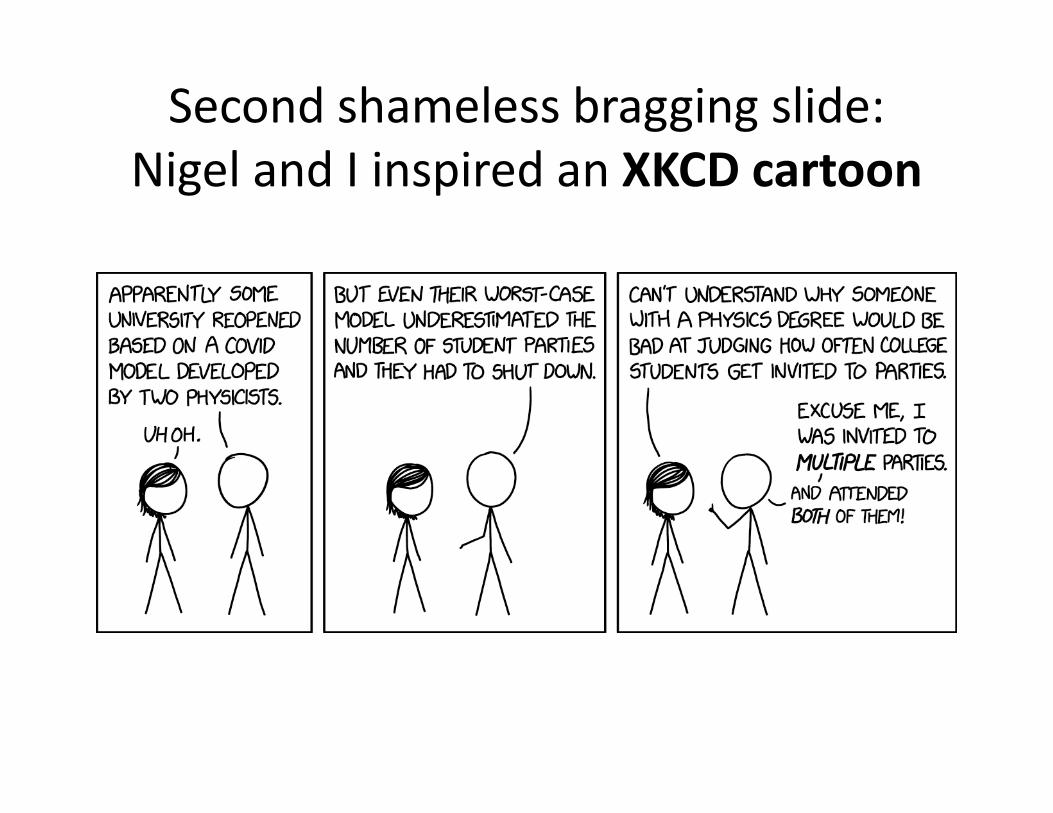
Second shameless bragging slide:Nigel and I inspired an XKCD cartoon
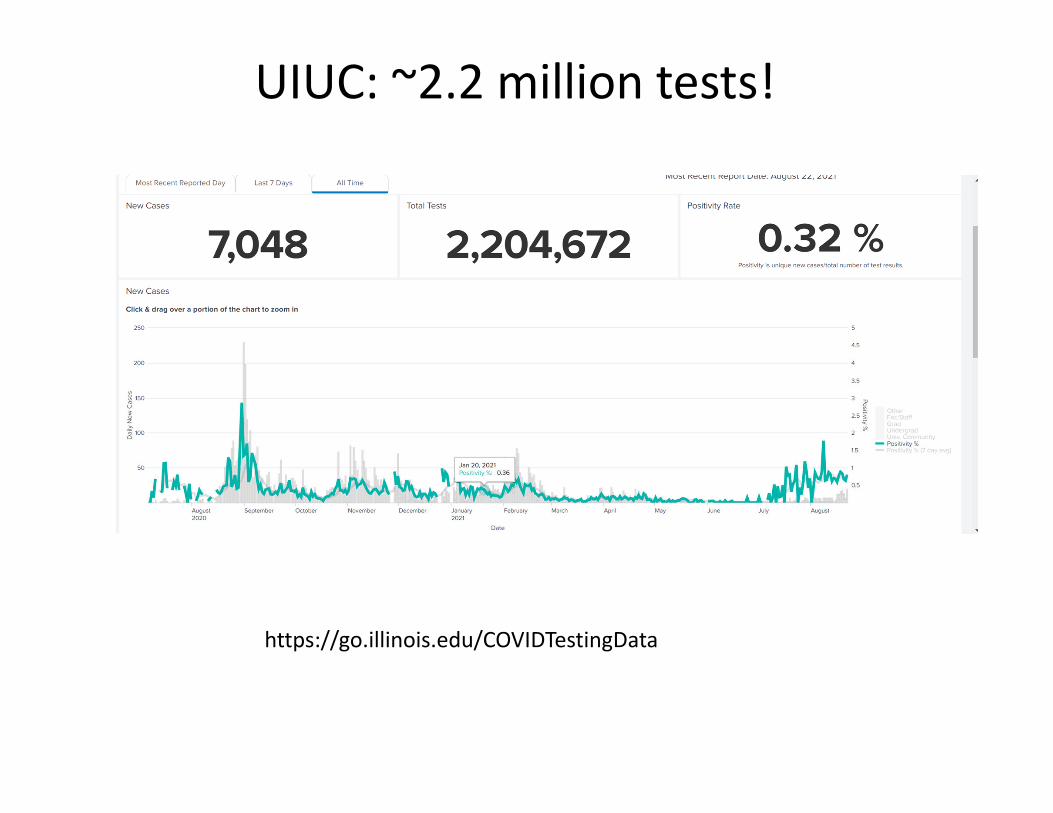
UIUC: ~2.2 million tests!
https://go.illinois.edu/COVIDTestingData
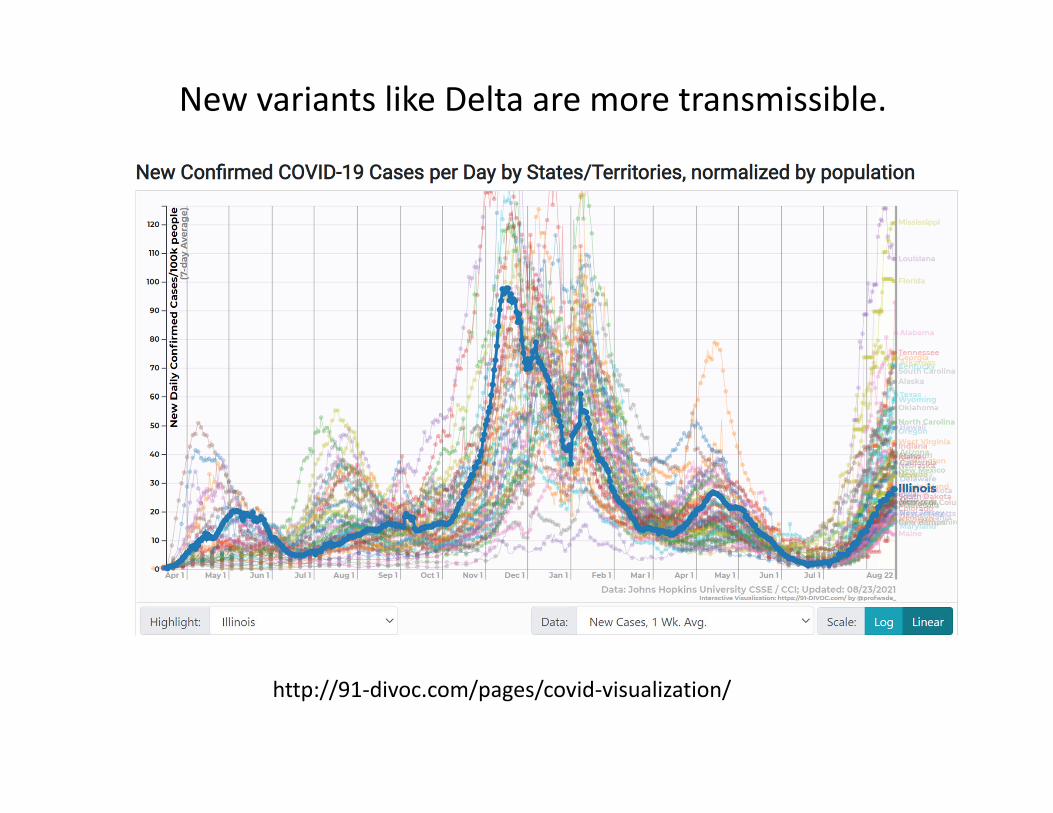
New variants like Delta are more transmissible.
http://91‐divoc.com/pages/covid‐visualization/
Why do you needprobability and statistics
to analyzemodern biological data?
Reason 2: Life is random and messy

Show video “Cell organelles”
• Made at the Walter and Eliza Hall Institute of Medical Research at Victoria, Australia
• Animated by award‐winning artist Dr. Drew Berry
• Go to https://www.wehi.edu.au/wehi‐tv for other videos
Life is messy, random, and noisy
Yet it is beautifully complexand has many parts
(see statistics)
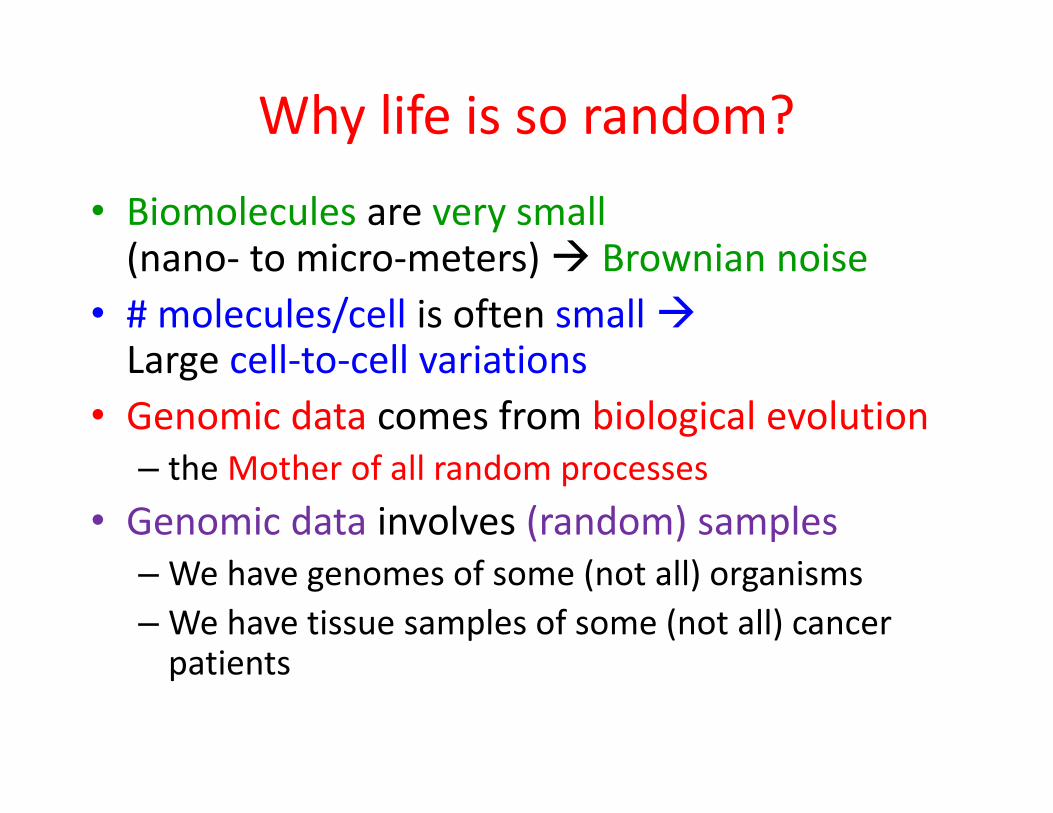
Why life is so random?• Biomolecules are very small(nano‐ to micro‐meters) Brownian noise
• # molecules/cell is often small Large cell‐to‐cell variations
• Genomic data comes from biological evolution– the Mother of all random processes
• Genomic data involves (random) samples– We have genomes of some (not all) organisms– We have tissue samples of some (not all) cancer patients
Why life is so complex?
Primer on complex system

Complex systems have many interacting parts• All parts are different from each other
– 10s thousands (104) types of proteins in an organism– 100 thousands (105 ) organizations (AS) in the Internet– 1 billion (109) people on Facebook– 10 billion (1010) web pages in the WWW– 100 billion (1011) neurons in a human brain– NOT 1023 electrons or quarks studied by physics: they are all the same and boring!
• Yet they share the same basic design – All proteins are strings of the same 20 amino acids– All WWW pages use HTML, JavaScript, etc.– All neurons generate and receive electric spikes
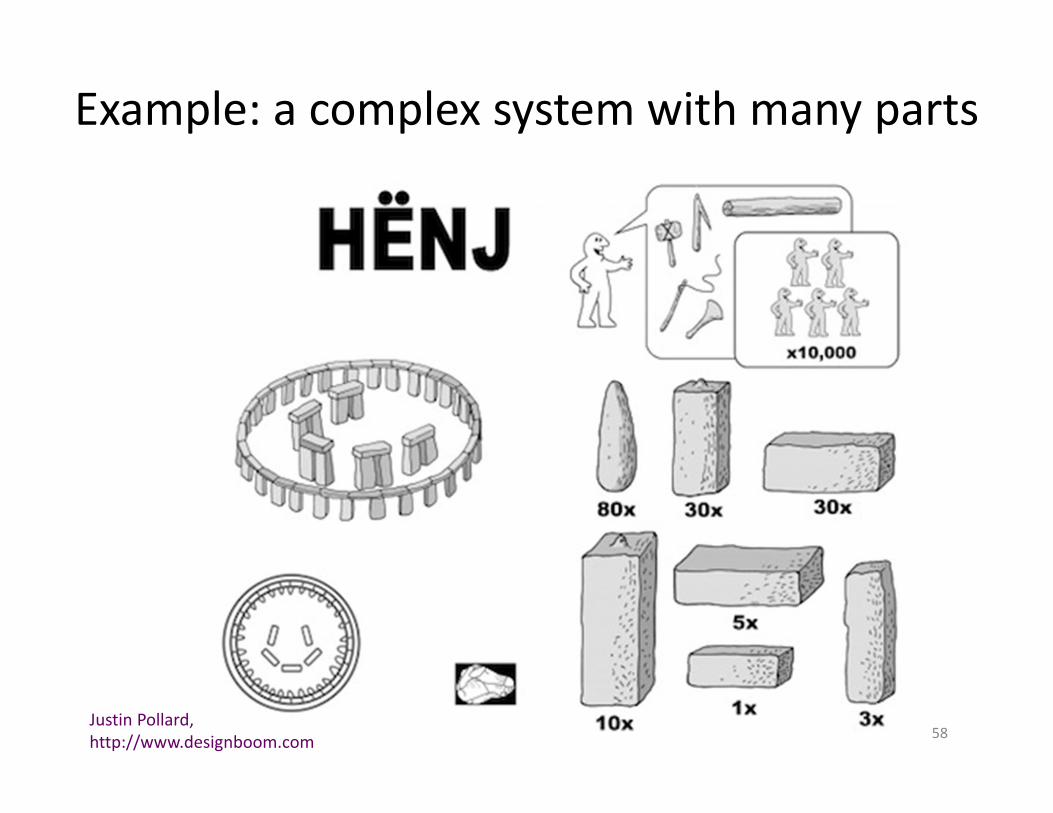
Example: a complex system with many parts
58Justin Pollard, http://www.designboom.com
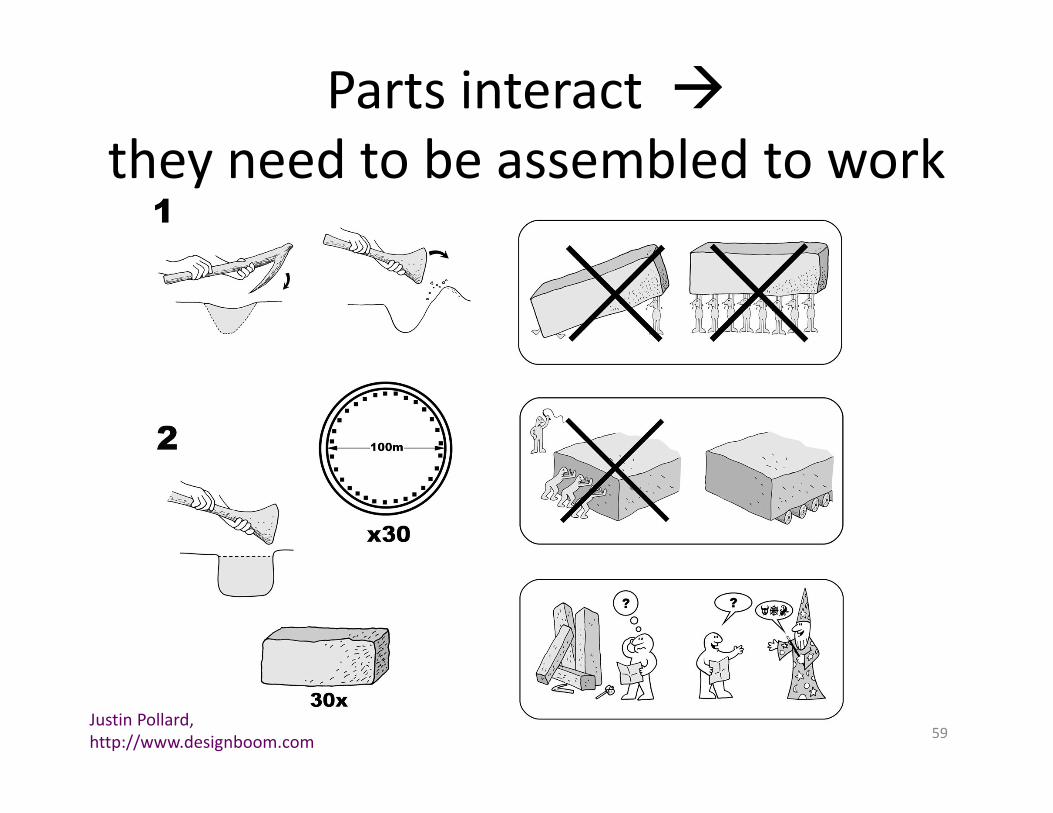
Justin Pollard, http://www.designboom.com 59
Parts interact they need to be assembled to work