High-dimensional data analysis: Selection of variables ... · 1 Selection of variables, a challenge...
17
High-dimensional data analysis: Selection of variables, data compression and graphics – Application to gene expression Ju¨rgen La¨uter ,1,2 , Friedemann Horn 1,3,4 , Maciej Roso$owski 4,5 , and Ekkehard Glimm 6 1 Interdisciplinary Centre for Bioinformatics (IZBI), University of Leipzig, Ha¨rtelstr. 16-18, 04107 Leipzig, Germany 2 Otto von Guericke University Magdeburg, Mittelstr. 2/151, 39114 Magdeburg, Germany 3 Institute of Clinical Immunology and Transfusion Medicine, Medical Faculty, University of Leipzig, Johannisallee 30, 04103 Leipzig, Germany 4 Interdisciplinary Centre of Clinical Research (IZKF), Medical Faculty, University of Leipzig, Germany 5 Institute of Medical Informatics, Statistics and Epidemiology (IMISE), Medical Faculty, University of Leipzig, Ha¨rtelstr. 16-18, 04107 Leipzig, Germany 6 Novartis Pharma AG, Lichtstr. 35, 4056 Basel, Switzerland Received 9 May 2008, revised 3 October 2008, accepted 21 December 2008 The paper presents effective and mathematically exact procedures for selection of variables which are applicable in cases with a very high dimension as, for example, in gene expression analysis. Choosing sets of variables is an important method to increase the power of the statistical conclusions and to facilitate the biological interpretation. For the construction of sets, each single variable is considered as the centre of potential sets of variables. Testing for significance is carried out by means of the Westfall-Young principle based on resampling or by the parametric method of spherical tests. The particular requirements for statistical stability are taken into account; each kind of overfitting is avoided. Thus, high power is attained and the familywise type I error can be kept in spite of the large dimension. To obtain graphical representations by heat maps and curves, a specific data compression technique is applied. Gene expression data from B-cell lymphoma patients serve for the demon- stration of the procedures. Key words: Data compression; Gene expression analysis; High-dimensional tests; Multivariate analysis; Selection of variables. Supporting Information for this article is available from the author or on the WWW under http://dx.doi.org/10.1002/bimj.200800207. 1 Selection of variables, a challenge for statisticians Selection of variables and model choice play an important role in classical regression analysis, in multivariate analysis of variance and in discriminant analysis, as well as in logistic regression and other generalized linear models, and also in the Cox model of survival analysis. In all these cases, the response variables are related to the explanatory variables by a linear setup with unknown coefficients. Strategies for the search of essential variables are similar to the well-known methods from least-squares theory. Decisions on the choice of variables are based, if available, on * Correspondence to: e-mail: [email protected], Phone: 149391616427, Fax:1493915313937 r 2009 WILEY-VCH Verlag GmbH & Co. KGaA, Weinheim Biometrical Journal 51 (2009) 2, 235–251 DOI: 10.1002/bimj.200800207 235
Transcript of High-dimensional data analysis: Selection of variables ... · 1 Selection of variables, a challenge...

High-dimensional data analysis: Selection of variables, data
compression and graphics – Application to gene expression
Jurgen Lauter�,1,2, Friedemann Horn1,3,4, Maciej Roso$owski4,5, andEkkehard Glimm6
1 Interdisciplinary Centre for Bioinformatics (IZBI), University of Leipzig, Hartelstr. 16-18,
04107 Leipzig, Germany2 Otto von Guericke University Magdeburg, Mittelstr. 2/151, 39114 Magdeburg, Germany3 Institute of Clinical Immunology and Transfusion Medicine, Medical Faculty, University of
Leipzig, Johannisallee 30, 04103 Leipzig, Germany4 Interdisciplinary Centre of Clinical Research (IZKF), Medical Faculty, University of Leipzig,
Germany5 Institute of Medical Informatics, Statistics and Epidemiology (IMISE), Medical Faculty,
University of Leipzig, Hartelstr. 16-18, 04107 Leipzig, Germany6 Novartis Pharma AG, Lichtstr. 35, 4056 Basel, Switzerland
Received 9 May 2008, revised 3 October 2008, accepted 21 December 2008
The paper presents effective and mathematically exact procedures for selection of variables which areapplicable in cases with a very high dimension as, for example, in gene expression analysis. Choosingsets of variables is an important method to increase the power of the statistical conclusions and tofacilitate the biological interpretation. For the construction of sets, each single variable is consideredas the centre of potential sets of variables. Testing for significance is carried out by means of theWestfall-Young principle based on resampling or by the parametric method of spherical tests. Theparticular requirements for statistical stability are taken into account; each kind of overfitting isavoided. Thus, high power is attained and the familywise type I error can be kept in spite of the largedimension. To obtain graphical representations by heat maps and curves, a specific data compressiontechnique is applied. Gene expression data from B-cell lymphoma patients serve for the demon-stration of the procedures.
Key words: Data compression; Gene expression analysis; High-dimensional tests;Multivariate analysis; Selection of variables.
Supporting Information for this article is available from the author or on the WWW underhttp://dx.doi.org/10.1002/bimj.200800207.
1 Selection of variables, a challenge for statisticians
Selection of variables and model choice play an important role in classical regression analysis, inmultivariate analysis of variance and in discriminant analysis, as well as in logistic regression andother generalized linear models, and also in the Cox model of survival analysis. In all thesecases, the response variables are related to the explanatory variables by a linear setup withunknown coefficients. Strategies for the search of essential variables are similar to the well-knownmethods from least-squares theory. Decisions on the choice of variables are based, if available, on
* Correspondence to: e-mail: [email protected], Phone: 149391616427, Fax:1493915313937
r 2009 WILEY-VCH Verlag GmbH & Co. KGaA, Weinheim
Biometrical Journal 51 (2009) 2, 235–251 DOI: 10.1002/bimj.200800207 235

multivariate overall tests, but mostly on conditional likelihood ratio tests for single variables. Mostsoftware packages provide an exhaustive evaluation of all possible sets of variables, or alternativelyseveral variants of stepwise forward and backward selection procedures.
These approaches, however are fraught with difficulties. On a technical level, the computationalburden can be prohibitive: For p variables, there are 2p different sets of variables. Obviously,these cannot all be checked step by step if p is large. Thus, for example, if p5 20 000 genes areinvestigated in gene expression analysis, then 220 000 sets of variables exist, and this number is greaterthan 106000.
Even if we do not consider this huge dimension, difficult problems arise. Many selection proce-dures, in which ‘‘best subsets of variables’’ are searched on the basis of a given sample, are disposedto evaluate the variables too optimistically. Merely minimizing the deviations between the modeland the sample as, for example, in the ‘‘branch and bound algorithm’’ by Furnival and Wilson(1974) does not guarantee the relevance of a subset. If, directly or indirectly, a structural or causalanalysis of the variables is carried out according to the method of least squares, then often‘‘overfitted’’ conclusions are obtained. The models fit the given samples very well, but they do notsufficiently describe the true multivariate distributions at hand. The stepwise selection proceduresmentioned above are plausible at first sight but, in many cases, they do not attain the sets ofvariables that are essential for practical applications. The important single variables and sets ofvariables are possibly hidden by intercorrelations, ‘‘masked’’, and therefore, they cannot berecognized reliably.
The theory of the multivariate linear model developed elegantly in the last half century couldnot yet overcome the great problems of statistical instability. Statisticians knew that a highdimension and a high correlation between the variables render difficulties in the selection proce-dures. Thus, many attempts of a computational stabilization have been made with ‘‘ridge’’,‘‘shrinkage’’, ‘‘penalizing’’, ‘‘lasso’’, ‘‘lars’’ etc. methods (Hoerl and Kennard, 1970; Anderson andBlair, 1982; Tibshirani, 1996; Efron et al., 2004; Hastie, Tibshirani and Friedman, 2001). However,such interventions suffered always from some subjectivity, and their precise mathematical con-sequences remained unclear. The main deficiency was that the unified theoretical structure of theprocedures was lost and, in particular, the type I error rate could not be strictly kept in such aselection.
This situation left statisticians with a dilemma for a long time: They wanted to get data with manyvariables, with much information. On the other hand, they could not analyze the high-dimensionaldata in a satisfactory way. If the algorithms implemented in the most popular statistical softwaretools were applied, for example, with a stepwise selection procedure or with subjective ridge-correction terms, then the derived statistical conclusions were uncontrollably biased. In the past,until the nineties, the only actually reliable methods of selection of variables were the classicalparametric and non-parametric tests in connection with multiple testing procedures, like the closedtest principle, ultimately based on the rules by Bonferroni and Bonferroni/Holm. However, ifdecisions on thousands or millions of unknown subsets must be made, then these methods were notsufficient. Later, the works by Westfall and Young (1993), Lauter (1996) and Lauter, Glimm andKropf (1996, 1998) yielded an essential progress.
Goeman and Mansmann (2008) proposed a method to evaluate sets of variables arranged in agiven graph structure by means of logical bottom-up and top-down procedures. Meinshausen andBuhlmann (2006) and Wasserman and Roeder (2007) investigated the selection of variables bymeans of Tibshirani’s lasso method in asymptotical considerations, with the sample size n going toinfinity. The asymptotical proofs are ingenious but rather complicated. The authors need somespecial assumptions about the relation of dimension p to size n, about the number of the ‘‘non-null’’variables and about the covariance structure. The conclusions obtained are an important stepforward in overcoming the uncertainty of selection. However, they are still not generally applicableto problems with a very large dimension p or a small sample size n in which no additional conditionsfor the means and covariances are fulfilled.
236 J. Lauter et al.: High-dimensional data analysis
r 2009 WILEY-VCH Verlag GmbH & Co. KGaA, Weinheim www.biometrical-journal.com

In this paper, we will report non-asymptotical methods that are exact for all dimensions p, allsample sizes n and arbitrary structures of the parameters. We search one or several subsets ofvariables that contain differential variables. Multiple testing based on the criterion of the familywisetype I error rate (FWER) is used.
We believe that inferential investigations in multivariate statistical analysis should be directedtoward methods which can substantially help to overcome the deficiencies of the last decades withrespect to overfitting, multicollinearity and, more general, statistical instability. Our paper is in-tended to contribute to this aim.
2 An algorithm of selection based on the permutation method by Westfall
and Young
In the Interdisciplinary Centre for Bioinformatics of the Leipzig University, we are working onprocedures for the selection of variables which can be applied in gene expression analysis. Thedimension p is usually very large, for example, pE20 000. The sample sizes are allowed to be muchsmaller, for example, nE100. We would like to take into account the correlation structure of thegiven gene data. Generally, we assume that sets of genes with correlated patterns of expression aremore informative for the understanding of the biological gene functions than single genes listedwithout giving their mutual relations. The sets of genes that originate from our data-dependentconstruction reveal possible relationship between the genes within the sets, but also allow to assesssimilarities and differences of all sets. Thus, they also support the biological interpretation, becausethey have a broader characterization.
A basic principle of our selection procedures is that we start by considering each variable i1 ¼1; . . . ; p as the source or the centre of potential subsets of variables. A variable imay be added to thesource variable i1 if the correlation between both variables exceeds a fixed minimum value. As anapplication of our general method, we will treat in this paper the comparison of the mean vectorslð1Þ0 and lð2Þ0 of two p-dimensional samples
xð1ÞðjÞ 0 ¼ ð x
ð1Þj1 x
ð1Þj2 . . . x
ð1Þjp Þ; j ¼ 1; ::: ; nð1Þ;
xð2ÞðjÞ 0 ¼ ð x
ð2Þj1 x
ð2Þj2 . . . x
ð2Þjp Þ; j ¼ 1; ::: ; nð2Þ:
Then, we are interested in finding subsets m of variables, in which some of the mean values aredifferent: mð1Þi 6¼ mð2Þi for at least one index iAm. The corresponding data matrix with n ¼ nð1Þ þ nð2Þ
rows is
Xðnð1Þþnð2ÞÞ�p
¼
Xð1Þ
nð1Þ�p
Xð2Þ
nð2Þ�p
0B@
1CA:
The usual ‘‘total correlation coefficient’’ of the columns xi1 and xi of X
r2i1i ¼ððxi1 � �xi1 Þ
0ðxi � �xiÞÞ
2
ðxi1 � �xi1Þ0ðxi1 � �xi1 Þ � ðxi � �xiÞ
0ðxi � �xiÞ
serves as the measure of similarity of the variables i1 und i. The total mean vectors �xi1 ¼ 1n �xi1 and�xi ¼ 1n �xi, without separating the groups (1) and (2), are applied. Here, 1n denotes the n-dimensionalvector consisting only of ones. The variable i is considered as a potential partner of the sourcevariable i1 if it fulfills the necessary correlation condition r2i1i � c, with c being a fixed positiveconstant.
Of course, there are many different subsets starting all from the same source i1. The smallestsubset is fi1g, consisting only of the source variable, the largest subset is the so-called ‘‘maximum
Biometrical Journal 51 (2009) 2 237
r 2009 WILEY-VCH Verlag GmbH & Co. KGaA, Weinheim www.biometrical-journal.com
set’’ of source i1, Mi1 , that contains all variables i satisfying the above correlation condition. Letbas(i1,X,c) denote the set of all possible subsets generated by variable i1. The concept leads to a‘‘basis totality’’ of all candidate sets of our method, which is the union of the p partitions corre-sponding to the sources i1 ¼ 1; . . . ; p:
BASðX; cÞ ¼[
i1¼1; ::: ;p
basði1;X; cÞ:
This strategy has already been described in Lauter, Glimm and Eszlinger (2005) and Lauter (2007).The idea of forming ‘‘correlation neighbourhoods’’ of the single variables was also applied byTibshirani and Wasserman (2006).
We will assume that the n row vectors (nZ3)
yð1ÞðjÞ 0 ¼ ðx
ð1ÞðjÞ � lð1ÞÞ0; j ¼ 1; ::: ; nð1Þ; yð2Þ
ðjÞ 0 ¼ ðxð2ÞðjÞ � lð2ÞÞ0; j ¼ 1; ::: ; nð2Þ
have a joint np-dimensional distribution which does not change with permuting the vectorsyð1Þð1Þ0; ::: ; y
ð1Þ
ðnð1ÞÞ0; yð2Þð1Þ0; ::: ; y
ð2Þ
ðnð2ÞÞ0. As a special case, the n vectors y
(1)(j) 0 and y
ð2ÞðjÞ 0 can have independent
p-dimensional normal distributions Np(00;�) with the same covariance matrix �. Then, the wide-
spread resampling procedure by Westfall and Young (1993, Section 2.3) can be applied to all subsetsm 2 BAS(X; c). For a set m consisting of the variables i1; i2; . . . ; is, we use the test statisticFm ¼ Fm(xi1 ; xi2 ; . . . ;xis). A necessary condition for our procedure is that Fm must be monotoneincreasing with respect to the sets m, i.e., Fm1
� Fm2for m1 � m2. Mostly, we employ the sum of the
univariate beta statistics belonging to m
Fm ¼X
i¼i1; ::: ;is
Bi ¼X
i¼i1; ::: ;is
nð1Þnð2Þ
nð1Þ þ nð2Þð �xð1Þi � �xð2Þi Þ
2
ðxi � �xiÞ0ðxi � �xiÞ
:
Each value Bi lies between 0 and 1. The Westfall-Young procedure is essentially based on theempirical distribution of the maximal Fm values of all candidate subsets m. In the literature, thedenotation ‘‘maxT procedure’’ is used.
In this strategy, sets with many variables tend to give higher values of Fm than sets with fewvariables. Sets with much information get priority over sets with little information. This corre-sponds to our principle that repeatedly observable biological findings should be emphasized in thestatistical analysis rather than isolated ones. In particular, the maximum set Mi1 produces a highervalue of Fm than any smaller subset m 2 basði1;X; cÞ. The definitions of the subsets m of variablesand of the statistics Fm do not contain any unstable elements. The only metric used substantially inthe procedure is the Euclidean metric of the n-dimensional space formed by the n independentmeasurements. However, the space of the p variables does not need a special structure. Our sets ofvariables are adaptively created at places where many variables are concentrated. Redundance inthe data is consciously utilized for stabilization.
Based on this construction of the subsets m and the statistics Fm, a very effective Westfall-Youngalgorithm can be applied. The maximum set Mi1 ‘‘majorizes’’ all subsets m 2 basði1;X; cÞ withrespect to the statistic Fm. Therefore, only the p maximum sets M1; . . . ;Mp must be taken intoconsideration when determining the empirical maximum distribution according to the Westfall-Young technique:
F� ¼ maxi1¼1; ::: ;p
F�Mi1:
The asterisk in this formula refers to the resampling permutations of the rows of X, correspondingto the two-group comparison. We can take all possible row permutations or, if this number is tolarge, we can resort to a randomly generated choice of them. In the special case of very small samplesizes nð1Þ and nð2Þ, data rotations of the rows can be used instead of permutations (Lauter et al.,2005).
238 J. Lauter et al.: High-dimensional data analysis
r 2009 WILEY-VCH Verlag GmbH & Co. KGaA, Weinheim www.biometrical-journal.com
A set m 2 BASðX; cÞ shows a significant difference between groups (1) and (2) at significance levela if the corresponding beta sum Fm ¼
Pi2m Bi fulfills the condition Fm4F�1�a, where F�1�a is the
(1�a) quantile from the empirical F� distribution. If F ð1Þ;F ð2Þ; . . . ;F ðrÞ are the increasingly orderedresampling values of F�, then F�1�a ¼ F ðkÞ with k arising from r(1�a) by upward rounding to thenext integer number. In practice, the p maximum sets are checked for significance first. Subse-quently, if significance of a maximum set Mi1 has been attained, the smaller subsets of the source i1can also be evaluated. This procedure keeps the familywise type I error rate a in the strong sense: Inthe series of all significant subsets m, some falsely significant subsets–subsets consisting only of non-differential variables–may appear with probability a, at most. Our procedure is suitable for arbi-trary patterns of differential and non-differential variables.
The multiple level a is strictly kept in this Westfall-Young procedure, because the ‘‘total sums ofproducts matrix’’ W ¼ ðX� �XÞ0ðX� �XÞ is used for the construction of the totality BAS(X,c) ofsubsets. Here, �X ¼ 1n �x
0 is the total mean matrix calculated without utilizing the groups (1) and (2).This matrix W, the derived correlations ri1i and the generated subsets do not change with permu-tations of the rows of X. These facts are essential for the non-differential variables but, additionally,they bring about that the unknown differences between the groups (1) and (2) have a promotingeffect on the subset generation and, thus, the power of the selection procedure can be improved.Above all, it is important for the exactness of the selection procedure that the empirical F�
distribution dominates all null distributions, which can arise in BAS(X,c). For the justificationof the procedure in more detail, we refer to Lauter et al. (2005) and Lauter (2007, http://www.izbi.uni-leipzig.de/izbi/Working%20Paper/2007/WP_15_Statistik.pdf).
Furthermore, one should note for reasons of mathematical strictness that different maximumsets can randomly occur in this procedure, even if the means lð1Þ0 and lð2Þ0 are fixed and only n
fixed values ðxð1ÞðjÞ � lð1ÞÞ
0and ðx
ð2ÞðjÞ � lð2ÞÞ
0in different random permutations of ‘‘practice’’ are
considered as a special discrete distribution. In such a case, the distribution symmetry ofpractice does not completely correspond to the suppositions on the null-related symmetry in our
algorithm, if variables with mð1Þi 6¼ mð2Þi are included in the subsets. Obviously, the subsets consisting
only of variables with mð1Þi ¼ mð2Þi remain unchanged in all permutations of ‘‘practice’’. However,in spite of this random variability in the subset generation, our procedure fulfills alwaysthe requirements on the familywise error rate because of the monotonicity property of the teststatistic Fm.
In the literature (see, for example, Dudoit, Shaffer und Boldrick (2002)), the Westfall-Youngprocedure is usually presented in a sequential, stepdown version. After some significances have beenobtained, the corresponding variables are removed from the data matrices. Then, the procedure isstarted anew with a reduced number of variables in order to recognize further significances. Thus,the power of the procedure can be increased. However, this strategy must not be used in ourselection procedure, because two tasks have to be fulfilled correctly in close connection: the gen-eration of the subsets as well as the tests for significance. Careless application of the stepdowntechnique to our random maximum sets could lead to the violation of the multiple level of sig-nificance (Lauter, 2007, Chapter 7).
3 Application to the genomic exploration of B-cell lymphomas
Based on the above considerations, we will analyze gene expression data obtained from tumor tissuein order to retrieve information on the oncogenic pathways involved in their pathogenesis and todistinguish tumor subtypes exhibiting different clinical parameters or therapeutic outcomes. Forthese studies, we utilize previously published gene expression data derived from B-cell lymphomas(Hummel et al., 2006). The cases investigated there comprise patients with Burkitt’s lymphomasand diffuse large B-cell lymphomas (DLBCL) from the Molecular Mechanisms in Malignant
Biometrical Journal 51 (2009) 2 239
r 2009 WILEY-VCH Verlag GmbH & Co. KGaA, Weinheim www.biometrical-journal.com

Lymphomas Network Project. For the analyses considered here, we use 108 lymphoma cases de-fined as training data set in that study. The Affymetrix microarray employed provides 22 277different gene probesets. Based on transcriptional and genomic profiling, Hummel et al. haveproposed a molecular definition of Burkitt’s lymphoma (molecular Burkitt lymphoma, mBL).
Furthermore, to gain insight into the functional implications of different oncogenic pathways ofthese lymphoma entities, we make use of a set of expression data generated by Bild et al. (2006).This group of authors manipulated mammary epithelial cell cultures by overexpressing variousoncogenes and determined the expression patterns by genome-wide expression analysis. For ourconsiderations, we apply the data obtained from mammary cells overexpressing the c-myc oncogenethat is known to be highly expressed in many B-cell lymphomas and other tumors and to be causallyinvolved in their pathogenesis (Boxer and Dang, 2001). The data from 10 biological replicates ofc-myc overexpressing cells and 10 control cultures are compared.
We apply the Westfall-Young selection procedure of Section 2 to these lymphoma data. However,we will use a special ‘‘two-matrices modification’’ in which the generation of subsets of variables andthe tests for significance are performed on two separate data sets. The generation of the subsets isbased on the clinical data matrix X0 with 108 rows corresponding to the lymphoma patients andwith 22 277 columns belonging to the genes. Thus, we obtain subsets of genes with correlatedexpression. Each single gene is taken as a source for potential gene sets. The subsequent tests forsignificance are based on the cell culture expression matrix X of the format 20� 22 277 from cellsoverexpressing oncogenes versus control cells. This way, specific biological pathways are consideredwith respect to their clinical implications.
The selection procedure of Section 2 is correct also in this two-matrices design. The restrictionsfor the application of this procedure are even weakened, because the clinical and the experimentaldata are stochastically independent. In this particular case, the stepdown version of the Westfall-Young selection procedure as mentioned above may be employed as well (but we have not donethis).
In this application, the following parameters are set:
1. Only the genes i whose clinical sums of squares fulfill the condition ðxi � �xiÞ0ðxi � �xiÞ � 15 are
included in the proper algorithm of the procedure. This is the case for 6374 of the original22 277 genes. The expression values of these genes are replaced by the corresponding ranks1; . . . ; 108.
2. The expression values of the cell lines are used without any changes.3. The resampling is carried out with 1000 random permutations of the rows of X.4. The multiple level of significance is a5 0.05.5. The generation of the clinical gene subsets is performed under the condition r2i1i � 0:65.
Additionally, the correlations ri1i are required to be positive.6. The beta-sums statistic Fm of a subset m is calculated only from the 13 highest beta values (if
more than 13 genes are present).
All these modifications do not impair the exact control of the multiple significance level. Furtherdetails of the parameters of the selection procedure are given by Lauter (2007).
The selection algorithm yields 99 significant maximum sets of genes, 68 of which follow thedirection of c-myc expression changes in the cell experiments while 31 respond reciprocally. Forclarity of exposition, we restrict our interpretation to maximum sets that do not overlap with respectto the genes included. Under this additional condition, eight significant maximum sets remain.Fig. 1 displays a corresponding biplot according to Gabriel (1971). It shows both the 240 genescomprised in the eight chosen sets and the 108 patients.
Inspection of the genes included in the obtained sets reveals that they can be allocated ratherclearly to cell biological processes. This is particularly remarkable as the statistical method gen-erating these gene sets does not make use of any biological or clinical information. As an example,
240 J. Lauter et al.: High-dimensional data analysis
r 2009 WILEY-VCH Verlag GmbH & Co. KGaA, Weinheim www.biometrical-journal.com

the maximum set with the source gene for RPL8 (ribosomal protein L8) also contains, amongothers, 11 additional ribosomal protein genes (L3, L4, L10a, L14, L15, L18a, L36, S9, S16, S20,S21), two genes encoding eukaryotic translation initiation factors (EIF3S3, EIF3F6), and theeukaryotic translation elongation factor EEF1B2. Therefore, this gene set clearly represents thecellular protein synthesis machinery. Likewise, the maximum set characterized by the source geneTOP2A (topoisomerase (DNA) II alpha) includes a high number of genes coding for proteinsimplicated in cell cycle regulation, like the cyclins A2 and B2, the cyclin-dependent kinase CDC2,the ki-67 antigen, and the transcription factor E2F, to name only a few. Hence this gene setcorrelates closely with cell proliferation. Other significant gene sets are enriched in genes involved inmitochondrial functions, splicing, or apoptosis regulation.
As evident from Fig. 1, two gene subsets represented by the apoptosis (programmedcell death) inhibitor CFLAR (CASP8 and FADD-like apoptosis regulator/c-FLIP) andthe metallothionein family of metal-binding proteins (MT1L), are clearly separated fromthe other ones. Interestingly, the mBL cases shift towards the six subsets to the right,indicating higher expression of those genes in mBL, whereas the other cases (notmBL) preferentially
Figure 1 Biplot of the clinical gene expression data. Representation of 108 lymphomapatients and 8 disjoint gene sets that correspond to the c-myc overexpression. The circles arecentered at the source genes and include all genes of the respective sets. The gene sets aredenoted by their source genes:200936_at RPL8 ribosomal protein 19 genes201577_at NME1 non-metastatic cells 1, protein (NM23A) expr. 33 genes201947_s_at CCT2 chaperonin containing TCP1, subunit beta 19 genes211375_s_at ILF3 interleukin enhancer binding factor 3 12 genes201292_at TOP2A topoisomerase (DNA) II alpha 63 genes208673_s_at SFRS3 splicing factor, arginine/serine-rich 3 71 genes204326_x_at MT1L metallothionein 1L 11 genes210564_x_at CFLAR CASP8 and FADD-like apoptosis regulator 12 genes.
Biometrical Journal 51 (2009) 2 241
r 2009 WILEY-VCH Verlag GmbH & Co. KGaA, Weinheim www.biometrical-journal.com

cluster close to the CFLAR and MT1L subsets. Hence, the selected gene sets are able toseparate mBL and not-mBL patients on the basis of their expression levels. It is to be emphasizedthat our algorithm did not use the information on mBL diagnosis to produce and select the genesubsets.
4 Data compression and graphical representation
In this section, we will discuss how the relation between the individuals and the identifiedsets of variables can be visualized. For the application from Section 3, the clinical data matrix X0
with n5 108 patients and p5 22 277 genes is used. We define an ‘‘individual coordinate’’
kji ¼
ffiffiffiffiffiffiffiffiffiffiffin
n� 1
rxji � �xiffiffiffiffiffiffiffiffiffiffiffiffiffiffiffiffiffiffiffiffiffiffiffiffiffiffiffiffiffiffiffiffiffiffiffi
ðxi � �xiÞ0ðxi � �xiÞ
pfor a patient j and a gene i. Moreover, we define an ‘‘individual set coordinate’’
kjm ¼
Pi2m kjiffiffiffiffiffiffiffiffiffiffiffiffiffiffiffiffiffiffiffiffiffiffiffiffiffiffiffiffiffiP
h2m
Pi2m rhi
pfor a patient j and a gene set m, where rhi in the denominator are the usual correlations of the genes
rhi ¼ðxh � �xhÞ
0ðxi � �xiÞffiffiffiffiffiffiffiffiffiffiffiffiffiffiffiffiffiffiffiffiffiffiffiffiffiffiffiffiffiffiffiffiffiffiffiffiffiffiffiffiffiffiffiffiffiffiffiffiffiffiffiffiffiffiffiffiffiffiffiffiffiffiffiffiffiffiffiffiffiffiffiffiffiffiffiffi
ðxh � �xhÞ0ðxh � �xhÞ � ðxi � �xiÞ
0ðxi � �xiÞ
p :
This construction is statistically justified because each k2jm is beta distributed, k2jme ~Bð12 ; n�22 Þ, and the
equationPnj¼1
k2jm ¼n
n�1is valid, if the rows of X0 are independently and identically distributed as
Npðl00;�Þ. These facts mean, that the individual coordinates kjm of the sets m have no
differences with respect to the scales and the covariance structures of the variables. The individualset coordinates kjm form a matrix K, so that each patient j receives a unique numericalcharacterization for each gene set m. In our example from Section 3, matrix K has the format108� 8.
To obtain graphical representations of the patients and the gene sets, matrix K is subjected to atwo-dimensional projection with a smoothing effect. The n-dimensional eigenvalue problem
ðKK0ÞV ¼ VK; V ¼ ðv1 v2Þ; K ¼l1 00 l2
� �; V0V ¼ I2
is solved by the first two eigenvectors v1; v2 and the corresponding eigenvalues l1; l2. The projectionis provided by Kð2Þ ¼ VV0K. Thus, a compressed description of the individual gene expression of allsets m is obtained, which roughly shows the behaviour of the observed data. Here, I2 denotes the2� 2 identity matrix.
The two-dimensional biplot with respect to the gene sets is given by the matrix of two columns,
VK0V
� �. The rows of V correspond to the patients, the rows of K0V ¼ K0ð2ÞV to the gene sets. We
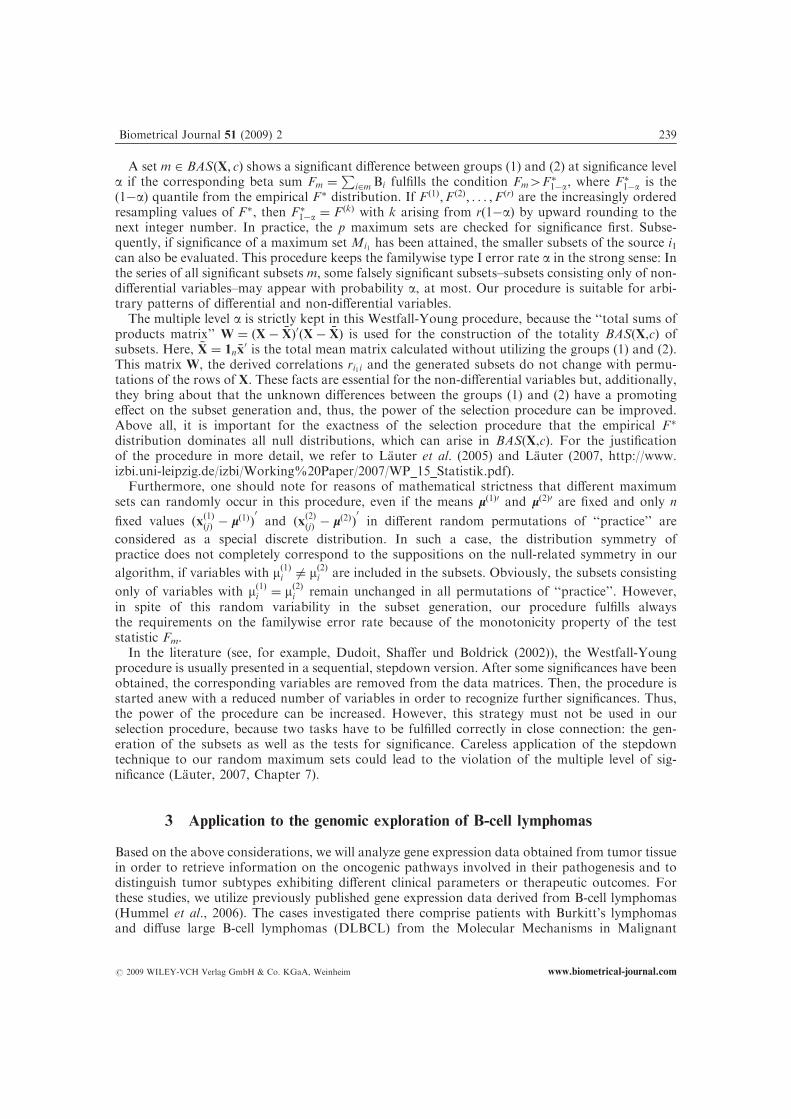
use this information to get an order of the patients and an order of the gene sets which correspondto the main tendencies of the gene expression: Each row of V and K0V is standardized to norm 1,and it is put on the unit circle in the biplot plane. Then, a sorting of the patients and of the gene setsis obtained from the corresponding points on the unit circle, so that neighbouring patients andneighbouring gene sets are correlated as highly as possible. The largest gap on the unit circlebetween the patients and between the gene sets, respectively, marks the beginning and the end of theordered patient or gene-set sequence. Fig. 2 shows the positions of all eight significant gene sets onthe unit circle in our example.
242 J. Lauter et al.: High-dimensional data analysis
r 2009 WILEY-VCH Verlag GmbH & Co. KGaA, Weinheim www.biometrical-journal.com
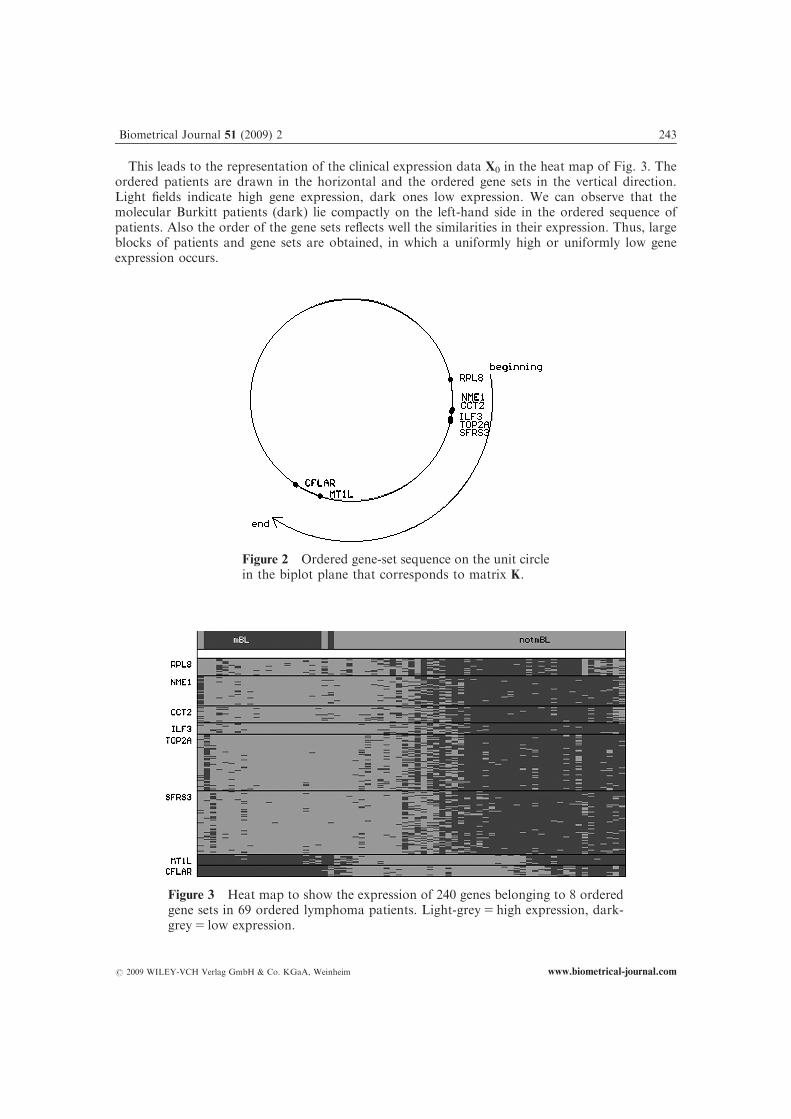
This leads to the representation of the clinical expression data X0 in the heat map of Fig. 3. Theordered patients are drawn in the horizontal and the ordered gene sets in the vertical direction.Light fields indicate high gene expression, dark ones low expression. We can observe that themolecular Burkitt patients (dark) lie compactly on the left-hand side in the ordered sequence ofpatients. Also the order of the gene sets reflects well the similarities in their expression. Thus, largeblocks of patients and gene sets are obtained, in which a uniformly high or uniformly low geneexpression occurs.
Figure 2 Ordered gene-set sequence on the unit circlein the biplot plane that corresponds to matrix K.
Figure 3 Heat map to show the expression of 240 genes belonging to 8 orderedgene sets in 69 ordered lymphoma patients. Light-grey5 high expression, dark-grey5 low expression.
Biometrical Journal 51 (2009) 2 243
r 2009 WILEY-VCH Verlag GmbH & Co. KGaA, Weinheim www.biometrical-journal.com
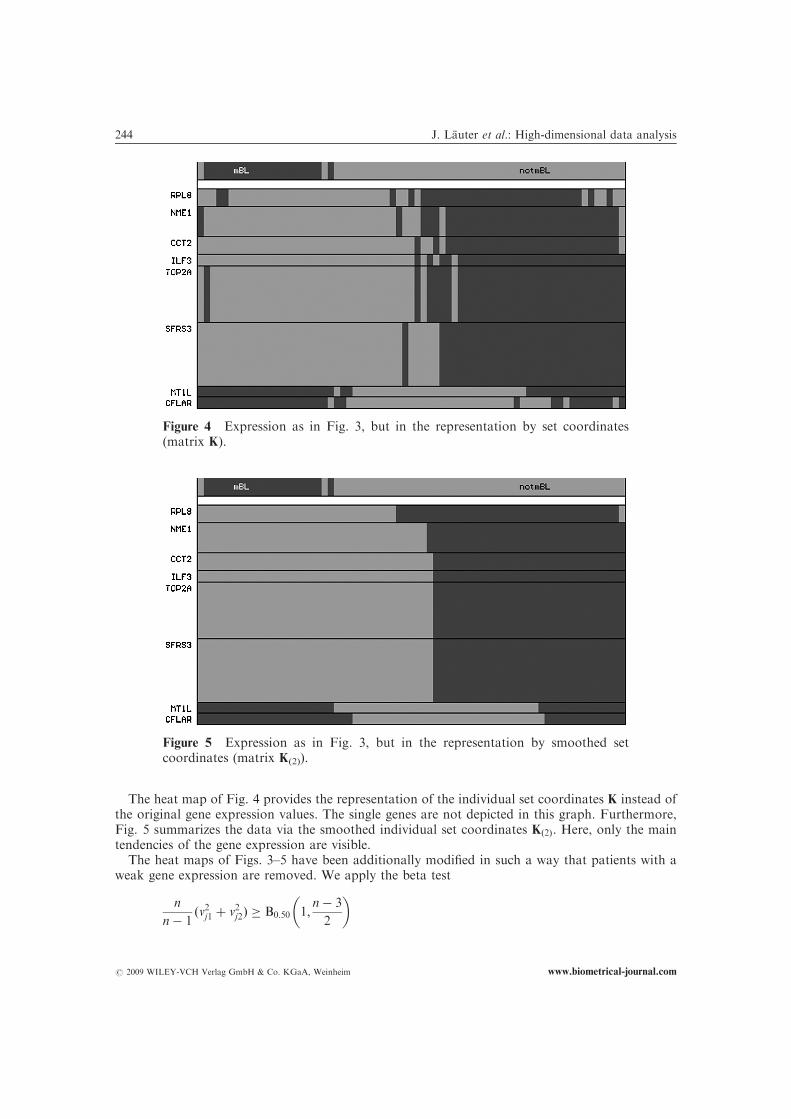
The heat map of Fig. 4 provides the representation of the individual set coordinates K instead ofthe original gene expression values. The single genes are not depicted in this graph. Furthermore,Fig. 5 summarizes the data via the smoothed individual set coordinates Kð2Þ. Here, only the maintendencies of the gene expression are visible.
The heat maps of Figs. 3–5 have been additionally modified in such a way that patients with aweak gene expression are removed. We apply the beta test
n
n� 1ðv2j1 þ v2j2Þ � B0:50 1;
n� 3
2
� �
Figure 4 Expression as in Fig. 3, but in the representation by set coordinates(matrix K).
Figure 5 Expression as in Fig. 3, but in the representation by smoothed setcoordinates (matrix K(2)).
244 J. Lauter et al.: High-dimensional data analysis
r 2009 WILEY-VCH Verlag GmbH & Co. KGaA, Weinheim www.biometrical-journal.com
to each of the patients j ¼ 1; :::; n, where vj1 and vj2 are the elements of the jth row of V. Patients who arenot significant are excluded. Thus, in the given example, the number of patients is reduced from 108 to 69.
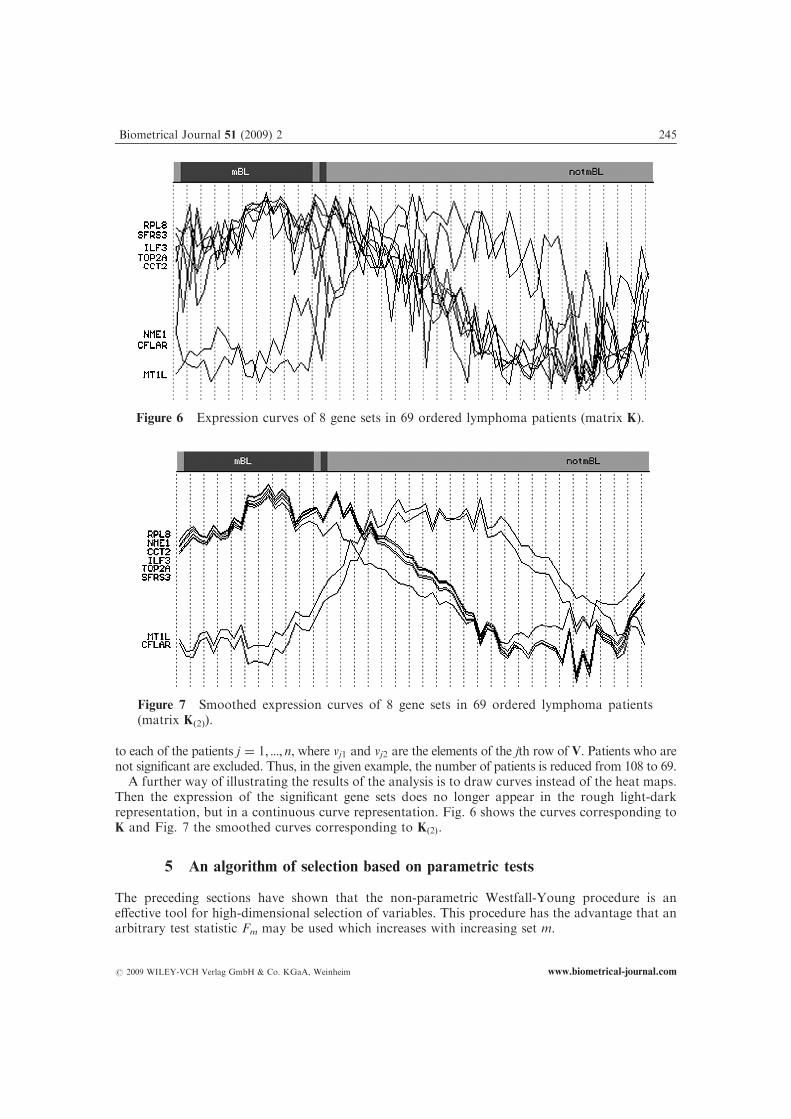
A further way of illustrating the results of the analysis is to draw curves instead of the heat maps.Then the expression of the significant gene sets does no longer appear in the rough light-darkrepresentation, but in a continuous curve representation. Fig. 6 shows the curves corresponding toK and Fig. 7 the smoothed curves corresponding to Kð2Þ.
5 An algorithm of selection based on parametric tests
The preceding sections have shown that the non-parametric Westfall-Young procedure is aneffective tool for high-dimensional selection of variables. This procedure has the advantage that anarbitrary test statistic Fm may be used which increases with increasing set m.
Figure 7 Smoothed expression curves of 8 gene sets in 69 ordered lymphoma patients(matrix K(2)).
Figure 6 Expression curves of 8 gene sets in 69 ordered lymphoma patients (matrix K).
Biometrical Journal 51 (2009) 2 245
r 2009 WILEY-VCH Verlag GmbH & Co. KGaA, Weinheim www.biometrical-journal.com

Since 1996 exact high-dimensional parametric tests are available (Lauter, 1996; Lauter et al., 1996,1998). This raises the question whether corresponding parametric selection procedures with higheffectivity can also be developed from these methods. Sections 5 and 6 are devoted to this problem.
A basic algorithm for searching single significant variables in the comparison of lð1Þ0 and lð2Þ0 has beenintroduced by Kropf (2000). The p variables i are sorted according to decreasing values of the ‘‘totalsums of squares’’ ðxi � �xiÞ
0ðxi � �xiÞ. Then, univariate beta tests (or corresponding F tests) without an a
adjustment are carried out in the obtained order, as long as significances result. This procedure ofstepwise testing keeps the familywise type I error rate a (FWER) in the strong sense. However, thisprocedure is not scale invariant, because large total sums of squares are preferred. Nevertheless, thisapproach is sensible since large total sums of squares reflect large differences between the groups (1), (2)and since variables with very small fluctuations which could be artefacts are suppressed.
Some modifications of this procedure have been proposed: by Westfall, Kropf and Finos (2004),by Hommel and Kropf (2005), and by Lauter (2007). The modification by Hommel and Kropf usestests on the stricter significance level a=k but, correspondingly, the sequence of the tests is stoppedonly when the kth non-significant result is obtained. Here, k is a fixed positive integer.
The application of this stepwise principle to sets of variables would demand that all candidatesubsets are sorted according to an order criterion and are successively tested until non-significancesappear. If the number of variables is very high and the subsets are not uniquely pre-specified, thenthis procedure becomes computationally expensive. In the past, we have tried to construct a suitablealgorithm (Lauter et al., 2005), but we could not yet find an acceptable method for high dimensions.Therefore, a further proposal is now presented.
We start once more from our basis totality of subsets BASðX; cÞ ¼S
i1¼1;:::;pbasði1;X; cÞ, i.e.
from the union over all partitions basði1;X; cÞ defined by the source variables i1 ¼ 1; :::; p. Totest a subset m 2 BASðX; cÞ, the univariate beta statistic of the corresponding source variable i1 isused:
Bi1 ¼nð1Þnð2Þ
nð1Þ þ nð2Þð �xð1Þi1 � �xð2Þi1 Þ
2
ðxi1 � �xi1 Þ0ðxi1 � �xi1Þ
; Bi1 eB 1
2;nð1Þ þ nð2Þ � 2
2
� �for mð1Þi1 ¼ mð2Þi1 :
Thus, all subsets having the same source variable i1 are assessed by the same test statistic. This is thecrucial point in the procedure proposed here. For the exactness of the beta test, we assume that therows of X have independent multivariate normal distributions:
xð1ÞðjÞ0eNpðl
ð1Þ0;RÞ; j ¼ 1; :::; nð1Þ;
xð2ÞðjÞ0eNpðl
ð2Þ0;RÞ; j ¼ 1; :::; nð2Þ:
The order criterion is given by
OðmÞ ¼ ðxi1 � �xi1Þ0ðxi1 � �xi1 Þ
Xi2m
absðri1iÞ:
It depends on the total sum of squares of the source variable i1 analogously to Kropf’s procedure.Additionally, the value of O(m) increases with increasing size of the subset m, namely according tothe total correlations ri1i between the source variable i1 and the partner variables i (see Section 2). Bythis strategy, a source variable i1 and the pertaining univariate beta test get a high weight ifmany highly-correlated partners i exist for i1. This corresponds to our principles of multivariatestabilization. Thus, the seemingly univariate testing method becomes a properly multivariatemethod.
Still, the aim is to identify subsets m containing at least one differential variable. Theapplication of our general searching method (Kropf and Lauter, 2002) requires that all subsets
246 J. Lauter et al.: High-dimensional data analysis
r 2009 WILEY-VCH Verlag GmbH & Co. KGaA, Weinheim www.biometrical-journal.com

m 2 BASðX; cÞ are evaluated in decreasing order of O(m) as long as significancesoccur. An a adjustment is not necessary. All subsets recognized as significant in this stepwiseprocess satisfy the conditions of a multiple testing procedure with the familywise type I error rate a.The testing procedure is based on the general rules of the spherical tests. If m0 is the set of allvariables i with mð1Þi ¼ mð2Þi , then the first subset m with m � m0 in the stepwise process is uniquelydetermined (with probability 1) by the total sums of products matrix belonging to m0,ðXm0� �Xm0
Þ0ðXm0� �Xm0
Þ. Therefore, the decisive Bi1 test is also uniquely determined and, thus, themultiple level a of the procedure is exactly kept, according to the theorems in Lauter et al. (1996,1998).
Under the conditions of the given special selection procedure, where the subsets m are assessedonly by the univariate statistic Bi1 , a shortcut strategy can be applied. In this case, the first non-significant testing result will always appear at a maximum set Mi1 (see Section 2), because OðmÞ �OðMi1 Þ for m 2 basði1;X; cÞ.
Therefore, in practice, the p maximum sets should be tested separately until the first non-sig-nificant maximum set, Minon
1, occurs. Thus, the threshold value for the order criterion, OðMinon
1Þ, is
found. All preceding maximum sets, Mið1Þ1
;Mið2Þ1
;Mið3Þ1
; . . ., prove to be significant. Furthermore, someparticularly interesting subsets m contained in basði1;X; cÞ, i1 ¼ i
ð1Þ1 ; i
ð2Þ1 ; i
ð3Þ1 ; . . ., can be investigated
for significance besides the maximum sets Mið1Þ
1
;Mið2Þ
1
;Mið3Þ
1
; . . .. One has only to apply the conditionOðmÞ4OðMinon
1Þ. Additional requirements, for example, with respect to a small number of variables
belonging to m can then also be fulfilled.It should be noted that the above mentioned modification by Hommel and Kropf is valid in this
procedure. However, the modifications by Westfall et al. (2004) and by Lauter (2007) can no longerbe used.
Figure 8 Biplot of the DLBCL patients. Representation of 68 patients and 2 disjointgene sets with their circles of the included genes. The gene sets are denoted by the sourcegenes:218700_s_at RAB7L1 RAB7, member RAS oncogene family-like 1 33 genes211896_s_at DCN decorin 34 genes.
Biometrical Journal 51 (2009) 2 247
r 2009 WILEY-VCH Verlag GmbH & Co. KGaA, Weinheim www.biometrical-journal.com
6 Application of the parametric selection procedure
Previously, DLBCL patients have been divided into two subgroups based on a molecular signaturedeveloped by Alizadeh et al. (2000) and Rosenwald et al. (2002). These two entities, the activatedB-cell-like lymphomas (ABC) and the germinal center B-cell-like lymphomas (GCB) differsignificantly with respect to prognosis. We will employ our selection procedure to find gene subsetsthat separate the patients of these lymphoma types. Expression data from 28 ABC and 40 GCBcases (Hummel et al., 2006) are applied for this analysis.
The following special values of the parameters are used in the selection procedure:
1. Only the genes i whose sums of squares fulfill the conditions ðxi � �xiÞ0ðxi � �xiÞ � 25 are
included in the proper algorithm of the procedure. Then 1433 genes remain from the given22 283 genes.
2. The multiple level of significance is a5 0.05.3. The generation of the gene subsets is performed under the condition r2i1i � 0:40. Additionally,
the positivity of the correlations ri1i is required.4. A gene i is assigned to the source gene i1 only if gene i has a smaller sum of squares than
gene i1.5. The correlation sum
Pi2m absðri1iÞ of the order criterion OðmÞ is calculated only from the 30
highest correlations (if more than 30 genes are present).
These modifications do not impair the maintenance of the multiple significance level.The parametric selection algorithm yields 13 significant gene maximum sets that are able to
discriminate ABC from GCB cases. One maximum set shows higher expression in ABC than inGCB, 12 maximum sets have a lower expression in ABC than in GCB. The testing modification byHommel and Kropf identifies 15 significant maximum sets if the number k ¼ 2 is used. When theadditional condition of disjointed sets is applied, only two gene maximum sets remain.
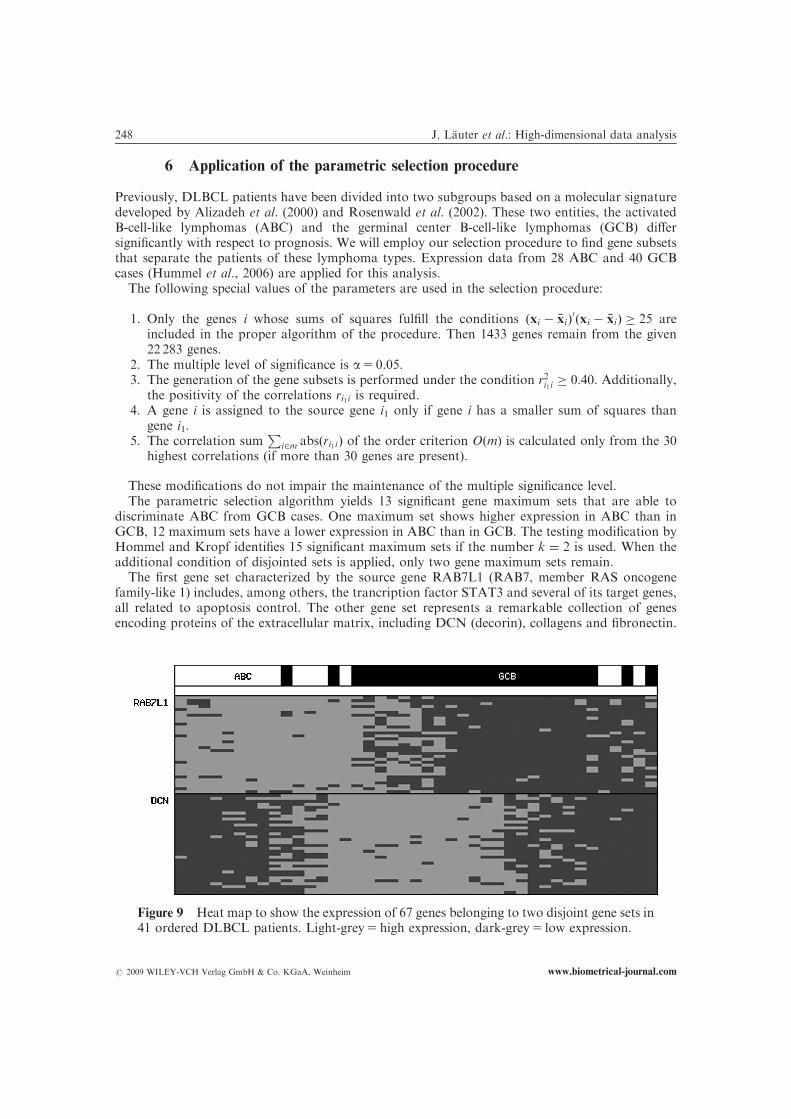
The first gene set characterized by the source gene RAB7L1 (RAB7, member RAS oncogenefamily-like 1) includes, among others, the trancription factor STAT3 and several of its target genes,all related to apoptosis control. The other gene set represents a remarkable collection of genesencoding proteins of the extracellular matrix, including DCN (decorin), collagens and fibronectin.
Figure 9 Heat map to show the expression of 67 genes belonging to two disjoint gene sets in41 ordered DLBCL patients. Light-grey5 high expression, dark-grey5 low expression.
248 J. Lauter et al.: High-dimensional data analysis
r 2009 WILEY-VCH Verlag GmbH & Co. KGaA, Weinheim www.biometrical-journal.com
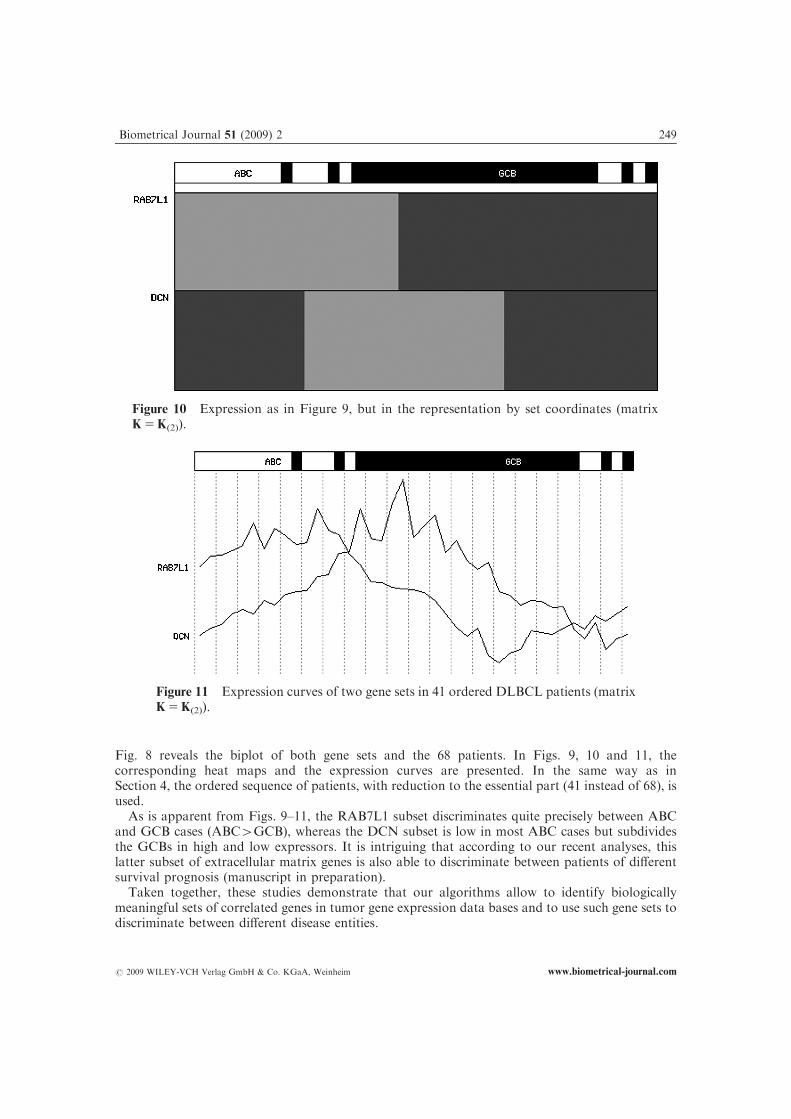
Fig. 8 reveals the biplot of both gene sets and the 68 patients. In Figs. 9, 10 and 11, thecorresponding heat maps and the expression curves are presented. In the same way as inSection 4, the ordered sequence of patients, with reduction to the essential part (41 instead of 68), isused.
As is apparent from Figs. 9–11, the RAB7L1 subset discriminates quite precisely between ABCand GCB cases (ABC4GCB), whereas the DCN subset is low in most ABC cases but subdividesthe GCBs in high and low expressors. It is intriguing that according to our recent analyses, thislatter subset of extracellular matrix genes is also able to discriminate between patients of differentsurvival prognosis (manuscript in preparation).
Taken together, these studies demonstrate that our algorithms allow to identify biologicallymeaningful sets of correlated genes in tumor gene expression data bases and to use such gene sets todiscriminate between different disease entities.
Figure 10 Expression as in Figure 9, but in the representation by set coordinates (matrixK5K(2)).
Figure 11 Expression curves of two gene sets in 41 ordered DLBCL patients (matrixK5K(2)).
Biometrical Journal 51 (2009) 2 249
r 2009 WILEY-VCH Verlag GmbH & Co. KGaA, Weinheim www.biometrical-journal.com

7 Conclusion
This paper presents effective and mathematically exact algorithms of selection of variables which arealso applicable in cases with a very large dimension. Both non-parametric and parametric strategiesare used. The particular requirements of the statistical stability are taken into account, so that highpower is attained and the familywise type I error can be kept in spite of the large dimension. Themethodology associates biological hypothesis generation and biological interpretation with mathe-matical and computational conciseness. The R package SETGEN implementing our Westfall-Youngprocedure is available at http://www.people.imise.uni-leipzig.de/maciej.rosolowski/software.html
Acknowledgements The authors are grateful to the referees for their valuable comments. These have muchhelped to improve and to complete the paper.
Conflict of Interests Statement
The authors have declared no conflict of interest.
References
Alizadeh, A. A., Eisen, M. B., Davis, R. E., Ma, C., Lossos, I.S., Rosenwald, A., Boldrick, J.C., Sabet, H.,Tran, T., Yu, X. et al. (2000). Distinct types of diffuse large B-cell lymphoma identified by gene expressionprofiling. Nature 403, 503–511.
Anderson, J. A. and Blair, V. (1982). Penalized maximum likelihood estimation in logistic regression anddiscrimination. Biometrika 69, 123–136.
Bild, A. H., Yao, G., Chang, J. T., Wang, Q. Potti, A., Chasse, D., et al. (2006). Oncogenic pathway signaturesin human cancers as a guide to targeted therapies. Nature 439, 353–357.
Boxer, L. M. and Dang, C. V. (2001). Translocations involving c-myc and c-myc function. Oncogene 20,5595–5610.
Dudoit, S., Shaffer, J. P. and Boldrick, J. C. (2002). Multiple hypothesis testing in microarray experiments. TheBerkeley Electronic Press, 2002, paper 110.
Efron, B., Hastie, T., Johnstone, I. and Tibshirani, R. (2004). Least angle regression. The Annals of Statistics32, 407–499.
Furnival, G. M. and Wilson, R. W. (1974). Regressions by leaps and bounds. Technometrics 16, 499–511.Gabriel, K. R. (1971). The biplot graphic display of matrices with application to principal component analysis.
Biometrika 58 453–467.Goeman, J. J. and Mansmann, U. (2008). Multiple testing on the directed acyclic graph of gene ontology.
Bioinformatics 24 537–544.Hastie, T., Tibshirani, R. and Friedman, J. (2001). The elements of statistical learning; data mining, inference,
and prediction. Springer, New York.Hoerl, A. E. and Kennard, R. W. (1970). Ridge regression: Biased estimation for nonorthogonal problems.
Technometrics 12, 55–67.Hommel, G. and Kropf, S. (2005). Tests for differentiation in gene expression using a data-driven order of
weights for hypotheses. Biometrical Journal 47, 554–562.Hummel, M., Bentink, S., Berger, H., Klapper, W. Wessendorf, S., Barth, T.F.E.,et al. (2006). A biologic
definition of Burkitt’s lymphoma from transcriptional and genomic profiling. The NEW ENGLANDJOURNAL of MEDICINE 354, 2419–2430.
Kropf, S. (2000). Hochdimensionale multivariate Verfahren in der medizinischen Statistik. Shaker, Aachen.Kropf, S. and Lauter, J. (2002). Multiple tests for different sets of variables using a data-driven ordering of
hypotheses, with an application to gene expression data. Biometrical Journal 44, 789–800.Lauter, J. (1996). Exact t and F tests for analyzing studies with multiple endpoints. Biometrics 52, 964–970.Lauter, J. (2007). Hochdimensionale Statistik, Anwendung in der Genexpressionsanalyse. Leipzig Bioinfor-
matics 15, ISSN 1860–2746.
250 J. Lauter et al.: High-dimensional data analysis
r 2009 WILEY-VCH Verlag GmbH & Co. KGaA, Weinheim www.biometrical-journal.com

Lauter, J., Glimm, E. and Eszlinger, M. (2005). Search for relevant sets of variables in a high-dimensional setupkeeping the familywise error rate. Statistica Neerlandica 59, 298–312.
Lauter, J., Glimm, E. and Kropf, S. (1996). New multivariate tests for data with an inherent structure.Biometrical Journal 38, 5–23, Erratum: Biometrical Journal 40, 1015.
Lauter, J., Glimm, E. and Kropf, S. (1998). Multivariate tests based on left-spherically distributed linear scores.The Annals of Statistics 26, 1972–1988, Correction: The Annals of Statistics 27, 1441.
Meinshausen, N. and Buhlmann, P. (2006). High-dimensional graphs and variable selection with the lasso. TheAnnals of Statistics 34, 1436–1462.
Rosenwald, A., Wright, G., Chan, W. C., Connors J. M. Campo, E., Fisher, R.I., Gascoyne, R.D., ler-Hermelink, H.K., Smeland, E.B., Giltnane, J.M., et al. (2002). The use of molecular profiling to predictsurvival after chemotherapy for diffuse large B-cell lymphoma. The NEW ENGLAND JOURNAL ofMEDICINE 346, 1937–1947.
Tibshirani, R. (1996). Regression shrinkage and selection via the lasso. Journal of Royal Statistical Society B,58, 267–288.
Tibshirani, R. and Wasserman, L. (2006). Correlation-sharing for detection of differential gene expression.arXiv:math/0608061v1 [math.ST] 2 Aug 2006. http://dx.doi.org/10.1002/bimj.200800207.
Wasserman, L. and Roeder, K. (2007). Multi-stage variable selection: Screen and clean. arXiv:0704.1139v1[math.ST]. http://dx.doi.org/10.1002/bimj.200800207.
Westfall, P. H., Kropf, S. and Finos, L. (2004). Weighted FWE-controlling methods in high-dimensionalsituations, in: Benjamini, Y., Bretz, F. and Sarkar, S. K. (eds.), Recent Developments in Multiple Com-parison Procedures, IMS Lecture Notes–Monograph Series 47, 143–154.
Westfall, P. H. and Young, S. S. (1993). Resampling-based Multiple Testing. John Wiley & Sons, New York.
Biometrical Journal 51 (2009) 2 251
r 2009 WILEY-VCH Verlag GmbH & Co. KGaA, Weinheim www.biometrical-journal.com