Helsinki facts and figures 2019 - Helsingin kaupunki · Helsinki Stockholm Oslo Copenhagen Tallinn...
48
Helsinki facts and figures 2019
Transcript of Helsinki facts and figures 2019 - Helsingin kaupunki · Helsinki Stockholm Oslo Copenhagen Tallinn...
Helsinki facts and figures 2019

2 — Helsingin kaupunki
Contents
Geography ............................................. 4Helsinki in Europe ...................................7Population .............................................. 8Housing ................................................. 12Education .............................................. 14Employment .......................................... 17Welfare and health ................................ 18Culture and leisure .............................. 20Construction ........................................ 25Economy .............................................. 26Travel .................................................... 30Transport ............................................. 34Environment ......................................... 36City administration and economy ....... 38History of Helsinki ............................... 44
City of Helsinki — 3
4 — Geography
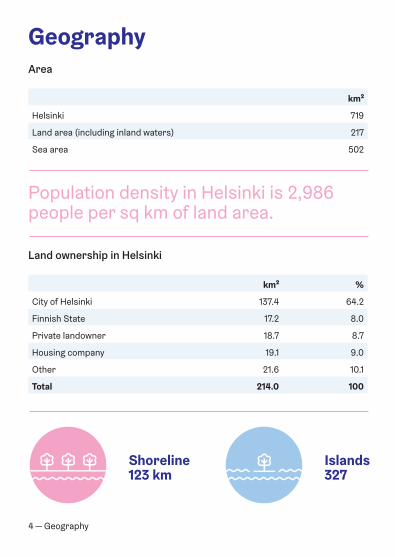
Geography
Population density in Helsinki is 2,986 people per sq km of land area.
km²
Helsinki 719
Land area (including inland waters) 217
Sea area 502
Area
Islands 327
Shoreline123 km
km² %
City of Helsinki 137.4 64.2
Finnish State 17.2 8.0
Private landowner 18.7 8.7
Housing company 19.1 9.0
Other 21.6 10.1
Total 214.0 100
Land ownership in Helsinki
Geography — 54 — Alue
Alue
Helsingin väestöntiheys vuonna 2017 oli 2 934 henkilöä / maa-km².
km²
Koko Helsinki 719
Maa-alue (sis. sisävedet) 217
Merialue 502
Pinta-ala
327 saarta
123 km rantaviivaa
km² %
Helsingin kaupunki 136,7 63,9
Suomen valtio 17,2 8,0
Yksityinen maanomistaja 19,4 9,1
Asunto-osakeyhtiö 19,0 8,9
Muut 21,7 10,2
Yhteensä 214,0 100
Maanomistus Helsingissä
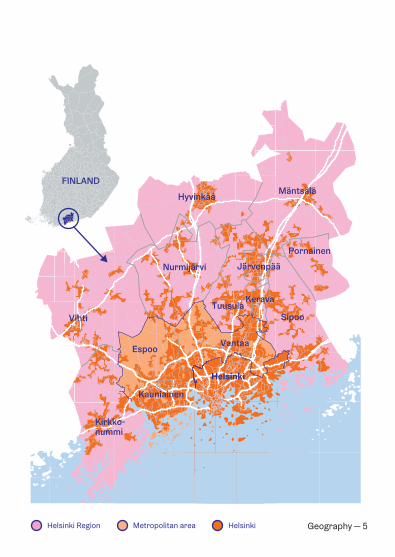
Espoo
FINLAND
Helsinki
Vihti
Kirkko-nummi
Nurmijärvi
Mäntsälä
Pornainen
SipooTuusula
Kerava
Järvenpää
Hyvinkää
Kauniainen
Vantaa
Helsinki Region Metropolitan area Helsinki
HelsinkiStockholm
Oslo
Copenhagen
Tallinn
Riga
Berlin Warsaw
Vilnius
St Petersburg
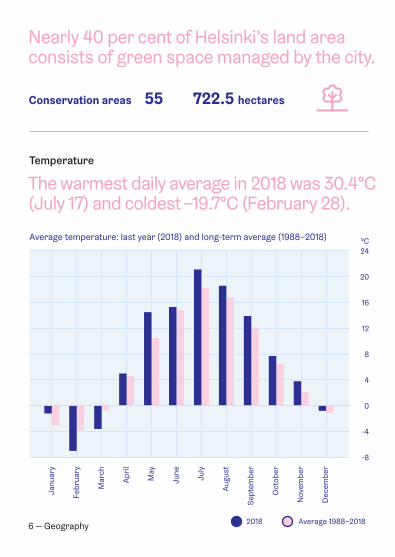
Conservation areas 722.5 hectares55
2018 Average 1988–2018
The warmest daily average in 2018 was 30.4°C (July 17) and coldest –19.7°C (February 28).
Temperature
Nearly 40 per cent of Helsinki’s land area consists of green space managed by the city.
6 — Geography
Janu
ary
Febr
uary
Mar
ch
Apr
il
May
June
July
Aug
ust
Sep
tem
ber
Oct
ober
Nov
embe
r
Dec
embe
r
Average temperature: last year (2018) and long-term average (1988–2018)
-8
ºC
-4
0
4
8
12
16
20
24
tam
mik
uu
maa
lisku
u
touk
okuu
syys
kuu
hein
äkuu
mar
rask
uu
helm
ikuu
huht
ikuu
kesä
kuu
loka
kuu
elok
uu
joul
ukuu
Keskilämpötilat: kuluva vuosi (2018) ja pitkän ajan keskiarvo (1988–2018)
2018 Keskiarvo 1988–2018
HelsinkiStockholm
Oslo
Copenhagen
Tallinn
Riga
Berlin Warsaw
Vilnius
St Petersburg
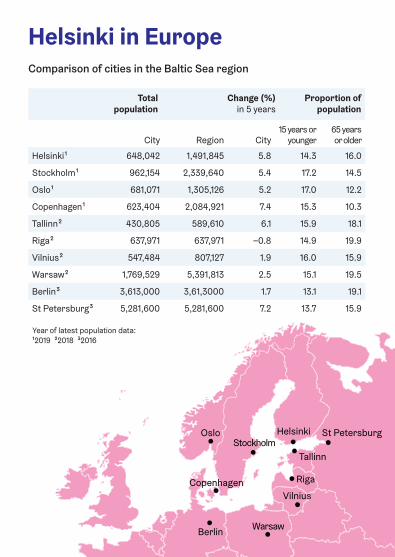
Helsinki in EuropeComparison of cities in the Baltic Sea region
City Region City15 years or
younger65 years or older
Helsinki¹ 648,042 1,491,845 5.8 14.3 16.0
Stockholm¹ 962,154 2,339,640 5.4 17.2 14.5
Oslo¹ 681,071 1,305,126 5.2 17.0 12.2
Copenhagen¹ 623,404 2,084,921 7.4 15.3 10.3
Tallinn² 430,805 589,610 6.1 15.9 18.1
Riga² 637,971 637,971 –0.8 14.9 19.9
Vilnius² 547,484 807,127 1.9 16.0 15.9
Warsaw² 1,769,529 5,391,813 2.5 15.1 19.5
Berlin³ 3,613,000 3,61,3000 1.7 13.1 19.1
St Petersburg³ 5,281,600 5,281,600 7.2 13.7 15.9
Year of latest population data: ¹2019 ²2018 ³2016
Change (%)in 5 years
Proportion of population
Total population
8 — Population
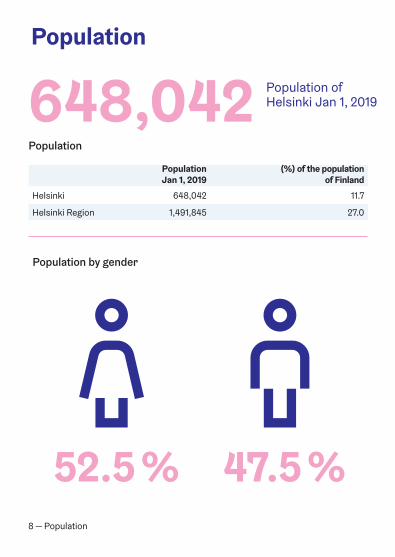
Population
Population
Population Jan 1, 2019
(%) of the population of Finland
Helsinki 648,042 11.7
Helsinki Region 1,491,845 27.0
648,042 Population of Helsinki Jan 1, 2019
47.5 %52.5 %
Population by gender
Population — 9
Population of Helsinki Jan 1, 2019
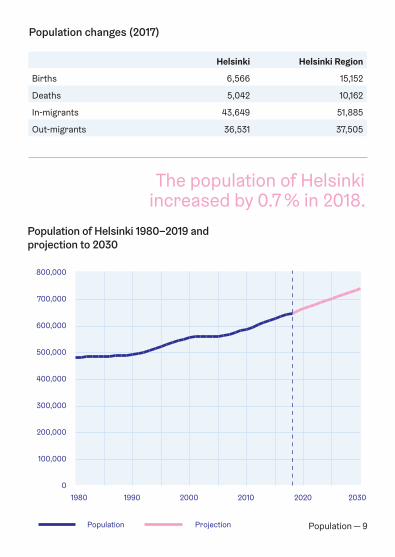
Population changes (2017)
Helsinki Helsinki Region
Births 6,566 15,152
Deaths 5,042 10,162
In-migrants 43,649 51,885
Out-migrants 36,531 37,505
The population of Helsinki increased by 0.7 % in 2018.
Population Projection
Population of Helsinki 1980–2019 and projection to 2030
0
100 000
200 000
300 000
400 000
500 000
600 000
700 000
800 000
1980 20302020201020001990
Väkiluku Ennuste
800,000
0
100,000
200,000
300,000
400,000
500,000
600,000
700,000
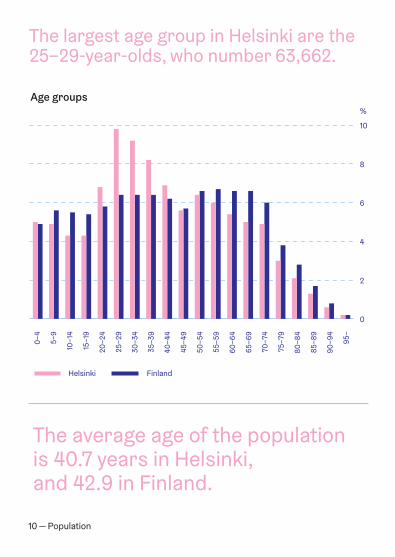
The largest age group in Helsinki are the 25–29-year-olds, who number 63,662.
The average age of the population is 40.7 years in Helsinki, and 42.9 in Finland.
Age groups
Helsinki Finland
10 — Population
0
2
4
6
8
10
%
0–4 5–
9
10–1
4
15–1
9
20–2
4
25–2
9
30–3
4
35–3
9
40–4
4
45–4
9
50–5
4
55–5
9
60–6
4
65–6
9
70–7
4
75–7
9
80–8
4
85–8
9
90–9
4
95–
Helsinki Koko maa
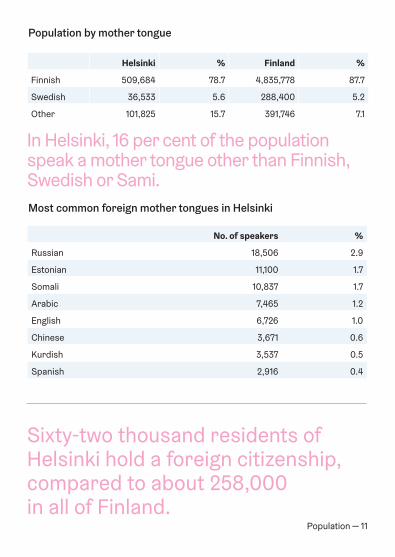
In Helsinki, 16 per cent of the population speak a mother tongue other than Finnish, Swedish or Sami.
Sixty-two thousand residents of Helsinki hold a foreign citizenship, compared to about 258,000 in all of Finland.
Helsinki % Finland %
Finnish 509,684 78.7 4,835,778 87.7
Swedish 36,533 5.6 288,400 5.2
Other 101,825 15.7 391,746 7.1
Population by mother tongue
No. of speakers %
Russian 18,506 2.9
Estonian 11,100 1.7
Somali 10,837 1.7
Arabic 7,465 1.2
English 6,726 1.0
Chinese 3,671 0.6
Kurdish 3,537 0.5
Spanish 2,916 0.4
Population — 11
Most common foreign mother tongues in Helsinki
12 — Housing
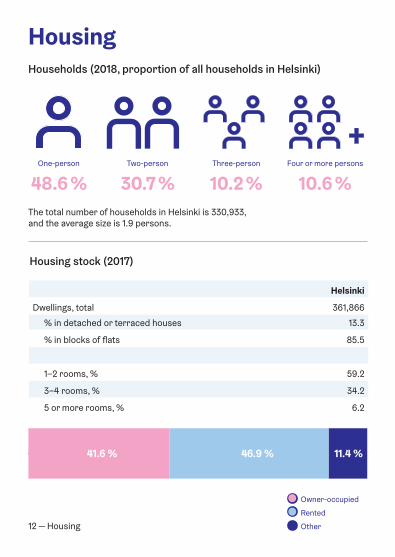
Housing stock (2017)
Helsinki
Dwellings, total 361,866
% in detached or terraced houses 13.3
% in blocks of flats 85.5
1–2 rooms, % 59.2
3–4 rooms, % 34.2
5 or more rooms, % 6.2
HousingHouseholds (2018, proportion of all households in Helsinki)
48.6 % 30.7 % 10.6 %10.2 %Four or more personsThree-personTwo-personOne-person
The total number of households in Helsinki is 330,933, and the average size is 1.9 persons.
● Owner-occupied
● Rented
● Other
● Omistusasunnot
● Vuokra-asunnot
● Muut
41.6 % 46.9 % 11.4 %
Housing — 13
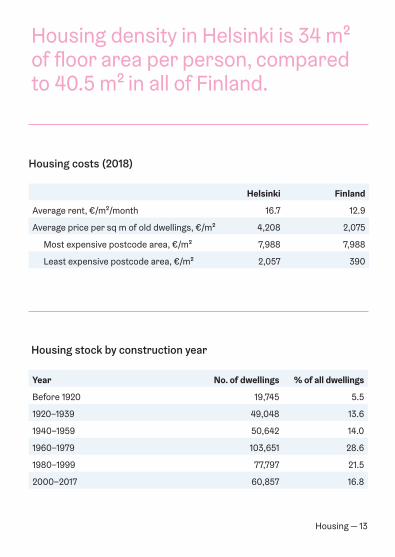
Housing costs (2018)
Helsinki Finland
Average rent, €/m²/month 16.7 12.9
Average price per sq m of old dwellings, €/m² 4,208 2,075
Most expensive postcode area, €/m² 7,988 7,988
Least expensive postcode area, €/m² 2,057 390
Housing density in Helsinki is 34 m² of floor area per person, compared to 40.5 m² in all of Finland.
Year No. of dwellings % of all dwellings
Before 1920 19,745 5.5
1920–1939 49,048 13.6
1940–1959 50,642 14.0
1960–1979 103,651 28.6
1980–1999 77,797 21.5
2000–2017 60,857 16.8
Housing stock by construction year
14 — Education
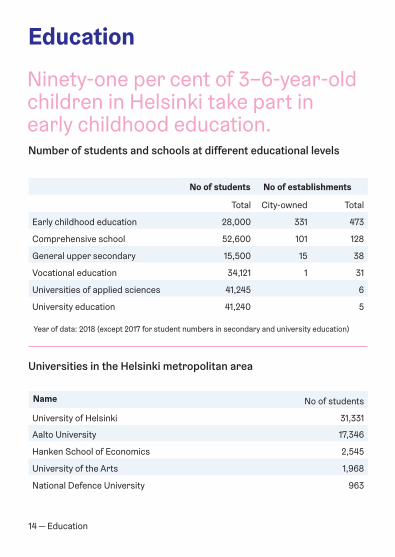
Universities in the Helsinki metropolitan area
No of students
University of Helsinki 31,331
Aalto University 17,346
Hanken School of Economics 2,545
University of the Arts 1,968
National Defence University 963
Name
Education
Ninety-one per cent of 3–6-year-old children in Helsinki take part in early childhood education.Number of students and schools at different educational levels
Total City-owned Total
Early childhood education 28,000 331 473
Comprehensive school 52,600 101 128
General upper secondary 15,500 15 38
Vocational education 34,121 1 31
Universities of applied sciences 41,245 6
University education 41,240 5
No of students No of establishments
Year of data: 2018 (except 2017 for student numbers in secondary and university education)
Helsingin kaupunki — 15
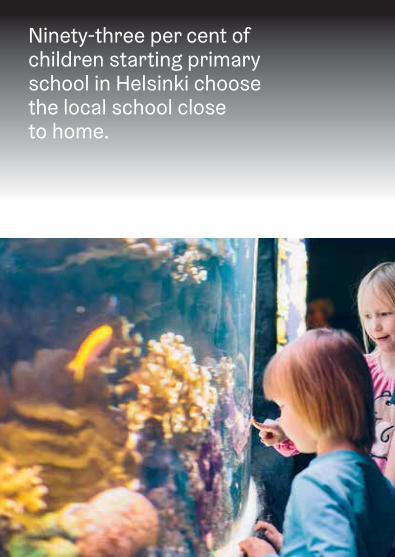
Ninety-three per cent of children starting primary school in Helsinki choose the local school closeto home.
16 — Education
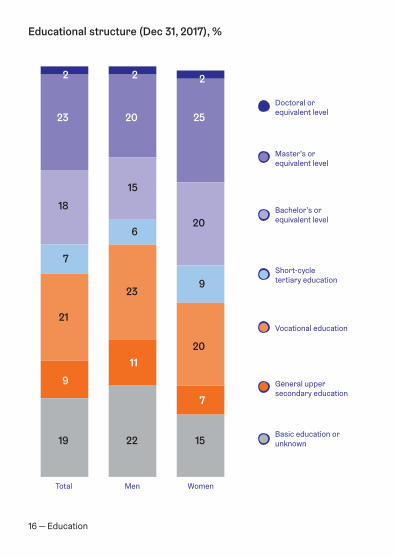
Educational structure (Dec 31, 2017), %
Total Men Women
Basic education or unknown
General upper secondary education
Vocational education
Short-cycle tertiary education
Bachelor’s or equivalent level
Master’s or equivalent level
Doctoral orequivalent level
Yhteensä Miehet Naiset
Tutkija-koulutusaste
Ylempikorkeakouluaste
Alempikorkeakouluaste
Alin korkea-aste
Ammatillinenkoulutus
Lukiokoulutus
Perusastetai tuntematon15
7
20
9
20
25
2
22
11
23
6
15
20
2
19
9
21
7
18
23
2
Employment — 17
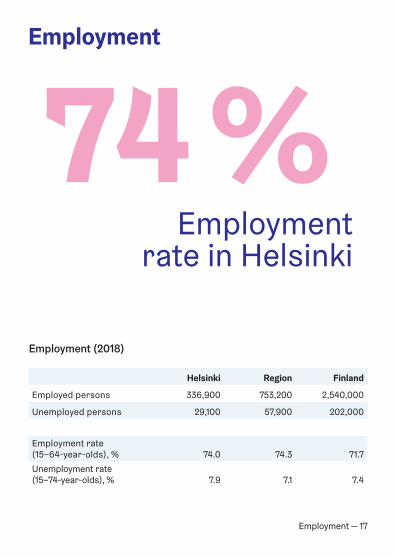
Employment
Employment (2018)
Helsinki Region Finland
Employed persons 336,900 753,200 2,540,000
Unemployed persons 29,100 57,900 202,000
Employment rate (15–64-year-olds), % 74.0 74.3 71.7
Unemployment rate (15–74-year-olds), % 7.9 7.1 7.4
74 %Employment
rate in Helsinki
18 — Welfare and health
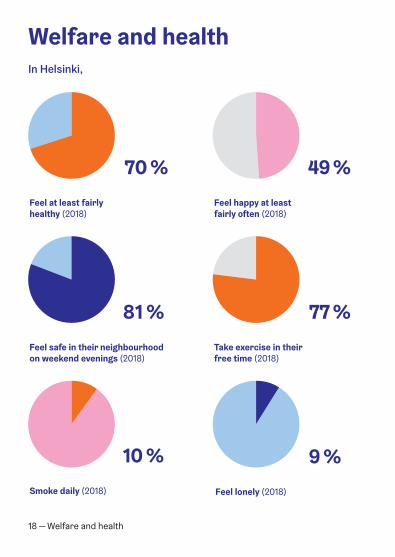
Welfare and health
Smoke daily (2018)
Feel safe in their neighbourhood on weekend evenings (2018)
Feel at least fairly healthy (2018)
Feel lonely (2018)
Feel happy at least fairly often (2018)
Take exercise in their free time (2018)
In Helsinki,
10 %
81 %
70 %
9 %
49 %
77 %
Welfare and health — 19
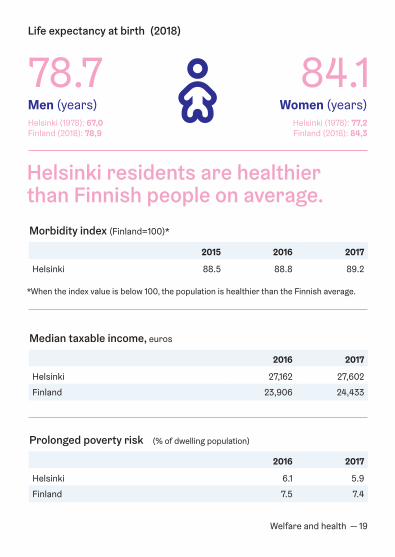
Life expectancy at birth (2018)
84.178.7Men (years)Helsinki (1978): 67,0 Finland (2018): 78,9
Women (years)Helsinki (1978): 77,2Finland (2018): 84,3
Median taxable income, euros
2016 2017
Helsinki 27,162 27,602
Finland 23,906 24,433
Helsinki residents are healthier than Finnish people on average. Morbidity index (Finland=100)*
2015 2016 2017
Helsinki 88.5 88.8 89.2
*When the index value is below 100, the population is healthier than the Finnish average.
Prolonged poverty risk
2016 2017
Helsinki 6.1 5.9
Finland 7.5 7.4
(% of dwelling population)
20 — Culture and leisure
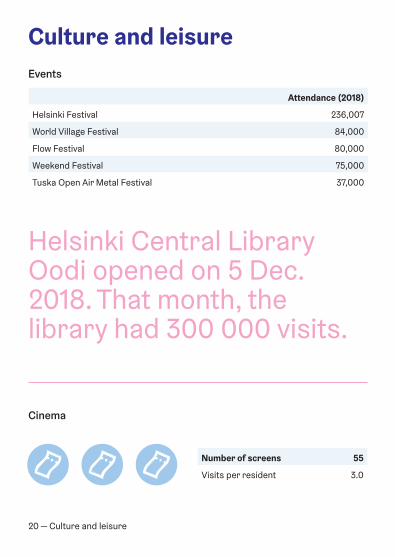
Culture and leisure Events
Attendance (2018)
Helsinki Festival 236,007
World Village Festival 84,000
Flow Festival 80,000
Weekend Festival 75,000
Tuska Open Air Metal Festival 37,000
Cinema
Number of screens 55
Visits per resident 3.0
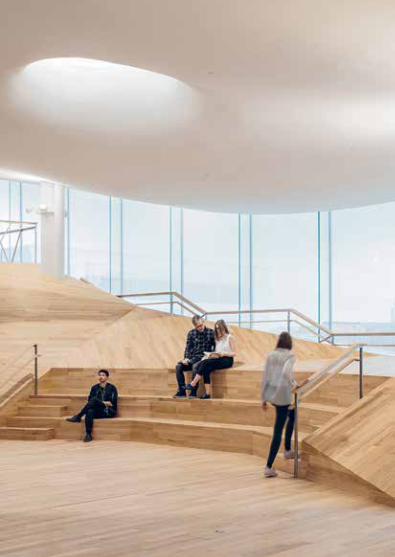
Helsinki Central Library Oodi opened on 5 Dec. 2018. That month, the library had 300 000 visits.
Helsingin kaupunki — 21
22 — Culture and leisure
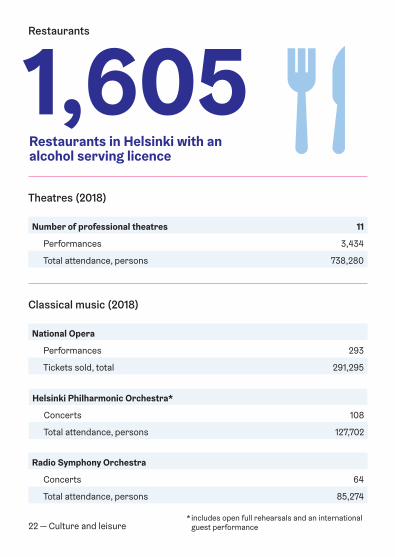
Theatres (2018)
Number of professional theatres 11
Performances 3,434
Total attendance, persons 738,280
Classical music (2018)
National Opera
Performances 293
Tickets sold, total 291,295
Helsinki Philharmonic Orchestra*
Concerts 108
Total attendance, persons 127,702
Radio Symphony Orchestra
Concerts 64
Total attendance, persons 85,274
Restaurants
Restaurants in Helsinki with an alcohol serving licence
1,605
* includes open full rehearsals and an international guest performance
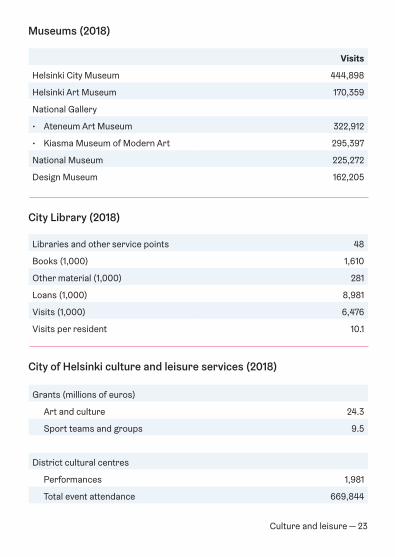
Museums (2018)
Visits
Helsinki City Museum 444,898
Helsinki Art Museum 170,359
National Gallery
• Ateneum Art Museum 322,912
• Kiasma Museum of Modern Art 295,397
National Museum 225,272
Design Museum 162,205
City Library (2018)
Libraries and other service points 48
Books (1,000) 1,610
Other material (1,000) 281
Loans (1,000) 8,981
Visits (1,000) 6,476
Visits per resident 10.1
City of Helsinki culture and leisure services (2018)
Grants (millions of euros)
Art and culture 24.3
Sport teams and groups 9.5
District cultural centres
Performances 1,981
Total event attendance 669,844
Culture and leisure — 23
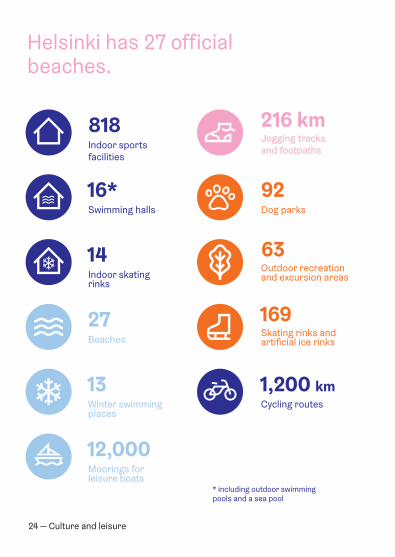
Outdoor recreation and excursion areas
63
Cycling routes
1,200 km
Jogging tracks and footpaths
216 kmIndoor sports facilities
818
Beaches
27
Helsinki has 27 official beaches.
Swimming halls
16*
Skating rinks and artificial ice rinks
169
Dog parks
92
Moorings for leisure boats
12,000
Winter swimming places
13
Indoor skating rinks
14
24 — Culture and leisure
* including outdoor swimming pools and a sea pool
Construction — 25
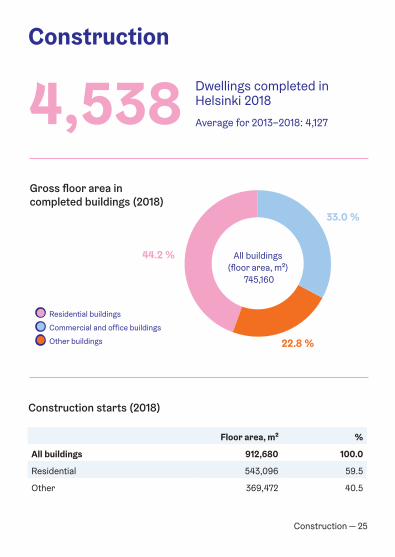
Construction
4,538 Dwellings completed in Helsinki 2018
Average for 2013–2018: 4,127
Construction starts (2018)
Floor area, m² %
All buildings 912,680 100.0
Residential 543,096 59.5
Other 369,472 40.5
Gross floor area in completed buildings (2018)
● Residential buildings
● Commercial and office buildings
● Other buildings
44.2 %
33.0 %
22.8 %
All buildings(floor area, m²)
745,160
26 — Economy
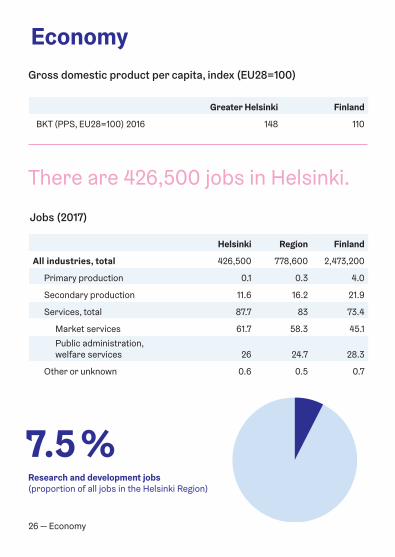
Economy
Jobs (2017)
Helsinki Region Finland
All industries, total 426,500 778,600 2,473,200
Primary production 0.1 0.3 4.0
Secondary production 11.6 16.2 21.9
Services, total 87.7 83 73.4
Market services 61.7 58.3 45.1
Public administration, welfare services 26 24.7 28.3
Other or unknown 0.6 0.5 0.7
Greater Helsinki Finland
BKT (PPS, EU28=100) 2016 148 110
Gross domestic product per capita, index (EU28=100)
There are 426,500 jobs in Helsinki.
Research and development jobs (proportion of all jobs in the Helsinki Region)
7.5 %
Economy — 27
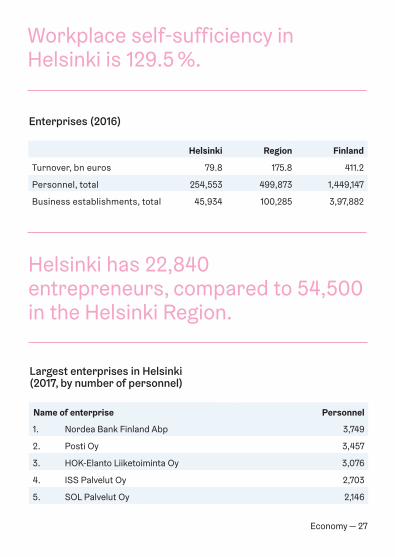
Workplace self-sufficiency in Helsinki is 129.5 %.
Enterprises (2016)
Helsinki Region Finland
Turnover, bn euros 79.8 175.8 411.2
Personnel, total 254,553 499,873 1,449,147
Business establishments, total 45,934 100,285 3,97,882
Largest enterprises in Helsinki (2017, by number of personnel)
Personnel
1. Nordea Bank Finland Abp 3,749
2. Posti Oy 3,457
3. HOK-Elanto Liiketoiminta Oy 3,076
4. ISS Palvelut Oy 2,703
5. SOL Palvelut Oy 2,146
Helsinki has 22,840 entrepreneurs, compared to 54,500 in the Helsinki Region.
Name of enterprise
28 — Economy
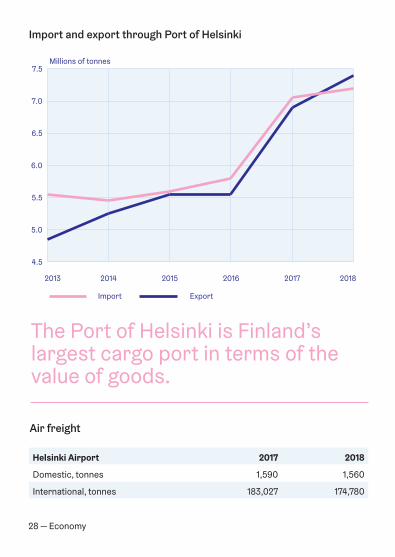
Air freight
Helsinki Airport 2017 2018
Domestic, tonnes 1,590 1,560
International, tonnes 183,027 174,780
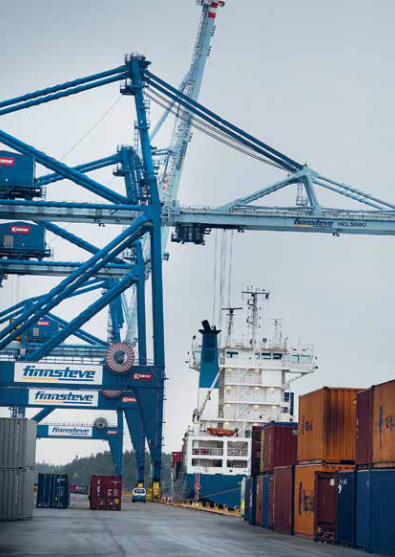
The Port of Helsinki is Finland’s largest cargo port in terms of the value of goods.
Import and export through Port of Helsinki
Import Export
Millions of tonnes
Tuonti Vienti
milj. tonnia
2013 2014 2015 2016 2017 2018
4.5
5.0
5.5
6.0
6.5
7.0
7.5
Helsingin kaupunki — 29
30 — Helsingin kaupunki
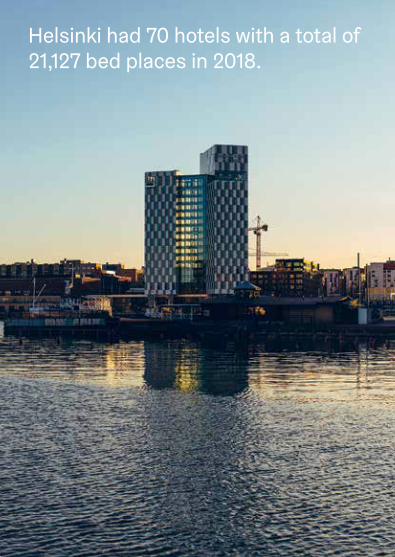
Helsinki had 70 hotels with a total of 21,127 bed places in 2018.
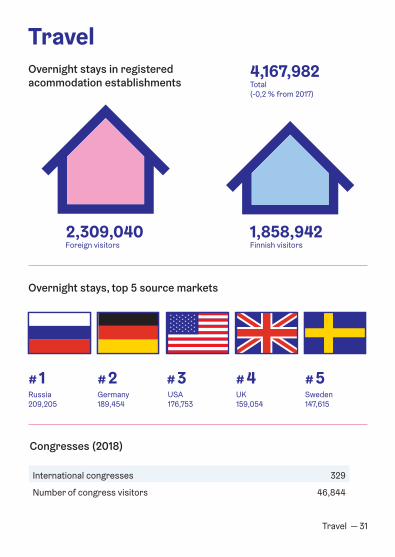
Travel — 31
Congresses (2018)
International congresses 329
Number of congress visitors 46,844
Travel Overnight stays in registered acommodation establishments Total
(-0,2 % from 2017)
4,167,982
Finnish visitors1,858,942
Foreign visitors2,309,040
Overnight stays, top 5 source markets
Russia 209,205
Germany 189,454
Sweden 147,615
# 1 # 2 # 3 # 4 # 5UK159,054
USA176,753
32 — Travel
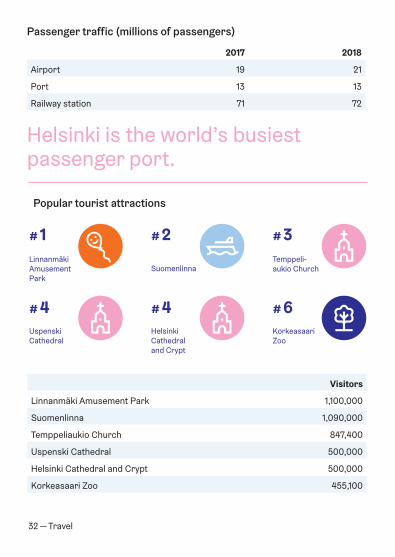
Visitors
Linnanmäki Amusement Park 1,100,000
Suomenlinna 1,090,000
Temppeliaukio Church 847,400
Uspenski Cathedral 500,000
Helsinki Cathedral and Crypt 500,000
Korkeasaari Zoo 455,100
2017 2018
Airport 19 21
Port 13 13
Railway station 71 72
Passenger traffic (millions of passengers)
Popular tourist attractions
Uspenski Cathedral
Helsinki Cathedral and Crypt
Korkeasaari Zoo
# 4 # 4 # 6
Linnanmäki Amusement Park
SuomenlinnaTemppeli-aukio Church
# 1 # 2 # 3
Helsinki is the world’s busiest passenger port.
Helsingin kaupunki — 33
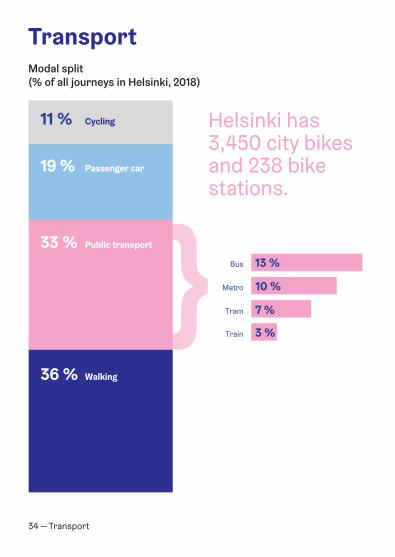
34 — Transport
Transport Modal split (% of all journeys in Helsinki, 2018)
Train
Tram
Metro
Bus
3 %
7 %
10 %
13 %
36 % Walking
33 % Public transport
19 % Passenger car
11 % Cycling Helsinki has 3,450 city bikes and 238 bike stations.
Transport — 35
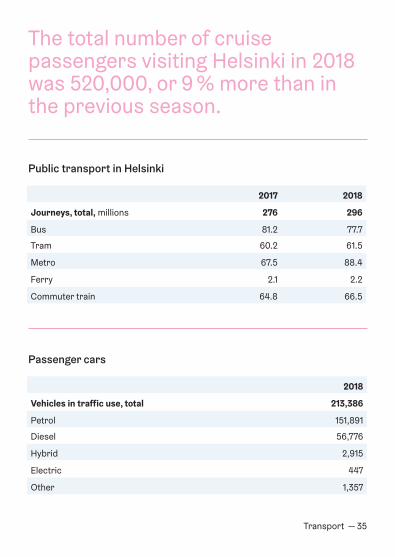
Passenger cars
2018
Vehicles in traffic use, total 213,386
Petrol 151,891
Diesel 56,776
Hybrid 2,915
Electric 447
Other 1,357
Public transport in Helsinki
2017 2018
Journeys, total, millions 276 296
Bus 81.2 77.7
Tram 60.2 61.5
Metro 67.5 88.4
Ferry 2.1 2.2
Commuter train 64.8 66.5
The total number of cruise passengers visiting Helsinki in 2018 was 520,000, or 9 % more than in the previous season.
36 — Environment
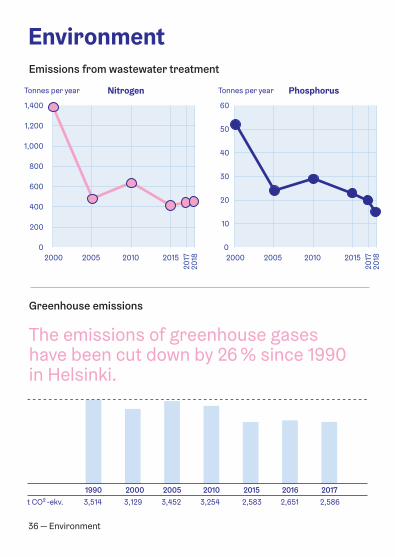
Environment Emissions from wastewater treatment
The emissions of greenhouse gases have been cut down by 26 % since 1990 in Helsinki.
Greenhouse emissions
milj.m3 PhosphorusNitrogenTonnes per year Tonnes per year
3,1293,514 3,452 3,254 2,583 2,651 20001990 2005 2010 2015 2016
2,5862017
t CO² -ekv.
2000 2005 2010 2015
2018
2017
Fosforitonnia/vuosi Typpi
2000 2005 2010 2015
2018
2017
tonnia/vuosi
0
200
400
600
800
1,000
1,200
1,400
0
10
20
30
40
50
60
Good Satisfactory Fair
Poor Very poor
% o
f hou
rs
Environment — 37
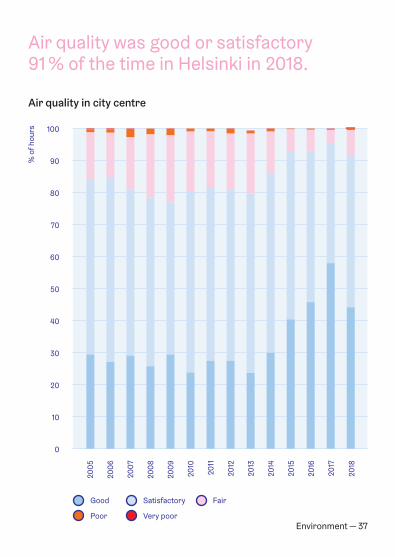
Air quality was good or satisfactory 91 % of the time in Helsinki in 2018.
Air quality in city centre
Hyvä Tyydy�ävä Kohtalainen
Heikko Huono
2006
2017
2018
2016
2015
2014
2013
2012
2011
2010
2009
2008
2007
2005
0
10
20
30
40
50
60
70
80
90
100
38 — City administration and economy
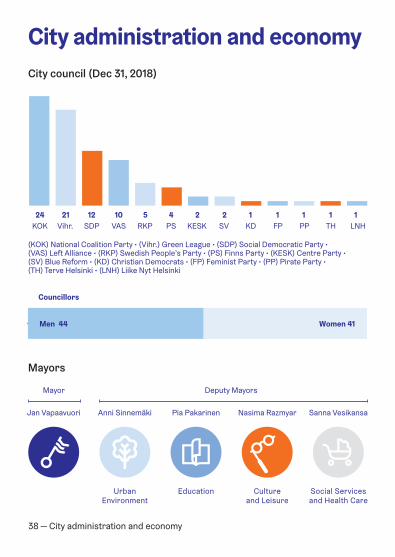
City administration and economy
(KOK) National Coalition Party • (Vihr.) Green League • (SDP) Social Democratic Party • (VAS) Left Alliance • (RKP) Swedish People’s Party • (PS) Finns Party • (KESK) Centre Party • (SV) Blue Reform • (KD) Christian Democrats • (FP) Feminist Party • (PP) Pirate Party • (TH) Terve Helsinki • (LNH) Liike Nyt Helsinki
City council (Dec 31, 2018)
Mayors
Jan Vapaavuori
Mayor Deputy Mayors
Anni Sinnemäki
Education
Pia Pakarinen
Cultureand Leisure
Nasima Razmyar
Urban Environment
Social Services and Health Care
Sanna Vesikansa
KOK Vihr. SDP VAS RKP PS KESK SV FP TH LNH24 12 5 2 1
PP121 10 4 2
KD1 1 1
Women 41 Men 44
Councillors

City administration and economy — 41
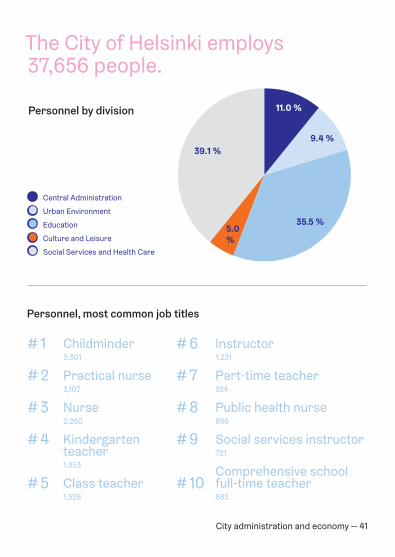
Personnel by division
● Central Administration
● Urban Environment
● Education
● Culture and Leisure
● Social Services and Health Care
Personnel, most common job titles
# 1
# 2
# 3
# 4
# 5
# 6
# 7
# 8
# 9
# 10
Childminder 3,301
Practical nurse3,107
Nurse2,260
Kindergartenteacher1,853
Class teacher1,528
Instructor1,231
Part-time teacher924
Public health nurse896
Social services instructor721
Comprehensive school full-time teacher682
The City of Helsinki employs 37,656 people.
35.5 %
11.0 %
5.0%
9.4 %39.1 %
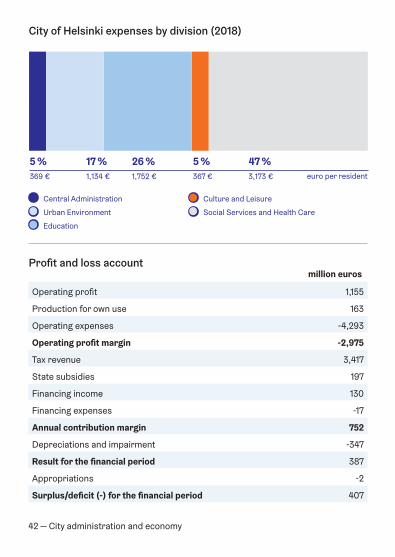
City of Helsinki expenses by division (2018)
Menot toimialoittain (2017)
Profit and loss account
Operating profit 1,155
Production for own use 163
Operating expenses -4,293
Operating profit margin -2,975
Tax revenue 3,417
State subsidies 197
Financing income 130
Financing expenses -17
Annual contribution margin 752
Depreciations and impairment -347
Result for the financial period 387
Appropriations -2
Surplus/deficit (-) for the financial period 407
million euros
● Central Administration
● Urban Environment
● Education
● Culture and Leisure
● Social Services and Health Care
42 — City administration and economy
47 %17 %
5 % 5 %26 % 1,134 €369 € 367 € 3,173 €1,752 € euro per resident
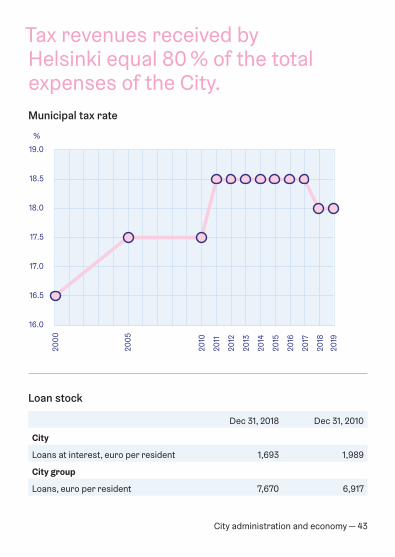
Loan stock
Dec 31, 2018 Dec 31, 2010
City
Loans at interest, euro per resident 1,693 1,989
City group
Loans, euro per resident 7,670 6,917
Municipal tax rate
Tax revenues received by Helsinki equal 80 % of the total expenses of the City.
City administration and economy — 43
2000
2005
2010
2011
2012
2013
2014
2015
2016
2017
2018
2019
%
16.0
16.5
17.0
17.5
18.0
18.5
19.0
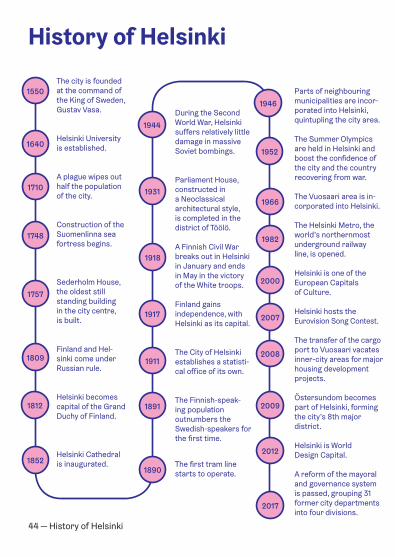
Parts of neighbouring municipalities are incor-porated into Helsinki, quintupling the city area.
The Summer Olympics are held in Helsinki and boost the confidence of the city and the country recovering from war.
The Vuosaari area is in-corporated into Helsinki.
The Helsinki Metro, the world’s northernmost underground railway line, is opened.
Helsinki is one of the European Capitalsof Culture.
Helsinki hosts theEurovision Song Contest.
The transfer of the cargo port to Vuosaari vacates inner-city areas for major housing development projects.
Östersundom becomes part of Helsinki, forming the city’s 8th major district.
Helsinki is World Design Capital.
A reform of the mayoral and governance system is passed, grouping 31 former city departments into four divisions.
During the Second World War, Helsinki suffers relatively little damage in massive Soviet bombings.
Parliament House, constructed in a Neoclassical architectural style, is completed in the district of Töölö.
A Finnish Civil War breaks out in Helsinki in January and ends in May in the victory of the White troops.
Finland gains independence, with Helsinki as its capital.
The City of Helsinki establishes a statisti-cal office of its own.
The Finnish-speak-ing population outnumbers the Swedish-speakers for the first time.
The first tram line starts to operate.
1966
44 — History of Helsinki
History of Helsinki
The city is founded at the command of the King of Sweden, Gustav Vasa.
Helsinki University is established.
A plague wipes out half the population of the city.
Construction of the Suomenlinna sea fortress begins.
Sederholm House, the oldest still standing building in the city centre, is built.
Finland and Hel-sinki come under Russian rule.
Helsinki becomes capital of the Grand Duchy of Finland.
Helsinki Cathedral is inaugurated.
1550
1890
1891
1911
1917
1918
1931
1944
1946
1952
1982
2000
2007
2008
2009
2012
2017
1640
1710
1757
1809
1812
1852
1748
Helsingin kaupunki — 45
Helsinki facts and figures 2019
Publisher:City Executive Office,Urban Research and Statistics
Editorial team:Ari Jaakola, Teemu Vass,Solja Saarto, Lotta Haglund
Contact:Solja Saarto, tel. +358 9 310 36378,e-mail [email protected]
Visual layout design:Werklig
Implementation oflayout and graphics:Nora Kitinmäki
Photo credits:Eetu Ahanen (p. 33),Julius Konttinen (p. 30),Susanna Karhapää (p. 40),Jussi Hellsten (p. 15, 45),Roope Permanto (p. 39),Veikko Somerpuro (p. 29),Tuomas Uusheimo (p. 21)
Print:Next Print Oy
ISBN 978-952-331-594-5 (in print)ISBN 978-952-331-595-2 (online)
www.hel.fi/urbanfacts
Twitter: @kaupunkitietoFacebook: @kaupunkitietohelsinki

Alateksti1234 5678
YM
PÄRISTÖMERKKI
MILJÖMÄRKT
Painotuote4041 0949
Helsinki facts and figures 2019
Helsinki facts and figures is published annually in English. If you want to know more or ask us about statistics and facts related to Helsinki, please visit www.hel.fi/urbanfacts.
www.hel.fi/urbanfacts