![BROADCAST INFORMATION k*™ ™ ^ m m . JPRSFinnish-Soviet Kola Pollution Dialogue Continues [Helsinki HELSINGIN SANOMAT 5 Apr] 4 ... [Bratislava NARODNA OBRODA 2 Jun] 7 Hungary Signs](https://static.fdocuments.us/doc/165x107/5e4fa2230dc92564d9218083/broadcast-information-ka-a-m-m-jprs-finnish-soviet-kola-pollution-dialogue.jpg)
Helsinki facts and figures 2021 - Helsingin kaupunki
48
Helsinki facts and figures 2021
Transcript of Helsinki facts and figures 2021 - Helsingin kaupunki

Helsinki facts and figures 2021

2 — Helsingin kaupunki

Contents
Geography ............................................. 4Helsinki in Europe ...................................7Population .............................................. 8Housing ................................................. 12Education .............................................. 14Employment .......................................... 17Welfare and health ................................ 18Culture and leisure .............................. 20Construction ........................................ 25Economy .............................................. 26Tourism ................................................ 30Transport ............................................. 34Environment ......................................... 36City administration and economy ....... 38History of Helsinki ............................... 44
City of Helsinki — 3
4 — Geography
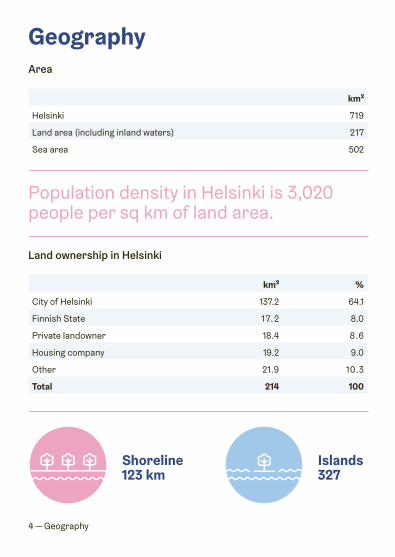
Geography
Population density in Helsinki is 3,020 people per sq km of land area.
Area
Islands 327
Shoreline123 km
Land ownership in Helsinki
km²
Helsinki 719
Land area (including inland waters) 217
Sea area 502
km² %
City of Helsinki 137.2 64.1
Finnish State 17.2 8.0
Private landowner 18.4 8.6
Housing company 19.2 9.0
Other 21.9 10.3
Total 214 100

Geography — 54 — Alue
Alue
327 saarta
123 km rantaviivaa
Helsinki Region Metropolitan area Helsinki

Conservation areas 1,089 hectares61
The warmest daily average in 2020 was 28.0°C (June 27) and coldest –8.2°C (February 29).
Temperature
Nearly 34 per cent of Helsinki’s land area consists of green space managed by the city.
6 — Geography 2020 Average 1990–2020
Janu
ary
Febr
uary
Mar
ch
Apr
il
May
June
July
Aug
ust
Sep
tem
ber
Oct
ober
Nov
embe
r
Dec
embe
r
Average temperature: last year (2020) and long-term average (1990–2020)

Helsinki in Europe
Change (%)in 5 years
Proportion of population
Total population
Comparison of cities in the Baltic Sea region
City Region City15 years or
younger65 years or older
Helsinki¹ 656,920 1,524,489 4.6 14.3 17.4
Stockholm¹ 975,551 2,377,081 6.8 19.0 15.0
Oslo¹ 697,549 1,359,686 7.1 17.3 12.6
Copenhagen¹ 637,895 2,057,142 9.0 15.1 10.4
Tallinn¹ 437,619 605,029 5.8 16.5 20.0
Riga¹ 627,487 627,487 –2.1 15.6 20.7
Vilnius¹ 561,836 816,000 3.5 17.1 16.2
Warsaw² 1,790,700 5,423,168 3.0 15.4 19.4
Berlin² 3,669,500 3,669,500 5.0 13.9 19.2
St Petersburg¹ 5,398,100 5,398,100 4.0 13.7³ 15.9³
Year of latest population data: ¹2020 ²2019 ³2017

8 — Population
Population
656,920
Population by gender
Populationof HelsinkiDec 31, 2020
Population
PopulationDec 31, 2020
(%) of the population of Finland
Helsinki 656,920 11.9
Helsinki Region 1,524,489 27.5
47.5 %52.5 %
Population — 9
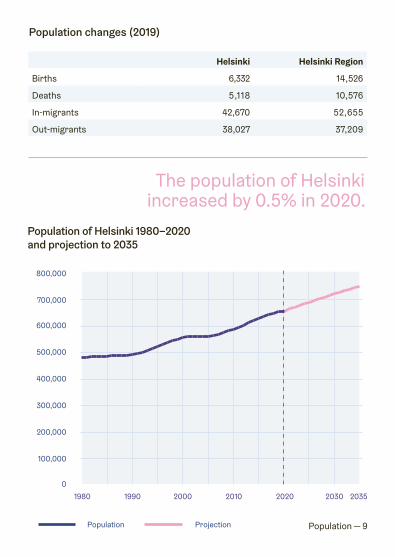
The population of Helsinki increased by 0.5% in 2020.
Population of Helsinki 1980–2020 and projection to 2035
Population changes (2019)
Helsinki Helsinki Region
Births 6,332 14,526
Deaths 5,118 10,576
In-migrants 42,670 52,655
Out-migrants 38,027 37,209
Population Projection
800,000
0
100,000
200,000
300,000
400,000
500,000
600,000
700,000
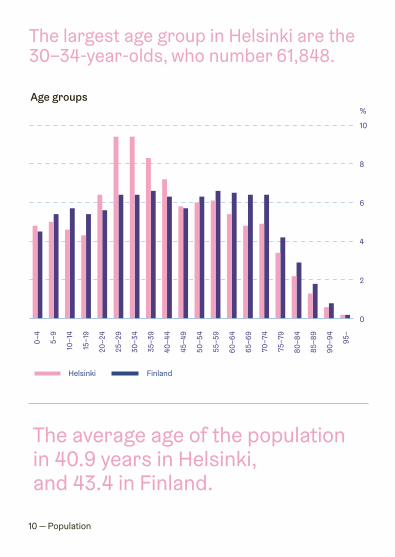
The largest age group in Helsinki are the 30–34-year-olds, who number 61,848.
The average age of the population in 40.9 years in Helsinki,and 43.4 in Finland.
Age groups
10 — Population
Helsinki Finland

In Helsinki, 17 per cent of the population speak a mother tongue other than Finnish, Swedish or Sami.
Sixty-five thousand residents of Helsinki hold a foreign citizenship, compared to about 279,000 in all of Finland.
Population by mother tongue
Population — 11
Helsinki % Finland %
Finnish 510,912 77.8 4,813,075 87.0
Swedish 36,754 5.6 287,871 5.2
Other 109,254 16.6 432,847 7.8
No. of speakers %
Russian 19,032 2.9
Somali 11,982 1.8
Estonian 10,289 1.6
Arabic 8,376 1.3
English 7,424 1.1
Chinese 3,992 0.6
Kurdish 3,670 0.6
Persian 3,287 0.5
Most common foreign mother tongues in Helsinki

12 — Housing
HousingHouseholds (Dec 31, 2019, proportion of all households in Helsinki)
49.3% 30.3% 10.5%10.0%Four or more personsThree-personTwo-personOne-person
The total number of households in Helsinki is 339,786, and the average size is 1.7 persons.
●● Owner-occupied
●● Rented
●● Other
Housing stock (2019)
Helsinki
Dwellings, total 371,295
% in detached or terraced houses 13.2
% in blocks of flats 85.7
1–2 rooms, % 59.0
3–4 rooms, % 34.5
5 or more rooms, % 6.2

Housing — 13
Housing density in Helsinki is 34.2 m² of floor area per person, compared to 41.0 m² in all of Finland.
Housing costs (2020)
Helsinki Finland
Average rent, €/m²/month 18.3 14.0
Average price per sq m of old dwellings, €/m² 4,493 2,104
Most expensive postcode area, €/m² 8,713 8,713
Least expensive postcode area, €/m² 2,321 313
Year No. of dwellings % of all dwellings
Before 1920 19,137 5.2
1920–1939 48,412 13.0
1940–1959 50,561 13.6
1960–1979 103,489 27.9
1980–1999 78,161 21.0
2000–2019 71,483 19.3
Housing stock by construction year

14 — Education
Universities in the Helsinki metropolitan area
Education
Ninety-four per cent of 3–6-year-old children in Helsinki take part in early childhood education.Number of students and schools at different educational levels
Total City-owned Total
Early childhood education 27,000 341 471
Comprehensive school 54,000 104 134
General upper secondary 17,000 16 39
Vocational education 45,000 1 11
Universities of applied sciences 22,000 3
University education 38,000 5
No of students¹ No of establishments²
Year of data: ¹ 2019, ² 2020.
No of students
University of Helsinki 31,620
Aalto University 17,626
Hanken School of Economics 2,505
University of the Arts 1,946
National Defence University 910
Name

Helsingin kaupunki — 15
Ninety per cent of children starting primary schoolin Helsinki choose thelocal school closeto home.

16 — Education
Educational structure (Dec 31, 2018, %)
Total Men Women
Basic education or unknown
General upper secondary education
Vocational education
Short-cycle tertiary education
Bachelor’s or equivalent level
Master’s or equivalent level
Doctoral orequivalent level

Employment — 17
Employment
73.4%Employment
rate in Helsinki
Employment (2020)
Helsinki Region Finland
Employed persons 334,600 767,100 2,528,200
Unemployed persons 29,600 60,000 212,500
Employment rate (15–64-year-olds), % 73.4 74.3 71.6
Unemployment rate (15–74-year-olds), % 8.1 7.3 7.8

18 — Welfare and health
Welfare and health In Helsinki,
Smoke daily (2018)
Feel safe in their neighbourhood on weekend evenings (2018)
Feel at least fairly healthy (2018)
Feel lonely (2018)
Feel happy at least fairly often (2018)
Take exercise in their free time (2018)

Welfare and health — 19
Life expectancy at birth (2020)
Helsinki residents are healthier than Finnish people on average.
(% of dwelling population)
78.4Men (years)Helsinki (1978): 67.0 Finland (2020): 79.0
84.5Women (years)
Helsinki (1978): 77.2Finland (2020): 84.6
Morbidity index (Finland=100)*
2017 2018 2019
Helsinki 89 88 87
*When the index value is below 100, the population is healthier than the Finnish average.
Median taxable income, euros
2018 2019
Helsinki 28,620 29,596
Finland 24,942 25,716
Prolonged poverty risk
2018 2019
Helsinki 5.9 6.1
Finland 7.5 7.7

20 — Culture and leisure
Culture and leisure Events
Cinema
Helsinki Central Library Oodi registered 1,110,533 visits in 2020.
¹ Virtual participants
Attendance (2020)
Vappu at Home 700,000 ¹
Lux Helsinki 600,000
Helsingin juhlaviikot 37,000
Helsinki Cup 16,000
Helsinki City Runing Day 9,300
Number of screens (2019) 59
Visits per resident 3.2

Helsingin kaupunki — 21

22 — Culture and leisure
Theatres (2020)
Classical music (2020)
Restaurants
1,810Restaurants in Helsinki with an alcohol serving licence
Number of professional theatres 11
Performances 1,392
Total attendance, persons 220,157
National Opera
Performances 87
Tickets sold, total 63,308
Helsinki Philharmonic Orchestra*
Concerts 117
Total attendance, persons 31,638
Radio Symphony Orchestra
Concerts 53
Total attendance, persons 30,838
* includes open full rehearsals and international performances

City Library (2020)
City of Helsinki culture and leisure services (2020)
Culture and leisure — 23
Museums (2020)
Grants (millions of euros)
Art and culture 23.0
Sport teams and groups 15.0
District cultural centres
Performances 1,243
Total event attendance 296,000
Libraries and other service points 45
Books (1,000) 1,566
Other material (1,000) 244
Loans (1,000) 7,281
Visits (1,000) 5,197
Visits per resident 8.0
Helsinki City Museum 148,303
Amos Rex 129,924
Helsinki Art Museum 84,041
National Gallery
• Ateneum Art Museum 209,763
• Kiasma Museum of Modern Art 162,501
National Museum 109,809
Design Museum 43,042
Visits

Helsinki has 33 official beaches.
Outdoor recreation and excursion areas
50
Cycling routes
1,200 km
Jogging tracks and footpaths
219
Skating rinks and artificial ice rinks
168
Dog parks
94
Indoor sports facilities
799
Beaches
33
Swimming halls
17*
Moorings for leisure boats
12,000
Winter swimming places
13
Indoor skating rinks
12
24 — Culture and leisure
* including outdoor swimming pools and a sea pool

Construction — 25
Construction
6,899Gross floor area in completed buildings (2020)
●● Residential buildings
●● Commercial and office buildings
●● Other buildings
Dwellings completed in Helsinki 2020
Average for 2013–2020: 4,727
Construction starts (2020)
Floor area, m²
All buildings 785,455
Residential 529,980
Other 245,772
All buildings(floor area, m²)
886,588
26 — Economy
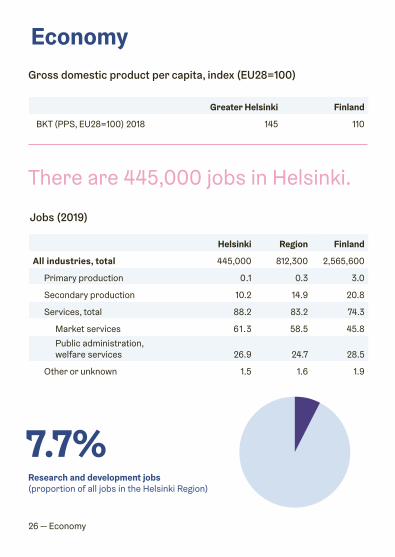
Economy
There are 445,000 jobs in Helsinki.
7.7%
Greater Helsinki Finland
BKT (PPS, EU28=100) 2018 145 110
Gross domestic product per capita, index (EU28=100)
Jobs (2019)
Helsinki Region Finland
All industries, total 445,000 812,300 2,565,600
Primary production 0.1 0.3 3.0
Secondary production 10.2 14.9 20.8
Services, total 88.2 83.2 74.3
Market services 61.3 58.5 45.8
Public administration, welfare services 26.9 24.7 28.5
Other or unknown 1.5 1.6 1.9
Research and development jobs (proportion of all jobs in the Helsinki Region)
Economy — 27
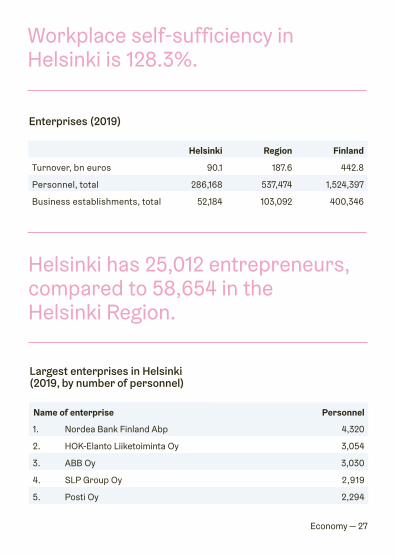
Workplace self-sufficiency in Helsinki is 128.3%.
Helsinki has 25,012 entrepreneurs, compared to 58,654 in the Helsinki Region.
Enterprises (2019)
Helsinki Region Finland
Turnover, bn euros 90.1 187.6 442.8
Personnel, total 286,168 537,474 1,524,397
Business establishments, total 52,184 103,092 400,346
Largest enterprises in Helsinki (2019, by number of personnel)
Personnel
1. Nordea Bank Finland Abp 4,320
2. HOK-Elanto Liiketoiminta Oy 3,054
3. ABB Oy 3,030
4. SLP Group Oy 2,919
5. Posti Oy 2,294
Name of enterprise
28 — Economy
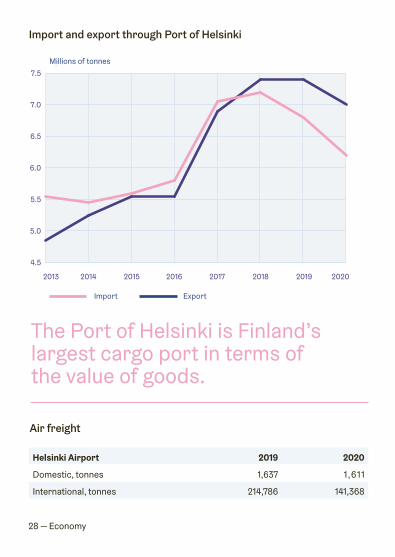
The Port of Helsinki is Finland’s largest cargo port in terms of the value of goods.
Import and export through Port of Helsinki
Import Export
Millions of tonnes
Air freight
Helsinki Airport 2019 2020
Domestic, tonnes 1,637 1,611
International, tonnes 214,786 141,368

Helsingin kaupunki — 29

30 — Helsingin kaupunki
Helsinki had 56 hotels with a total of 16,623 bed places in 2020.

Travel — 31
Travel Overnight stays in registered acommodation establishments
Overnight stays, top 5 source markets
Total (-64% from 2019)
1,616,635
Russia 58,993
# 1Germany 48,729
# 2Sweden 30,428
# 5# 4USA30,986
# 3UK31,453
Finnish visitors495,401
Foreign visitors1,121,234
Congresses (2020)
International congresses 90
Number of congress visitors 18,837

32 — Travel
Passenger traffic (millions of passengers)
Popular tourist attractions
Passenger traffic to Helsinki was ground to a halt by the global COVID-19 pandemic.
2019 2020
Airport 22 5
Port 12 5
Railway station 70 40
Temppeli-aukio Church
# 4Uspenski Cathedral
# 5Helsinki Cathedral and Crypt
# 5
Linnanmäki Amusement Park
# 1
Suomenlinna
# 2Korkeasaari Zoo
# 3
Visitors
Linnanmäki Amusement Park 700,000
Suomenlinna 450,000
Korkeasaari Zoo 353,194
Temppeliaukio Church 92,145
Uspenski Cathedral 50,000
Helsinki Cathedral and Crypt 50,000

Helsingin kaupunki — 33

34 — Transport
Transport Modal split (% of all journeys in Helsinki, 2020)
Helsinki has 3,520 city bikes and 242 bikestations.

Transport — 35
Passenger cars
Public transport in Helsinki
Due to the travel restrictions imposed during the COVID-19 pandemic, Helsinki had no visits by cruise liner passengers in 2020.
2019 2020
Journeys, total, millions 299 188
Bus 78 45
Tram 57 35
Metro 93 60
Ferry 2 1
Commuter train 70 47
2020
Vehicles in traffic use, total 219,185
Petrol 152,525
Diesel 51,879
Hybrid 10,284
Electric 2,031
Other 2,466

36 — Environment
Environment Emissions from wastewater treatment
The emissions of greenhouse gases have been cut down by 26% since 1990 in Helsinki.
Greenhouse emissions
milj.m3 PhosphorusNitrogenTonnes per year Tonnes per year

Environment — 37
Air quality was good or satisfactory 97% of the time in Helsinki in 2019.
Air quality in city centre
Good Satisfactory Fair
Poor Very poor
% o
f hou
rs

38 — City administration and economy
City administration and economy City council (Dec 31, 2020)
Mayors
(KOK) National Coalition Party • (Vihr.) Green League • (SDP) Social Democratic Party • (VAS) Left Alliance • (PS) Finns Party • (RKP) Swedish People’s Party • (KESK) Centre Party • (KD) Christian Democrats • (FP) Feminist Party • (AP) Open Party • (TH) Terve Helsinki • (LNH) Liike Nyt Helsinki
Jan Vapaavuori
Mayor Deputy Mayors
Education
Pia Pakarinen
Cultureand Leisure
Nasima RazmyarAnni Sinnemäki
Urban Environment
Social Services and Health Care
Sanna Vesikansa


City administration and economy — 41
Personnel by division
The City of Helsinki employs 38,702 people.
Personnel, most common job titles
●● Central Administration
●● Urban Environment
●● Education
●● Culture and Leisure
●● Social Services and Health Care
# 1
# 2
# 3
# 4
# 5
# 6
# 7
# 8
# 9
# 10
Practical nurse3,329
Childcarer in earlychildhood educationand care3,098
Teacher in earlychildhood educationand care2,446
Nurse 1,970
Class teacher1,678
Part-time teacher1,223
Instructor1,135
Public health nurse948
Social servicesinstructor730
Comprehensive school full-time teacher714

City of Helsinki expenses by division (2020)
Profit and loss account
42 — City administration and economy
●● Central Administration
●● Urban Environment
●● Education
●● Culture and Leisure
●● Social Services and Health Care
Menot toimialoittain (2017)
Operating profit 1,145
Production for own use 193
Operating expenses –4,662
Operating profit margin –3,325
Tax revenue 3,566
State subsidies 480
Financing income 159
Financing expenses –17
Annual contribution margin 863
Depreciations and impairment –366
Result for the financial period 497
Appropriations 2
Surplus/deficit (-) for the financial period 499
million euros
euro per resident

Municipal tax rate
Tax revenues received by Helsinki equal 80% of the total expenses of the City.
City administration and economy — 43
Loan stock
Dec 31, 2020 Dec 31, 2010
City
Loans at interest, euro per resident 1,508 1,989
City group
Loans, euro per resident 8,442 6,917
44 — History of Helsinki
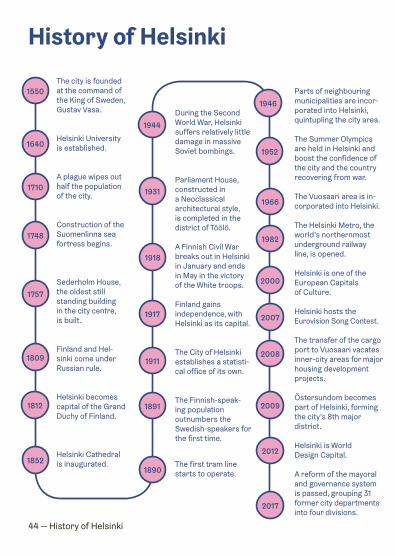
History of Helsinki
During the Second World War, Helsinki suffers relatively little damage in massive Soviet bombings.
Parliament House, constructed in a Neoclassical architectural style, is completed in the district of Töölö.
A Finnish Civil War breaks out in Helsinki in January and ends in May in the victory of the White troops.
Finland gains independence, with Helsinki as its capital.
The City of Helsinki establishes a statisti-cal office of its own.
The Finnish-speak-ing population outnumbers the Swedish-speakers for the first time.
The first tram line starts to operate.1890
1891
1911
1917
1918
1931
1944
The city is founded at the command of the King of Sweden, Gustav Vasa.
Helsinki University is established.
A plague wipes out half the population of the city.
Construction of the Suomenlinna sea fortress begins.
Sederholm House, the oldest still standing building in the city centre, is built.
Finland and Hel-sinki come under Russian rule.
Helsinki becomes capital of the Grand Duchy of Finland.
Helsinki Cathedral is inaugurated.
1550
1640
1710
1852
1757
1809
1812
1748
Parts of neighbouring municipalities are incor-porated into Helsinki, quintupling the city area.
The Summer Olympics are held in Helsinki and boost the confidence of the city and the country recovering from war.
The Vuosaari area is in-corporated into Helsinki.
The Helsinki Metro, the world’s northernmost underground railway line, is opened.
Helsinki is one of the European Capitalsof Culture.
Helsinki hosts theEurovision Song Contest.
The transfer of the cargo port to Vuosaari vacates inner-city areas for major housing development projects.
Östersundom becomes part of Helsinki, forming the city’s 8th major district.
Helsinki is World Design Capital.
A reform of the mayoral and governance system is passed, grouping 31 former city departments into four divisions.
1966
1946
1952
2000
2007
2008
2009
2012
2017
1982

Helsingin kaupunki — 45
Helsinki facts and figures 2021
Publisher:City Executive Office,Urban Research and Statistics
Editorial team:Ari Jaakola, Teemu Vass,Solja Saarto, Lotta Haglund
Contact:Solja Saarto, tel. +358 9 310 36378,e-mail [email protected]
Visual layout design:Werklig
Implementation oflayout and graphics:Nora Kitinmäki
Photo credits:Eetu Ahanen (p. 33),Julius Konttinen (p. 30),Susanna Karhapää (p. 40),Jussi Hellsten (p. 15, 45),Roope Permanto (p. 39),Veikko Somerpuro (p. 29),Tuomas Uusheimo (p. 21)
The data for the charts and tables in this publication is available in an accessible format upon request by email: [email protected].
Print:Next Print Oy
ISBN 978-952-331-951-6 (in print)ISBN 978-952-331-952-3 (online)
www.hel.fi/urbanfacts
Twitter: @kaupunkitietoFacebook: @kaupunkitietohelsinki

Alateksti1234 5678
YM
PÄRISTÖMERKKI
MILJÖMÄRKT
Painotuote4041 0949

Helsinki facts and figures 2021
Helsinki facts and figures is published annually in English. If you want to know more or ask us about statistics and facts related to Helsinki, please visit www.hel.fi/urbanfacts.
www.hel.fi/urbanfacts