Does Your Truth Match Reality? Dr. Heinz Lycklama [email protected] .
Page 0
March 2006
Heinz-Joachim Neubürger, CFO
Page 1
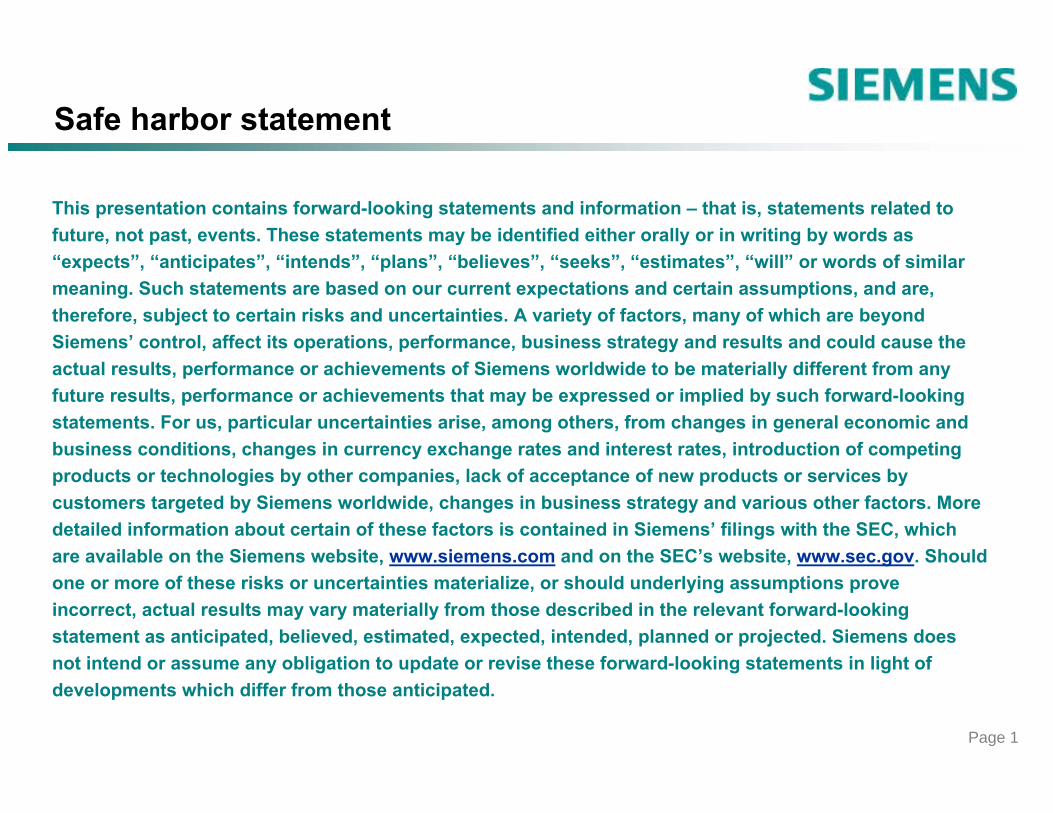
Safe harbor statement
This presentation contains forward-looking statements and information – that is, statements related to future, not past, events. These statements may be identified either orally or in writing by words as “expects”, “anticipates”, “intends”, “plans”, “believes”, “seeks”, “estimates”, “will” or words of similar meaning. Such statements are based on our current expectations and certain assumptions, and are, therefore, subject to certain risks and uncertainties. A variety of factors, many of which are beyond Siemens’ control, affect its operations, performance, business strategy and results and could cause the actual results, performance or achievements of Siemens worldwide to be materially different from any future results, performance or achievements that may be expressed or implied by such forward-looking statements. For us, particular uncertainties arise, among others, from changes in general economic and business conditions, changes in currency exchange rates and interest rates, introduction of competing products or technologies by other companies, lack of acceptance of new products or services by customers targeted by Siemens worldwide, changes in business strategy and various other factors. More detailed information about certain of these factors is contained in Siemens’ filings with the SEC, which are available on the Siemens website, www.siemens.com and on the SEC’s website, www.sec.gov. Should one or more of these risks or uncertainties materialize, or should underlying assumptions prove incorrect, actual results may vary materially from those described in the relevant forward-looking statement as anticipated, believed, estimated, expected, intended, planned or projected. Siemens does not intend or assume any obligation to update or revise these forward-looking statements in light of developments which differ from those anticipated.
Page 2
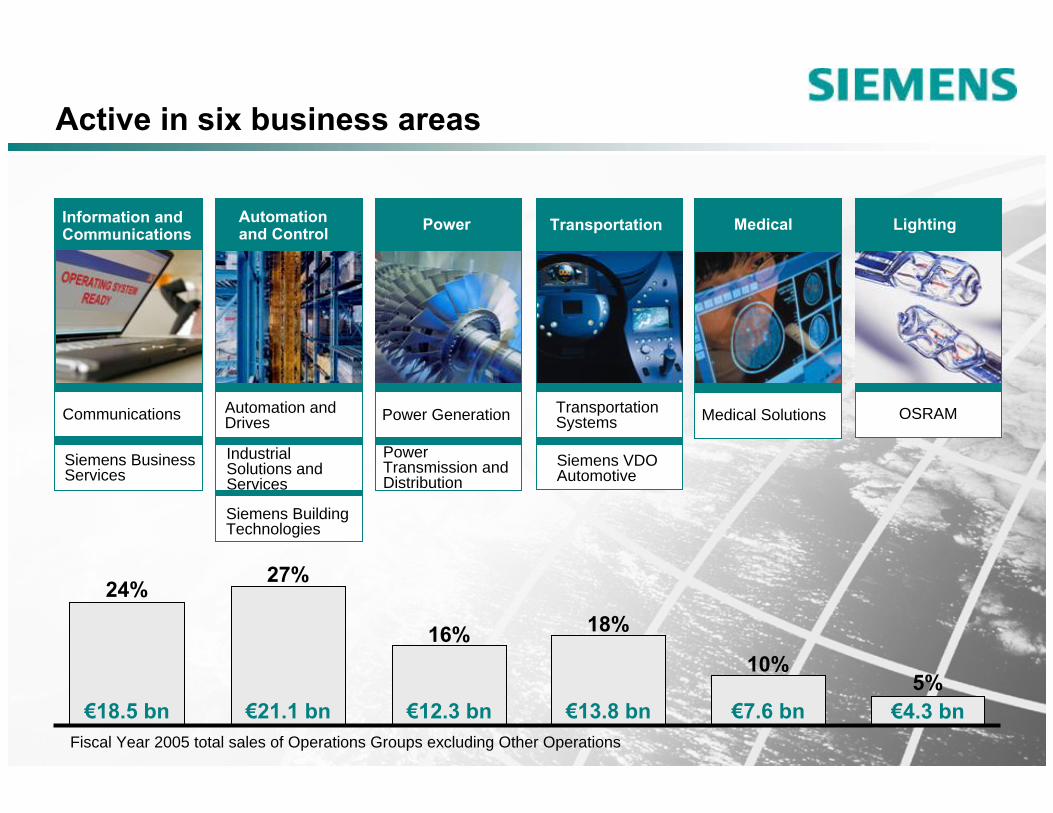
Active in six business areas
LightingAutomation and Control
Information andCommunications Power Transportation Medical
OSRAMAutomation andDrives
Industrial Solutions and Services
Communications
Siemens BusinessServices
Power Generation
PowerTransmission andDistribution
TransportationSystems
Siemens VDOAutomotive
Medical Solutions
Siemens Building Technologies
€21.1 bn€18.5 bn €12.3 bn €7.6 bn€13.8 bn €4.3 bn
27%24%
16%10%
18%
5%
Fiscal Year 2005 total sales of Operations Groups excluding Other Operations
Page 3
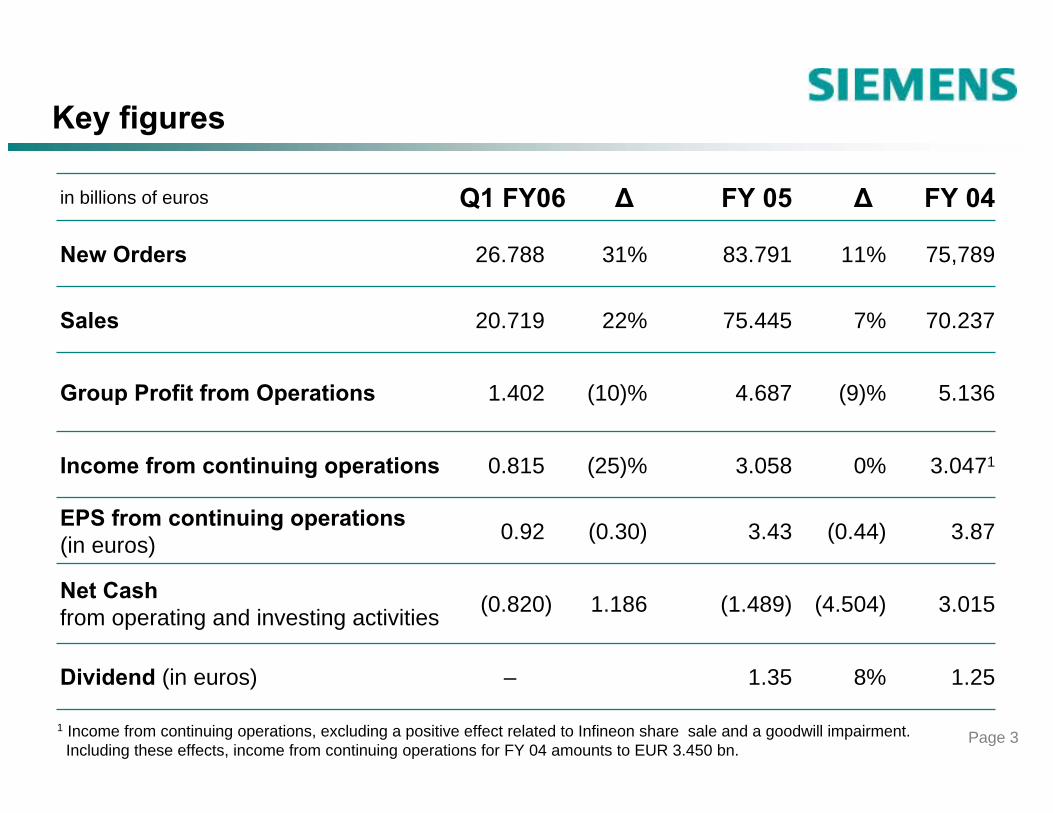
Key figures
8%
(4.504)
(0.44)
0%
(9)%
7%
11%
∆
1.186
(0.30)
(25)%
(10)%
22%
31%
∆
1.25
3.015
3.87
3.0471
5.136
70.237
75,789
FY 04
(1.489)(0.820)Net Cash from operating and investing activities
3.0580.815Income from continuing operations
1.35–Dividend (in euros)
4.6871.402Group Profit from Operations
3.43
75.445
83.791
FY 05
0.92
20.719
26.788
Q1 FY06
Sales
EPS from continuing operations(in euros)
New Orders
in billions of euros
1 Income from continuing operations, excluding a positive effect related to Infineon share sale and a goodwill impairment. Including these effects, income from continuing operations for FY 04 amounts to EUR 3.450 bn.
Page 4
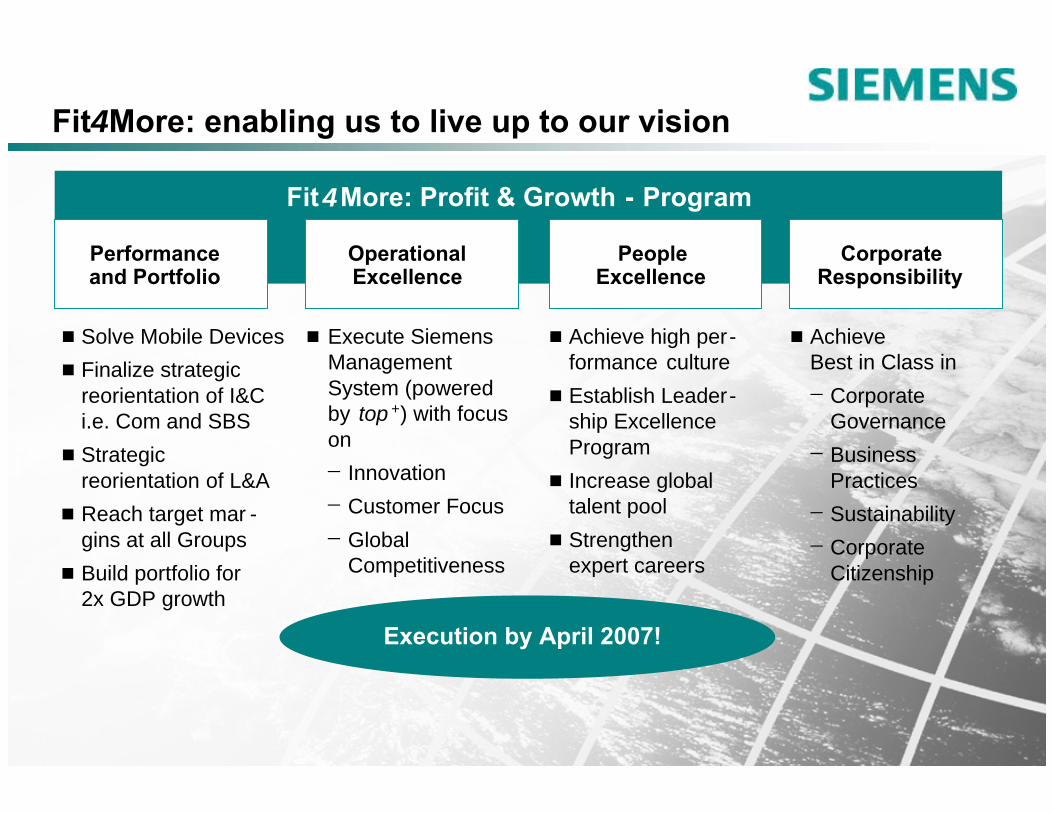
Performanceand Portfolio
OperationalExcellence
CorporateResponsibility
PeopleExcellence
Execute SiemensManagement System (powered by top +) with focus on− Innovation− Customer Focus− Global
Competitiveness
Achieve high per-formance cultureEstablish Leader-ship ExcellenceProgramIncrease global talent poolStrengthen expert careers
Solve Mobile DevicesFinalize strategicreorientation of I&Ci.e. Com and SBSStrategicreorientation of L&AReach target mar -gins at all GroupsBuild portfolio for2x GDP growth
Achieve Best in Class in− Corporate
Governance− Business
Practices− Sustainability− Corporate
Citizenship
Fit4 More: Profit & Growth - Program
Fit 4
Execution by April 2007!
Fit4More: enabling us to live up to our vision

Page 5
Performanceand Portfolio
OperationalExcellence
CorporateResponsibility
PeopleExcellence
Build portfolio for2x GDP growth
Fit4 More: Profit & Growth - Program
Building the future portfolio
Exogenous growthOrganic growth Growth Platforms
A&D
Med
SiemensONE
US Filter
BonusEnergy
VA Tech
CTI Molecular Imaging
Flender
Solve Mobile DevicesFinalize strategicreorientation of I&Ci.e. Com and SBSStrategicreorientation of L&AReach target marginsat all Groups

Page 6
… support our profitable growth strategy
Strategic goals of M&A activities …
Enhance regional presence fitting to worldwide strategy
Speed up consolidation / market penetration
Gain selected specific R&D competence
Create growth platforms by broadening the existing portfolio
Complement existing business portfolio adjacencies

Page 7
Transactions have been proven to be successful !
YearSignificant
strategic goalPurchase price (EV) Assessment
write-off1.6Strengthening position in DSL broadband access market 2001Efficient
on-track0.8Strengthening position in ultrasound2000Acuson
success6.8 Strengthening position in automotive, logistics and industrial turbines
2000Atecs
success1.0Strengthening position in fossil-fired power plants, equipment and services worldwide
1998Westinghouse
on-track2.1Expansion into healthcare IT2000Shared Medical
on-track1.6Strengthening position in the Building Systems Division1998Electrowatt
success0.75Strengthening position in the US market1993Sylvania
success0.9Strengthening position in industrial turbines
2003Alstom
in billions of euros
Track record of major M&A activities

Page 8
Strengthening our portfolio through activeportfolio management
Page 9
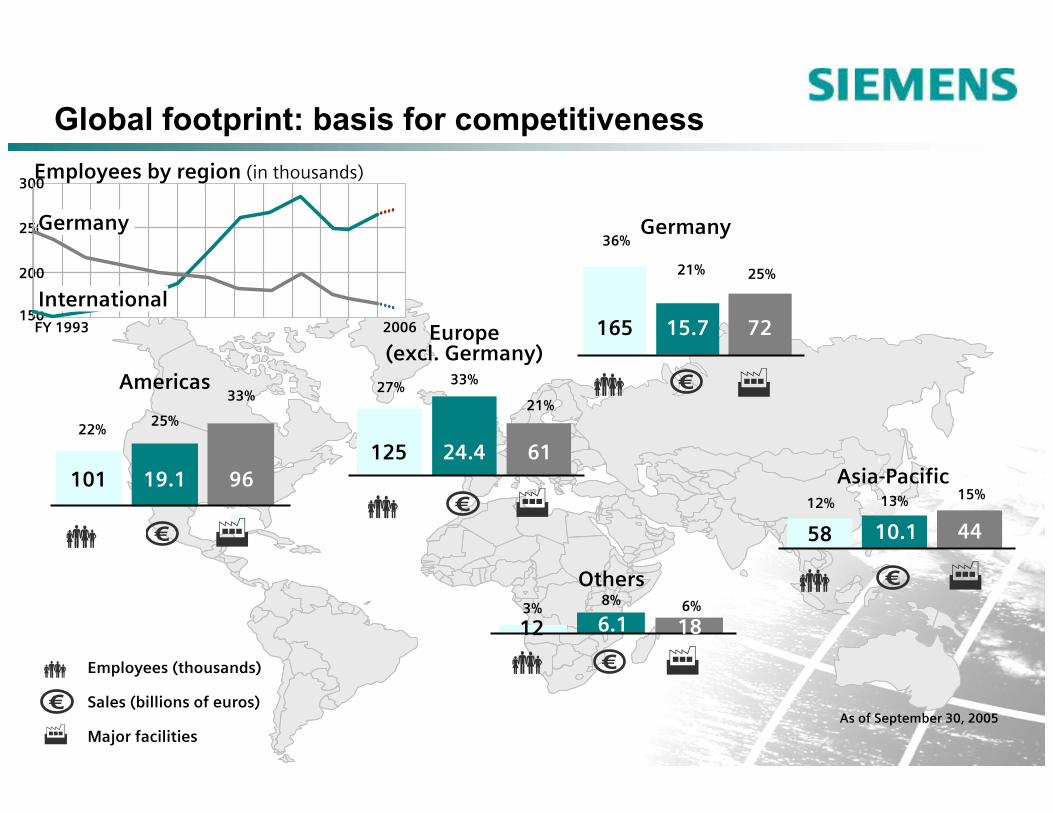
Americas
22%25%
33%
101 19.1 96
€
Europe(excl. Germany)
27% 33%
21%
125 24.4 61
€
Germany36%
21% 25%
165 15.7 72
€
Others3% 8% 6%
12 6.1 18
€
Asia-Pacific12% 13% 15%
58 10.1 44
€
Employees (thousands)
Sales (billions of euros)
Major facilities
€As of September 30, 2005
Global footprint: basis for competitivenessEmployees by region (in thousands)
250
300
150
200
FY 1993 2006
Germany
International

Page 10
Well prepared to master global trends
Siemens todayDrinking water treatment Water distributionWastewater treatment
1.2 billion people without drinking water2.4 billion people not connected to waste water systems40% increase in water consumption by 2025
More than 60% increase in worldwide energy demand by 2030Increase of CO2 emission risk to global climate
Siemens todayStrong No. 2 in power technologies worldwideComplete range of offerings for wind power, hydropower, biomass, fuel cells and fossil fuelsTrendsetter in intelligent power generation and distributionLow-loss electricity transport
Water
Power
Page 11
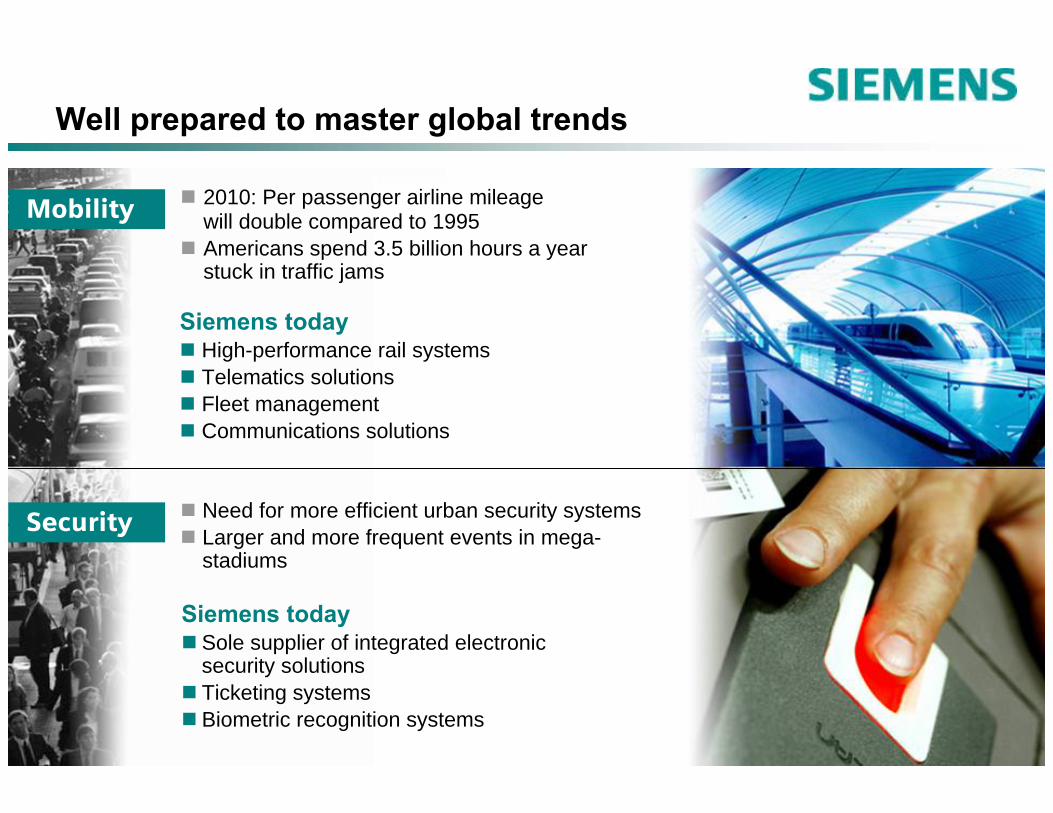
Well prepared to master global trends
Siemens todayHigh-performance rail systemsTelematics solutionsFleet managementCommunications solutions
2010: Per passenger airline mileagewill double compared to 1995Americans spend 3.5 billion hours a year stuck in traffic jams
Need for more efficient urban security systemsLarger and more frequent events in mega-stadiums
Siemens todaySole supplier of integrated electronic security solutionsTicketing systemsBiometric recognition systems
Mobility
Security

Page 12
Well prepared to master global trends
Siemens todayNo. 1 in healthcare ITTechnology leader in imaging systemsInnovation leader in healthcare processes
Percentage of 80+ generation to grow globallyHealthcare costs in industrialized nations rise to €3.8 trillion in 2010 (2002: €2.9 trillion) In Germany, healthcare costs account for 10.7% of GDP
Increasing consumption of oil (until 2030 CAGR 1.8%), natural gas (2.5%) and coal (1.6%) to fuel global energy demand requires efficient systems and solutions for mining industriesIncreasing world population requires efficient production and supply of food and goods
Siemens todayLeading solution provider for mining, oil & gas industries No. 1 in industry automation
Healthcare
Industry
Page 13
Ningbo
Shenyang
Changchun
Fuzhou
Guangzhou
Shenzhen
South
Qingdao
Northeast
NanningDongguan
LiuzhouFoshan
Xiamen
Haikou
Wuhan
Nanchang
GuiyangPanzhihua Guilin
Chongqing
Yichang
Yibin
Mianyang
Tanggu
Urumqi
Yinchuan
Lanzhou
Tangshan
BeijingHuhhot
XuzhouLuoyangZhengzhou
Taiyuan
Xi ‘an
Baotou
North
Yantai
JiningJinan
Chengdu
Zibo
Hefei
Hangzhou
Kunming
Harbin
Changsha
Changde
East
Wenzhou
NanjingSuzhou
Nantong
Dalian
Jinzhou
Shanghai
TianjinShijiazhuang
Jinhua
Wuxi
Zhuhai
Jiangmen
Shantou
YangzhouSouthwest
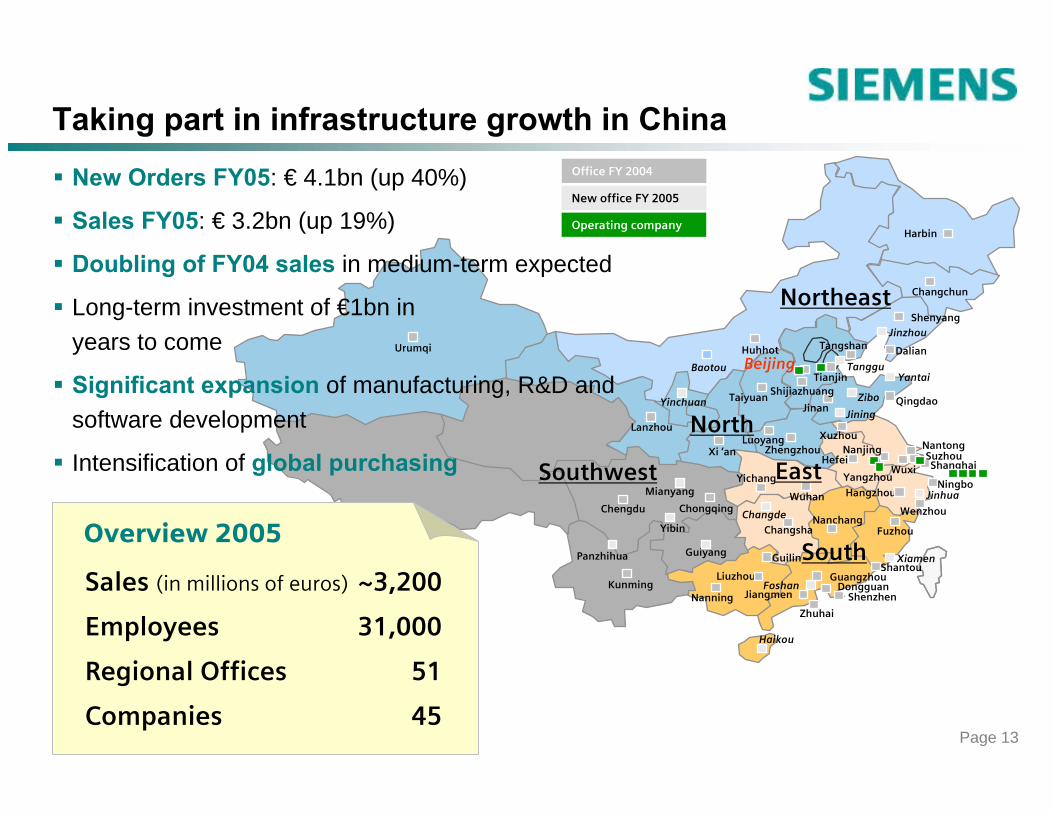
Taking part in infrastructure growth in China
New office FY 2005
Operating company
Office FY 2004New Orders FY05: € 4.1bn (up 40%)
Sales FY05: € 3.2bn (up 19%)
Doubling of FY04 sales in medium-term expected
Long-term investment of €1bn inyears to come
Significant expansion of manufacturing, R&D and software development
Intensification of global purchasing
Sales (in millions of euros) ~3,200
Employees 31,000
Regional Offices 51
Companies 45
Overview 2005
Page 14
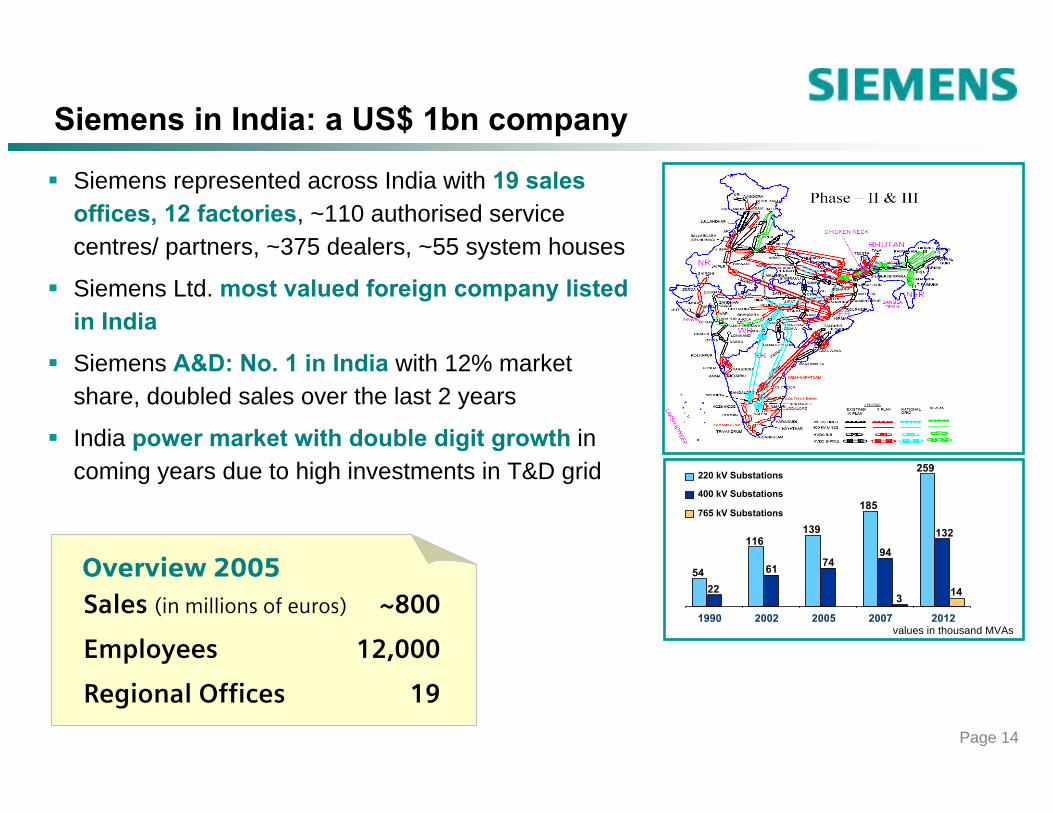
Siemens in India: a US$ 1bn company
Siemens represented across India with 19 sales offices, 12 factories, ~110 authorised service centres/ partners, ~375 dealers, ~55 system houses
Siemens Ltd. most valued foreign company listed in India
Siemens A&D: No. 1 in India with 12% market share, doubled sales over the last 2 years
India power market with double digit growth in coming years due to high investments in T&D grid
values in thousand MVAs
54
116139
185
259
22
61 7494
3 14
132
1990 2002 2005 2007 2012
220 kV Substations
400 kV Substations
765 kV Substations
Sales (in millions of euros) ~800
Employees 12,000
Regional Offices 19
Overview 2005
Page 15
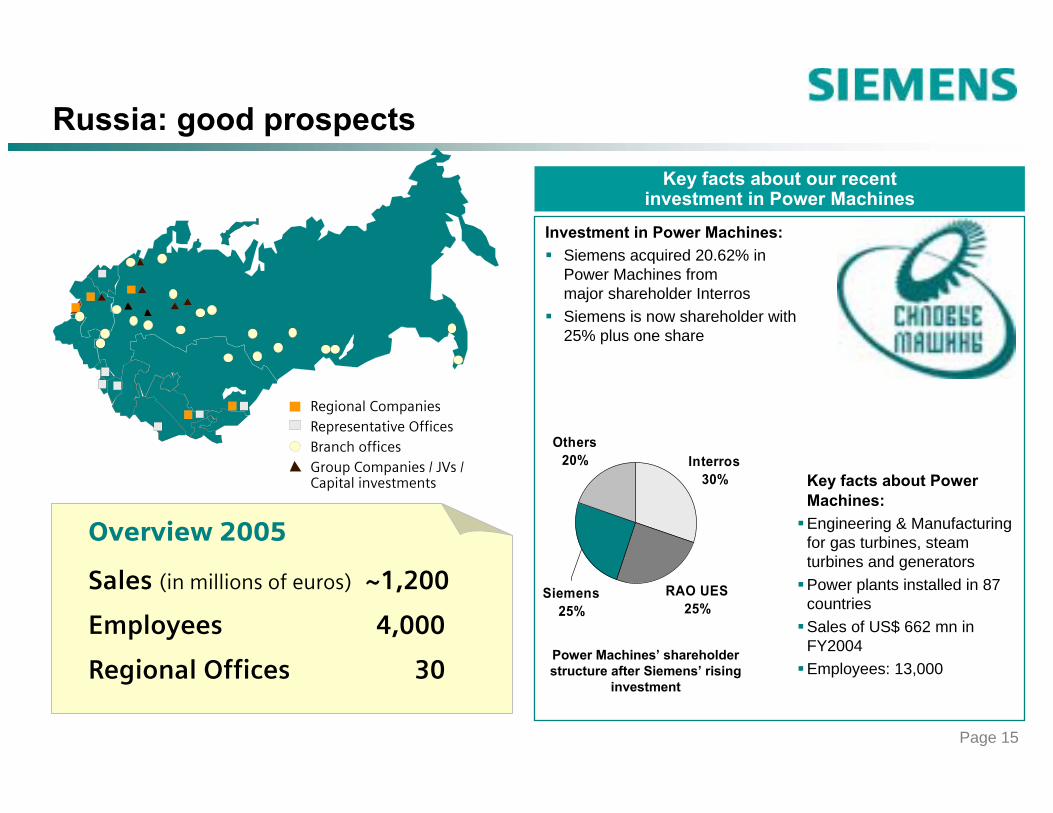
Russia: good prospects
Regional Companies Representative OfficesBranch officesGroup Companies / JVs / Capital investments
Sales (in millions of euros) ~1,200
Employees 4,000
Regional Offices 30
Overview 2005
Investment in Power Machines:Siemens acquired 20.62% inPower Machines frommajor shareholder InterrosSiemens is now shareholder with25% plus one share
Key facts about our recentinvestment in Power Machines
Interros30%
RAO UES25%
Others20%
Siemens25%
Power Machines’ shareholder structure after Siemens’ rising
investment
Key facts about Power Machines:Engineering & Manufacturing for gas turbines, steam turbines and generatorsPower plants installed in 87countriesSales of US$ 662 mn in FY2004Employees: 13,000
Page 16
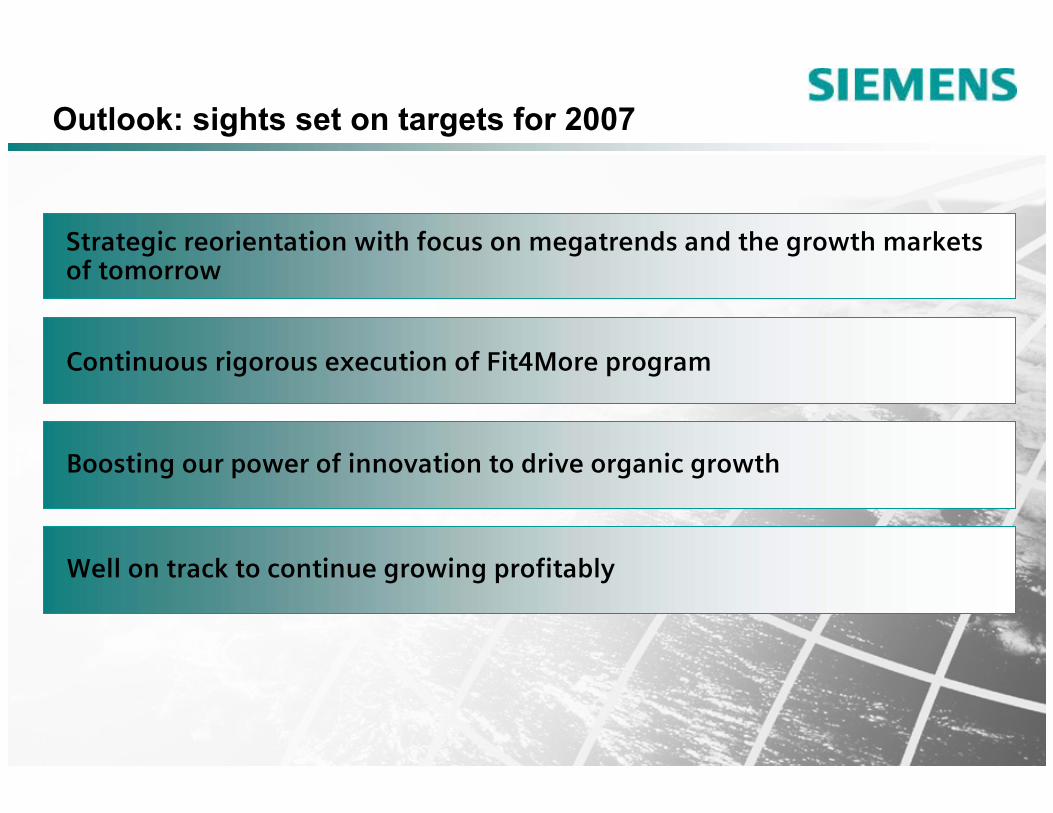
Continuous rigorous execution of Fit4More program
Outlook: sights set on targets for 2007
Strategic reorientation with focus on megatrends and the growth markets of tomorrow
Boosting our power of innovation to drive organic growth
Well on track to continue growing profitably
Page 17
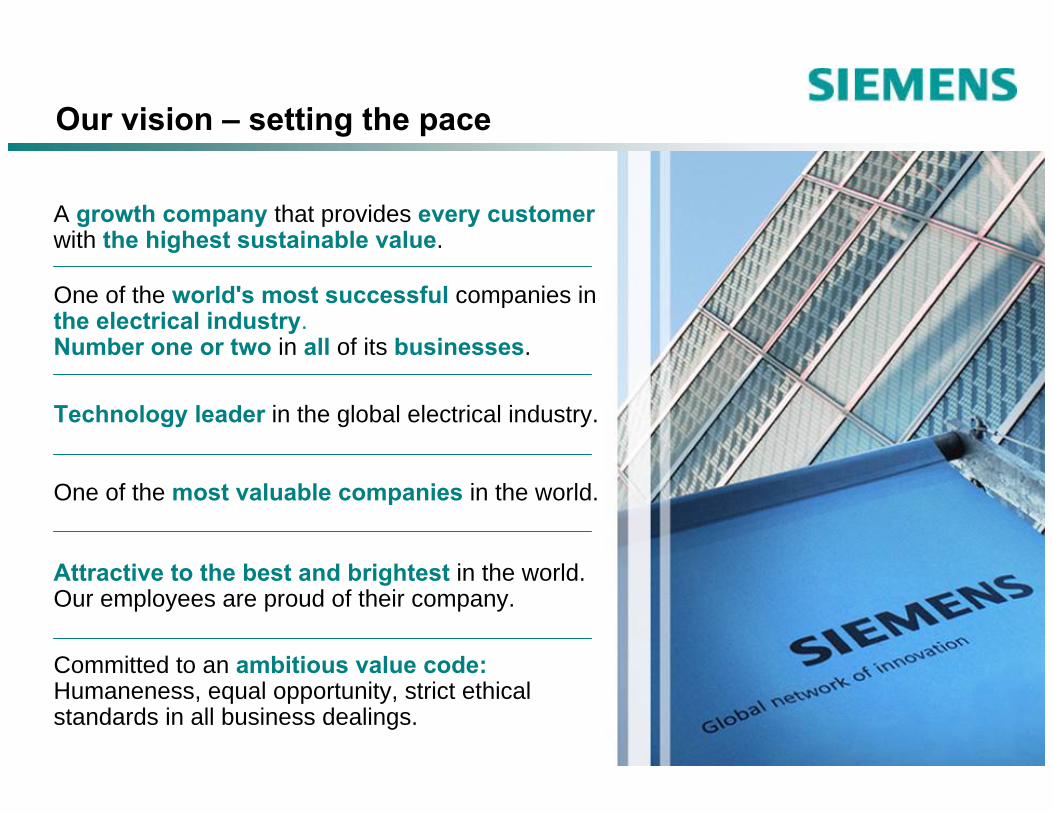
Our vision – setting the pace
A growth company that provides every customerwith the highest sustainable value.
Technology leader in the global electrical industry.
Attractive to the best and brightest in the world. Our employees are proud of their company.
Committed to an ambitious value code:Humaneness, equal opportunity, strict ethical standards in all business dealings.
One of the most valuable companies in the world.
One of the world's most successful companies inthe electrical industry.Number one or two in all of its businesses.
Page 18
Appendix

Page 19
Sales (in millions of euros)
Sales 13,141
Orders 13,802
Group profit 454
Employees 55,000
Group profit margin
Sales by region
Germany
Others
Americas
Asia-Pacific
Target: 8-11%
5.6%
Communications (Com)
12,238 12,708
(in millions of euros) FY 2005
Europe (excl. Germany)
35%16%
13%
15% 21%
2003*) 2004
No. 1 IP PBX systems
No. 1 UMTS networks (with partner NEC)
No. 1 Wireless modules
No. 1 IP convergence for carriers
3.5%
13,141
2005*) Figures not consolidated
-2.0%

Page 20
Sales 5,373
Orders 6,531
Group profit -690
Employees 39,000
Group profit margin
Sales by business field
Operation Related Services
ProductRelatedServices
Solution Business
52%
23%
25%
Target: 5-6%
Siemens Business Services (SBS)
6,034 5,773 5,205 4,716
1.7% 0.2% 0.8%
(in millions of euros) FY 2005
No. 1 Outsourcing partner in the European media business
No. 1 IT service provider in the German financial sector
No. 1 Solutions provider in discrete manufacturing in West. Europe
Sales (in millions of euros)
5,373
2001 2002 2003 2004
-4.3%
2005-12.8%
Page 21
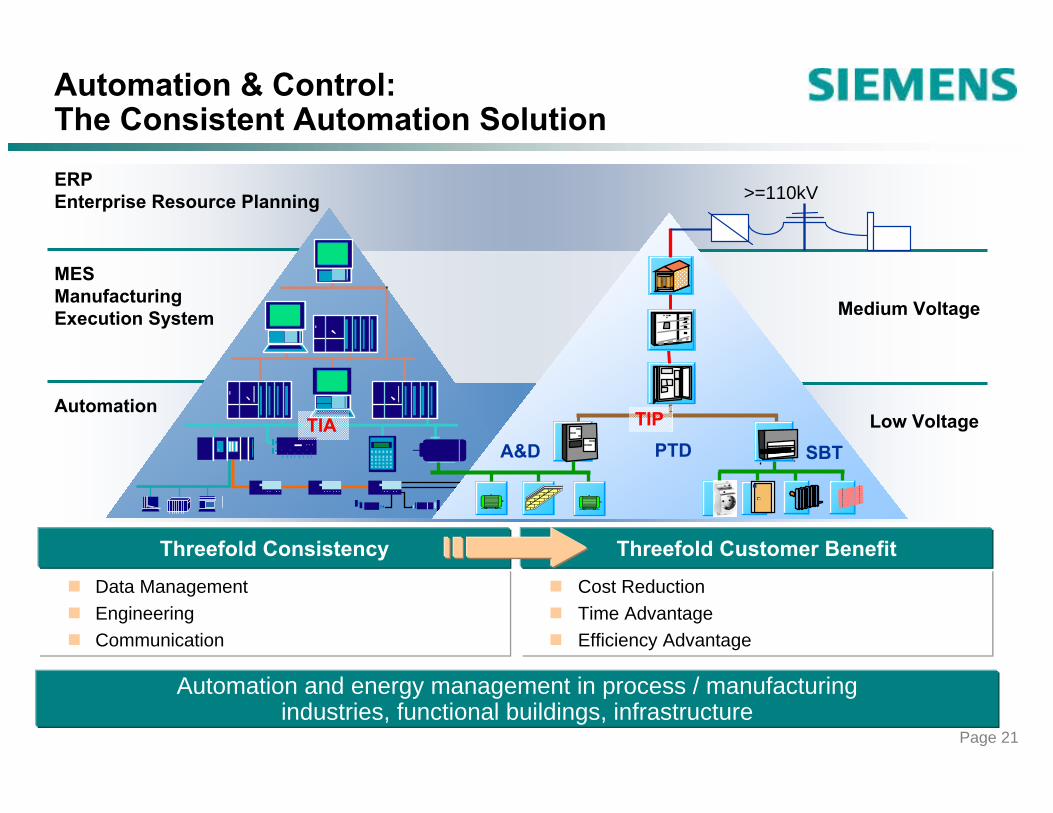
Automation & Control: The Consistent Automation Solution
Data ManagementEngineeringCommunication
Cost ReductionTime AdvantageEfficiency Advantage
A&D PTD SBT
>=110kV
MESManufacturing Execution System
ERPEnterprise Resource Planning
Automation
Medium Voltage
Low Voltage
Threefold Consistency Threefold Customer Benefit
Automation and energy management in process / manufacturing industries, functional buildings, infrastructure
TIA TIP

Page 22
Power: The future energy landscape will be environmental-friendly and integrated
Deep Sea Exploration
Gas Liquefaction LNG Gas To Liquids GTL
Integrated Gasification IGCC
Off-shore Windpark
Unconventional Oils(tar sands, oil shales)
Synfuels from Gasification
System Load Management
Fuel Cells
CO2 Separation/Deposition
Power PlantDispatch Optimization
Hydrogen Economy
Flue Gas Cleaning(Scrubbers, Mercury)
Nuclear Power Plant

Page 23
Medical: New business opportunitiesare large and fast growing
2004 2007
~ 96
~ 130
~ 61
~ 35 ~ 41Major market segmentscurrently served
New potentialfocus areas, e.g.:
Contrast mediaIn vitro diagnostics(incl. Biochips and mass spectroscopy)Tissue engineering
(in € billions; currency adjusted)
+13% p.a.
+6% p.a.

Page 24
Med: Soarian and Syngo cover the continuum of care ...
Resourceplanning ADT
POE
BillADT
Document
OR, Onco, Cardio
Intensive
Station
Ward
LaboratoryECG
Administrative Cycle
Therapeutic Cycles
Diagnostic Cycles
Care Cycles
ClinicalCycles
Radiology
Rehabilitation
syngoTM
syngoTM
syngoTM
SoarianTM
... combining the diagnostic, therapeutic and care cycles, with the clinical and administrative cycles
syngoTM
SoarianTM
23,000 Soarian userson a daily basis,72+ live customers,over 1 billion patientresults converted
Page 25
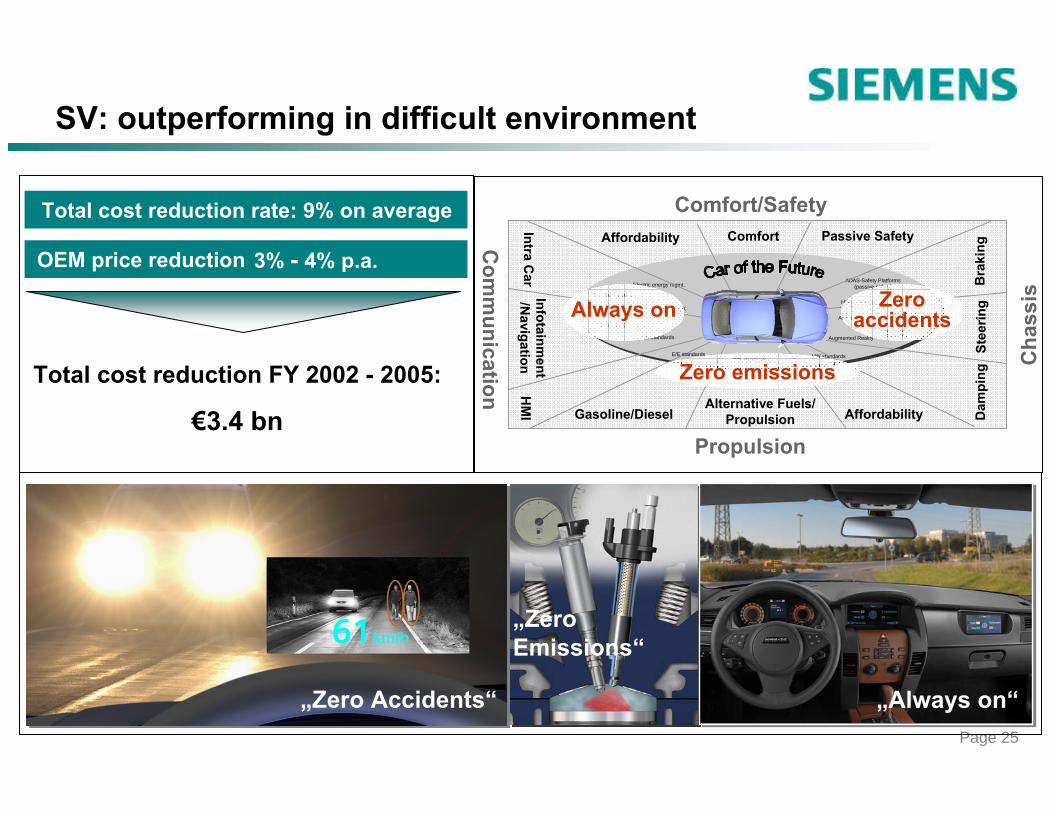
SV: outperforming in difficult environment
OEM price reduction
Total cost reduction FY 2002 - 2005:
€3.4 bn
3% - 4% p.a.
Total cost reduction rate: 9% on average
„Zero Accidents“
„ZeroEmissions“
„Always on“
Comfort/Safety
Com
munication
Affordability Comfort Passive Safety
Dam
ping
Stee
ring
Bra
king
HM
IInfotainm
ent/N
avigationIntra C
ar
Gasoline/DieselAlternative Fuels/
Propulsion Affordability
Cha
ssis
E/E standards
Active Safety
Key less cockpit
HW standards
New production concepts
Improved Diagnostics
E/E standards Augmented Reality
ADAS-Safety Platforms (passive safety)Electric energy mgmt.
Workload manager
1st gen ADAS
Propulsion
E/E standards
HW standards Zeroaccidents
Zero emissions
Always on

Page 26
Osram: applications for future lighting business
Illumination Visualization Sensing Special
Making something visible Other applications from material and water treatment to medical
Use light to displayany type of information
Light is detected or detects something
3%* 10%* 6%* 6%*
e.g. backlighting for electronic devices, high-tech lamps for projection, ...
e.g. sensors for automotiveapplications (rain sensors, distance control), ...
e.g. water purification systems (UV light), purification of wafer, ...
* Market CAGR (2006-2015) / estimation by OSRAM
Megatrends: Demographic Change and Urbanization
e.g. energy saving lamps,high-brightness LEDs, head-lights for automotive, ...
Page 27
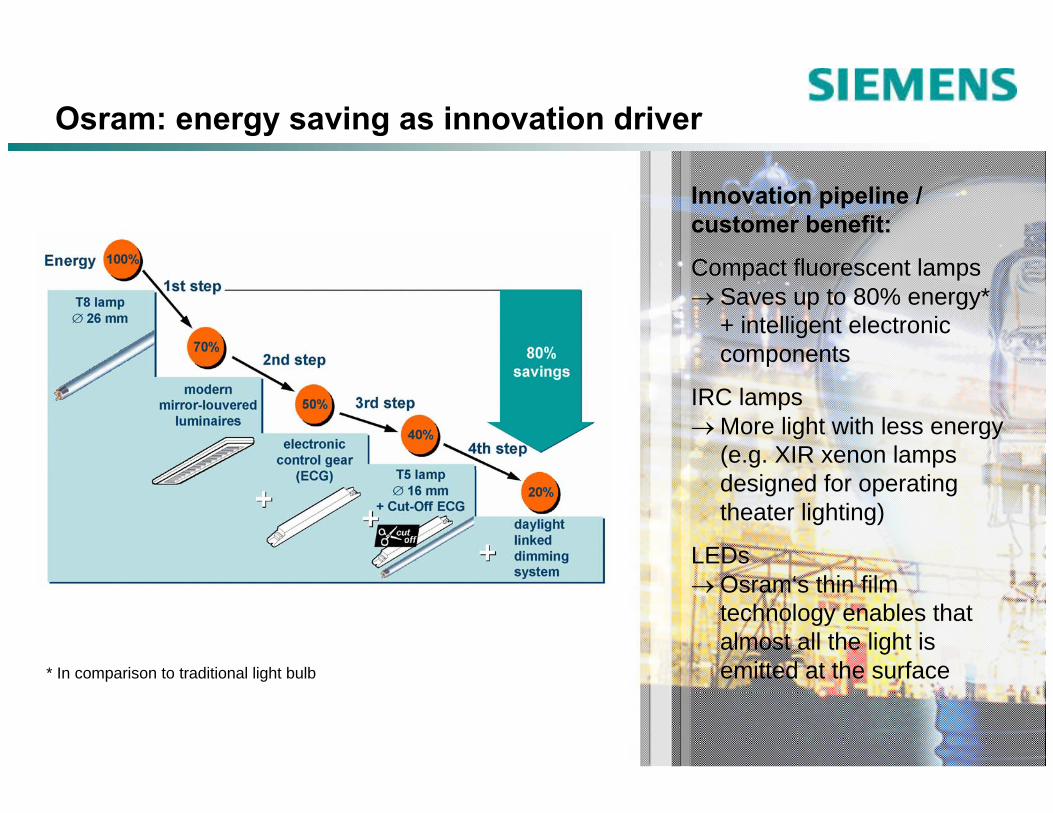
Osram: energy saving as innovation driver
Innovation pipeline / customer benefit:
Compact fluorescent lamps→ Saves up to 80% energy*
+ intelligent electronic components
IRC lamps→ More light with less energy
(e.g. XIR xenon lamps designed for operating theater lighting)
LEDs→ Osram‘s thin film
technology enables that almost all the light is emitted at the surface* In comparison to traditional light bulb
Page 28
”Group profit from Operations” is reconciled to ”Income before income taxes” of Operations under ”Reconciliation to financial statements”on the table ”Segment information.” See ”Financial Reports / Fiscal 2005, Annual Report Fiscal 2005 or Fiscal 2006 / Quarter 1 / Financial Statements” at our Investor Relations website under www.siemens.com
The allocated equity for SFS is determined and influenced by the respective credit ratings of the rating agencies and by the expected size and quality of its portfolio of leasing and factoring assets and equity investments and is determined annually. This allocation is designed to cover the risks of the underlying business and is in line with common credit risk management standards in banking. The actual risk profile of the SFS portfolio is monitored and controlled monthly and is evaluated against the allocated equity.
”ROE” (Return on equity) margin for SFS was calculated as SFS’ income before income taxes divided by the allocated equity for SFS. Allocated equity for SFS as of September 30, 2005 was €983 million. See also Siemens’ Form 20-F at our Investor Relations website under www.siemens.com
Siemens ties a portion of its executive incentive compensation to achieving economic value added (EVA) targets. EVA measures theprofitability of a business (using Group profit for the Operating Groups and income before income taxes for the Financing and Real estate businesses as a base) against the additional cost of capital used to run a business, (using Net capital employed for the Operating Groups and risk-adjusted equity for the Financing and Real estate businesses as a base). A positive EVA means that a business has earned more than its cost of capital, and is therefore defined as value-creating. A negative EVA means that a business is earning less than its cost of capital and is therefore defined as value-destroying. Other organizations that use EVA may define and calculate EVA differently.
A reconciliation of EVA may be found on our Investor Relations website under www.siemens.com
Reconciliations and definitions
Page 29
Siemens Investor Relations Team
Webpage: http://www.siemens.com Investor Relations
e-mail: [email protected]
Fax: +49-89-636-32830
Marcus Desimoni +49-89-636-32445
Frank Heffter +49-89-636-34095
Irina Pchelova +49-89-636-33693
Christina Schmöe +49-89-636-32677
Susanne Wölfinger +49-89-636-30639