he I The SyrIan crISIS on The ebaneSe p S and prIorITy r and...AEMS: Advance Engineering &...
76
THE IMPACT OF THE SYRIAN CRISIS ON THE LEBANESE POWER SECTOR AND PRIORITY RECOMMENDATIONS FINAL REPORT February 2017
Transcript of he I The SyrIan crISIS on The ebaneSe p S and prIorITy r and...AEMS: Advance Engineering &...

The ImpacT of The SyrIan crISIS on The LebaneSe power SecTor and prIorITy recommendaTIonS
FINAL REPORTFebruary 2017

The Impact of the Syrian Crisis on the Lebanese Power Sector and Priority Recommendations2
Main Author
This report has been prepared by the energy consultancy AEMS, http://www.aems-lb.com/
Main reviewers - Ministry of Energy and Water
Ms. Nada Boustani, Advisor to the Minister of Energy and Water
Ms. Suzy Hoayek, LCRP Coordinator for the Ministry of Energy and Water
Dr. Khaled Nakhle, Advisor to the Minister of Energy and Water
Mr. Robert Sfairy, Senior Energy Consultant to the Minister of Energy and Water
Main reviewers - United Nations Development Programme
Ms. Jihan Seoud, Officer in Charge, Energy and Environment Program, UNDP
Dr. Hassan Harajli, Project Manager, EU funded UNDP CEDRO
Ms. Carla Nassab, Energy Engineer, EU funded UNDP CEDRO
Copyright © 2017
All rights reserved for the Ministry of Energy and Water, and the UNDP.
Reproduction is authorized provided the source is acknowledged and provided reproduction is not sold. The United Nations Development Programme (UNDP) is the UN’s principle provider of development, advice advocacy and grant support. With some 170 country offices, it has long enjoyed the trust and confidence of government and NGOs in many parts of the developing as well as the developed world. It is typically regarded as a partner rather than as an adversary, and its commitment to universal presence proved especially useful in post – conflict situation and with states that have been otherwise isolated from international community.
Note: The information contained within this document has been developed within a specific scope, and might be updated in the future.
Acknowledgments
The Ministry of Energy and Water and the United Nations Development Programme (UNDP) would like to thank the Kingdom of the Netherlands for the grant that enabled this study and other crucial energy interventions for host communities in Lebanon.

Final Report 3
Foreword
H.E. Cesar Abi Khalil, Minister of Energy and Water
Since the onset of the Syrian crisis in 2011, Lebanon has been hosting displaced Syrian nationals reaching 1.5 million in 2015 when the Government of Lebanon decided to close its borders. The number has remained relatively stable since then.
In 2015, the Government of Lebanon took the lead in setting a multi-sectoral strategy, the Lebanon Crisis Response Plan (LCRP), with the aim of mitigating the impact of the Syrian crisis on its territories. The LCRP is a joint effort between the GoL’s relevant ministries on one hand and the UN agencies, local and international NGO’s and international donors on the other. The LCRP incorporates several affected sectors, not the least of which is the Energy sector, stated as a stand-alone sector in the LCRP 2017-2020.
Prior to putting a medium term strategy under LCRP 2017-2020, MoEW was keen in 2016 to obtain realistic numbers of the electricity consumed by the displaced Syrians based on a household survey. Financed by the Kingdom of the Netherlands, and in collaboration with our partners UNDP, both of whom I thank deeply, the study “The Impact of the Syrian Crisis on the Lebanese Power Sector and Priority Recommendations” provided us with clear results and tangible indicators that highlight the areas where urgent action is needed.
Overall, the study shows that the displaced Syrians require a power generation of almost 480 MW, exceeding the additional production of 443MW added to the national grid by the Ministry since 2012. It also shows that the percentage of illegal connections to the grid vary between 36% in the North of Lebanon, to 82% in Beirut and Mount Lebanon, with an average of 45%. These facts result in a financial burden on the national economy exceeding $330 million per year.
Therefore, in order to tackle this problem, the energy team at MoEW proposed to target several axes simultaneously: the first is the electricity generation aspect, the second focuses on the demand side, while the third deals with the transmission and distribution systems. These are further developed in this study as well as in our Energy chapter under LCRP 2017-2020.
MoEW will put all the necessary effort to respond to the impact of the Syrian crisis on the Energy sector. Yet, we count on our partners of the international community to support us in providing assistance to the Energy sector to ease the burden on Lebanon as a hosting country carrying a burden above its capacities. By doing so, Lebanon will continue to cater for the needs of the displaced Syrian citizens who had to fled their homeland in spite of their will.
Cesar Abi Khalil
Minister of Energy and Water

The Impact of the Syrian Crisis on the Lebanese Power Sector and Priority Recommendations4
Foreword UNDP
Philippe Lazzarini, UNDP Resident Representative
The power sector in Lebanon is known for chronic inefficiencies and shortages in supply reaching up to nine hours per day in some regions, and even more during the peak summer months. Over the past few years, the Government of Lebanon has worked on improving the energy supply by upgrading some of the power utilities and purchasing electricity from temporary facilities, namely barges. However, with the massive influx of refugees caused by the Syrian conflict, the surge in demand for power has surpassed most efforts made to improve supply, leaving the country with a higher energy deficit than in 2012.
The present study, undertaken in partnership with the Ministry of Energy and Water, with the generous funding from the Government of the Netherlands, assesses the impact of the Syrian crisis on the energy sector in Lebanon and is based on extensive surveys. Results indicate an overall increase of 480 Megawatts in energy consumption; nearly equivalent to the current deficit in supply which means the electricity gap is now double that of 2010.
More importantly, the study identifies short and medium term recommendations to overcome these problems. The recommendations focus on demand-side energy management options, prioritize renewable energy and energy efficiency and also highlight the need to upgrade the transmission and distribution infrastructure to ultimately lessen the impact of the crisis. The findings of this study were used to formulate the strategy of the energy sector within the Lebanon Crisis Response Plan (2017–2020), which was adopted at the end of last year.
Adequate, sustainable and affordable power supply for all people residing in Lebanon is a matter that requires urgent attention. In parallel to the continued efforts of the Government of Lebanon to pursue the structural reforms needed to implement the national electricity agenda, technical and financial support are needed to overcome the additional challenges faced by this sector as a result of the Syrian crisis.

Final Report 5
ACRONYMS AND ABBREVIATIONS
3RP: The Regional Refugee and Resilience PlanAEMS: Advance Engineering & Management Services BDL: Banque Du Liban (Central Bank of Lebanon)BLOM: Banque du Liban et Outre MerBUS: BUTEC Utility ServicesCDR: Council for Development and ReconstructionDER: Distributed Energy ResourcesDESS: Distributed Energy Storage SystemDGGS: Directorate General of General SecurityDSP: Distribution Service Provider at EDLEDL: Électricité Du LibanEU: European UnionGDP: Gross Domestic ProductGIS: Geographic Information SystemGOL: Government of LebanonGS: General SecurityHV: High VoltageIMF: International Monetary Fund INDC: Intended Nationally Determined ContributionIOM: International Organization for Migration IS: Informal SettlementKVA: K & A JV (Joint Venture)KW: KilowattKWH: Kilowatt HourLCEC: Lebanese Center for Energy ConservationLCRP: Lebanon Crisis Response PlanLV: Low VoltageML: Mount LebanonMEHE: Ministry of Education and Higher EducationMoEW: Ministry of Energy and WaterMoIM: Ministry of Interior and MunicipalitiesMoPH: Ministry of Public HealthMoSA: Ministry of Social AffairsMV: Medium VoltageMW: MegawattMWH: Megawatt HourNEC: National Electrical CodeNEEREA: The National Energy Efficiency and Renewable Energy Action NEUC: National Electrical Utility Company NGO: Non-Governmental OrganizationNon IS: Non Informal SettlementOHTL: Overhead Transmission LinesPF: Power FactorPRL: Palestinian Refugees in LebanonPRS: Palestinian Refugees from SyriaPV: PhotovoltaicRCREE: Regional Centre for Renewable Energy and Energy Efficiency SISSAF: Support Program for Infrastructure Sector Strategies and Alternative FinancingTCL: Total Connected LoadToR: Terms of ReferenceUN: United NationsUNDP: United Nations Development ProgrammeUNHCR: United Nations High Commissioner for RefugeesUNICEF: The United Nations International Children’s Emergency Fund UNRWA: United Nations Relief and Works Agency for Palestinian Refugees in the Near EastWFP: World Food Programme

The Impact of the Syrian Crisis on the Lebanese Power Sector and Priority Recommendations6
TABLE OF CONTENTS
1. EXECUTIVE SUMMARY 10
2. BACKGROUND 12
3. PROJECT DESCRIPTION AND METHODOLOGY 13
3.1 Data Gathering ........................................................................................................................................................................................... 13
3.2 Site Survey .................................................................................................................................................................................................... 18
3.3 Survey Findings ......................................................................................................................................................................................... 18
3.3.1 Beirut & Mount Lebanon Governorate ....................................................................................................................................... 18
3.3.2 Bekaa Region .............................................................................................................................................................................................. 19
3.3.3 North Region ............................................................................................................................................................................................... 20
3.3.4 South Region ............................................................................................................................................................................................... 21
3.3.5 Healthcare Centers ................................................................................................................................................................................. 21
3.3.6 Education Centers ................................................................................................................................................................................... 22
3.3.7 Other Institutions ..................................................................................................................................................................................... 24
3.3.8 General Findings ....................................................................................................................................................................................... 24
3.4 Data Validation & Analysis ................................................................................................................................................................ 25
4. Econometrics and Statistical Analysis 26
4.1 Introduction .................................................................................................................................................................................................. 26
4.2 Methodology ............................................................................................................................................................................................... 26
4.3 Determining the Seasonal Indices and Deseasonalized Loads for the Entire South Region ............ 27
4.4 Average Power Consumption per Family Based on EDL Data for the Entire South Region ................. 29
4.5 Analysis of Survey Data ....................................................................................................................................................................... 31
4.6 Validation of Estimates ........................................................................................................................................................................ 33
5. POWER CONSUMPTION CALCULATION 34
5.1 Demand Factor ........................................................................................................................................................................................... 34
5.2 Diversity Factor .......................................................................................................................................................................................... 34
5.3 Calculations and Scenarios ............................................................................................................................................................... 34
6. MAIN RESULTS 36
7. IMPLICATIONS OF THE SYRIAN CRISIS ON THE ELECTRICITY IN LEBANON 52
8. RECOMMENDATIONS AND PRIORITIZATION OF INTERVENTIONS 53
8. RECOMMENDATIONS AND PRIORITIZATION OF INTERVENTIONS ................................................................ 53
8.1 General Recommendations ............................................................................................................................................................... 53
8.2 Recommendations Specific to Water Pumping ................................................................................................................... 54
8.3 Recommendations Specific to Decentralized Power Generation ............................................................................ 55
8.4 Prioritization ................................................................................................................................................................................................. 57

Final Report 7
TABLE OF CONTENTS
1. EXECUTIVE SUMMARY 10
2. BACKGROUND 12
3. PROJECT DESCRIPTION AND METHODOLOGY 13
3.1 Data Gathering ........................................................................................................................................................................................... 13
3.2 Site Survey .................................................................................................................................................................................................... 18
3.3 Survey Findings ......................................................................................................................................................................................... 18
3.3.1 Beirut & Mount Lebanon Governorate ....................................................................................................................................... 18
3.3.2 Bekaa Region .............................................................................................................................................................................................. 19
3.3.3 North Region ............................................................................................................................................................................................... 20
3.3.4 South Region ............................................................................................................................................................................................... 21
3.3.5 Healthcare Centers ................................................................................................................................................................................. 21
3.3.6 Education Centers ................................................................................................................................................................................... 22
3.3.7 Other Institutions ..................................................................................................................................................................................... 24
3.3.8 General Findings ....................................................................................................................................................................................... 24
3.4 Data Validation & Analysis ................................................................................................................................................................ 25
4. Econometrics and Statistical Analysis 26
4.1 Introduction .................................................................................................................................................................................................. 26
4.2 Methodology ............................................................................................................................................................................................... 26
4.3 Determining the Seasonal Indices and Deseasonalized Loads for the Entire South Region ............ 27
4.4 Average Power Consumption per Family Based on EDL Data for the Entire South Region ................. 29
4.5 Analysis of Survey Data ....................................................................................................................................................................... 31
4.6 Validation of Estimates ........................................................................................................................................................................ 33
5. POWER CONSUMPTION CALCULATION 34
5.1 Demand Factor ........................................................................................................................................................................................... 34
5.2 Diversity Factor .......................................................................................................................................................................................... 34
5.3 Calculations and Scenarios ............................................................................................................................................................... 34
6. MAIN RESULTS 36
7. IMPLICATIONS OF THE SYRIAN CRISIS ON THE ELECTRICITY IN LEBANON 52
8. RECOMMENDATIONS AND PRIORITIZATION OF INTERVENTIONS 53
8. RECOMMENDATIONS AND PRIORITIZATION OF INTERVENTIONS ................................................................ 53
8.1 General Recommendations ............................................................................................................................................................... 53
8.2 Recommendations Specific to Water Pumping ................................................................................................................... 54
8.3 Recommendations Specific to Decentralized Power Generation ............................................................................ 55
8.4 Prioritization ................................................................................................................................................................................................. 57
ANNEXES
Annex 01 - UNHCR Data 59
Annex 02 - Survey Data 60
Annex 03 – Data Validation 61
Annex 04 – Econometric Analysis (Methodology) 62
Annex 05 – Power Consumption Calculation Methodology 63
Annex 06 – Diversity Factor (EDL MEMO) 64
Annex 07 - Total Power Consumption 65
Annex 08 - Total Energy Consumption 66
Annex 09 - Power Consumption per Caza 67
Annex 10 - Statistics and Econometrics Data 69
LIST OF REFERENCES 74

The Impact of the Syrian Crisis on the Lebanese Power Sector and Priority Recommendations8
LIST OF FIGURES
Figure 1: No. of the Displaced Syrians in Lebanon Registered with the UNHCR (Persons) - Historical Data 14
Figure 2: No. of the Displaced Syrians in Lebanon Registered with the UNHCR (Families) - Historical Data 15
Figure 3: No. of the Registered and Unregistered Displaced Syrians in Lebanon as per the UNHCR Figures (Persons) 16
Figure 4: No. of the Registered and Unregistered Displaced Syrians in Lebanon as per the UNHCR Figures (Families) 16
Figure 5: Geographic Distribution of the Displaced Syrians in Lebanon as of June 30, 2016 17
Figure 6: Distribution of the Displaced Syrians in Lebanon Living in Non IS and IS as of June 30, 2016 (Persons) 18
Figure 7: MV Feeders Quarterly Loads for the South Region 29
Figure 8: Quarterly Load for the South Region (Amp) 31
Figure 9: Distribution of Families as per Survey Data 32
Figure 10: Total Power Consumption (KW) of The Displaced Syrians in Lebanon - Scenario 1 37
Figure 11: Total Energy Consumption (KWH) of The Displaced Syrians in Lebanon - Scenario 1 37
Figure 12: Total Power Consumption (KW) of The Displaced Syrians in Lebanon - Scenario 2 39
Figure 13: Total Energy Consumption (KWH) of The Displaced Syrians in Lebanon - Scenario 2 39
Figure 14: Total Power Consumption (KW) of The Displaced Syrians in Lebanon - Scenario 3 40
Figure 15: Total Energy Consumption (KWH) of The Displaced Syrians in Lebanon - Scenario 3 40
Figure 16: Total Power Consumption (KW) of The Displaced Syrians in Lebanon - Scenario 4 41
Figure 17: Total Energy Consumption (KWH) of The Displaced Syrians in Lebanon - Scenario 4 41
Figure 18: Power Consumption of Displaced Syrians in Lebanon per Caza using UNHCR Data 43
Figure 19: Power Consumption (KW) per Caza using UNHCR Data - Beirut & ML Region 44
Figure 20: Power Consumption (KW) per Caza using UNHCR Data - Bekaa Region 44
Figure 21: Power Consumption (KW) per Caza using UNHCR Data - North Region 45
Figure 22: Power Consumption (KW) per Caza using UNHCR Data - South Region 45
Figure 23: Power Consumption of Displaced Syrians in Lebanon per Caza using DGGS Data 46
Figure 24: Power Consumption (KW) per Caza using DGGS Data - Beirut & ML Region 47
Figure 25: Power Consumption (KW) per Caza using DGGS Data - Bekaa Region 47
Figure 26: Power Consumption (KW) per Caza using DGGS Data - North Region 48
Figure 27: Power Consumption (KW) per Caza using DGGS Data - South Region 48
Figure 28: Power Consumption of Displaced Syrians in Lebanon using UNHCR Data including 15% for Technical Losses 50
Figure 29: Power Consumption of Displaced Syrians in Lebanon using DGGS Data including 15% for Technical Losses 51

Final Report 9
LIST of TabLeS
Table 1: Displaced Syrians in Lebanon Registered with UNHCR - Historical Data 14
Table 2: No. of the Registered and Unregistered Displaced Syrians in Lebanon as per the UNHCR Figures 15
Table 3: Geographic Distribution of the Displaced Syrians in Lebanon as of June 30, 2016 16
Table 4: No. of Displaced Syrians in Lebanon and No. of Survey Samples 18
Table 5: Survey Schedule 18
Table 6: Survey Data of Visited Displaced Syrian Shelter Units in Beirut & Mount Lebanon Governorate 19
Table 7: No. of Families per Shelter Unit of Displaced Syrians in Beirut & Mount Lebanon Governorate 19
Table 8: Survey Data of Visited Displaced Syrian Shelter Units in Bekaa Region 20
Table 9: No. of Families per Shelter Unit of Displaced Syrians in Bekaa Region 20
Table 10: Survey Data of Visited Displaced Syrian Shelter Units in North Region 20
Table 11: No. of Families per Shelter Unit of Displaced Syrians in North Region 21
Table 12: Survey Data of Visited Displaced Syrian Shelter Units in South Region 21
Table 13: No.of Families per Shelter Unit of Displaced Syrians in North Region 21
Table 14: No. of Schools Hosting Displaced Syrian Students in Each Region 22
Table 15: Indirect Additional Power Consumption of Public Schools Hosting Displaced Syrian Students as per Survey Data 23
Table 16: Indirect Additional Power Consumption of Municipalities as per Survey Data 24
Table 17: Sample of Survey Data Sheet 25
Table 18: Details of South Region 26
Table 19: South Region Quarterly Loads (Amp) 27
Table 20: South Region Quarterly Deseasonalized Loads (AMP) 29
Table 21: Average Peak Power Consumption per Family 30
Table 22: Distribution of Families as per Survey Data 31
Table 23: Cross-Tabulation of Families Residency Type vs. Region 31
Table 24: No. of Families per Shelter Unit 32
Table 25: No. of Persons per Shelter Unit 32
Table 26: Number of Persons per Family 33
Table 27: EDL Values of Diversity Factor (Inversed) 34
Table 28: Total Power Consumption (KW) and Energy Consumption of The Displaced Syrians in Lebanon - Scenario 1 36
Table 29: Total Power Consumption (KW) and Energy Consumption of The Displaced Syrians in Lebanon - Scenario 2 38
Table 30: Total Power Consumption (KW) and Energy Consumption of the Displaced Syrians in Lebanon - Scenario 3 39
Table 31: Total Power Consumption (KW) and Energy Consumption of The Displaced Syrians in Lebanon - Scenario 4 40
Table 32: Power Consumption of Displaced Syrians in Lebanon per Caza 42
Table 33: Power Consumption of Displaced Syrians in Lebanon using UNHCR Data including 15% for Technical Losses 49
Table 34: Power Consumption of Displaced Syrians in Lebanon using DGGS Data including 15% Technical Losses 50
Table 35: The Specific Recommendations as per the Power Consumption per Caza 56
Table 36: Number of Displaced Syrian Families, Persons, and Shelter units in Lebanon as of June 30, 2016 63

The Impact of the Syrian Crisis on the Lebanese Power Sector and Priority Recommendations10
1. EXECUTIVE SUMMARY
Prior to the onset of the Syrian crisis, Lebanon was, and still is, suffering from serious and persistent issues in its energy sector. The limited generation capacities and the increasing demand impede Électricité du Liban (EDL), the national utility, from meeting the country’s electricity demand. The gap between EDL’s electricity production and total electricity consumption increases every year. Ageing power plants in Lebanon operate below their rated capacity. This results in power outages of at least three hours per day in Beirut and up to twelve hours outside of Beirut. EDL generates about 61% of the electricity consumption. Efforts have been made to improve the situation through the rehabilitation of some generation plants and through rented generation barges that increased the generation capacity by about 440 MW. However, power outages remained the same across the country because additional capacities are equated by an almost similar demand by the displaced Syrians.
The Ministry of Energy and Water (MoEW), in partnership with the United Nations Development Programme (UNDP) and with funding from the Kingdom of the Netherlands, initiated a project to study the additional power consumption as a result of the displaced Syrians in Lebanon. This report quantifies the power consumption of the displaced Syrians in Lebanon, assesses their direct and indirect impact on the electricity sector in Lebanon, and recommends interventions that are in line with the government’s Policy Paper, Lebanon Crisis Response Plan (LCRP) and Lebanon’s Intended Nationally Determined Contribution (INDC). The data produced in this report was also used to prepare the Energy Sector of the LCRP 2017 – 2020.
The power consumption of the displaced Syrians in Lebanon is calculated using two pathways. The first is based on the UNHCR figures as of June 30, 2016, which amounts to 1,032,589 registered persons. The second is based on Directorate General of General Security (DGGS) figures which estimate the official number of displaced Syrians in Lebanon at 1,500,000 persons. The recommendations and interventions presented in this report have been identified based on data made available by governmental authorities such as MoEW and EDL, as well as data gathered from an official survey of the displaced Syrians communities across all regions in Lebanon, and best practices in other countries with similar profiles. The recommendations and interventions were based on discussions with key representatives and were subsequently classified into short-, medium-, and long-term priorities.
Electricity demand of the displaced Syrians in Lebanon should be looked at primarily as a humanitarian need that affects the well-being of the individuals and the proper operation of other humanitarian sectors, in addition to its impact on the overall economy and electricity sectors. Similar to the Lebanese, most displaced Syrians in Lebanon, whether living in Non Informal Settlements (Non IS) or in Informal Settlements (IS), are not obtaining the minimum required electricity to operate basic household appliances due to insufficient generation capacities and overloaded transmission and distribution networks.
The assessment calculates that the additional direct and indirect power generation needed to cater for the demand of the displaced Syrian amounts to approximately 486 MW. This impact has major implications on the EDL network, and action has to be taken to alleviate its impact. Rehabilitation of the ageing power plants and construction of new power plants, underway by MoEW, are not sufficient nor quick enough to cover the rapidly increasing electricity demand. In 2010, Lebanon put forward a target for the energy sector by committing to 12% renewable energy use by 2020 (Climate Change, 2016), but Lebanon is still far from meeting this target. Therefore, recommendations and priorities are given to renewable energy to increase generated capacity and to participate in achieving ensure that 12% of total supply comes from renewable energy sources.

Final Report 11
The short-term priority includes encouraging the use of energy saving bulbs and solar water heaters in the residential sector to reduce power demand on EDL’s network.
The medium-term priorities comprise interventions that would require a period of at least five years to complete. Decentralized solutions such as Distributed Generation Resources (DER), or Distributed Energy, is recommended for areas of medium power demand (up to 10 MW) such as Hermel, Rachaya, and West Bekaa. Street lighting retrofit is another medium-term recommendation; high (or low) pressure sodium lamps (SHP) can be changed for LED fixtures, with dimming of lighting in times of low night traffic.
Other recommendations and interventions vary from using solar kits with a small rated capacity (up to 2.5 KW) in areas where households are considered “vulnerable” or where the EDL grid does not exist, to centralized solutions such as grid-tied PV plants or Wind Turbines. To further encourage the use of renewable energy, it is recommended to support the agricultural sector and water establishments to use renewable energy technology for irrigation and water distribution, respectively. This can be done by using PV-Direct Water Pumping technology.
To upgrade and rehabilitate the distribution network so that it accommodates the additional load and hence improve the quality of the electricity supplied, installation of new medium voltage/low voltage (MV/LV) substations and/or upgrade of the existing MV/LV substations is required. This solution requires the reinforcement of EDL’s distribution network as well as the rehabilitation and upgrading of the transmission network through upgrading the transmission capacity of the high voltage/medium voltage (HV/MV) substations and by reinforcing the overhead transmission lines (OHTL).

The Impact of the Syrian Crisis on the Lebanese Power Sector and Priority Recommendations12
2. BACKGROUND
The United Nations Development Programme, initiated the “Lebanon-Support to Economic Recovery, Community Security and Social Cohesion in Lebanese Communities Affected by the Syrian Project: Renewable Energy Project” funded by the Netherlands Ministry for Foreign Trade and Development Cooperation, in partnership with the Ministry of Energy and Water. A private energy services company, Advanced Engineering Management Services (AEMS) S.A.L., was hired to conduct a detailed assessment during 2016 of the actual impacts and implications of the current Syrian refugee crisis on the Lebanese electricity sector. The aim of this assessment is to better align international assistance with the Lebanese Government and the Ministry of Energy and Water’s programmes and plans.
Since the beginning of the Syrian crisis on March 15, 2011, the number of Syrian displaced persons have fluctuated, the highest number recorded being 1,174,830 persons (287,321 families) on June 30, 2015 (UNHCR, 2015). For almost four years, the Government of Lebanon (GoL) adopted an “Open Border Policy” allowing displaced Syrians to settle freely across the country until January 2015 when it took a firm decision to close its borders. As of June 30, 2016, the number of displaced Syrians registered with the UNHCR was 1,032,589 persons (247,454 Families) dispersed across 1,298 villages in Lebanon, while the official number of displaced Syrians in Lebanon adopted by GoL and issued by the Directorate General of General Security (DGGS) is 1,500,000 persons. Although most of the displaced Syrians are living in rented accommodations or hosted within the Lebanese communities, there are 4,231 Informal Settlements comprising 223,965 individuals living in 39,856 tents spread out across 344 villages in Lebanon where the majority have settled in the Bekaa and North regions (UNHCR, 2016).
The Syrian crisis has impacted many sectors in Lebanon, not least of which is the electricity sector. Therefore, it was deemed necessary to conduct a study to measure and quantify the power consumption of displaced Syrians in Lebanon and assess its implications on the electricity sector, which is already facing chronic issues in meeting the continuously increasing power demand.
The current situation is, however, receiving substantial attention from the international community to assist Lebanon in its ability to cater for the large number of displaced Syrians and at the same time to ensure that its own population is not negatively impacted. However, to ensure that scarce resources are used effectively, this assessment aims to align the assistance of the international community where it is most needed and in line with the energy policies of the Government of Lebanon.

Final Report 13
3. PROJECT DESCRIPTION AND METHODOLOGY
The project initiated by the MoEW and the UNDP explores the implications of the current Syrian crisis on the electricity sector in Lebanon through sample surveys, it then provides and prioritizes interventions. The study aims to accurately assess the impacts on electricity use, in terms of time-of use, additional quantity of use, and regional variations in use, of the displaced Syrians in Lebanon. The assessment is anticipated to prioritize interventions and actions required to meet the additional electricity demand in Lebanon from the Syrian crisis while ensuring that these interventions are technically, financially, and environmentally sustainable.
The project is divided into different methodology tracks allowing for data validation and cross check:
• Data gathering
• Site survey
• Data validation and analysis
• Power and energy calculation
• Recommendations and prioritization of interventions
3.1 Data Gathering
A review of the latest reports/publications and literature on the electricity and energy sector in Lebanon has been carried out, including but not limited to studies such as the Ministry of Energy and Water’s Policy Paper for Electricity (2010) as well as the National Energy Efficiency Action Plan for Lebanon (NEEAP 2016 – 2020) and the National Renewable Energy Action Plan for Lebanon (NREAP 2016 – 2020), the World Bank Economic and Social Impact of the Syrian Crisis (2013), the GoL’s Lebanon Crisis Response Plan (2016 and 2017 - 2020), Ministry of Environment/EU/ UNDP Environmental Assessment of the Syrian Crisis on Lebanon (2014 and update of 2015). Data gathering also included interviews of key stakeholders, the Ministry of Energy and Water (MOEW), Ministry of Social Affairs (MOSA), UNHCR, Ministry of Public Health (MOPH), Ministry of Education and Higher Education (MEHE), and Electricity du Lebanon (EDL), to gather additional information on the sector.
Data gathered from the UNHCR in the form of published lists of the “Number of Syrian Refugee Families and Individuals per Cadastral in Lebanon” and number of displaced Syrians living in Informal Settlements (available in Annex 01), have been used in the power consumption calculation as shown in section 4.3 Data Analysis.
As of June 30, 2016, the number of displaced Syrians registered with the UNHCR was 1,032,589 persons (247,454 Families) dispersed across 1,298 villages in Lebanon (UNHCR by CAS, 2016). Table 1 and Figures 1, 2 below illustrate the number of displaced Syrians in Lebanon at different intervals and the geographic distribution across all regions in Lebanon.

The Impact of the Syrian Crisis on the Lebanese Power Sector and Priority Recommendations14
No. of the Displaced Syrians in Lebanon Registered with the UNHCR
Region CategoryJuly 19, 2013
December 31, 2013
December 31, 2014
June 30, 2015
December 30, 2015
March 31, 2016
June 30, 2016
Beirut & MLPerson 99,212 176,196 304,771 343,923 311,098 305,687 298,487
Family 23,460 45,864 79,332 91,469 82,425 80,617 77,329
NorthPerson 180,489 233,666 345,908 412,200 371,809 365,555 363,297
Family 37,601 60,824 90,040 93,802 98,511 96,405 81,558
BekaaPerson 185,513 236,448 283,677 280,691 260,932 256,126 252,219
Family 45,724 61,548 73,842 71,258 65,406 64,037 62,110
SouthPerson 67,770 96,197 135,646 138,016 125,272 120,907 118,586
Family 15,120 21,462 30,263 30,792 27,949 26,975 26,457
TotalPerson 532,984 742,507 1,070,002 1,174,830 1,069,111 1,048,275 1,032,589
Family 121,905 189,697 273,477 287,321 274,291 268,034 247,454
Table 1: Displaced Syrians in Lebanon Registered with UNHCR - Historical Data
532,984
742,507
1,070,002 1,174,830
1,069,111 1,048,275 1,032,589
0
200,000
400,000
600,000
800,000
1,000,000
1,200,000
1,400,000
19-Jul-13 31-Dec-13 31-Dec-14 30-Jun-15 30-Dec-15 31-Mar-16 30-Jun-16
Beirut & ML North Bekaa South Total
Figure 1: No. of the Displaced Syrians in Lebanon Registered with the UNHCR (Persons) - Historical Data
121,905
189,697
273,477 287,321 274,291 268,034
247,454
0
50000
100000
150000
200000
250000
300000
July 19, 2013 December 31, 2013
December 31, 2014
June 30, 2015 December 30, 2015
March 31, 2016 June 30, 2016
Beirut & ML Bekaa North South Total
Figure 2: No. of the Displaced Syrians in Lebanon Registered with the UNHCR (Families) - Historical Data
No. of the Displaced Syrians in Lebanon Registered with the UNHCR as of June 30, 2016
(Families)
No. of the Displaced Syrians in Lebanon Registered with the UNHCR as of June 30, 2016
(Persons)
Final Report 15
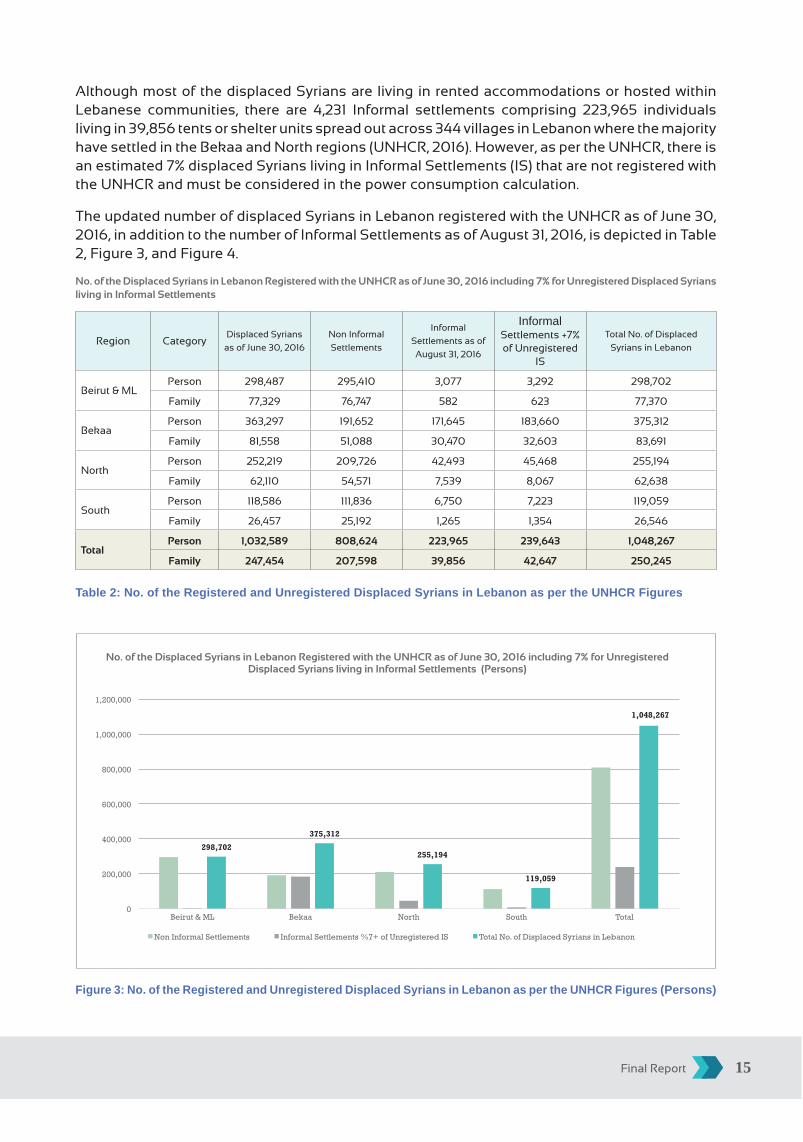
Although most of the displaced Syrians are living in rented accommodations or hosted within Lebanese communities, there are 4,231 Informal settlements comprising 223,965 individuals living in 39,856 tents or shelter units spread out across 344 villages in Lebanon where the majority have settled in the Bekaa and North regions (UNHCR, 2016). However, as per the UNHCR, there is an estimated 7% displaced Syrians living in Informal Settlements (IS) that are not registered with the UNHCR and must be considered in the power consumption calculation.
The updated number of displaced Syrians in Lebanon registered with the UNHCR as of June 30, 2016, in addition to the number of Informal Settlements as of August 31, 2016, is depicted in Table 2, Figure 3, and Figure 4.
No. of the Displaced Syrians in Lebanon Registered with the UNHCR as of June 30, 2016 including 7% for Unregistered Displaced Syrians living in Informal Settlements
Region CategoryDisplaced Syrians
as of June 30, 2016
Non Informal
Settlements
Informal
Settlements as of
August 31, 2016
Informal Settlements +7% of Unregistered
IS
Total No. of Displaced
Syrians in Lebanon
Beirut & MLPerson 298,487 295,410 3,077 3,292 298,702
Family 77,329 76,747 582 623 77,370
BekaaPerson 363,297 191,652 171,645 183,660 375,312
Family 81,558 51,088 30,470 32,603 83,691
NorthPerson 252,219 209,726 42,493 45,468 255,194
Family 62,110 54,571 7,539 8,067 62,638
SouthPerson 118,586 111,836 6,750 7,223 119,059
Family 26,457 25,192 1,265 1,354 26,546
TotalPerson 1,032,589 808,624 223,965 239,643 1,048,267
Family 247,454 207,598 39,856 42,647 250,245
Table 2: No. of the Registered and Unregistered Displaced Syrians in Lebanon as per the UNHCR Figures
298,702
375,312
255,194
119,059
1,048,267
0
200,000
400,000
600,000
800,000
1,000,000
1,200,000
Beirut & ML Bekaa North South Total
Non Informal Settlements Informal Settlements %7+ of Unregistered IS Total No. of Displaced Syrians in Lebanon
Figure 3: No. of the Registered and Unregistered Displaced Syrians in Lebanon as per the UNHCR Figures (Persons)
No. of the Displaced Syrians in Lebanon Registered with the UNHCR as of June 30, 2016 including 7% for Unregistered Displaced Syrians living in Informal Settlements (Persons)

The Impact of the Syrian Crisis on the Lebanese Power Sector and Priority Recommendations16
77,370 83,691
62,638
26,546
250,245
0
50,000
100,000
150,000
200,000
250,000
300,000
Beirut & ML Bekaa North South Total
Non Informal Settlements Informal Settlements %7+ of Unregistered IS Total No. of Displaced Syrians in Lebanon
Figure 4: No. of the Registered and Unregistered Displaced Syrians in Lebanon as per the UNHCR Figures (Families)
As per the UNHCR data, the majority of displaced Syrians are living in Beirut, Mount Lebanon, and Bekaa regions. Based on definitions adopted by the UNHCR, displaced Syrians living in Non Informal Settlements refer to those in rented accommodations or hosted within the Lebanese communities, which make up around 78% of the displaced Syrian population, while the remaining 22% live in Informal Settlements. Table 3, Figure 5, and Figure 6 below represent the geographic distribution of the displaced Syrians in Lebanon as of June 30, 2016 including the 7% of unregistered displaced Syrians living in IS shelters.
Geographic Distribution of the Displaced Syrians in Lebanon Registered and Unregistered with the UNHCR
Region CategoryNo. of Non
Informal Settlements
% of Non IS
from Total No.
of Displaced
Syrians
No. of Informal
Settlements
% of IS from
Total No. of
Displaced
Syrians
Total No. of
Displaced
Syrians
% of Non IS
from Total No.
of Displaced
Syrians
Beirut &
ML
Person 295,410 28.18% 3,292 0.31% 298,702 28.49%
Family 76,747 30.67% 623 0.25% 77,370 30.92%
BekaaPerson 191,652 18.28% 183,660 17.52% 375,312 35.80%
Family 51,088 20.42% 32,603 13.03% 83,691 33.44%
NorthPerson 209,726 20.01% 45,468 4.34% 255,194 24.34%
Family 54,571 21.81% 8,067 3.22% 62,638 25.03%
SouthPerson 111,836 10.67% 7,223 0.69% 119,059 11.36%
Family 25,192 10.07% 1,354 0.54% 26,546 10.61%
TotalPerson 808,624 77.14% 239,643 22.86% 1,048,267 100.00%
Family 207,598 82.96% 42,647 17.04% 250,245 100.00%
Table 3: Geographic Distribution of the Displaced Syrians in Lebanon as of June 30, 2016
No. of the Displaced Syrians in Lebanon Registered with the UNHCR as of June 30, 2016 including 7% for Unregistered Displaced Syrians living in Informal Settlements (Families)

Final Report 17
Figure 5: Geographic Distribution of the Displaced Syrians in Lebanon as of June 30, 2016
295,410
191,652 209,726
111,836
298,702
375,312
255,194
119,059
-
50,000
100,000
150,000
200,000
250,000
300,000
350,000
400,000
Beirut & ML Bekaa North South
No. of Non Informal Settlements No. of Informal Settlements Total No. of Displaced Syrians
Figure 6: Distribution of the Displaced Syrians in Lebanon Living in Non IS and IS as of June 30, 2016 (Persons)
EDL data is provided by the three Distribution Service Provider (DSP’s): BUTEC Utility Service (BUS) covers Antelias area and North region, K&A Joint Venture (KVA) covers part of Beirut and Bekaa region, and National Electrical Utility Company (NEUC) covers part of Beirut, Mount Lebanon, and the South. Data collection proved to be challenging, as it was either incomplete (mainly missing GIS data which prevents cross referencing feeders and geographical locations) or rather general containing only annual peak loads (hence no insight as to detailed seasonal or time changes in demand).
Distribution of Diplaced Syrians in Lebanon Living in Non IS and IS as of June 30, 2016 (Persons)
Geographic Distribution of the Displaced Syrians in Lebanon Registered and Unregistered with the UNHCR as of June 30 2016 (Persons)
Beirut & ML
Bekaa
North
South
28.49%
298,702
119,059
375,312
255,194
11.36%
35.80%
24.34%

The Impact of the Syrian Crisis on the Lebanese Power Sector and Priority Recommendations18
3.2 Site Survey
From the information collected, a representative survey to 340 Syrian families and 60 institutions across the country was undertaken in July 2016 to quantify the direct and indirect electricity consumption of the displaced Syrians in Lebanon. As of June 30, 2016, displaced Syrians registered with the UNHCR amounted to 1,032,589 persons spread across 247,454 families and dispersed in 1,298 villages. Survey samples were selected based on the number of registered displaced Syrians in each village in different regions as well as the shelter type (Non IS or IS) to calculate the power consumption of each shelter type as shown in Tables 4 and 5 below.
Region Population % of Total No. of Samples
Beirut & ML 298,487 28.91% 110
Bekaa 363,297 35.18% 100
North 252,219 24.43% 80
South 118,586 11.48% 60
Institution Type Expected Sample Size
Health-care 20
Education 20
Other 20
Table 4: No. of Displaced Syrians in Lebanon and No. of Survey Samples
Area Start Date End Date Duration No. of Teams No. of Samples
Beirut & ML 7/20/16 8/20/16 28 2 110
Bekaa 7/18/16 8/17/16 27 2 100
North 7/11/16 8/10/16 27 2 80
South 7/12/16 8/18/16 33 2 60
Health-Care 7/11/16 8/12/16 1 20
Education 6/30/16 8/16/16 1 20
Others 7/11/16 8/24/16 1 20
Total 410
Table 5: Survey Schedule
Different Survey Forms were developed for each type of institution type to gather the required information. Mainly power consumption was assessed in hospitals, schools, and other institutions such as municipalities and by displaced Syrians themselves.
3.3 Survey Findings
3.3.1 Beirut & Mount Lebanon Governorate
There are 295,410 persons (76,747 families) living in Non IS shelter and 3,292 persons (623 families) living in IS. 110 samples were surveyed in different areas such as Achrafieh, Ain El Mraissy, Mazraa, Naameh, and Choueifat to verify the power consumption of different shelter types in different areas.

Final Report 19
In general, about 86% of the visited samples have one family per shelter unit, 10% have two families per shelter unit, and 4% have three or more families per shelter unit. With regards to power connection, the majority of the displaced Syrians have Non-Metered power connections. Power consumption for Non IS shelter unit is almost the same for all visited samples irrespective of the number of persons or number of families living in each shelter unit. The same applies to displaced Syrians living in IS. The average connected load of household appliances was calculated to be 2.777 KW per shelter unit for Non IS samples and 0.661 KW per shelter unit for IS samples. Tables 6 and 7 below summarize the survey findings of the visited samples in Beirut & Mount Lebanon.
UNHCR Data Survey Data Calculated Data
Shelter Type
No. of Persons
No. of Families
No. of Visited
Shelters
Total No. of Units
in Visited Shelters
Total No. of Persons in Visited
Shelter Units
Total No. of
Families in Visited
Shelter Units
Total Connected
Load of Household Appliances of Visited
Shelter Units (kW)
Average No. of Supply Hours/
Day
Average Connected
Load of Household
Appliances/ Shelter Unit
(kW)
Average Power
Consumption per Shelter Unit (kW)
Non IS 295,410 76,747 83 148 428 91 230.450 8 2.777 1.388
IS 3,292 623 27 85 185 38 17.850 6 0.661 0.661
Total 298,702 77,370 110 233 613 129 248.300
Table 6: Survey Data of Visited Displaced Syrian Shelter Units in Beirut & Mount Lebanon Governorate
Shelter
Type
UNHCR Data Survey Data
No. of
Persons
No. of
Families
No. of Visited
Shelters
Total No.
of Units
in Visited
Shelters
One Family/
Shelter Unit
Two
Families/
Shelter Unit
Three
Families/
Shelter Unit
Four
Families/
Shelter Unit
Five
Families/
Shelter
Unit
Non IS 295,410 76,747 83 148 77 4 2 0 0
IS 3,292 623 27 85 18 7 2 0 0
Total 298,702 77,370 110 233 95 11 4 0 0
% of Visited Samples 86.36% 10.00% 3.64% 0.00% 0.00%
Table 7: No. of Families per Shelter Unit of Displaced Syrians in Beirut & Mount Lebanon Governorate
3.3.2 Bekaa Region
The majority of displaced Syrians in Lebanon (35.80%) had settled in the Bekaa region of which 51% (191,652 persons/ 51,088 families) are living in rented accommodations (Non IS) while the remaining 49% (183,660 persons or 32,603 families) are living in IS.
As per the survey data, the majority of the displaced Syrians have one family per shelter unit. The average supply hours per day in the Bekaa region is the highest among all regions (15 hours per day) due to the fact that almost 43% of the displaced Syrians in the Bekaa live in Zahle and have 24 hours of power supply per day. Additional information of displaced Syrians in the Bekaa region is illustrated in the Tables 8 and 9 below.

The Impact of the Syrian Crisis on the Lebanese Power Sector and Priority Recommendations20
UNHCR Data Survey Data Calculated Data
Shelter
Type
No. of
Persons
No. of
Families
No. of
Visited
Shelters
Total
No. of
Units in
Visited
Shelters
Total No.
of Persons
in Visited
Shelter
Units
Total
No. of
Families
in
Visited
Shelter
Units
Total
Connected
Load of
Household
Appliances
of Visited
Shelter
Units (kW)
Average
No. of
Supply
Hours/
Day
Average
Connected
Load of
Household
Appliances/
Shelter Unit
(kW)
Average
Power
Consumption
per Shelter
Unit (kW)
Non IS 191,652 51,088 38 130 226 58 78.750 12 2.072 1.036
IS 183,660 32,603 62 1,002 484 72 68.150 15 1.099 1.099
Total 375,312 83,691 100 1,132 710 130 146.900
Table 8: Survey Data of Visited Displaced Syrian Shelter Units in Bekaa Region
Shelter Type
UNHCR Data Survey Data
No. of
Persons
No. of
Families
No. of Visited
Shelters
Total No.
of Units
in Visited
Shelters
One Family/
Shelter Unit
Two
Families/
Shelter Unit
Three
Families/
Shelter
Unit
Four
Families/
Shelter
Unit
Five
Families/
Shelter
Unit
Non IS 191,652 51,088 39 130 26 7 3 1 1
IS 183,660 32,603 61 1,002 53 8 1 0 0
Total 375,312 83,691 100 1,132 79 15 4 1 1
% of Visited Samples 79.00% 15.00% 4.00% 1.00% 1.00%
Table 9: No. of Families per Shelter Unit of Displaced Syrians in Bekaa Region
3.3.3 North Region
Although the majority of the displaced Syrians in the Akkar and North regions are living in rented accommodations (Non IS) or hosted within the Lebanese communities; the average power consumption per shelter unit for Non IS turned out to be the lowest among other regions due to the fact that most of the displaced Syrians living in Non IS shelters have the same living conditions of those living in IS shelters. Detailed information of displaced Syrians in the Northern region is depicted in Tables 10 and 11 below.
UNHCR Data Survey Data Calculated Data
Shelter
Type
No. of
Persons
No. of
Families
No. of
Visited
Shelters
Total No.
of Units
in Visited
Shelters
Total No.
of Persons
in Visited
Shelter
Units
Total
No. of
Families
in
Visited
Shelter
Units
Total
Connected
Load of
Household
Appliances
of Visited
Shelter
Units (kW)
Average
No. of
Supply
Hours/
Day
Average
Connected
Load of
Household
Appliances/
Shelter Unit
(kW)
Average
Power
Consumption
per Shelter
Unit (kW)
Non IS 209,726 54,571 56 580 427 76 106.850 9 1.908 0.954
IS 45,468 8,067 24 623 169 37 18.400 8 0.767 0.767
Total 255,194 62,638 80 1,203 596 113 125.250
Table 10: Survey Data of Visited Displaced Syrian Shelter Units in North Region
Final Report 21
Shelter
Type
UNHCR Data Survey Data
No. of
Persons
No. of
Families
No. of
Visited
Shelters
Total No.
of Units
in Visited
Shelters
One Family/
Shelter Unit
Two
Families/
Shelter Unit
Three
Families/
Shelter Unit
Four
Families/
Shelter Unit
Five
Families/
Shelter
Unit
Non IS 209,726 54,571 56 580 46 3 4 3 0
IS 45,468 8,067 24 623 19 2 1 0 2
Total 255,194 62,638 80 1,203 65 5 5 3 2
% of Visited Samples 81.25% 6.25% 6.25% 3.75% 2.50%
Table 11: No. of Families per Shelter Unit of Displaced Syrians in North Region
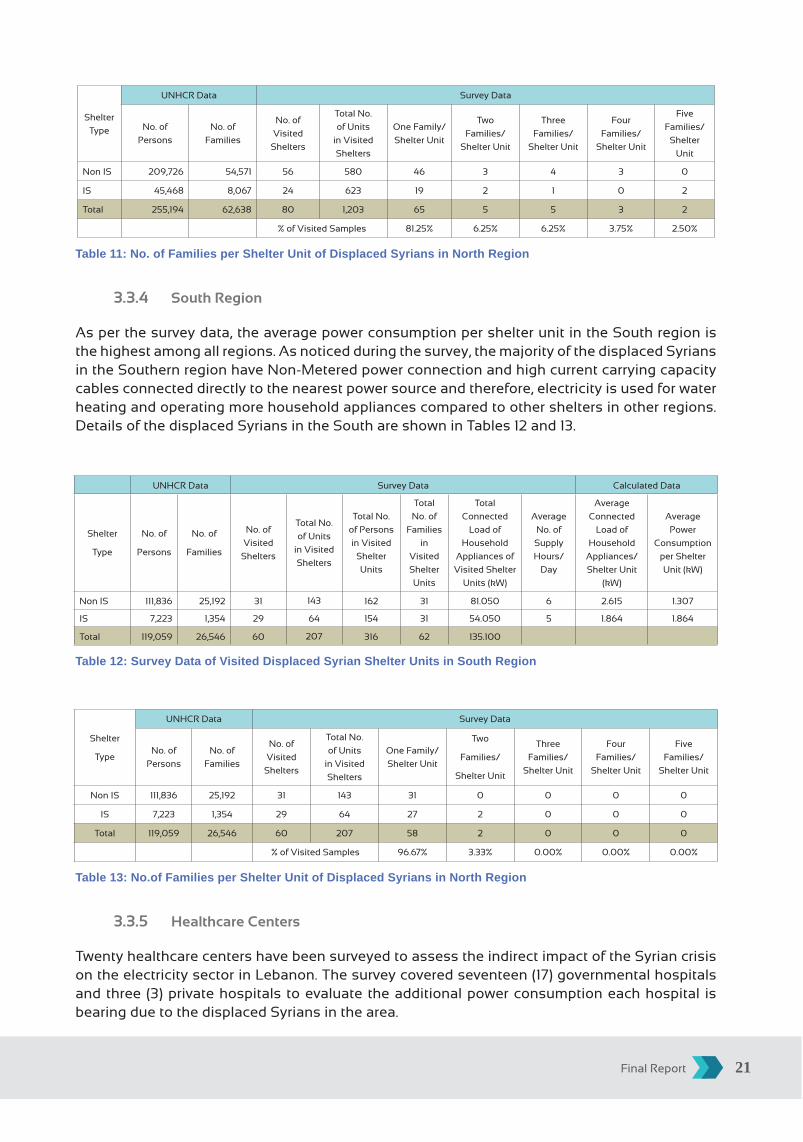
3.3.4 South Region
As per the survey data, the average power consumption per shelter unit in the South region is the highest among all regions. As noticed during the survey, the majority of the displaced Syrians in the Southern region have Non-Metered power connection and high current carrying capacity cables connected directly to the nearest power source and therefore, electricity is used for water heating and operating more household appliances compared to other shelters in other regions. Details of the displaced Syrians in the South are shown in Tables 12 and 13.
UNHCR Data Survey Data Calculated Data
Shelter
Type
No. of
Persons
No. of
Families
No. of
Visited
Shelters
Total No.
of Units
in Visited
Shelters
Total No.
of Persons
in Visited
Shelter
Units
Total
No. of
Families
in
Visited
Shelter
Units
Total
Connected
Load of
Household
Appliances of
Visited Shelter
Units (kW)
Average
No. of
Supply
Hours/
Day
Average
Connected
Load of
Household
Appliances/
Shelter Unit
(kW)
Average
Power
Consumption
per Shelter
Unit (kW)
Non IS 111,836 25,192 31 143 162 31 81.050 6 2.615 1.307
IS 7,223 1,354 29 64 154 31 54.050 5 1.864 1.864
Total 119,059 26,546 60 207 316 62 135.100
Table 12: Survey Data of Visited Displaced Syrian Shelter Units in South Region
Shelter
Type
UNHCR Data Survey Data
No. of
Persons
No. of
Families
No. of
Visited
Shelters
Total No.
of Units
in Visited
Shelters
One Family/
Shelter Unit
Two
Families/
Shelter Unit
Three
Families/
Shelter Unit
Four
Families/
Shelter Unit
Five
Families/
Shelter Unit
Non IS 111,836 25,192 31 143 31 0 0 0 0
IS 7,223 1,354 29 64 27 2 0 0 0
Total 119,059 26,546 60 207 58 2 0 0 0
% of Visited Samples 96.67% 3.33% 0.00% 0.00% 0.00%
Table 13: No.of Families per Shelter Unit of Displaced Syrians in North Region
3.3.5 Healthcare Centers
Twenty healthcare centers have been surveyed to assess the indirect impact of the Syrian crisis on the electricity sector in Lebanon. The survey covered seventeen (17) governmental hospitals and three (3) private hospitals to evaluate the additional power consumption each hospital is bearing due to the displaced Syrians in the area.

The Impact of the Syrian Crisis on the Lebanese Power Sector and Priority Recommendations22
As expected, there is no quantitative impact on the electricity bill of the hospitals because most hospitals already operate 24 hours at full capacity. However, there is a qualitative impact resulting from the additional power consumption of the displaced Syrians in the areas close to the supply points of the respective hospitals. The impact is in the form of overloading of the distribution network. This results in poor power quality and voltage drop (180V - 190V) in many areas, and therefore hospitals are forced to run on diesel generators even during power supply hours because most office machines and appliances do not function when the voltage levels are low. Additional information of hospitals survey is available in Annex 02 - Survey Data.
3.3.6 Education Centers
As per information provided by the Ministry of Education and Higher Education (MEHE), there are 238 public schools in Lebanon hosting 85,487 displaced Syrian students across all regions. Details of schools and number of students are given in Table 14 below.
Area No. of Schools No. of Students
Beirut & ML 71 28,776
Bekaa 59 22,704
North 68 20,783
South 40 13,224
Total 238 85,487
Table 14: No. of Schools Hosting Displaced Syrian Students in Each Region
Schools normally work six hours a day but schools that are hosting displaced Syrian students are working an additional four-hour shift. This in turn increased both electricity and fuel oil bills of the schools. Moreover, due to the poor power quality and high voltage drop in some areas as a result of the overloaded MV feeders or MV/LV substations, some schools operate on diesel generators even during power supply hours because office machines do not function when voltage levels are low. Additional information of schools survey is available in Annex 02 - Survey Data.
The additional four-hour shift constitutes the indirect impact of displaced Syrian students on the power consumption of hosting schools. The power consumption of each school was calculated from their respective electricity bills based on 22 working days per month. The additional four-hour shift is evaluated for the calculation of the indirect impact of the displaced Syrian students on the hosting schools’ energy consumption as detailed in Table 15. The collected data show a total increase of 10,895KWh in energy consumption as indirect impact of the displaced Syrians, almost 50% of which is in Beirut and Mount Lebanon.

Final Report 23
Survey Data Calculated Data
Reg
ion
Sch
oo
l Nam
e
En
ergy
Co
nsu
mp
tion
(K
WH
) as per
Electricity B
ill
No
. of M
on
ths
En
ergy
Co
nsu
mp
tion
per
Mo
nth
(KW
H/
Mo
nth
)
En
ergy
Co
nsu
mp
tion
per
Day (K
WH
/Day)
No
. of S
up
ply H
ou
rs p
er Day
No
. of W
ork
ing
H
ou
rs per D
ay
No
. of W
ork
ing
H
ou
rs per D
ay on
E
DL
Su
pp
ly
Averag
e Po
wer
Co
nsu
mp
tion
of
Sch
oo
l (KW
)
Averag
e Po
wer
Co
nsu
mp
tion
per
Sch
oo
l (K
W)
No
. o
f Sch
oo
ls
Total P
ow
er C
on
sum
ptio
n (K
W)
Ad
ditio
nal E
nerg
y C
on
sum
ptio
n o
f the
4 H
ou
r Sh
ift (KW
H)
Beiru
t & M
L
Omar
Fakhoury27,618 4 6,905 314 12 10 10 31.384
20.112 71 1,428 5,712
Ibtihaj Kadora 7,779 4 1,945 88 12 10 10 8.840
Bek
aa
Bar Elias 1,412 1 1,412 64 24 10 10 6.418
9.185 59 542 2,168Qob Elias 1,134 2 567 26 8 10 6 4.295
Salim Haidar 4,446 2 2,223 101 8 10 6 16.841
No
rth
Al Tarbyah Al
Hadiyha3,595 3 1,198 54 8 10 6 9.078
7.381 68 502 2,008
Solaiman Al
Bostani2,222 3 741 34 8 10 6 5.611
Motawasetat
Al Baddawi4,540 2 2,270 103 8 10 6 17.197
Al Fadilah 1,516 3 505 23 8 10 6 3.828
Dahr Al Ain 472 3 157 7 8 10 6 1.192
So
uth
Zibdine
Intermediate432 1 432 20 6 10 6 3.273
6.301 40 252 1,008
Masaken Al
Shaabieh2,463 2 1,232 56 6 10 6 9.330
Total 238 2,724 10,895
1. The number of working days is 22 days per month
2. Average power consumption per school is calculated on the No. of EDL supply hours the school benefits from
3. Omar Fakhoury School, Ibtihaj Kadora School, and two other schools have the same electricity bill
4. The share of Omar Fakhoury School is 54.2% of the total bill (50,956 KWH for four months)
Table 15: Indirect Additional Power Consumption of Public Schools Hosting Displaced Syrian Students as per Survey Data

The Impact of the Syrian Crisis on the Lebanese Power Sector and Priority Recommendations24
3.3.7 Other Institutions
The other institutions covered in the survey were municipalities in different regions. Some municipalities have updated records of the displaced Syrians in the area, where in some areas, the municipalities’ actual reported numbers of displaced Syrians is much higher than the figure given by the UNHCR.
According to some municipalities, the electricity bill increased because water pumps are running for longer hours to cover the additional water consumption caused by the displaced Syrians in the area (pumps and systems, 2016 and Washington State University, 2016). Although legally, the Regional Water Establishments and the Ministry of Energy and Water are responsible for the supply of domestic water, for the purpose of this study, municipalities were surveyed as a means to shed light on the issue.
Furthermore, some municipalities had to install streetlights near displaced Syrian shelters for security reasons. The additional working hours of water pumps as well as the new street lights represent the indirect impact on the power consumption resulting from the displaced Syrians in each area. Assuming that the operation of water pumps has increased by 50%, the estimated indirect power consumption of is calculated in Table 16 below.
No. of Villages
Hosting
Displaced
Syrians
Assumed No. of
Municipalities
using Water
Pumps for
Additional Hours
Average Rated
Capacity per
Water Pump
(HP)
Average Rated
Capacity per
Water Pump
(KW)
Average Rated
Capacity per
Water Pump at
75% Efficiency
(KW)
Additional Power Consumption of
Municipalities (KW)
1,298 649 100 74.57 55.9275 36,297
Table 16: Indirect Additional Power Consumption of Municipalities as per Survey Data
The other concern of some municipalities is the frequently burnt out distribution transformers due to the over-load, the low power quality, and voltage drop caused by the additional power consumption of the displaced Syrians that forces the municipality to operate the water pumps and other service machinery on diesel generator.
3.3.8 General Findings
• Power consumption of IS and Non IS shelters is independent of the number of persons or number of families living in each shelter unit.
• In most areas, people are complaining about voltage drop that prevents them from operating most of the household appliances.
• Most of the visited shelters do not have a fridge or a washing machine because they cannot use it due to the limited power capacity (1A to 1.5A per shelter unit).
• Schools hosting displaced Syrian students have an indirect impact on the power consumption resulting from the additional four-hour shift the schools are providing. This additional power requirement is estimated at around 10 MW as shown in table 15.
• Other institutions have shown increase in indirect power consumption as a result of the longer operating hours of water pumping to cover the additional water demand of the displaced Syrians. This is estimated at 36 MW as indicated in table 16.
Details of the UNHCR data are available in Annex 02 - Survey Data.

Final Report 25
3.4 Data Validation & Analysis
The data validation process aims at ensuring the accuracy of the achieved results of the gathered data, managed, and analyzed. The correlation between these results and the real status of the displaced Syrians in Lebanon will be used to generate the analysis base lines of the final report.
The data validation and analysis are intended to give the maximum possible guarantees for the accuracy and consistency of the outputs of gathered data and prove the reliability of the components of this study. This will secure correctness of the results of the impact of the Syrian crisis on the power sector in Lebanon. The process of data validation and analysis is described in annex 03.
Table 17 here after provides a sample of the calculated average connected load for Non IS and IS using the average of the TCL for each shelter type of the visited samples in each region. For validation purposes, the power consumption is then calculated again using the econometric and statistical methods to calculate the increase in load on the MV feeders supplying the South region and correlating it to the number of the displaced Syrians in the villages supplied by these feeders taking into consideration the increase in load due to the increase in the number of EDL customers resulting from the normal Lebanese population growth.
DISPLACED SYRIAN SHELTERS SURVEY DATAGOVERNORATE OF SOUTH LEBANON (60 SAMPLES)
City / V
illage
Visited
Sh
elter N
ame
No
. of F
amily
Mem
bers
Sh
elter Type
No
. of F
amilies
in V
isited U
nit
Sh
elter
No
. of P
erson
s in
Visited
Un
it S
helter
No
. of U
nits
in V
isited U
nit
Sh
elterAvailable Household Appliances (W)
Total
Co
nn
ected
Lo
ad (K
W)
Averag
e Po
wer
Co
nsu
mp
tion
(K
W)Light Fridge TV Fan
Washing Machine
Water Heater
Iron A/C
100 300 150 100 1,000 1,500 1,000 1,100
Bissarieh
Mo
un
ir Hm
aidan
5 IS 1 5
11
2 1 1 1 0 0 0 0 0.75 0.75
3 IS 1 3 2 1 1 0 1 0 0 0 1.65 1.65
4 IS 1 4 3 0 1 1 0 0 0 0 0.55 0.55
4 IS 1 4 2 1 1 0 0 0 0 1 1.75 1.75
Sarafan
d
Man
ana B
uild
ing
5 Non IS 1 5
74
2 0 1 0 1 0 1 0 2.35 1.175
5 Non IS 1 5 2 0 1 0 1 0 0 0 1.35 0.675
8 Non IS 1 8 2 0 1 0 1 0 0 0 1.35 0.675
3 Non IS 1 3 2 0 1 0 1 0 0 0 1.35 0.675
7 Non IS 1 7 2 0 1 0 1 0 0 0 1.35 0.675
7 Non IS 1 7 2 0 1 0 1 0 0 0 1.35 0.675
9 Non IS 1 9 2 0 1 0 1 0 0 0 1.35 0.675
Non IS: Non Informal Settlement IS: Informal Settlement
Table 17: Sample of Survey Data Sheet

The Impact of the Syrian Crisis on the Lebanese Power Sector and Priority Recommendations26
4. Econometrics and Statistical Analysis
4.1 Introduction
The econometrics and statistical methods employed to analyze and validate the primary and secondary data are presented along with their results, as well as their interpretation and implications. The site survey data is considered herewith as the primary data, while the secondary data consists of data related to the distribution of the displaced Syrians obtained from various sources such as the UNHCR and the DGGS, as well as GIS and MV feeder loads shared by EDL and the MOEW.
The data related to the distribution of the displaced Syrians obtained from the UNHCR is used to calculate the average number of persons per family for each of the four regions considered in this study (Beirut & Mount Lebanon, Bekaa, North, and South).
The results of the site survey data provide the basis for calculating the power consumption of displaced Syrians in Lebanon. Descriptive and inferential statistical methods are conducted to analyze the demographic variables of the displaced Syrians in Lebanon. These results, along with those obtained by analyzing the power consumption of household appliances of the visited samples, are used to calculate the power consumption of the displaced Syrians in Lebanon.
Power consumption calculated using the survey data is validated by comparing it to the monthly power consumption calculated using EDL data (GIS data and MV feeders load). Data analysis and calculation are based on the monthly load on the MV feeders and the historical data of the number of displaced Syrians provided by the UNHCR.
4.2 Methodology
As per EDL data, 10 HV/MV primary substations supply the South region. Other details of the South region are exhibited in Table 18 below.
Category 2012 2013 2014 2015 2016
No. of MV Feeders 81 87 89 92 98
No. of Villages Hosting Displaced Syrians 283 305 303 306
No. of Displaced Syrians (Persons) 96,197 135,646 125,272 118,586
Table 18: Details of South Region
Validation of the data is carried out using the seasonal index method on a quarterly basis. Seasonal indices are computed in order to remove the seasonal variation in consumption and then values are used to calculate the average yearly load. In order to account for the increase in load due to the displaced Syrians, the calculated loads are adjusted using the Lebanese population growth rate. The total load from the displaced Syrians is then divided by the number of families for time period required; details on the method are available in Annex 04.
This analysis is conducted for the South region alone since it was the region where data (GIS and load) were provided as mentioned above in section 3.1.

Final Report 27
4.3 Determining the Seasonal Indices and Deseasonalized Loads for the Entire South Region
• To calculate the average power consumption per family, the MV feeders’ quarterly loads for the South region are analyzed using time series techniques to calculate the moving averages, seasonal indices, and deseasonalized quarterly loads. Calculating the average power consumption per family is based on the deseasonalized quarterly loads.
• The moving-average method is useful in smoothing a time series to observe its trend. Additionally, it is the basic method used in measuring seasonal fluctuation. This is accomplished by “moving” the arithmetic mean values through the time series.
• Seasonal variation is one of the components of a time series. The monthly loads and the quarterly loads have above-average load and below-average load periods each year. One of the reasons for analyzing seasonal fluctuations is to have a sufficient supply of power to meet the varying seasonal demand. An analysis of seasonal fluctuations over a period of years is also helpful in calculating the power consumption of displaced Syrians in Lebanon.
• A typical set of quarterly indices consists of four indices that are representative of the data for a four-quarter period. Each index is a percentage, with the average for the year equal to 100.0; that is, each quarterly index indicates the level of loads in relation to the annual average of 100.0. A typical index of 97.0 for the winter quarter indicates that loads are usually three percent below the average for the year in the winter season. Similarly, an index of 104.1 for the summer quarter means that the variable is typically 4.1 percent above the annual average in the summer season.
• There are several methods to measure the typical seasonal fluctuation in a time series. The most commonly used method to compute the typical seasonal pattern is called the ratio-to-moving-average method. It eliminates the trend, cyclical, and irregular components from the original data.
Year
Load in Amps (Voltage Level is 15 kV)
Q1 Q2 Q3 Q4 Annual
Winter Spring Summer Fall Average
2012 20,162 18,993 22,739 19,810 20,426
2013 22,638 22,051 26,270 23,731 23,673
2014 21,707 24,301 24,543 22,476 23,257
2015 23,214 21,393 24,167 18,390 21,791
2016 22,745 24,027 23,386
Table 19: South Region Quarterly Loads (Amp)
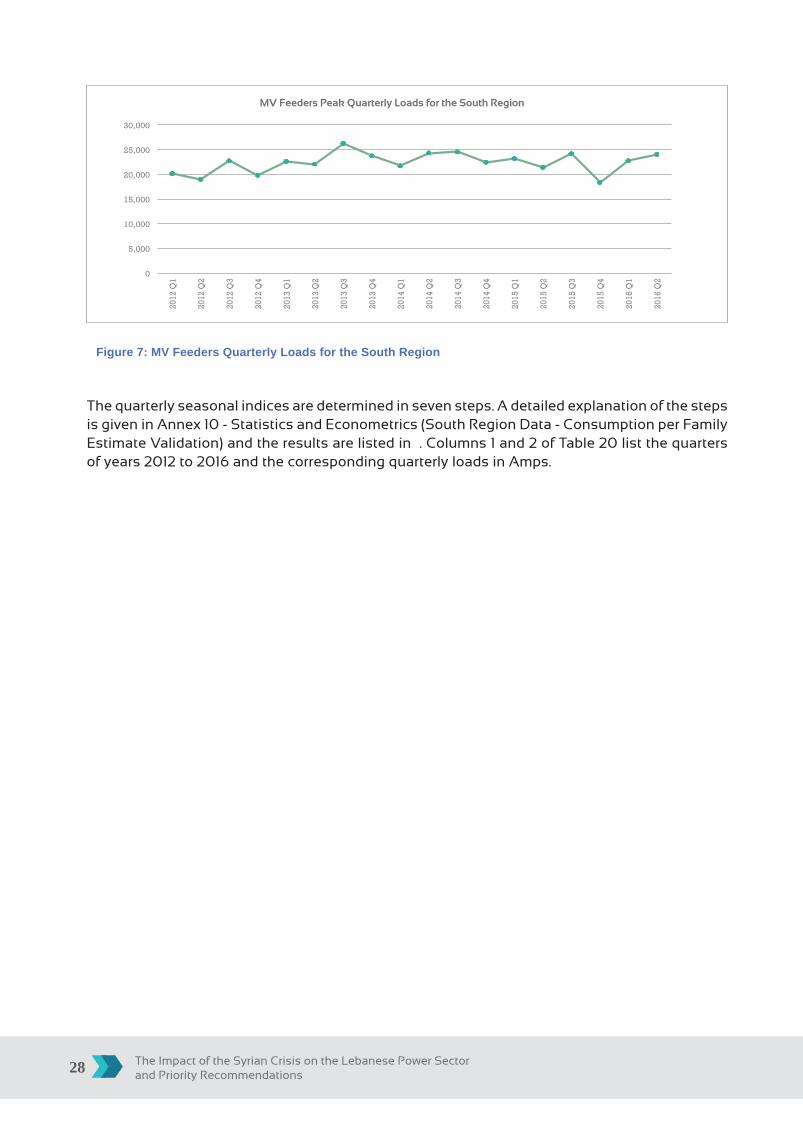
Figure 7 depicts the quarterly loads for the South region over the five-year period, highlighting the seasonal nature of the loads. For each year, the third-quarter loads are the highest; while the loads for the second and the fourth quarters are lower. In addition, there is a significant increase in the loads from 2012 to 2013.
The Impact of the Syrian Crisis on the Lebanese Power Sector and Priority Recommendations28
0
5,000
10,000
15,000
20,000
25,000
30,000
2012
Q1
2012
Q2
2012
Q3
2012
Q4
2013
Q1
2013
Q2
2013
Q3
2013
Q4
2014
Q1
2014
Q2
2014
Q3
2014
Q4
2015
Q1
2015
Q2
2015
Q3
2015
Q4
2016
Q1
2016
Q2
The quarterly seasonal indices are determined in seven steps. A detailed explanation of the steps is given in Annex 10 - Statistics and Econometrics (South Region Data - Consumption per Family Estimate Validation) and the results are listed in . Columns 1 and 2 of Table 20 list the quarters of years 2012 to 2016 and the corresponding quarterly loads in Amps.
MV Feeders Peak Quarterly Loads for the South Region
Figure 7: MV Feeders Quarterly Loads for the South Region

Final Report 29
Column 1
Year
&
Quarter
Column 2
Loads
(Amp)
Column 3
Four
Quarter
Total
Column 4
Four
Quarter
Moving
Average
Column 5
Centered
Moving
Average
Column 6
Specific
Seasonality
Column 7
Seasonal
Index
Column 8
Adjusted
Seasonal
Index
Column 9
De-Seasonalized
Load
(Amp)
2012 Q1 20,162
2012 Q2 18,993 0.9855 19,272
81,703 20,426
2012 Q3 22,739 20,735 1.0966 1.0927 1.0957 20,753
84,180 21,045
2012 Q4 19,810 21,427 0.9245 0.9317 0.9342 21,204
87,238 21,809
2013 Q1 22,638 22,251 1.0174 0.9818 0.9846 22,993
90,768 22,692
2013 Q2 22,051 23,182 0.9512 0.9828 0.9855 22,375
94,690 23,672
2013 Q3 26,270 23,556 1.1152 1.0957 23,975
93,759 23,440
2013 Q4 23,731 23,721 1.0004 0.9342 25,402
96,009 24,002
2014 Q1 21,707 23,786 0.9126 0.9846 22,048
94,283 23,571
2014 Q2 24,301 23,414 1.0379 0.9855 24,659
93,027 23,257
2014 Q3 24,543 23,445 1.0468 1.0957 22,399
94,534 23,633
2014 Q4 22,476 23,270 0.9659 0.9342 24,058
91,625 22,906
2015 Q1 23,214 22,859 1.0155 0.9846 23,578
91,250 22,812
2015 Q2 21,393 22,302 0.9592 0.9855 21,707
87,164 21,791
2015 Q3 24,167 21,732 1.112 1.0957 22,057
86,696 21,674
2015 Q4 18,390 22,003 0.8358 0.9342 19,685
89,330 22,332
2016 Q1 22,745 0.9846 23,102
2016 Q2 24,027 0.9855 24,380
2016 Q3 1.0957
2016 Q4 0.9342
Table 20: South Region Quarterly Deseasonalized Loads (AMP)
4.4 Average Power Consumption per Family Based on EDL Data for the Entire South Region
The number of displaced Syrian families provided by the UNHCR is in annual figures except for the year 2016. In order to have a common time reference, average annual loads are calculated (Column 2 of Table 27) based on the deseasonalized loads listed in Table 26 (Column 9). The trend in the average annual loads (Figure 9) is expected population growth and the additional

The Impact of the Syrian Crisis on the Lebanese Power Sector and Priority Recommendations30
consumption by displaced Syrians. The average annual loads are then adjusted to account for a population growth of 1.222%, 1.180%, 1.182%, and 1.182% per year for 2013, 2014, 2015 and 2016, respectively (Trading Economies, 2016 and World Bank, 2016).
The remaining trend is the power consumption of the displaced Syrians in the area. Calculations of all figures in Table 21 are available in Annex 10 - Statistics and Econometrics (South Region Data - Consumption per Family Estimate Validation).
Column 1
Year
Column 2
Average
Loads
(AMP)
Column 3
Population
Growth
Column 4
Estimated
Loads Base
Year 2012
(AMP)
Column 5
Load
Growth
Base Year
2012 (AMP)
Column 6
Adjusted
Average
Loads Per
Quarter
(AMP)
Column 7
Change in
Adjusted
Average
Annual
Loads
(AMP)
Column 8
Change in
Adjusted
Average
Annual Load
(KW)
Column 9
Change in
Number of
Families
(Base Year
2012)
Column 10
Average
Consumption
per Family (KW
with Base Year
2012)
2012 20,427 20,427 0 20,427
2013 23,686 1.222% 20,676 250 23,437 3,010 62,558 21,462 2.915
2014 23,291 1.180% 20,920 494 22,797 2,371 49,269 30,263 1.628
2015 21,757 1.182% 21,301 874 20,882 455 9,466 27,949 0.339
2016 23,741 1.182% 21,689 1,262 22,479 2,052 42,654 26,457 1.612
Average 1.623
Table 21: Average Peak Power Consumption per Family
20,427
23,686
23,291
21,757
23,741
20,000
20,500
21,000
21,500
22,000
22,500
23,000
23,500
24,000
2012 2013 2014 2015 2016
Figure 8: Quarterly Load for the South Region (Amp)
Average Quarterly Load (AMP)

Final Report 31
4.5 Analysis of Survey Data
Survey data was collected in order to:
• Examine the distribution of the average number of persons per family.
• Determine the distribution of family per shelter type (Non IS, IS).
• Determine the power consumption per shelter unit.
• Determine the number of displaced Syrian families living in each village.
Descriptive and inferential statistical methods were conducted to analyze the survey data. In particular, the survey data are analyzed to estimate the average number of persons per family. This information along with collected data on power consumption will be used to calculate the additional power consumption due to the displaced Syrians in Lebanon.
Sample selection was based on the distribution of the displaced Syrians in various geographic locations, the concentration of displaced Syrians in these locations and the proportion of the displaced Syrians living in Non IS shelters and IS shelters. A summary of the distribution of families surveyed is presented in Table 22 below and the corresponding bar chart depicted in Figure 9. Note that the distribution of surveyed families is consistent with the actual distribution of displaced Syrians in Lebanon.
Region Beirut & ML Bekaa North South Total
No. of Families 110 100 80 60 350
% of Families 31.43% 28.57% 22.86% 17.14% 100.00%
Table 22: Distribution of Families as per Survey Data
110 100 80
60
350
0
50
100
150
200
250
300
350
400
Beirut & ML Bekaa North South Total
Beirut & ML
Bekaa
North
South
Total
Figure 9: Distribution of Families as per Survey Data
In Table 23 below, the surveyed families are cross-classified according to location and residency type (Non IS and IS).
Region Beirut & ML Bekaa North South Total
Non IS 83 38 43 31 195
IS 27 62 37 29 155
Total 37 100 80 60 350
Table 23: Cross-Tabulation of Families Residency Type vs. Region
No. of Visited Samples

The Impact of the Syrian Crisis on the Lebanese Power Sector and Priority Recommendations32
Most of the visited shelter units, whether Non IS or IS, are occupied by a single family; few are found to host more than one family. Since power consumption is calculated per shelter unit, the distribution of residency units hosting one or more family was evaluated and results can be seen in Table 24 below.
Frequency Percentage Cumulative %
Valid
1 297 84.9 84.9
2 33 9.4 94.3
3 13 3.7 98.0
4 4 1.1 99.1
5 2 0.6 99.7
6 1 0.3 100.0
Total 350 100.0
Table 24: No. of Families per Shelter Unit
The distribution of number of persons per shelter unit was further analyzed. First, the frequency distribution was constructed in the table below. The result showed that the number of persons per shelter unit varied across a wide range, extending from 1 to 25 persons. Descriptive and inferential analyses were then used to estimate the distribution of the average number of persons per shelter unit for the various geographic regions. In each case, a point estimate for the average is calculated along with a 95% confidence interval for the true average. The results are shown in Table 25.
Valid
No. of Persons per Shelter Unit Frequency Percent Cumulative Percent
1 7 2.0 2.0
2 23 6.6 8.6
3 26 7.4 16.0
4 58 16.6 32.6
5 45 12.9 45.4
6 48 13.7 59.1
7 36 10.3 69.4
8 35 10.0 79.4
9 20 5.7 85.1
10 20 5.7 90.9
11 11 3.1 94.0
12 3 0.9 94.9
13 5 1.4 96.3
14 3 0.9 97.1
15 3 0.9 98.0
16 1 0.3 98.3
18 1 0.3 98.6
19 1 0.3 98.9
20 2 0.6 99.4
24 1 0.3 99.7
25 1 0.3 100.0
Total 350 100.0
Table 25: No. of Persons per Shelter Unit

Final Report 33
Region Descriptive Statistics Statistic
Beirut
Mean 4.78
95% Confidence Interval for MeanLower Bound 4.11
Upper Bound 5.46
Mount
Lebanon
Mean 5.01
95% Confidence Interval for MeanLower Bound 4.55
Upper Bound 5.48
Bekaa
Mean 6.44
95% Confidence Interval for MeanLower Bound 5.86
Upper Bound 7.02
North
Mean 6.1
95% Confidence Interval for MeanLower Bound 5.43
Upper Bound 6.77
South
Mean 5.18
95% Confidence Interval for MeanLower Bound 4.5
Upper Bound 5.86
Table 26: Number of Persons per Family
The mean represents the average number of persons per family in each region obtained from the sample data as detailed in Table 26 above. The 95% confidence interval is a range for the overall mean within that region.
4.6 Validation of Estimates
The average load per family for the years 2012 - 2016 based on averaging the additional load for the entire South region is compared to the value obtained from the survey data. The average peak power consumption per family based on EDL data for the South region is 1.623 KW per family. Since EDL figures are obtained using peak load, the South region estimate of 1.623 kW per family is divided by 1.21 (the average ratio of peak load / average load for the South region) and the result is 1.341 kW per family. To compare this average with the survey-based estimation, a weighted mean for the average of 1.307 KW per shelter unit for Non IS and 1.864 KW per shelter unit for IS with weights of 69% and 31% respectively was calculated resulting in a consumption of 1.479 KW per shelter unit. The average power consumption per shelter unit in the South region calculated using the survey data is slightly higher than that obtained using the EDL data mainly due to:
• The value of the factor (Demand Factor 0.7 * Diversity Factor 0.7) used in the survey data to calculate the average power consumption for Non IS shelter type is higher than the actual.
• The value of the power factor (pf=0.80) used in EDL data to calculate the average power consumption is lower than the actual value found in the field in areas with a severe voltage drop (180V – 190V).
• The total load of the MV feeders in 2015 is less than the total load in 2014. This is due to the reinforcement of several MV feeders in the South region and/or some displaced Syrian families having moved to other areas but are still registered in the old location, or the fact that EDL data obtained would also include institutions in the area such as schools, municipalities, etc.
Details of the calculations of the average power consumption per family in the South using EDL data are presented in “Section 5 - Econometrics and Statistical Analysis”.

The Impact of the Syrian Crisis on the Lebanese Power Sector and Priority Recommendations34
5. POWER CONSUMPTION CALCULATION
Power consumption is calculated using the survey data which provided the connected load from the accommodation walk through and the shelter unit details (number of families / individuals residing per shelter unit – as shown in Table 36 in annex 05); detailed steps of the methodology is provided in Annex 05.
5.1 Demand Factor
Demand factor is the ratio of the maximum demand of a system to the total connected load on the system. Demand factor is always less than one. The lower the demand factor, the less system capacity is required to serve the connected load (Electrical Engineering Portal, 2016).
As per National Electrical Code (NEC), a demand factor may be applied to the total connected load to calculate the sizing of a power generation system and/or select the proper conductor size of an MV feeder to avoid over-loading the feeder. Care must be taken when selecting the value of the demand factor. Using a low demand factor ends up in having insufficient generation capacity to supply the connected load. Demand factor for residential load ranges between 0.50 and 0.80 of the total connected load. To be on the safe side and avoid over-sizing the required system, a 0.70 Demand Factor is used to calculate the power consumption of the displaced Syrians living in Non IS shelter type. For incandescent-lighting and small residential loads <0.25 KW, the demand factor always equals 1. Therefore, a 1.00 demand factor is applied when calculating the power consumption of the displaced Syrians living in IS shelter (Electrical Engineering Portal, 2016 and Electrical Contractor: Power & Integrated Building Systems, 2016 and Electricity Notes, 2011).
5.2 Diversity Factor
Diversity factor and load factor are closely related. Diversity factor is the ratio of the sum of the individual maximum demand of the various subdivisions of a system to the maximum demand of the whole system. Diversity factor is usually more than one. EDL values for Diversity Factor as per EDL Memo 226 - Page 3 (Annex 06 - Diversity Factor) are inversely given in Table 27 below.
Category Diversity Factor
Offices 0.70
Luxury Buildings 0.60
Medium Standard Buildings without A/C 0.50
Popular Residential Complexes 0.80
Table 27: EDL Values of Diversity Factor (Inversed)
5.3 Calculations and Scenarios
While assessing the impact of the Syrian Crisis on the electricity sector the main variables are the total power consumption and the number of end users benefiting from it (refer to Annex 06 for number of Registered Syrian Refugees and the different values).
The total power consumption in KW and the total energy consumption in KWH of the displaced Syrians in Lebanon are calculated in four scenarios:
• Scenario 1: This scenario takes into account the total number of displaced Syrians in Lebanon

Final Report 35
as of June 30, 2016 as provided by the UNHCR, in addition to the 7% estimate for the displaced Syrians living in IS shelters and are still not registered with the UNHCR. These will be calculated using the average number of supply hours per day and per region as per the collected survey data.
• Scenario 2: This scenario takes into account the total number of displaced Syrians in Lebanon as of June 30, 2016 as provided by the UNHCR, in addition to the 7% estimate for the displaced Syrians living in IS shelters that are still not registered with the UNHCR. As for the second variable, supply hours, these will be calculated using the average number per day and per region as per EDL’s data.
• Scenario 3: This scenario takes into account the total number of displaced Syrians in Lebanon as provided by the DGGS (1,500,000 persons). As for the second variable, supply hours, these will be calculated using the average number per day and per region as per the collected survey data.
• Scenario 4: This scenario takes into account the total number of displaced Syrians in Lebanon as provided by the DGGS (1,500,000 persons). As for the second variable, supply hours, these will be calculated using the average number per day and per region as per EDL’s data.
Detailed calculation of the total power consumption in KW and total energy consumption in KWH of the displaced Syrians in Lebanon of all four scenarios is available in Annex 07 - Total Power Consumption and in Annex 08 - Total Energy Consumption.
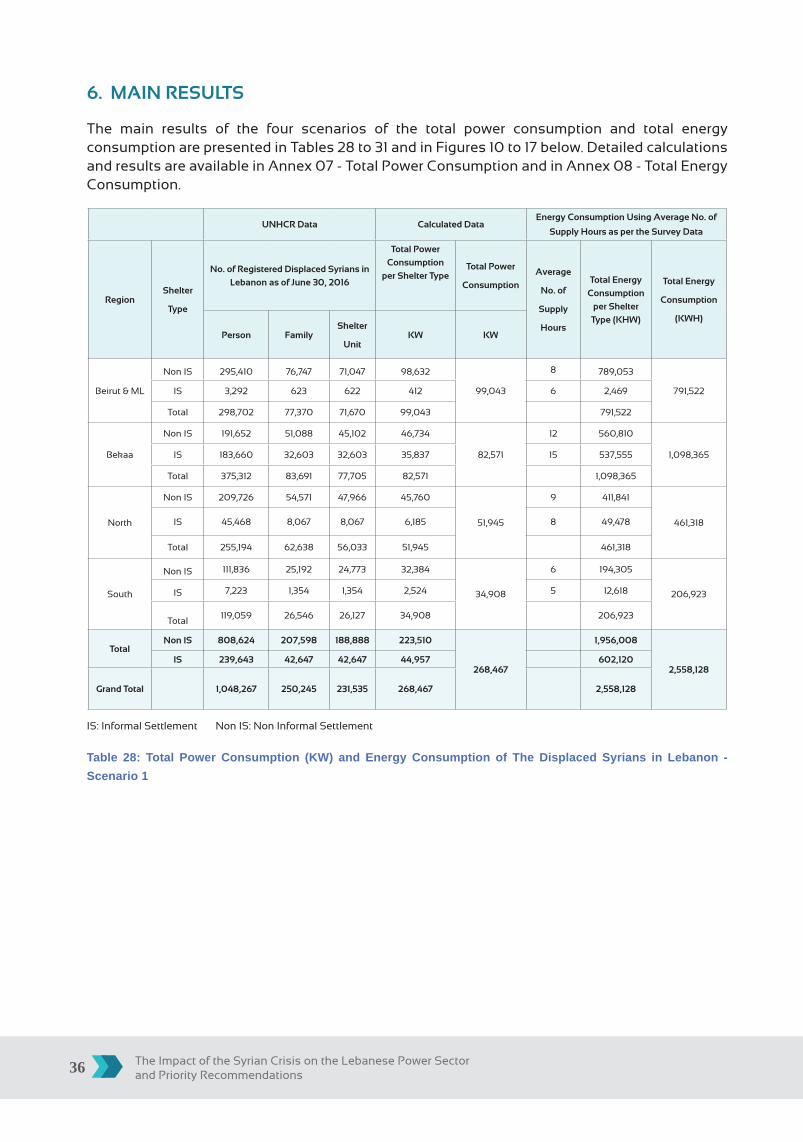
The Impact of the Syrian Crisis on the Lebanese Power Sector and Priority Recommendations36
6. MAIN RESULTS
The main results of the four scenarios of the total power consumption and total energy consumption are presented in Tables 28 to 31 and in Figures 10 to 17 below. Detailed calculations and results are available in Annex 07 - Total Power Consumption and in Annex 08 - Total Energy Consumption.
UNHCR Data Calculated DataEnergy Consumption Using Average No. of
Supply Hours as per the Survey Data
RegionShelter
Type
No. of Registered Displaced Syrians in
Lebanon as of June 30, 2016
Total Power
Consumption
per Shelter Type Total Power
Consumption
Average
No. of
Supply
Hours
Total Energy
Consumption
per Shelter
Type (KHW)
Total Energy
Consumption
(KWH)
Person FamilyShelter
UnitKW KW
Beirut & ML
Non IS 295,410 76,747 71,047 98,632
99,043
8 789,053
791,522IS 3,292 623 622 412 6 2,469
Total 298,702 77,370 71,670 99,043 791,522
Bekaa
Non IS 191,652 51,088 45,102 46,734
82,571
12 560,810
1,098,365IS 183,660 32,603 32,603 35,837 15 537,555
Total 375,312 83,691 77,705 82,571 1,098,365
North
Non IS 209,726 54,571 47,966 45,760
51,945
9 411,841
461,318IS 45,468 8,067 8,067 6,185 8 49,478
Total 255,194 62,638 56,033 51,945 461,318
South
Non IS 111,836 25,192 24,773 32,384
34,908
6 194,305
206,923IS 7,223 1,354 1,354 2,524 5 12,618
Total119,059 26,546 26,127 34,908 206,923
TotalNon IS 808,624 207,598 188,888 223,510
268,467
1,956,008
2,558,128IS 239,643 42,647 42,647 44,957 602,120
Grand Total 1,048,267 250,245 231,535 268,467 2,558,128
IS: Informal Settlement Non IS: Non Informal Settlement
Table 28: Total Power Consumption (KW) and Energy Consumption of The Displaced Syrians in Lebanon - Scenario 1

Final Report 37
98,632
412
46,734 35,837 45,760
6,185 32,384
2,524
223,510
44,957
268,467
0
100,000
200,000
300,000
400,000
500,000
600,000
700,000
800,000
900,000
NonIS IS NonIS IS NonIS IS NonIS IS NonIS IS
Beirut&ML Bekaa North South Total
No.ofPersons
No.ofFamilies
PowerConsumpIon(KW)
TotalPowerConsumpIon(KW)
Power Consumption of Displaced Syrians in Lebanon as per UNHCR Figures as of June 30, 2016 +7% of Non Registered IS
Figure 10: Total Power Consumption (KW) of The Displaced Syrians in Lebanon - Scenario 1
789,053
2,469
560,810 537,555 411,841
49,478
194,305
12,618
1,956,008
602,120
2,558,128
0
500,000
1,000,000
1,500,000
2,000,000
2,500,000
3,000,000
Non IS IS Non IS IS Non IS IS Non IS IS Non IS IS
Beirut & ML Bekaa North South Total
No. of Persons No. of Families Energy Consumption (KWH) Total Energy Consumption (KWH)
Energy Consumption of Displaced Syrians in Lebanon as per UNHCR Figures as of June 30, 2016 +7% of Non Registered IS
Figure 11: Total Energy Consumption (KWH) of The Displaced Syrians in Lebanon - Scenario 1

The Impact of the Syrian Crisis on the Lebanese Power Sector and Priority Recommendations38
UNHCR Data Calculated Data
Energy Consumption Using Average No. of
Supply Hours as per EDL
RegionShelter
Type
No. of Registered Displaced Syrians in
Lebanon as of June 30, 2016
Total Power
Consumption per
Shelter Type
Total Power
Consumption
Average No. of
Supply Hours
Total Energy
Consumption
per Shelter
Type (KHW) Average No.
of Supply
Hours
Total Energy
Consumption
per Shelter
Type (KHW)
Total Energy
Consumption
(KWH)
Person FamilyShelter
UnitKW KW
Beirut &
ML
Non IS 295,410 76,747 71,047 98,632
99,043
16 1,601,777
1,608,460IS 3,292 623 622 412 16 6,683
Total 298,702 77,370 71,670 99,043 1,608,460
Bekaa
Non IS 191,652 51,088 45,102 46,734
82,571
13 613,620
1,084,160IS 183,660 32,603 32,603 35,837 13 470,540
Total 375,312 83,691 77,705 82,571 1,084,160
North
Non IS 209,726 54,571 47,966 45,760
51,945
13 609,982
692,424IS 45,468 8,067 8,067 6,185 13 82,442
Total 255,194 62,638 56,033 51,945 692,424
South
Non IS 111,836 25,192 24,773 32,384
34,908
12 384,400
414,354IS 7,223 1,354 1,354 2,524 12 29,955
Total 119,059 26,546 26,127 34,908 414,354
TotalNon IS 808,624 207,598 188,888 223,510
268,467
3,209,778
3,799,398IS 239,643 42,647 42,647 44,957 589,620
Grand
Total 1,048,267 250,245 231,535 268,467
3,799,398
IS: Informal Settlement Non IS: Non Informal Settlement
Table 29: Total Power Consumption (KW) and Energy Consumption of The Displaced Syrians in Lebanon - Scenario 2
98,632
412
46,734 35,837 45,760
6,185 32,384 2,524
223,510
44,957
268,467
0
100,000
200,000
300,000
400,000
500,000
600,000
700,000
800,000
900,000
NonIS IS NonIS IS NonIS IS NonIS IS NonIS IS
Beirut&ML Bekaa North South Total
No.ofPersons
No.ofFamilies
PowerConsumpIon(KW)
TotalPowerConsumpIon(KW)
Figure 12: Total Power Consumption (KW) of The Displaced Syrians in Lebanon - Scenario 2
Power Consumption of Displaced Syrians in Lebanon as per UNHCR Figures as of June 30, 2016 +7% of Non Registered IS

Final Report 39
1,601,777
6,683
613,620
470,540
609,982
82,442
384,400
29,955
3,209,778
589,620
3,799,398
0
500,000
1,000,000
1,500,000
2,000,000
2,500,000
3,000,000
3,500,000
4,000,000
NonIS IS NonIS IS NonIS IS NonIS IS NonIS IS
Beirut&ML Bekaa North South Total
No.ofPersons
No.ofFamilies
EnergyConsumpGon(KWH)
TotalEnergyConsumpGon(KWH)
Energy Consumption of Displaced Syrians in Lebanon as per UNHCR Figures as of June 30, 2016 +7% of Non Registered IS
Figure 13: Total Energy Consumption (KWH) of The Displaced Syrians in Lebanon - Scenario 2
UNHCR Data Calculated Data Energy Consumption Using Average No. of Supply Hours as per the Survey Data
RegionShelter
Type
No. of Registered Syrian Refugees in Lebanon as per the Official Numbers of the DGGS up to the Closure of the
Borders
Total Power Consumption
per Shelter Type
Total Power Consumption
Average No. of Supply
Hours ‘
Total Energy Consumption
per Shelter Type (KHW)
Total Energy Consumption
(KWH)
Person FamilyShelter
UnitKW KW
Beirut &
ML
Non IS 424,131 110,182 101,999 141,601
142,012
8 1,132,805
1,135,276IS 3,292 623 623 412 6 2,471
Total 427,423 110,805 102,622 142,012 1,135,276
Bekaa
Non IS 353,387 93,665 82,691 85,683
121,520
12 1,028,192
1,565,747IS 183,660 32,603 32,603 35,837 15 537,555
Total 537,047 126,268 115,294 121,520 1,565,747
North
Non IS 319,697 83,037 72,986 69,630
75,815
9 626,670
676,148IS 45,468 8,067 8,067 6,185 8 49,478
Total 365,165 91,104 81,053 75,815 676,148
South
Non IS 163,142 36,696 36,085 47,172
49,696
6 283,035
295,652IS 7,223 1,354 1,354 2,524 5 12,618
Total 170,365 38,050 37,439 49,696 295,652
TotalNon IS 1,260,357 323,580 293,761 344,086
389,043
3,070,702
3,672,824
IS 239,643 42,647 42,647 44,957 602,122
Grand
Total 1,500,000 366,227 336,408 389,043 3,672,824
Table 30: Total Power Consumption (KW) and Energy Consumption of the Displaced Syrians in Lebanon - Scenario 3
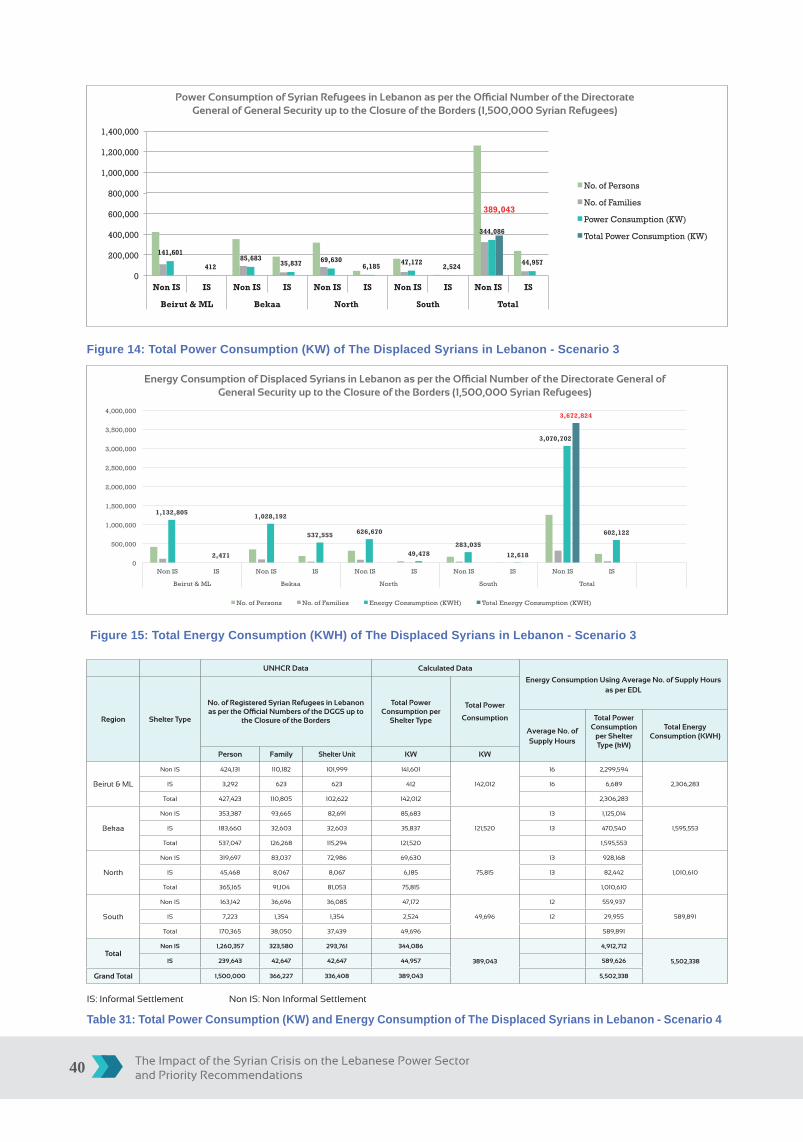
The Impact of the Syrian Crisis on the Lebanese Power Sector and Priority Recommendations40
141,601
412 85,683
35,837 69,630 6,185 47,172
2,524
344,086
44,957
389,043
0
200,000
400,000
600,000
800,000
1,000,000
1,200,000
1,400,000
Non IS IS Non IS IS Non IS IS Non IS IS Non IS IS
Beirut & ML Bekaa North South Total
No. of Persons
No. of Families
Power Consumption (KW)
Total Power Consumption (KW)
Figure 14: Total Power Consumption (KW) of The Displaced Syrians in Lebanon - Scenario 3
1,132,805
2,471
1,028,192
537,555 626,670
49,478 283,035
12,618
3,070,702
602,122
3,672,824
0
500,000
1,000,000
1,500,000
2,000,000
2,500,000
3,000,000
3,500,000
4,000,000
Non IS IS Non IS IS Non IS IS Non IS IS Non IS IS
Beirut & ML Bekaa North South Total
No. of Persons No. of Families Energy Consumption (KWH) Total Energy Consumption (KWH)
Figure 15: Total Energy Consumption (KWH) of The Displaced Syrians in Lebanon - Scenario 3
UNHCR Data Calculated Data
Energy Consumption Using Average No. of Supply Hours as per EDL
Region Shelter Type
No. of Registered Syrian Refugees in Lebanon as per the Official Numbers of the DGGS up to
the Closure of the Borders
Total Power Consumption per
Shelter Type
Total Power
Consumption
Average No. of Supply Hours
Total Power Consumption
per Shelter Type (kW)
Total Energy Consumption (KWH)
Person Family Shelter Unit KW KW
Beirut & ML
Non IS 424,131 110,182 101,999 141,601
142,012
16 2,299,594
2,306,283IS 3,292 623 623 412 16 6,689
Total 427,423 110,805 102,622 142,012 2,306,283
Bekaa
Non IS 353,387 93,665 82,691 85,683
121,520
13 1,125,014
1,595,553IS 183,660 32,603 32,603 35,837 13 470,540
Total 537,047 126,268 115,294 121,520 1,595,553
North
Non IS 319,697 83,037 72,986 69,630
75,815
13 928,168
1,010,610IS 45,468 8,067 8,067 6,185 13 82,442
Total 365,165 91,104 81,053 75,815 1,010,610
South
Non IS 163,142 36,696 36,085 47,172
49,696
12 559,937
589,891IS 7,223 1,354 1,354 2,524 12 29,955
Total 170,365 38,050 37,439 49,696 589,891
TotalNon IS 1,260,357 323,580 293,761 344,086
389,043
4,912,712
5,502,338IS 239,643 42,647 42,647 44,957 589,626
Grand Total 1,500,000 366,227 336,408 389,043 5,502,338
IS: Informal Settlement Non IS: Non Informal Settlement
Table 31: Total Power Consumption (KW) and Energy Consumption of The Displaced Syrians in Lebanon - Scenario 4
Power Consumption of Syrian Refugees in Lebanon as per the Official Number of the Directorate General of General Security up to the Closure of the Borders (1,500,000 Syrian Refugees)
Energy Consumption of Displaced Syrians in Lebanon as per the Official Number of the Directorate General of General Security up to the Closure of the Borders (1,500,000 Syrian Refugees)

Final Report 41
141,601
41285,683
35,837 69,6306,185 47,172 2,524
344,086
44,957
389,043
0
200,000
400,000
600,000
800,000
1,000,000
1,200,000
1,400,000
NonIS IS NonIS IS NonIS IS NonIS IS NonIS IS
Beirut&ML Bekaa North South Total
No.ofPersons
No.ofFamilies
PowerConsump;on(KW)
TotalPowerConsump;on(KW)
Figure 16: Total Power Consumption (KW) of The Displaced Syrians in Lebanon - Scenario 4
2,299,594
6,689
1,125,014
470,540
928,168
82,442
559,937
29,955
4,912,712
589,626
5,502,338
0
1,000,000
2,000,000
3,000,000
4,000,000
5,000,000
6,000,000
Non IS IS Non IS IS Non IS IS Non IS IS Non IS IS
Beirut & ML Bekaa North South Total
No. of Persons No. of Families Energy Consumption (KWH) Total Energy Consumption (KWH)
Figure 17: Total Energy Consumption (KWH) of The Displaced Syrians in Lebanon - Scenario 4
Energy Consumption of Displaced Syrians in Lebanon as per the Official Number of the Directorate General of General Security up to the Closure of the Borders (1,500,000 Syrian Refugees)
Power Consumption of Displaced Syrians in Lebanon as per the Official Number of the Directorate General of General Security up to the Closure of the Borders (1,500,000 Syrian Refugees)
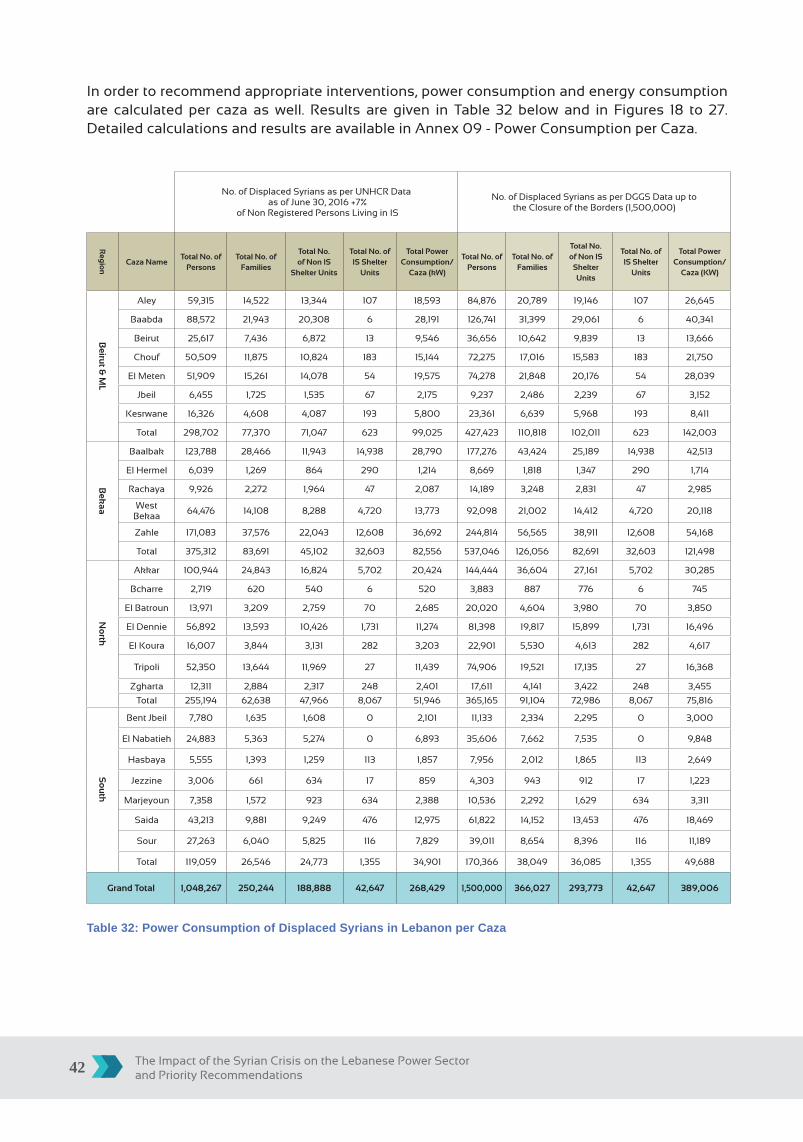
The Impact of the Syrian Crisis on the Lebanese Power Sector and Priority Recommendations42
In order to recommend appropriate interventions, power consumption and energy consumption are calculated per caza as well. Results are given in Table 32 below and in Figures 18 to 27. Detailed calculations and results are available in Annex 09 - Power Consumption per Caza.
No. of Displaced Syrians as per UNHCR Data as of June 30, 2016 +7%
of Non Registered Persons Living in IS
No. of Displaced Syrians as per DGGS Data up to the Closure of the Borders (1,500,000)
Reg
ion
Caza NameTotal No. of
PersonsTotal No. of
Families
Total No. of Non IS
Shelter Units
Total No. of IS Shelter
Units
Total Power Consumption/
Caza (kW)
Total No. of Persons
Total No. of Families
Total No. of Non IS
Shelter Units
Total No. of IS Shelter
Units
Total Power Consumption/
Caza (KW)
Beiru
t & M
L
Aley 59,315 14,522 13,344 107 18,593 84,876 20,789 19,146 107 26,645
Baabda 88,572 21,943 20,308 6 28,191 126,741 31,399 29,061 6 40,341
Beirut 25,617 7,436 6,872 13 9,546 36,656 10,642 9,839 13 13,666
Chouf 50,509 11,875 10,824 183 15,144 72,275 17,016 15,583 183 21,750
El Meten 51,909 15,261 14,078 54 19,575 74,278 21,848 20,176 54 28,039
Jbeil 6,455 1,725 1,535 67 2,175 9,237 2,486 2,239 67 3,152
Kesrwane 16,326 4,608 4,087 193 5,800 23,361 6,639 5,968 193 8,411
Total 298,702 77,370 71,047 623 99,025 427,423 110,818 102,011 623 142,003
Bek
aa
Baalbak 123,788 28,466 11,943 14,938 28,790 177,276 43,424 25,189 14,938 42,513
El Hermel 6,039 1,269 864 290 1,214 8,669 1,818 1,347 290 1,714
Rachaya 9,926 2,272 1,964 47 2,087 14,189 3,248 2,831 47 2,985
West Bekaa
64,476 14,108 8,288 4,720 13,773 92,098 21,002 14,412 4,720 20,118
Zahle 171,083 37,576 22,043 12,608 36,692 244,814 56,565 38,911 12,608 54,168
Total 375,312 83,691 45,102 32,603 82,556 537,046 126,056 82,691 32,603 121,498
No
rth
Akkar 100,944 24,843 16,824 5,702 20,424 144,444 36,604 27,161 5,702 30,285
Bcharre 2,719 620 540 6 520 3,883 887 776 6 745
El Batroun 13,971 3,209 2,759 70 2,685 20,020 4,604 3,980 70 3,850
El Dennie 56,892 13,593 10,426 1,731 11,274 81,398 19,817 15,899 1,731 16,496
El Koura 16,007 3,844 3,131 282 3,203 22,901 5,530 4,613 282 4,617
Tripoli 52,350 13,644 11,969 27 11,439 74,906 19,521 17,135 27 16,368
Zgharta 12,311 2,884 2,317 248 2,401 17,611 4,141 3,422 248 3,455
Total 255,194 62,638 47,966 8,067 51,946 365,165 91,104 72,986 8,067 75,816S
ou
th
Bent Jbeil 7,780 1,635 1,608 0 2,101 11,133 2,334 2,295 0 3,000
El Nabatieh 24,883 5,363 5,274 0 6,893 35,606 7,662 7,535 0 9,848
Hasbaya 5,555 1,393 1,259 113 1,857 7,956 2,012 1,865 113 2,649
Jezzine 3,006 661 634 17 859 4,303 943 912 17 1,223
Marjeyoun 7,358 1,572 923 634 2,388 10,536 2,292 1,629 634 3,311
Saida 43,213 9,881 9,249 476 12,975 61,822 14,152 13,453 476 18,469
Sour 27,263 6,040 5,825 116 7,829 39,011 8,654 8,396 116 11,189
Total 119,059 26,546 24,773 1,355 34,901 170,366 38,049 36,085 1,355 49,688
Grand Total 1,048,267 250,244 188,888 42,647 268,429 1,500,000 366,027 293,773 42,647 389,006
Table 32: Power Consumption of Displaced Syrians in Lebanon per Caza

Final Report 43
Figure 18: Power Consumption of Displaced Syrians in Lebanon per Caza using UNHCR Data

The Impact of the Syrian Crisis on the Lebanese Power Sector and Priority Recommendations44
18,593 28,191 9,546 15,144 19,575
2,175 5,800
99,025
0
50,000
100,000
150,000
200,000
250,000
300,000
350,000
Aley Baabda Beirut Chouf ElMeten Jbeil Kesrwane Total
No.ofPersons
No.ofFamilies
No.ofShelterUnits
PowerConsumpHon(KW)
Figure 19: Power Consumption (KW) per Caza using UNHCR Data - Beirut & ML Region
28,790
1,214 2,087 13,773
36,692
82,556
0
50,000
100,000
150,000
200,000
250,000
300,000
350,000
400,000
Baalbak ElHermel Rachaya WestBekaa Zahle Total
No.ofPersons
No.ofFamilies
No.ofShelterUnits
PowerConsumpJon(KW)
Figure 20: Power Consumption (KW) per Caza using UNHCR Data - Bekaa Region
Power Consumption of Displaced Syrians in Lebanon per Caza (UNHCR Data as of June 30, 2016) - Beirut & ML Region
Power Consumption of Displaced Syrians in Lebanon per Caza (UNHCR Data as of June 30, 2016) - Bekaa Region
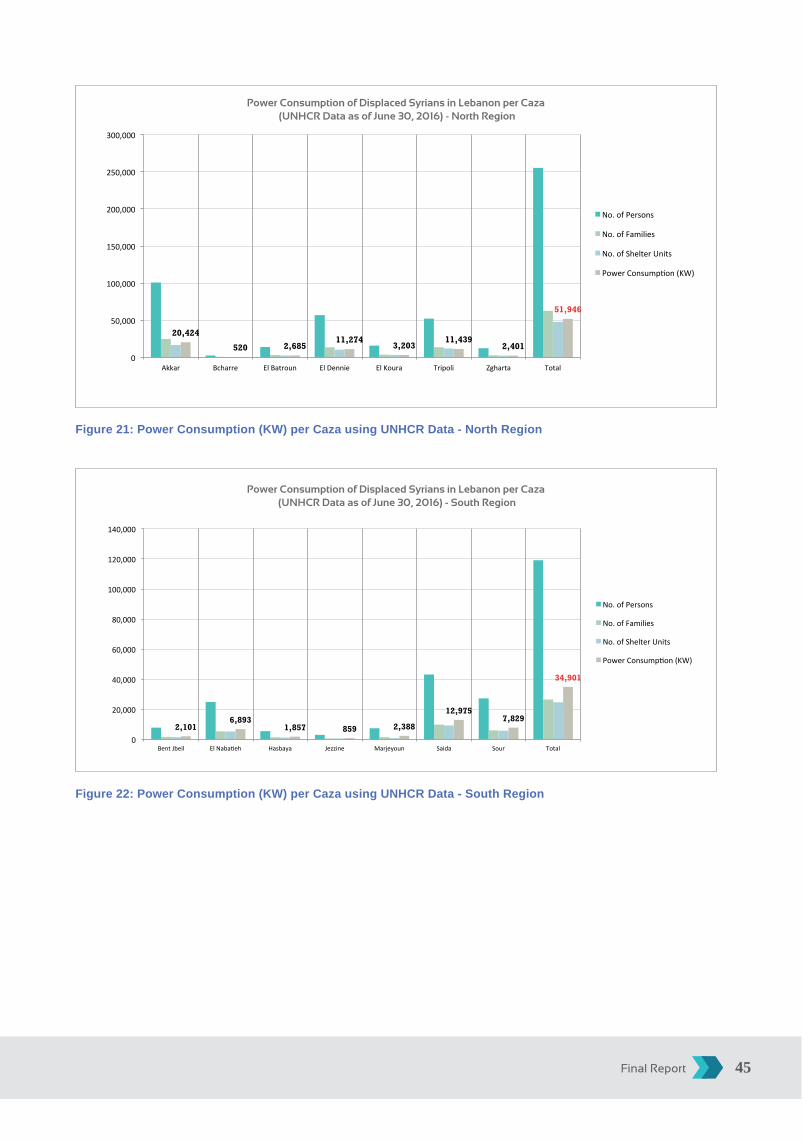
Final Report 45
20,424
520 2,685 11,274
3,203 11,439
2,401
51,946
0
50,000
100,000
150,000
200,000
250,000
300,000
Akkar Bcharre ElBatroun ElDennie ElKoura Tripoli Zgharta Total
No.ofPersons
No.ofFamilies
No.ofShelterUnits
PowerConsumpHon(KW)
Figure 21: Power Consumption (KW) per Caza using UNHCR Data - North Region
2,101 6,893
1,857 859 2,388
12,975 7,829
34,901
0
20,000
40,000
60,000
80,000
100,000
120,000
140,000
BentJbeil ElNaba4eh Hasbaya Jezzine Marjeyoun Saida Sour Total
No.ofPersons
No.ofFamilies
No.ofShelterUnits
PowerConsump4on(KW)
Figure 22: Power Consumption (KW) per Caza using UNHCR Data - South Region
Power Consumption of Displaced Syrians in Lebanon per Caza (UNHCR Data as of June 30, 2016) - North Region
Power Consumption of Displaced Syrians in Lebanon per Caza (UNHCR Data as of June 30, 2016) - South Region

The Impact of the Syrian Crisis on the Lebanese Power Sector and Priority Recommendations46
Figure 23: Power Consumption of Displaced Syrians in Lebanon per Caza using DGGS Data
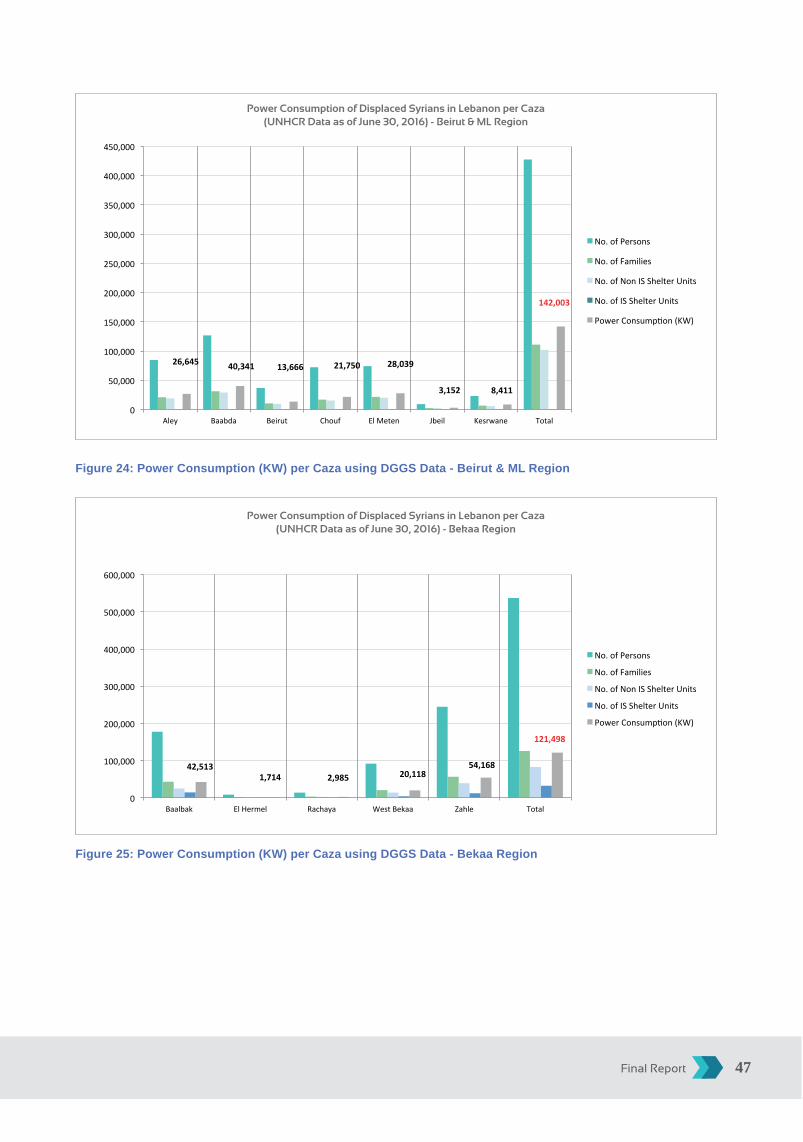
Final Report 47
Power Consumption of Displaced Syrians in Lebanon per Caza (UNHCR Data as of June 30, 2016) - Bekaa Region
26,645 40,341 13,666 21,750 28,039
3,152 8,411
142,003
0
50,000
100,000
150,000
200,000
250,000
300,000
350,000
400,000
450,000
Aley Baabda Beirut Chouf ElMeten Jbeil Kesrwane Total
No.ofPersons
No.ofFamilies
No.ofNonISShelterUnits
No.ofISShelterUnits
PowerConsumpJon(KW)
Figure 24: Power Consumption (KW) per Caza using DGGS Data - Beirut & ML Region
42,5131,714 2,985 20,118
54,168
121,498
0
100,000
200,000
300,000
400,000
500,000
600,000
Baalbak ElHermel Rachaya WestBekaa Zahle Total
No.ofPersons
No.ofFamilies
No.ofNonISShelterUnits
No.ofISShelterUnits
PowerConsumpLon(KW)
Figure 25: Power Consumption (KW) per Caza using DGGS Data - Bekaa Region
Power Consumption of Displaced Syrians in Lebanon per Caza (UNHCR Data as of June 30, 2016) - Beirut & ML Region
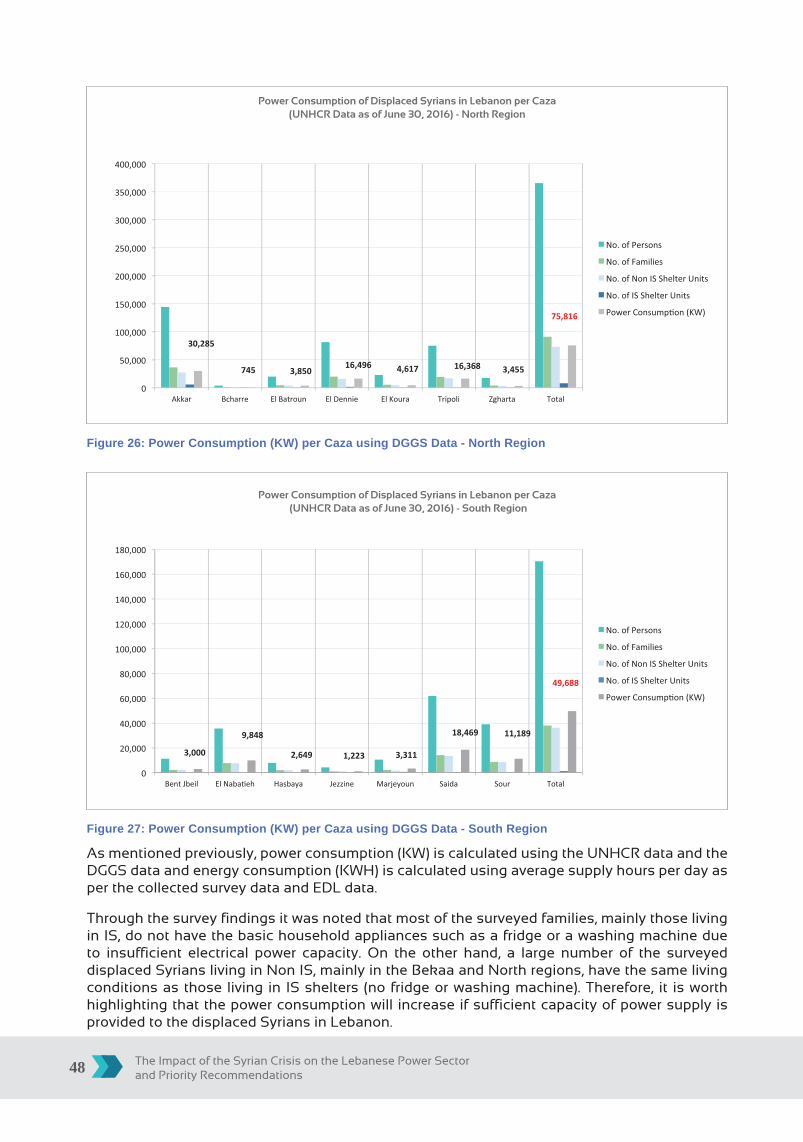
The Impact of the Syrian Crisis on the Lebanese Power Sector and Priority Recommendations48
Figure 26: Power Consumption (KW) per Caza using DGGS Data - North Region
Figure 27: Power Consumption (KW) per Caza using DGGS Data - South Region
As mentioned previously, power consumption (KW) is calculated using the UNHCR data and the DGGS data and energy consumption (KWH) is calculated using average supply hours per day as per the collected survey data and EDL data.
Through the survey findings it was noted that most of the surveyed families, mainly those living in IS, do not have the basic household appliances such as a fridge or a washing machine due to insufficient electrical power capacity. On the other hand, a large number of the surveyed displaced Syrians living in Non IS, mainly in the Bekaa and North regions, have the same living conditions as those living in IS shelters (no fridge or washing machine). Therefore, it is worth highlighting that the power consumption will increase if sufficient capacity of power supply is provided to the displaced Syrians in Lebanon.
Power Consumption of Displaced Syrians in Lebanon per Caza (UNHCR Data as of June 30, 2016) - North Region
Power Consumption of Displaced Syrians in Lebanon per Caza (UNHCR Data as of June 30, 2016) - South Region
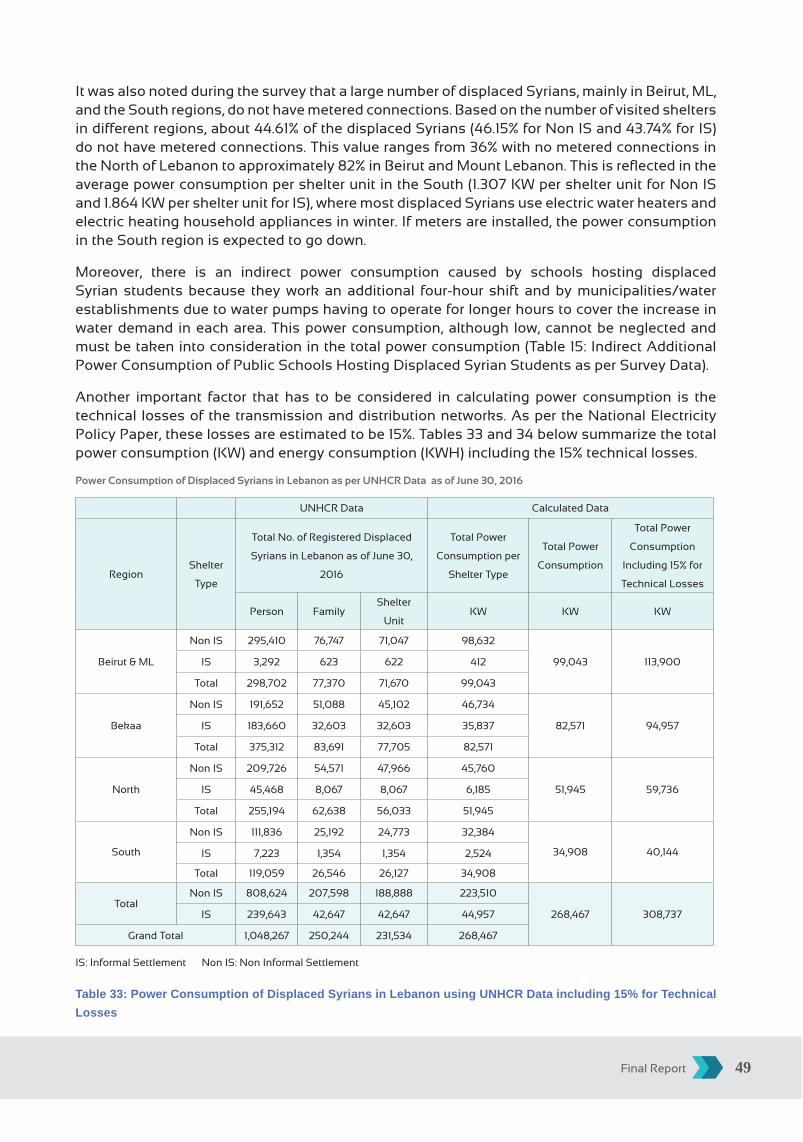
Final Report 49
It was also noted during the survey that a large number of displaced Syrians, mainly in Beirut, ML, and the South regions, do not have metered connections. Based on the number of visited shelters in different regions, about 44.61% of the displaced Syrians (46.15% for Non IS and 43.74% for IS) do not have metered connections. This value ranges from 36% with no metered connections in the North of Lebanon to approximately 82% in Beirut and Mount Lebanon. This is reflected in the average power consumption per shelter unit in the South (1.307 KW per shelter unit for Non IS and 1.864 KW per shelter unit for IS), where most displaced Syrians use electric water heaters and electric heating household appliances in winter. If meters are installed, the power consumption in the South region is expected to go down.
Moreover, there is an indirect power consumption caused by schools hosting displaced Syrian students because they work an additional four-hour shift and by municipalities/water establishments due to water pumps having to operate for longer hours to cover the increase in water demand in each area. This power consumption, although low, cannot be neglected and must be taken into consideration in the total power consumption (Table 15: Indirect Additional Power Consumption of Public Schools Hosting Displaced Syrian Students as per Survey Data).
Another important factor that has to be considered in calculating power consumption is the technical losses of the transmission and distribution networks. As per the National Electricity Policy Paper, these losses are estimated to be 15%. Tables 33 and 34 below summarize the total power consumption (KW) and energy consumption (KWH) including the 15% technical losses.
Power Consumption of Displaced Syrians in Lebanon as per UNHCR Data as of June 30, 2016
UNHCR Data Calculated Data
RegionShelter
Type
Total No. of Registered Displaced
Syrians in Lebanon as of June 30,
2016
Total Power
Consumption per
Shelter Type
Total Power
Consumption
Total Power
Consumption
Including 15% for
Technical Losses
Person FamilyShelter
UnitKW KW KW
Beirut & ML
Non IS 295,410 76,747 71,047 98,632
99,043 113,900IS 3,292 623 622 412
Total 298,702 77,370 71,670 99,043
Bekaa
Non IS 191,652 51,088 45,102 46,734
82,571 94,957IS 183,660 32,603 32,603 35,837
Total 375,312 83,691 77,705 82,571
North
Non IS 209,726 54,571 47,966 45,760
51,945 59,736IS 45,468 8,067 8,067 6,185
Total 255,194 62,638 56,033 51,945
South
Non IS 111,836 25,192 24,773 32,384
34,908 40,144IS 7,223 1,354 1,354 2,524
Total 119,059 26,546 26,127 34,908
TotalNon IS 808,624 207,598 188,888 223,510
268,467 308,737IS 239,643 42,647 42,647 44,957
Grand Total 1,048,267 250,244 231,534 268,467
IS: Informal Settlement Non IS: Non Informal Settlement
Table 33: Power Consumption of Displaced Syrians in Lebanon using UNHCR Data including 15% for Technical Losses
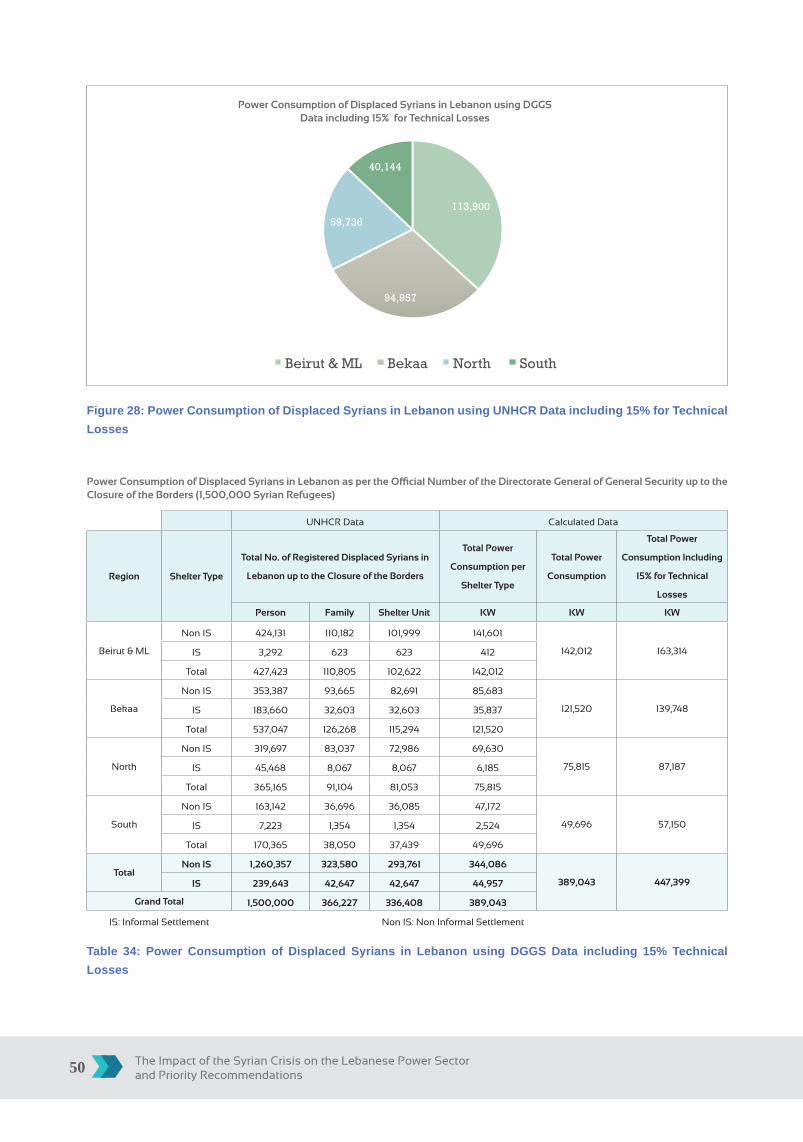
The Impact of the Syrian Crisis on the Lebanese Power Sector and Priority Recommendations50
113,900
94,957
59,736
40,144
Beirut & ML Bekaa North South
Figure 28: Power Consumption of Displaced Syrians in Lebanon using UNHCR Data including 15% for Technical Losses
Power Consumption of Displaced Syrians in Lebanon as per the Official Number of the Directorate General of General Security up to the Closure of the Borders (1,500,000 Syrian Refugees)
UNHCR Data Calculated Data
Region Shelter Type
Total No. of Registered Displaced Syrians in
Lebanon up to the Closure of the Borders
Total Power
Consumption per
Shelter Type
Total Power
Consumption
Total Power
Consumption Including
15% for Technical
Losses
Person Family Shelter Unit KW KW KW
Beirut & ML
Non IS 424,131 110,182 101,999 141,601
142,012 163,314IS 3,292 623 623 412
Total 427,423 110,805 102,622 142,012
Bekaa
Non IS 353,387 93,665 82,691 85,683
121,520 139,748IS 183,660 32,603 32,603 35,837
Total 537,047 126,268 115,294 121,520
North
Non IS 319,697 83,037 72,986 69,630
75,815 87,187IS 45,468 8,067 8,067 6,185
Total 365,165 91,104 81,053 75,815
South
Non IS 163,142 36,696 36,085 47,172
49,696 57,150IS 7,223 1,354 1,354 2,524
Total 170,365 38,050 37,439 49,696
TotalNon IS 1,260,357 323,580 293,761 344,086
389,043 447,399IS 239,643 42,647 42,647 44,957
Grand Total 1,500,000 366,227 336,408 389,043
IS: Informal Settlement Non IS: Non Informal Settlement
Table 34: Power Consumption of Displaced Syrians in Lebanon using DGGS Data including 15% Technical Losses
Power Consumption of Displaced Syrians in Lebanon using DGGS Data including 15% for Technical Losses

Final Report 51
163,314
139,748
87,187
57,150
Beirut & ML Bekaa North South
Power Consumption of Displaced Syrians in Lebanon using UNHCR Data including 15% for Technical Losses
Figure 29: Power Consumption of Displaced Syrians in Lebanon using DGGS Data including 15% for Technical Losses
The Impact of the Syrian Crisis on the Lebanese Power Sector and Priority Recommendations52
7. IMPLICATIONS OF THE SYRIAN CRISIS ON THE ELECTRICITY IN LEBANON
The implications of the Syrian Crisis on the electricity sector in Lebanon can be summarized as follows:
• Additional burden on the already deteriorated electricity network as a result of the increased demand.
• Impact on quality of the supplied power due to the increased load in some areas where people are suffering from voltage drop and are forced to use their diesel generators even during supply hours.
• Indirect impact of the additional power consumption of the schools hosting displaced Syrian students caused by the additional four-hour shift the schools need to work.
• Additional power consumption of some municipalities/water establishments that are operating their water pumps for longer hours to cover the additional water demand as a result of the displaced Syrians.
• Damage of the distribution transformers and/or MV and LV cables due to overload.
• Increase of the non-technical losses and damage to the distribution network caused by the Non-Metered connections of a large portion of the Syrian shelters.
• The 486 MW caused by the direct and indirect additional power consumption illustrated in Tables 15, 16, and 34 has a major implication on EDL’s grid that is already suffering from a shortage in generation capacities.
Final Report 53
8. RECOMMENDATIONS AND PRIORITIZATION OF INTERVENTIONS
Lebanese citizens have been suffering from extensive load shedding of at least three hours in the Beirut governorate and up to twelve hours a day outside of Beirut. In addition to the shortage in the installed generation capacity, the increased electricity demand caused by the Syrian crisis has put an additional burden on the transmission and distribution networks. MOEW, in collaboration with EDL, managed to increase the generation capacity by about 440 MW through the rehabilitation of one generation plant and rental of two power barges. These power plants are operational since 2012. Lebanese citizens did not benefit from this improvement and load shedding hours remained the same because the additional generation capacity is being consumed by the displaced Syrians in Lebanon.
From the calculated results of power consumption of the displaced Syrians in Lebanon per caza, preliminary recommendations and prioritization of interventions to alleviate the implications on electricity in Lebanon from the current Syrian Crisis are listed below.
8.1 General Recommendations
1. Demand side management through projects that help reduce power demand such as energy efficiency measures across various Lebanese sectors. Examples of such projects are:
• Replacing existing high (or low) pressure sodium street lighting bulbs with energy saving bulbs (example LED lighting with lightning and voltage-surge protection).
• Distributing energy-saving light bulbs to the displaced Syrians to reduce their power consumption.
• Using solar water heaters.
• Encouraging the use of solar powered water pumps.
2. Installation of solar water heater systems in households of vulnerable Lebanese and displaced Syrians living in Non IS (where applicable and/or technical feasible), in line with NEEAP 2016 (initiative 4).1
3. Across Lebanon, large scale grid-connected photovoltaic (PV) Plants would be an optimal intervention.
4. Refurbishment of the existing hydro plants and/or construction of new hydro plants to increase generation capacity (CEDRO, 2013).
5. Encourage Net-Metering by supporting mainly industrial and commercial bulk customers to go for Renewable Energy (PV or Wind). The adopted net-metering context in Lebanon allows the rollover of exported electricity within billing months of any one year, yet nulls any exports after the 1-year term. It is a low-cost and easily administered means of promoting direct customer investment and involvement in renewable energy.Moreover, the voltage level on the low voltage network is low in many areas. In a previous study conducted in 2014 (AEMS, 2014), under voltage was also observed on the Medium Voltage network, mainly outside of Beirut and Mount Lebanon Areas. The situation is more critical in remote areas, especially
1 For example, solar hot water systems can only apply to homes that use running water, heat water for bathing using electrical heaters, and/or have the roof space and structural integrity to accommodate these types of equipment.

The Impact of the Syrian Crisis on the Lebanese Power Sector and Priority Recommendations54
in Nabatieh, North of Bekaa, Akkar, and Halba. It is strongly recommended to encourage the use of capacitor banks at the customer end, mainly bulk industrial customers. Capacitor banks help in improving the power factor by reducing the reactive power (VAR) consumed by these customers (hence help them reduce their electricity bills) and in maintaining an overall better voltage level in the nearby area. Detailed studies should be conducted, on a case-by-case basis, for each area.
6. Reinforcement of EDL distribution network through the installation of new MV/LV substations, and/or upgrading the existing MV/LV substations is also required in some areas to reduce technical losses and improve power quality and voltage level. Upgrading and reinforcement of the distribution network also requires the rehabilitation and upgrading of the transmission network firstly by upgrading the transmission capacity of the HV/MV substations (adding more power transformers and related bays), and secondly by reinforcing the overhead transmission lines (OHTL), either by creating new lines or upgrading the existing ones. The two actions (for distribution and transmission) are inter-related. Working on one sector while disregarding the other sector will not lead to the required results in the long run.
8.2 Recommendations Specific to Water Pumping
1. Support the agricultural sector and the national Water Establishments to use renewable energy technology for irrigation (only when sources are legal and environmentally-sound2) and water distribution, respectively. Using PV-Direct Water Pumping technology can do this. PV-direct technology is a simple PV system that supplies the load directly from a PV module or array and operates only when the sun is shining, which is very suitable for the agricultural sector and water establishments. The advantage of a PV-direct system is that it is much less expensive and easier to install than battery-based or grid-tied designs. No batteries, charge controllers, or inverters are required which reduces cost and increases efficiency.
The most common PV-direct application is solar water pumping for irrigation and domestic use. Since water tanks are much cheaper than battery banks and have a longer lifespan, no batteries are required because water tanks can be filled on sunny days. A PV-direct system works well if enough water is stored to cover the demand on days without sun.
In the case of most Lebanese areas, and because of intermittent load shedding, citizens tend to run the water pumps during EDL grid power supply, which causes a further deterioration of the power quality, mainly lower voltages at the end of the medium voltage lines. Hence, PV water pumping will not only serve to supply water for required use, but will also indirectly help in maintaining an improved voltage level.
It is important to note that PV-direct pumping cannot be used to provide domestic water pressure, but can be used to fill a tank. Domestic water pressure requires a water pressure-pump system that is used to push stored water to the houses.
2 The feasibility and applicability of solar pumping for irrigation has to be carefully studied since most sources of water used for irrigation are groundwater which is not a sustainable practice and therefore encouraging the use of solar power for pumping may have negative environmental impacts. Furthermore, this type of technology must be used with caution.
Final Report 55
8.3 Recommendations Specific to Decentralized Power Generation
1. For areas with small and medium power demand (up to 10 MW), decentralized solutions such as Distributed Generation Resources (DER) is recommended. Conventional power stations and large-scale solar power plants are considered centralized and often require electricity to be transmitted over long distances. DER systems are decentralized and flexible technologies located close to the load they serve. It is a demand-side technology driven by consumers and can be tailored to meet the end user needs without having to worry about the entire system (Newcomb, J. and Paulos, B. 2013).
DER, also known as distributed energy or On-Site Generation, is a new technology that includes energy efficiency, demand response, and distributed generation and storage. It is basically generating renewable energy, using PV Plants or Wind Farms or can be a Hybrid power system that comprises multiple generation and storage components, within a community to avoid the expensive and inefficient transmission of power and to reduce losses both in transmission and distribution networks. This is mainly because the most affected areas are those where the transmission sector is weak and high voltage substations are overloaded.
DER technology increases the efficiency and reliability of the power system and reduces costs and losses.15 DER systems can be installed on LV networks to serve a single customer, support delivery of clean and reliable power, and reduce the technical losses, or it can be installed on the MV network and be part of the grid to serve multiple customers or a major industrial facility. The disadvantage of DER systems is their limited capacities of up to 10 megawatts (MW) (Wikipedia).
In the residential sector, common DER systems may include one or more of the following resources:
» Solar photovoltaic panels
» Small wind turbines
» Natural-gas-fired fuel cells
In the commercial and industrial sectors, distributed generation can include resources such as:
» Combined heat and power systems
» Solar photovoltaic panels
» Wind Farms
» Hydropower
» Biomass combustion
» Municipal solid waste incineration
Recommended areas to install DER systems are Hermel, Rachaya, West Bekaa, and other cazas where total power consumption of displaced Syrians is less than 10 MW.
2. In some regions like West Bekaa and Akkar, wind farms are recommended to produce the required power demand per caza where the minimum wind speed required to start rotating the smallest wind turbines is maintained most of the time.
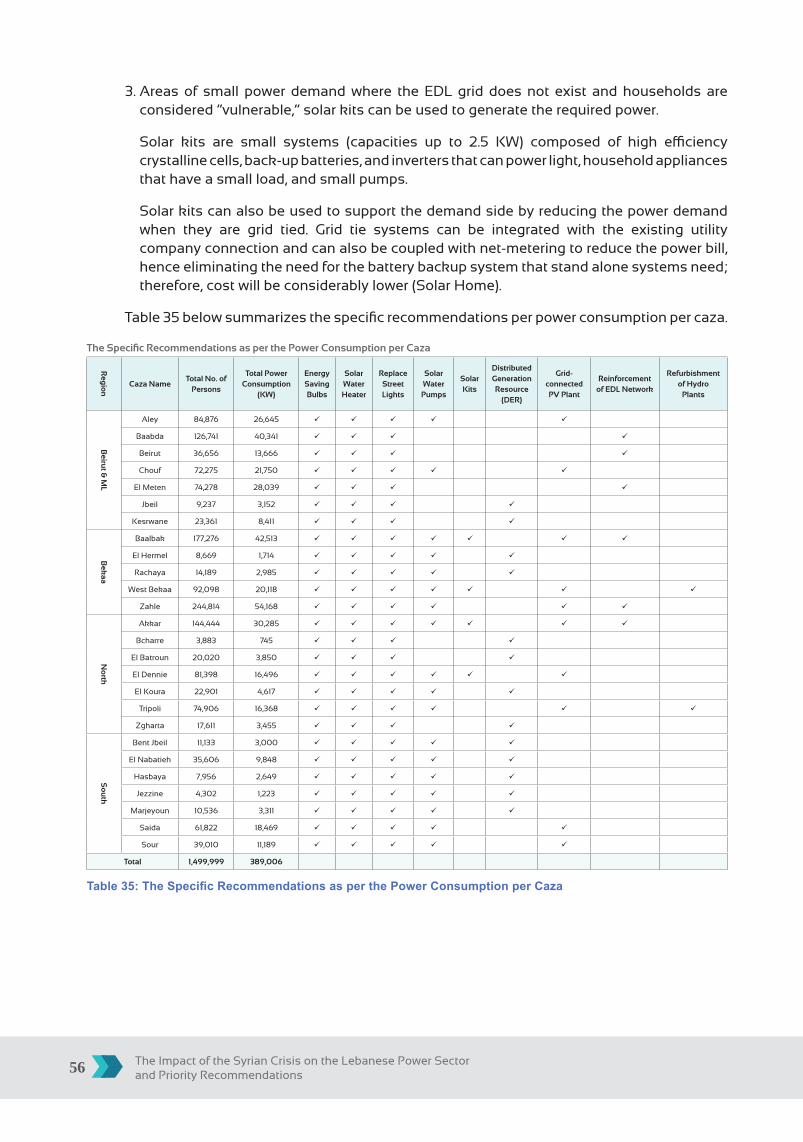
The Impact of the Syrian Crisis on the Lebanese Power Sector and Priority Recommendations56
3. Areas of small power demand where the EDL grid does not exist and households are considered “vulnerable,” solar kits can be used to generate the required power.
Solar kits are small systems (capacities up to 2.5 KW) composed of high efficiency crystalline cells, back-up batteries, and inverters that can power light, household appliances that have a small load, and small pumps.
Solar kits can also be used to support the demand side by reducing the power demand when they are grid tied. Grid tie systems can be integrated with the existing utility company connection and can also be coupled with net-metering to reduce the power bill, hence eliminating the need for the battery backup system that stand alone systems need; therefore, cost will be considerably lower (Solar Home).
Table 35 below summarizes the specific recommendations per power consumption per caza.
The Specific Recommendations as per the Power Consumption per Caza
Reg
ion
Caza NameTotal No. of
Persons
Total Power Consumption
(KW)
Energy Saving Bulbs
Solar Water Heater
Replace Street Lights
Solar Water
Pumps
Solar Kits
Distributed Generation Resource
(DER)
Grid-connected PV Plant
Reinforcement of EDL Network
Refurbishment of Hydro
Plants
Beiru
t & M
L
Aley 84,876 26,645 ü ü ü ü ü
Baabda 126,741 40,341 ü ü ü ü
Beirut 36,656 13,666 ü ü ü ü
Chouf 72,275 21,750 ü ü ü ü ü
El Meten 74,278 28,039 ü ü ü ü
Jbeil 9,237 3,152 ü ü ü ü
Kesrwane 23,361 8,411 ü ü ü ü
Bek
aa
Baalbak 177,276 42,513 ü ü ü ü ü ü ü
El Hermel 8,669 1,714 ü ü ü ü ü
Rachaya 14,189 2,985 ü ü ü ü ü
West Bekaa 92,098 20,118 ü ü ü ü ü ü ü
Zahle 244,814 54,168 ü ü ü ü ü ü
No
rth
Akkar 144,444 30,285 ü ü ü ü ü ü ü
Bcharre 3,883 745 ü ü ü ü
El Batroun 20,020 3,850 ü ü ü ü
El Dennie 81,398 16,496 ü ü ü ü ü ü
El Koura 22,901 4,617 ü ü ü ü ü
Tripoli 74,906 16,368 ü ü ü ü ü ü
Zgharta 17,611 3,455 ü ü ü ü
So
uth
Bent Jbeil 11,133 3,000 ü ü ü ü ü
El Nabatieh 35,606 9,848 ü ü ü ü ü
Hasbaya 7,956 2,649 ü ü ü ü ü
Jezzine 4,302 1,223 ü ü ü ü ü
Marjeyoun 10,536 3,311 ü ü ü ü ü
Saida 61,822 18,469 ü ü ü ü ü
Sour 39,010 11,189 ü ü ü ü ü
Total 1,499,999 389,006
Table 35: The Specific Recommendations as per the Power Consumption per Caza
Final Report 57
8.4 Prioritization
• Prioritization of the interventions should be given to the most vulnerable areas such as:
• Areas of high concentration of affected residents where there is no EDL grid and/or have insufficient capacity to operate the basic household appliances such as a fridge or a washing machine. Examples are Akkar, West Bekaa, and El Dennie.
• Areas of high concentration of displaced Syrians such as Baalbak, West Bekaa, Akkar, Tripoli, El Dennie, and Saida.
• Areas where recommended interventions are easy to install, such as solar kits and solar water heaters, to reduce the power demand on the grid. Examples are Baalbak, El Hermel, Rachaya, West Bekaa, Zahle, Akkar, El Dennie, Tripoli, En Nabatieh, Saida, and Sour.
The Impact of the Syrian Crisis on the Lebanese Power Sector and Priority Recommendations58
ANNEXES
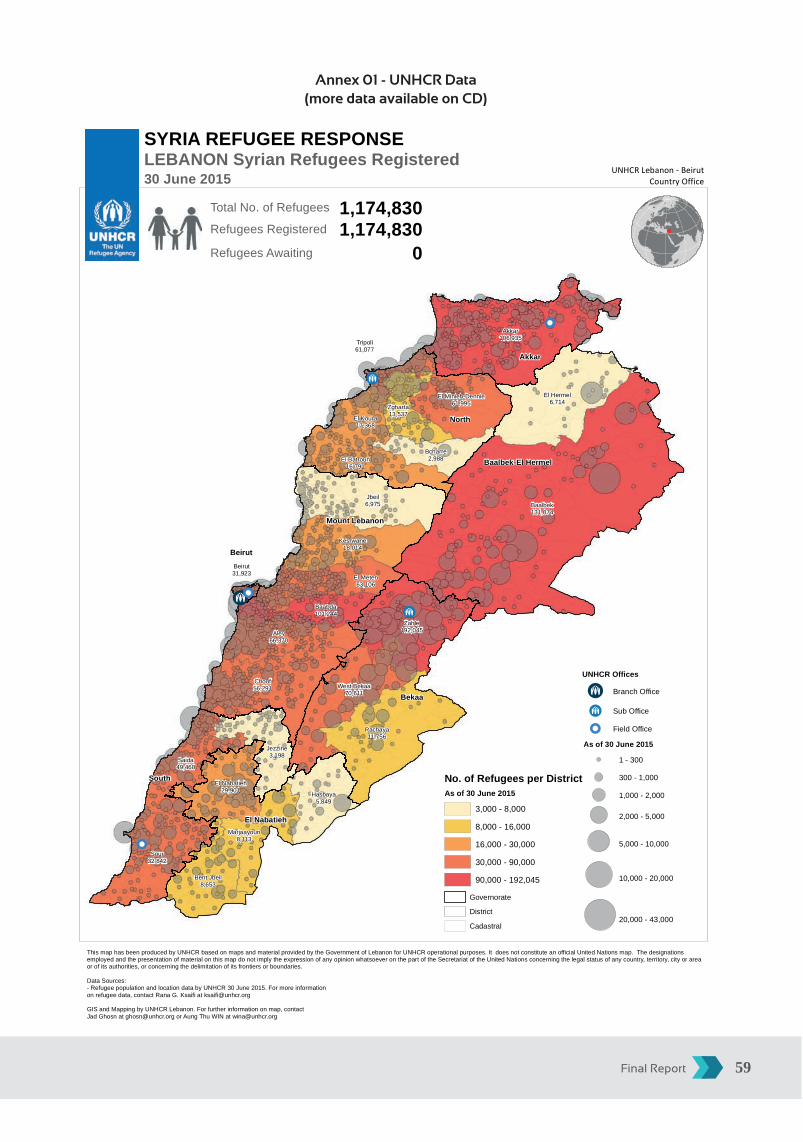
Final Report 59
Annex 01 - UNHCR Data(more data available on CD)
Bekaa
North
Baalbek-El Hermel
South
Akkar
Mount Lebanon
El Nabatieh
Beirut
Baalbek131,074
Akkar106,935
Jbeil6,975
Chouf56,291
Rachaya11,756
Sour32,842
El Hermel6,714
Zahle192,045
Saida49,460
Aley66,370
West Bekaa70,611
Kesrwane18,014
Jezzine3,198
El Meten63,106
Hasbaya5,849
Bent Jbeil8,653
El Batroun16,791
El Nabatieh29,901
Baabda101,244
Zgharta13,537
Marjaayoun8,113
El Minieh-Dennie61,995
Bcharre2,988
El Koura17,368
Tripoli61,077
Beirut31,923
1,174,830Refugees Registered
Total No. of Refugees 1,174,830
Refugees Awaiting 0
UNHCR Lebanon - BeirutCountry Office
SYRIA REFUGEE RESPONSELEBANON Syrian Refugees Registered30 June 2015
UNHCR Offices
Branch Office
Sub Office
Field Office
As of 30 June 2015
1 - 300
300 - 1,000
1,000 - 2,000
2,000 - 5,000
5,000 - 10,000
10,000 - 20,000
20,000 - 43,000
Governorate
District
Cadastral
No. of Refugees per DistrictAs of 30 June 2015
3,000 - 8,000
8,000 - 16,000
16,000 - 30,000
30,000 - 90,000
90,000 - 192,045
This map has been produced by UNHCR based on maps and material provided by the Government of Lebanon for UNHCR operational purposes. It does not constitute an official United Nations map. The designationsemployed and the presentation of material on this map do not imply the expression of any opinion whatsoever on the part of the Secretariat of the United Nations concerning the legal status of any country, territory, city or areaor of its authorities, or concerning the delimitation of its frontiers or boundaries.
Data Sources:- Refugee population and location data by UNHCR 30 June 2015. For more informationon refugee data, contact Rana G. Ksaifi at [email protected]
GIS and Mapping by UNHCR Lebanon. For further information on map, contactJad Ghosn at [email protected] or Aung Thu WIN at [email protected]

The Impact of the Syrian Crisis on the Lebanese Power Sector and Priority Recommendations60
Annex 02 - Survey Data(more data available on CD)

Final Report 61
Annex 03 – Data Validation
• The UNHCR data is used in calculating the average number of persons per family in each region and the total power consumption of the displaced Syrians. Furthermore, the list of the number of displaced Syrians living in Informal Settlements is utilized to segregate the number of displaced Syrians living in Non IS and IS and the percentage of the displaced Syrians living in each shelter type. Power consumption is then calculated for the total number of displaced Syrians living in Non IS and IS respectively in each region.
• The extrapolated data obtained in step 1 above is then used to calculate the total power consumption of the displaced Syrians using the DGGS figure of 1,500,000 persons.
• Survey data is used in calculating the total connected load (TCL) of the household appliances in each visited sample as per the standard power consumption values of typical household appliances (Daftlogic).
• The average connected load for Non IS and IS is then calculated by taking the average of the TCL for each shelter type of the visited samples in each region. A sample of the survey data sheet is shown in Table 17 (featured in chapter 3 section 3.4 Data Validation & Analysis).
• Since power consumption is calculated per shelter unit irrespective of the number of persons or the number of families living in it, the survey data is also used to convert the number of families living in Non IS into number of shelter units based on the number of families living in each shelter unit in each region.
• The alternative approach to calculate power consumption of the displaced Syrians in Lebanon was supposed to be done by calculating the increase in load on the MV feeders of EDL distribution network in all areas taking the year 2012 as the base year and correlating the increase in load on each MV feeder with the number of displaced Syrians living in the villages supplied by each MV feeder all the while taking into account the increase in number of EDL customers resulting from the normal Lebanese population growth using GIS data to identify the villages supplied by each MV feeder. Due to incompleteness of EDL data, this approach was implemented in the South region only where data, to some extent, was found complete. This is done using the econometric and statistical methodologies to calculate the increase in load on the MV feeders supplying the South region and correlating it to the number of the displaced Syrians in the villages supplied by these feeders taking into consideration the increase in load due to the increase in the number of EDL customers resulting from the normal Lebanese population growth. Details and results of this approach are presented in “Section 4: Econometrics and Statistical Analysis”.

The Impact of the Syrian Crisis on the Lebanese Power Sector and Priority Recommendations62
Annex 04 – Econometric Analysis (Methodology)
• Actual peak load quarterly data, for the years 2012 - 2015 and two quarters of 2016, are used to validate the power consumption calculated using the survey data.
• Data for the entire South region is analyzed to calculate the average peak load and the average peak power consumption per family.
• In each case, the quarterly data is used to calculate a seasonal index for each quarter.
• The seasonal indices are used to remove the seasonality from the quarterly data as described in the following section.
• The quarterly data is then adjusted to continuous rather than seasonal operation (deseasonalized) (Econometrics for Dummies and Merriam Webster) and used to calculate the average load for each year.
• The average annual loads are then adjusted to account for population growth in Lebanon. The population growth rate per year is based on World Bank estimates that were last measured at 1.18% in 2014 (Trading Economies, 2016 and Index Mundi, 2016). A study, approved by EDL (Network Load Forecast - 2013_02_28 NLF_Rev02), was compiled in 2013 in order to forecast the load growth in the distribution network of new forecasted customers for the purpose of load flow analysis, feeder utilization, and network reinforcement.
• Using 2012 as a base year, the changes in the adjusted average annual loads are considered along with the number of families in the villages powered by each MV feeder, or by all MV feeders in the South region, to calculate the average peak power consumption per family for the years 2013 - 2016.

Final Report 63
Annex 05 – Power Consumption Calculation Methodology
• The average power consumption for Non IS and IS shelter types is calculated using the survey data and validated using EDL data.
• The average connected load of household appliances per shelter unit is calculated based on the available household appliances in each visited shelter unit in each region using the standard values of power consumption of typical household appliances as shown in “Table 17: Sample of Survey Data Sheet.”
• Since average power consumption is calculated per shelter unit, irrespective of the number of persons or number of families in each shelter unit, the number of families of displaced Syrians living in Non IS shelter type had to be converted to the number of shelter units using the survey data shown in Tables 6 to Tables 13 of section “3.3 Survey Findings.”
• The number of families and number of persons, as of June 30, 2016, provides UNHCR data of displaced Syrians in Lebanon. The number of families of displaced Syrians living in Non IS shelter type is converted to the number of shelter units using the percentages calculated in Tables 6 to Tables 13 of section “3.3 Survey Findings.” The results are given in Table 36 below.
RegionShelter
Type
No. of Displaced Syrians in
Lebanon Registered with
UNHCR as of June 30, 2016
% of IS from Total
Displaced Syrians in
Lebanon
Additional 7% of Non
Registered Displaced
Syrians Living in IS
Total No. of Displaced Syrians in Lebanon
Registered with UNHCR as of June 30, 2016
Person Family Person Family Person Family Person Family Shelter Unit
Beirut &
ML
Non IS 295,410 76,747 0 0 295,410 76,747 71,047
IS 3,077 582 0.30% 0.24% 215 41 3,292 623 623
Total 298,487 77,329 215 41 298,702 77,370 71,670
Bekaa
Non IS 191,652 51,088 0 0 191,652 51,088 45,102
IS 171,645 30,470 16.62% 12.31% 12,015 2,133 183,660 32,603 32,603
Total 363,297 81,558 12,015 2,133 375,312 83,691 77,705
North
Non IS 209,726 54,571 0 0 209,726 54,571 47,966
IS 42,493 7,539 4.12% 3.05% 2,975 528 45,468 8,067 8,067
Total 252,219 62,110 2,975 528 255,194 62,638 56,033
South
Non IS 111,836 25,192 0 0 111,836 25,192 24,773
IS 6,750 1,265 0.65% 0.51% 473 89 7,223 1,354 1,354
Total 118,586 26,457 473 89 119,059 26,546 26,127
Total
Non IS 808,624 207,598 0 0 808,624 207,598 188,888
IS 223,965 39,856 21.69% 16.11% 15,678 2,790 239,643 42,647 42,647
Total 1,032,589 247,454 1,048,267 250,244 231,534
Table 36: Number of Displaced Syrian Families, Persons, and Shelter units in Lebanon as of June 30, 2016
• UNHCR data of displaced Syrians living in IS as of August 31, 2016 is already given by the number of tents and number of individuals. Since average power consumption is calculated per shelter unit, the number of tents in UNHCR data is considered to be the number of shelter units in each region regardless of the number of persons living in each tent.
• In this case study, a Diversity Factor of 0.70 and a Demand Factor of 0.7 is used to calculate the power consumption of the displaced Syrians living in Non IS shelter type. For small residential loads <0.25 KW, a unity Diversity Factor and unity Demand Factor is applied to calculate the power consumption of the displaced Syrians living in IS shelter. Power consumption of the displaced Syrians in Lebanon living in Non IS is the product of the Demand Factor, the Diversity Factor, and the Total Connected Load.

The Impact of the Syrian Crisis on the Lebanese Power Sector and Priority Recommendations64
Annex 06 – Diversity Factor (EDL MEMO)(more data available on CD)

Final Report 65
Annex 07 - Total Power Consumption(more data available on CD)
• The power consumption in KW of the displaced Syrians in Lebanon for Non IS and IS in each region is the product of the average power consumption per shelter unit and the number of units in each shelter type in each region.
• Number of displaced Syrians in Lebanon as per the UNHCR data is 1,032,589 persons as of June 30, 2016 with an additional estimate of 7% of displaced Syrians living in IS shelters who are still not registered with the UNHCR. Hence, the total number of the displaced Syrians in Lebanon is 1,048,267 persons.
• The actual number of displaced Syrians in Lebanon as per the Directorate General of General Security (DGGS) is 1,500,000 persons. Some governmental sources estimate +10% to +23% in illegal entrances, but there is no official counting at the borders to verify them.
• The number of displaced Syrians in Lebanon provided by DGGS (1,500,000) is broken down into number of families and number of shelter units both in Non IS and IS using the extrapolated data obtained from both the UNHCR and the survey data.
• The total power consumption in KW of the total displaced Syrians in Lebanon for Non IS and IS is calculated by summing up the power consumption of each region.
• The total energy consumption in KWH of the total displaced Syrians in Lebanon for Non IS and IS is the product of the total power consumption calculated in step 5 multiplied by the average number of supply hours per day in each region.
The Impact of the Syrian Crisis on the Lebanese Power Sector and Priority Recommendations66
Annex 08 - Total Energy Consumption(more data available on CD)

Final Report 67
Annex 09 - Power Consumption per Caza (more data available on CD)

The Impact of the Syrian Crisis on the Lebanese Power Sector and Priority Recommendations68

Final Report 69
Annex 10 - Statistics and Econometrics Data (more data available on CD)
Methodology
• Actual peak load quarterly data, for the years 2012 - 2015 and two quarters of 2016, are used to validate the power consumption estimate based on the survey data.
• Data for the entire South region as well as four representative feeders are analyzed to calculate the average consumption per family.
• In each case, the quarterly data are used to calculate a seasonal index for each quarter.
• The seasonal indices are used to remove the seasonality from the quarterly data.
• The average load for each year is calculated based on the deseasonalized quarterly data.
• The average annual loads are then adjusted to account for the population growth in Lebanon. The population growth rate per year are based on World Bank estimates.
• Using 2012 as a base year, the changes in the adjusted average annual loads are considered along with the number of families in the villages powered by a feeder, or by all feeders in the South region, to calculate the average power consumption per family for the years 2013 - 2016.

The Impact of the Syrian Crisis on the Lebanese Power Sector and Priority Recommendations70
The quarterly seasonal indexes are determined in seven steps. A detailed explanation of the steps is given below and the results are listed in Table 20. Columns 1 and 2 of Table 20 list the quarters of years 2012 to 2016 and the corresponding quarterly loads.
Step 1. The four-quarter moving total for 2012 is first determined. Starting with the first quarter of 2012, the loads 20,162, 18,993, 22,739 and 19,810 are added. The total is 81,703 AMP. Moving along, the four-quarter total is computed for the spring, summer, and fall loads of 2012 to the winter load of 2013. The total is 84,180 AMP. This process is repeated for the remaining quarterly loads. Column 3 of Table 20 lists all of the moving totals. Note that the moving total 81,703 Amps is centered between the spring and summer of 2012. The next moving total, 84,180 Amps, is positioned between loads for summer and fall of 2012, and so on.
Step 2. Each quarterly moving total in column 3 is divided by 4 to give the four-quarter moving average. The four-quarter moving averages are presented in column 4. Note that all the moving averages are still positioned between the quarters. For instance, the first moving average, 20,426 Amps, is positioned between spring and summer of 2012.
Step 3. Next, the moving averages are centered. The first centered moving average is calculated by averaging (20,426 + 21,045)/2 = 20,735 and centered opposite summer 2013. The second moving average is found by (21,045 + 21,809)/2 = 21,427. The others are found in a similar way and listed in column 5. Note that a centered moving average is now positioned on a particular quarter.
Step 4. The specific seasonal index for each quarter is then computed (column 6) by dividing the load in column 2 by the centered moving average in column 5. The specific seasonal reports the ratio of the original time series value to the moving average. The specific seasonal for the summer quarter of 2012 is calculated to be 1.0966 (22,739/20,735).
Step 5. The specific seasonal indexes are organized in column 6. This column helps in locating the specific seasonality for the corresponding quarters. The values 1.0966, 1.1152, 1.0468, and 1.1120 all represent estimates of the typical seasonal index for the summer quarter. A reasonable method to find a typical seasonal index is to average these values. So the typical index for the summer quarter is calculated by (1.0966 + 1.1152 + 1.0468 + 1.1120)/4 = 1.0927. The typical seasonal indices for the fall, winter, and spring quarters are calculated in a similar way and the results are listed in column 7.
Step 6. The four quarterly means (1.0927, 0.9317, 0.9818, and 0.9828) should theoretically total 4.00 because the average is set at 1.0. The total of the four quarterly means may not be exactly equal to 4.00 due to rounding. In this case, the total of the means is 3.9889. A correction factor of 4/3.9889 is therefore multiplied by each of the four means to force them to total 4.00. The adjusted quarterly seasonal indices (1.0957, 0.9342, 0.9846, and 0.9855), now totaling to exactly 4.000, are listed in column 8 and repeated for each year.
Step 7. The deseasonalized loads, listed in column 9, are calculated by dividing each quarterly load in column 2 by the corresponding actual seasonal index in column 8. After removing the seasonality from each quarterly data, the trend in the quarterly loads is analyzed.

Final Report 71
Column 1
Year
&
Quarter
Column 2
Loads
(Amp)
Column 3
Four
Quarter
Total
Column 4
Four
Quarter
Moving
Average
Column 5
Centered
Moving
Average
Column 6
Specific
Seasonality
Column 7
Seasonal
Index
Column 8
Adjusted
Seasonal
Index
Column 9
De-
Seasonalized
Load
(Amp)
2012 Q1 20,162
2012 Q2 18,993 0.9855 19,272
81,703 20,426
2012 Q3 22,739 20,735 1.0966 1.0927 1.0957 20,753
84,180 21,045
2012 Q4 19,810 21,427 0.9245 0.9317 0.9342 21,204
87,238 21,809
2013 Q1 22,638 22,251 1.0174 0.9818 0.9846 22,993
90,768 22,692
2013 Q2 22,051 23,182 0.9512 0.9828 0.9855 22,375
94,690 23,672
2013 Q3 26,270 23,556 1.1152 1.0957 23,975
93,759 23,440
2013 Q4 23,731 23,721 1.0004 0.9342 25,402
96,009 24,002
2014 Q1 21,707 23,786 0.9126 0.9846 22,048
94,283 23,571
2014 Q2 24,301 23,414 1.0379 0.9855 24,659
93,027 23,257
2014 Q3 24,543 23,445 1.0468 1.0957 22,399
94,534 23,633
2014 Q4 22,476 23,270 0.9659 0.9342 24,058
91,625 22,906
2015 Q1 23,214 22,859 1.0155 0.9846 23,578
91,250 22,812
2015 Q2 21,393 22,302 0.9592 0.9855 21,707
87,164 21,791
2015 Q3 24,167 21,732 1.112 1.0957 22,057
86,696 21,674
2015 Q4 18,390 22,003 0.8358 0.9342 19,685
89,330 22,332
2016 Q1 22,745 0.9846 23,102
2016 Q2 24,027 0.9855 24,380
2016 Q3 1.0957
2016 Q4 0.9342
Table 20: South Region Quarterly Deseasonalized Loads (AMP)

The Impact of the Syrian Crisis on the Lebanese Power Sector and Priority Recommendations72
Average Power Consumption Per Family Based on EDL Data for the Entire South Region
The number of displaced Syrian families provided by the UNHCR are annual figures, except 2016. In order to have a common time reference, average annual loads are calculated (Column 2 of Table 21) based on the deseasonalized loads listed in Table 20. The trend in the average annual loads (Figure 8) is due to growth in the population and to additional consumption of the displaced Syrians. The average annual loads are then adjusted to account for a population growth of 1.222%, 1.180%, 1.182%, and 1.182%, per year for 2013, 2014, 2015 and 2016, respectively (Source: World Bank http://data.worldbank.org/indicator/SP.POP.GROW). The remaining trend is the power consumption of the displaced Syrians in the area. Calculations of all figures in Table 21 are detailed below.
Column 1
Year
Column 2
Average
Loads
(AMP)
Column 3
Population
Growth
Column 4
Estimated
Loads Base
Year 2012
(AMP)
Column 5
Load
Growth
Base Year
2012 (AMP)
Column 6
Adjusted
Average
Loads Per
Quarter
(AMP)
Column 7
Change in
Adjusted
Average
Annual
Loads
(AMP)
Column 8
Change in
Adjusted
Average
Annual Load
(KW)
Column 9
Change in
Number of
Families
(Base Year
2012)
Column 10
Average
Consumption
per Family (KW
with Base Year
2012)
2012 20,427 20,427 0 20,427
2013 23,686 1.222% 20,676 250 23,437 3,010 62,558 21,462 2.915
2014 23,291 1.180% 20,920 494 22,797 2,371 49,269 30,263 1.628
2015 21,757 1.182% 21,301 874 20,882 455 9,466 27,949 0.339
2016 23,741 1.182% 21,689 1,262 22,479 2,052 42,654 26,457 1.612
Average 1.623
Table 21: Average Peak Power Consumption per Family
Average Quarterly Load (AMP)
20,427
23,686
23,291
21,757
23,741
20,000
20,500
21,000
21,500
22,000
22,500
23,000
23,500
24,000
2012 2013 2014 2015 2016
Figure 8: Quarterly Load for the South Region (Amp)

Final Report 73
The calculations of values listed in Table 21 above are as follows:
Step 1. For each year, the quarterly deseasonalized loads (column 9 of Table 20) are averaged. The average load for 2012 is (20,478 + 19,272 + 20,753+ 21,204)/4 = 20,427. The calculated average loads are listed in column 2. The average for 2016 is based on the first two quarters.
Step 2. Column 3 shows the population growth rates for the years 2013, 2014, and 2015 (Source: World Bank http://data.worldbank.org/indicator/SP.POP.GROW). For 2016, the most recent rate is used.
Step 3. Using 2012 as a base year, the average load for each year is estimated based on the population growth rate. For instance, the estimate for 2013 is 20,427 + 1.222% (20,427) = 20,676. Similarly, the estimate for 2013 is the 20,676+ 1.180% (20,676) = 20,920, and so on. The results are shown in column 4.
Step 4. The annual increase due to population growth, with 2012 as a base year, is listed in column 5. These values are obtained by subtracting the estimate average load for each year from the load of 2012 in column 5.
Step 5. Subtracting each additional load due to population growth from the corresponding load in column 2 yields the adjusted loads. Increase in these adjusted loads is due to the power consumption of the displaced Syrians in the area. The calculated results are listed in column 6.
Step 6. The increase in loads (in AMP) relative to year 2012 are calculated by subtracting each load in column 7 from the load of 2012 in column 7.
Step 7. In column 8, the increase in loads (in AMP) is converted to KW using:
P (KW) = V*I*pf*√3 where V = 15KV and pf = 0.85
Step 8. The number of families of the displaced Syrians based on UNHCR data is listed in column 9.
Step 9. The average power consumption per family for the years 2013 to 2016 are presented in column 9.
Step 10. Averaging the values in column 9 to obtain a single estimate for the average power consumption of 1.6001 KW per family.

The Impact of the Syrian Crisis on the Lebanese Power Sector and Priority Recommendations74
LIST OF REFERENCES
Ø World Bank - Energy Efficiency Study in Lebanon, Final Report, September 2009
Ø The World Bank Report - Executive Summary - Lebanon: Economic and Social Impact Assessment of the Syrian Conflict, September 2013
Ø Climate Change, Lebanon’s INDC - http://climatechange.moe.gov.lb/indc
Ø UNHCR Data - Syrian Refugee Response - Lebanon Syrians Refugees Registered - 30 June 2015
Ø List of Informal Settlements, UNHCR Data - IAMP-29_ListofInformalSettlements_31_August_2016
Ø Number of Syrian Refugee Families and Individuals per Cadastral in Lebanon, UNHCR_LBN_REF_DAT_2016-06-30_00_SYRIANS_Refugee Population by CAS
Ø Centrifugal Pump Efficiency - What is Efficiency? - http://www.pumpsandsystems.com/topics/pumps/pumps/centrifugal-pump-efficiency-what-efficiency
Ø Energy Efficiency Considerations in Pumps and Pump Stations, 14 March 2014 - http://www.energy.wsu.edu/LinkClick.aspx?fileticket=t3ubiA8D8A4%3D&tabid=692&mid=1345
Ø List of the Power Consumption of Typical Household Appliances - https://www.daftlogic.com/information-appliance-power-consumption.htm
Ø How to Deseasonalize Time-Series Data - http://www.dummies.com/education/economics/econometrics/how-to-deseasonalize-time-series-data/
Ø Population Growth (annual %) - http://www.indexmundi.com/facts/indicators/SP.POP.GROW/compare?country=lb
Ø Population Growth (annual %) - http://data.worldbank.org/indicator/SP.POP.GROW?end=2015&start=1961&view=chart
Ø Electrical Engineer Portal, Demand Factor-Diversity Factor-Utilization Factor-Load Factor - http://electrical-engineering-portal.com/demand-factor-diversity-factor-utilization-factor-load-factor
Ø Diversity Vs. Demand - http://www.ecmag.com/section/codes-standards/diversity-vs-demand
Ø Electrical Notes & Articles, Demand Factor-Diversity Factor-Utilization Factor-Load Factor -https://electricalnotes.wordpress.com/2011/10/31/demand-factor-diversity-factor-utilization-factor-load-factor/
Ø Cedro, February 2013, Hydropower in Lebanon: History and Prospects. Available at:http://cedro-undp.org/content/uploads/Publication/141009092113199~Exchange%204.pdf
Final Report 75
Ø Diversity Vs. Demand - http://www.ecmag.com/section/codes-standards/diversity-vs-demand
Ø Diversity Factor - EDL Memo 226
Ø Distributed Energy: The Power Sector’s Wild Card - https://www.greentechmedia.com/articles/read/distributed-energy-the-power-sectors-wild-card
Ø Distributed Generation - https://en.wikipedia.org/wiki/Distributed_generation
Ø Alternative Energy Solutions, Solar Panel Kits, Off Grid Solar Kits - http://www.homedepot.com/p/Grape-Solar-400-Watt-Off-Grid-Solar-Panel-Kit-GS-400-KIT/203505963
Ø Solar Starter Kits - http://www.solarhome.org/solarstarterkits.asp
Ø List of Governmental Hospitals in Lebanon (Provided by MOPH)
Ø List of Schools Hosting Syrian Refugees Students (Provided by MEHE)
Ø PG-Tariff 2015 – 2016
Ø Daftlogic, Appliance Power Consumption, available at: https://www.daftlogic.com/information-appliance-power-consumption.htm
Ø Pumps and System, 2016, available at: http://www.pumpsandsystems.com/topics/pumps/pumps/centrifugal-pump-efficiency-what-efficiency
Ø Washington State University, 2016, available at: http://www.energy.wsu.edu/LinkClick.aspx?fileticket=t3ubiA8D8A4%3D&tabid=692&mid=1345
Ø Econometrics for dummies, available at: http://www.dummies.com/education/economics/econometrics/how-to-deseasonalize-time-series-data/
Ø Merriam Webster, 2016, available at: https://www.merriam-webster.com/dictionary/deseasonalize
Ø Trading Economies, 2016, Population Growth: Lebanon, available at: http://www.tradingeconomics.com/lebanon/population-growth-annual-percent-wb-data.html
Ø Index Mundi, 2016, available at: http://www.indexmundi.com/facts/indicators/SP.POP.GROW/compare?country=lb
Ø World Bank, 2015; Population Growth, available at: http://data.worldbank.org/indicator/SP.POP.GROW?end=2015&start=1961&view=chart
Ø Electrical Engineering Portal, 2016, available at: http://electrical-engineering-portal.com/demand-factor-diversity-factor-utilization-factor-load-factor
Ø Electrical Contractor: Power & Integrated Building Systems, 2016, Diversity versus demand, available at: http://www.ecmag.com/section/codes-standards/diversity-vs-demand
The Impact of the Syrian Crisis on the Lebanese Power Sector and Priority Recommendations76
Ø Electrical Notes, 2011, available at: https://electricalnotes.wordpress.com/2011/10/31/demand-factor-diversity-factor-utilization-factor-load-factor/
Ø AEMS, 12 June 2014. Global Investment Plan.
Ø Newcomb, J. and Paulos, B. November 2013. Distributed Energy: The Power Sector’s Wild Card. Published in: GTM: A Wood Mackenzie Business. Available at: https://www.greentechmedia.com/articles/read/distributed-energy-the-power-sectors-wild-card
Ø Wikipedia. Distributed Energy, available at: https://en.wikipedia.org/wiki/Distributed_generation
Ø Solar Home. Available at: http://www.solarhome.org/solarstarterkits.aspx