HCL Technologies Quarterly Results
24
www.hcltech.com/Investors HCL Technologies Quarterly Results First Quarter FY 2OO8-09 I n v e s t o r R e l e a s e N o i d a, N C R, I n d i a, October 15, 2 0 0 8 Results Highlights 2 Overview 3 Business Highlights 4 Financials 9 Segment wise Profitability 12 Revenue Analysis 14 Client Metrics 15 Operational Metrics - Core Software 16 Employee Metrics 17 Facility Details 18 Financials in INR as per convenience translation 19 Q1 revenues (US$) up 17.6% YoY and 0.1% sequentially; (INR) up 38.6% YoY and 9.2% sequentially • Deals worth more than US$ 270 mn inked during the quarter • 150% Dividend for Q1 announced • Gross employee addition on track at 5,597 and net addition for the quarter at 1,973 • Seventh consecutive quarter with declining attrition • 29 new clients added during this quarter
Transcript of HCL Technologies Quarterly Results

www.hcltech.com/Investors
HCL Technologies Quarterly Results
First Quarter FY 2OO8-09I n v e s t o r R e l e a s eN o i d a, N C R, I n d i a, October 15, 2 0 0 8
Results Highlights 2
Overview 3
Business Highlights 4
Financials 9
Segment wise Profitability 12
Revenue Analysis 14
Client Metrics 15
Operational Metrics - Core Software 16
Employee Metrics 17
Facility Details 18
Financials in INR as per convenience translation 19
Q1 revenues (US$) up 17.6% YoY and 0.1% sequentially; (INR) up 38.6% YoY and 9.2% sequentially
• Deals worth more than US$ 270 mn inked during the quarter • 150% Dividend for Q1 announced • Gross employee addition on track at 5,597 and net addition
for the quarter at 1,973• Seventh consecutive quarter with declining attrition • 29 new clients added during this quarter

www.hcltech.com/Investors2
Highlights for the Quarter (INR)
?
?
?
?
Revenues at Rs. 2369.3 crore; up 38.6% YoY
Net Income at Rs. 356.2 crore; up 15.5% YoY and 152.5% sequentially
Interim dividend of 150%, the 23rd consecutive quarterly dividend payout
Gross additions at 5,597 (Net 1,973) taking headcount to 52,714
and 9.2% sequentially
Results Highlights
Highlights for the Quarter (US$)
?
?
?
?
?
Revenues at 504.7mn; up 17.6% YoY and 0.1% sequentially
Revenue on constant currency basis, up 19.2% YoY and 2.4% sequentially
Net Income at US$ 75.9 mn; down 2.0% YoY and up 131.5% sequentially
Interim dividend of 150%, the 23rd consecutive quarterly dividend payout
Gross additions at 5,597 (Net 1,973) taking headcount to 52,714
US$

HCL’s Blue Ocean strategy continues to gain momentum with its focus on new markets, solutions and offerings that bring enhanced value for customers. Differentiated business and pricing models that HCL pioneered a few years ago are today adding more value and transforming the customers’ business. This is especially relevant in today’s environment where we have created a firm basis for growth and enhanced our readiness to help our customers become more cost efficient and competitive.
“HCL's ability to anticipate change and adapt to the changing market dynamics ahead of time has stood us in good stead. The strong foundation we laid in focusing on creating customer value through innovative pricing models and integrated service offerings have enhanced our readiness to execute in the long term”, said Shiv Nadar, Chairman and Chief Strategy Officer, HCL Technologies.
Commenting on the results, Vineet Nayar, CEO, HCL Technologies said, “The inking of deals worth US$ 270 mn providing integrated services to customers demonstrates our ability to keep growth steady in a challenging environment. HCL will focus on ‘right spending’ and aim to be globally significant, through organic and inorganic growth in the 8 specific areas we have identified.”
“This quarter, HCL BPO successfully completed the acquisition of Liberata Financial Services and Control Point Solutions. These two acquisitions reinforce our strategy to move away from linear monotonic growth and delink the growth in revenue from the growth in headcount, and strengthen our platform-based service offerings”, said Ranjit Narasimhan, President and CEO, BPO Services, HCL Technologies Ltd.
Overview
www.hcltech.com/Investors3

www.hcltech.com/Investors4
Business Highlights
YoY Revenue Growth Rate - %
17.6%
27.4%
39.2%
42.8%45.3%
44.1%41.4%
36.2% 33.8% 19.7%
30.9%
40.3%
42.7%44.8%
44.5%41.4%
37.2% 37.0%
0%
10%
20%
30%
40%
50%
Sep'06 Dec'06 Mar'07 Jun'07 Sep'07 Dec'07 Mar'08 Jun'08 Sep'08
YoY
gro
wth
%
HCLT HCLT IT Services
Attrition(LTM) - IT Services
15.5%15.2%
17.7%
17.4% 17.2%
16.4%
14.8%
14.2%
14.0%
14.5%
15.0%
15.5%
16.0%
16.5%
17.0%
17.5%
18.0%
Dec'06 Mar'07 Jun'07 Sep'07 Dec'07 Mar'08 Jun'08 Sep'08
Attrition (LTM)* - IT Services
EBIT Margins (%)
19.1%
17.0% 16.9% 17.1%
18.0%
19.2%
17.3% 17.3% 17.4%18.3%
19.5%
18.6%
15%
16%
17%
18%
19%
20%
Jun'07 Sep'07 Dec'07 Mar'08 Jun'08 Sep'08
HCLT IT ServicesHCLT

www.hcltech.com/Investors5
Key Catalysts for Growth
Consolidated For the Company 4.1%
Geography
Europe 10.0% 2.4%
Asia Pacific 9.2% 2.2%
Service Offering Engineering and R&D Services 24.6% 5.7%
Infrastructure Services 22.0% 5.1%
Custom Application Services 18.9% 4.4%
Industry Life Sciences 32.0% 7.2%
Hi - tech & Manufacturing 20.5% 4.8%
Telecom 19.2% 4.5%
Media Publishing & Entertainment 19.0% 4.5%
Clients Top 5 (LTM) 20.8% 4.8%
Top 10 (LTM) 23.8% 5.5%
Top 20 (LTM) 23.9% 5.5%
17.6%
US 24.3% 5.6%
Particulars Segment (US $ ) Growth Annual CQGRYoY (Last 4 Qtrs)
?
?
?
HCL continues to post growth in key geographies this quarter
Amongst Service Lines, Engineering and R&D services, Infrastructure services, Custom Applications witnessed accelerated growth
HCL has witnessed growth in key verticals including Life Sciences, Manufacturing, Telecom and Media Publishing & Entertainment during the quarter

?
?
?
This quarter, HCL inks eight deals worth more than US$ 270 mn providing integrated services to customers helping them bring in cost efficiencies in the immediate term and competitive advantage in the long run. These deals are spread across Telecom, Financial Services, Media & Entertainment verticals
HCL signs UAE’s first multi-million dollar, multi-year engagement to be delivered remotely. The scope of the project includes integrated IT Operations Management and end-to-end IT infrastructure management for UAE’s fastest growing bank
HCL announces opening of its U.S. Delivery Center in North Carolina as part of its global delivery strategy to offer customers support from various locations around the world. HCL currently operates delivery centers in India, China, Poland, Singapore, Sydney and N. Ireland
www.hcltech.com/Investors6
?
?
?
The fourth chapter of HCL Global Customer Meet – “Unstructure” to be held in November 08 renews customer commitment towards HCL with more than 500 business leaders from around the world expected to participate in a free flowing debate on topics that will result in insights and ideas for action to help businesses become more competent and sustainable in a challenging environment. A stellar speaker list including Nobel prize winner Al Gore; Prof Gary Hamel; Anne Mulcahy - CEO and Chairman, Xerox; Dennis McGuire - Co- Founder and CEO, TPI; Hanif Lalani, Group CFO, BT; Greg Tomb, President and CEO, North America, SAP; Ronald Buschur, CEO Powerwave, to name a few, will be leading the discussions
HCL presents its unique perspective on “Thinking Globally” at the Fortune Brainstorm Tech 2008 event at Half Moon Bay, California. The event is a convergence of Thought Leaders around the world to discuss the impact of technology on ‘what is happening in the world’
HCL concludes Directions’09 for the year, a unique platform for the management to engage with employees to share the strategy for enhancing its readiness to meet the challenging environment and setting directions for the coming year. The event, started in 2005, was the first step to translate HCL’s Employee First commitment on the ground empowering its employees to participate actively in HCL’s transformation journey
Multi-serivce; Multi-year; Multi-million dollar deals
Transformation @ HCL

?
?
?
?
?
?
IDC mentions HCL is moving away from manpower-based pricing to output-based pricing, from India-focused delivery centers to globally distributed delivery centers
Ovum believes HCL has a solid strategy and proposition in applications outsourcing for European customers. It has a growing emphasis on larger deals under its asset-light and consulting-light 'full service co-sourcing' model
HCL features in Workforce case study by the Harvard Business School and Kauffman Foundation on identifying best workforce management practices in the world, especially from emerging nations. The study presents an overview of the organizations’ best practices in recruiting, training, managerial development, and employee retention
Information Week recognizes HCL’s Employee First and highlighting the school of thought that believes ‘if you treat your people right, they'll be far more motivated and equipped to engage with (and maximize returns from) your customers’
HCL voted as the Most Innovative Company in the world for its workforce practices and wins the Optimas award instituted by Workforce Management
HCL wins multiple awards including Organization with Innovative HR Practices recognition at the Asia Pacific HR Congress – Global HR Excellence Awards
www.hcltech.com/Investors7
?
?
?
?
?
?
?
HCL Enterprise Application Services wins multi million dollar deals across industry verticals including Life Sciences, Retail, Financial Services
HCL signs three 360 degree partnerships with global product companies and new wins especially covering Asia. HCL’s traction of new business from existing customers in Financial Services covers two significant wins this quarter
HCL migrates for a leading global Telecom Service Provider, critical business applications that are directly tied with customer’s revenue. HCL is the integrator of this complex multi vendor deal, leading business continuity for the customer
HCL selected for a large application development project at one of the world’s largest Quick Service Restaurant brands. The application will be used to configure and send pricing, promotional information to the Point of Sale systems from the central hub
HCL customer Veolia Environmental Services (Australia) wins the SAP ANZ Excellence Award for best eSOA implementation in Australia and New Zealand
HCL awarded the 2007 Outstanding Operational Award for Information Technology by Merck & Co. Inc. The Award is based on the criteria of scorecard performance, contributions towards the Key Business Result (KBR) for Merck, ability to align IT Services with Merck’s business goals and operational excellence
HCL unveils Green Datacenter Services at Computerworld Green IT Symposium that will help enterprise IT organizations reduce their companies’ environmental impact through assessing, planning, and implementing green initiatives around their DC environment
Recognitions
IT Services Highlights

www.hcltech.com/Investors8
BPO Services Highlights
?
?
?
?
?
HCL completes the acquisition of Liberata Financial Services and Control Point Solutions as part of its strategy of investing in re-structuring its BPO service offering. The restructured portfolio would have higher emphasis on platform based services. This would have adverse impact on margins in the short term starting this quarter
HCL ranked 3rd in the DQ IDC BPO E-SAT survey 2008 rating HCL BPO 5th in the Satisfaction Quotient, and 3rd on relevant appraisal parameters
HCL wins the India Times BPO Industry Technology Award 2008. This award acknowledges the significant contribution of HCL BPO’s internal Information Technology (IT) function, and is an endorsement of the innovative use of technology in providing business value
Revenues for Q1 at US$ 57.2 mn; up 3.7% YoY
EBIT at US$ 7.7 mn; down 29.1% YoY
?
?
?
HCL awarded Global Managed Services Channel Partner that recognizes HCL’s mature delivery model and market success in providing Managed IT infra services to India and Global Clients. HCL is one of the three organizations worldwide and presently the only organization outside US to be successfully audited to be a ‘Cisco Powered Datacenter Services Partner’
Revenues for Q1 at US$ 447.5 mn; up 19.7% YoY
EBIT at US$ 86.0 mn; up 36.1% YoY

Financials
Unaudited Financial results for the quarter ended 30th September, 2008 drawn under US
GAAP
Consolidated Income Statement
Income Statement Quarter ending… Growth
30-Sep-07 30-Jun-08 30-Sep-08 YoY QoQ
Revenues 429.0 504.0 504.7 17.6% 0.1%
Direct Costs 270.2 300.0 305.9
Gross Profits 158.9 204.0 198.7 25.1% -2.6%
SG & A 67.5 85.8 85.6
EBITDA 91.3 118.1 113.1 23.8% -4.2%
Depreciation & Amortisation 17.2 19.8 19.3
EBIT 74.1 98.4 93.8 26.5% -4.7%
Other Income, net 9.0 8.3 11.9
Provision for Tax 8.7 4.7 9.4
Share from Equity Investment /of
Minority Interest (0.7) 0.5 0.3
Net Income [before foreign 73.8 102.5 96.6 31.0% -5.7%
exchange gain/(loss)]
Foreign Exchange Gains 3.6 (69.7) (20.8)/ (loss)
Net Income 77.4 32.8 75.9 -2.0% 131.5%
Figures in US $ million
www.hcltech.com/Investors9
Earnings Per Share (EPS) -
Basic – in US $ 0.47 0.20 0.45
Diluted – in US $ 0.45 0.19 0.45
“Weighted average number of Shares used in computing EPS”
Basic 663,710,658 665,561,705 667,208,948
Diluted 681,021,338 682,648,533 678,781,727
Annualized
Note:- The above result does not take into account
a) Unrealized gains on treasury investments of US$ 18.0 mn as on Sep 30, 2008 (US$ 19.5 mn as of Jun 30, 2008 and US$ 20.8 mn as on Sep 30, 2007)
Gross Margin 37.0% 40.5% 39.4%
EBITDA Margin 21.3% 23.4% 22.4%
EBIT Margin 17.3% 19.5% 18.6%

www.hcltech.com/Investors10
Particulars (in US $ mn)
Options at market price 1.5 1.3 0.5
Options at less than market price 4.7 4.6 3.9
Total 6.2 5.9 4.3
Tax benefit 0.5 0.5 0.4
Total (net of tax) 5.7 5.4 4.0
30-Sep-07 30-Jun-08 30-Sep-08
Outstanding Options (in equivalent no of shares)
Options at market price 32,833,216 28,208,456 26,381,152
Options at less than market price 14,045,200 12,749,200 11,036,068
30-Sep-07 30-Jun-08 30-Sep-08
These options will vest in tranches from year 2007 to 2011
b) Non cash employee stock options charge computed under FAS 123R, as per details given here:-
Consolidated Balance Sheet
Particulars As on
30-Jun-08 30-Sep-08
Assets
a) Cash & Cash Equivalents 89.2 65.1
b) Account Receivables, net 440.1 447.5
c) Treasury Investments 482.8 490.6
d) Other Current Assets 202.5 222.7
A) Total Current Assets (a+b+c+d) 1,214.6 1225.8
B) Property and Equipments, net 309.5 300.8
C) Intangible Assets, net 222.7 232.1
D) Investment in Equity Investee 2.4 2.5
E) Other Assets 117.7 120.3
Total Assets (A+B+C+D+E) 1,866.8 1881.4
Liabilities & Stockholders' Equity
e) Total Current Liabilities 514.6 548.5
f) Other Liabilities 138.5 179.6
F) Total Liabilities (e+f) 653.0 728.1
G) Minority Interest 1.3 1.3
H) Total Stockholders Equity 1,212.4 1152.0
Total Liabilities and Stockholders Equity (F+G+H) 1,866.8 1881.4
Figures in US $ million

Consolidated Cash Flow Statement
Figures in US $ million
Particulars Period ended30-Sep-08
CASH FLOWS FROM OPERATING ACTIVITIES
Net income 75.8
Adjustments to Reconcile Net Income to Net Cash provided byOperating Activities
Depreciation and Amortization 19.1
Loss / (Profit) on Sale of Investment Securities (6.4)
Others (5.0)
Changes in Assets and Liabilities, net
Accounts Receivable (17.6)
Other Assets (32.2)
Current Liabilities 3.0
Net Cash Provided by Operating Activities 36.7
CASH FLOWS FROM INVESTING ACTIVITIES
Purchase of Property and Equipment (net) (30.9)
(Purchase) / Sale of Investments (21.2)
Payments for business acquisitions, net of cash acquired (20.2)
Net Cash used in Investing Activities (72.3)
CASH FLOWS FROM FINANCING ACTIVITIES
Proceeds from Issuance of Employees Stock Options 0.4
Dividend (0.0)
Others 40.3
Net Cash Provided by (used in) Financing Activities 40.7
Effect of Exchange Rate on Cash and Cash Equivalents (29.2)
Net increase/ (decrease) in Cash and Cash Equivalents 5.1
CASH AND CASH EQUIVALENTS
Beginning of the year 89.2
End of the year 65.1
www.hcltech.com/Investors11

Figures in US $ million B. BPO Services
Quarter ended Growth
Particulars
Revenues 55.1 56.5 57.2 3.7% 1.1%
Direct Costs 33.8 31.6 36.7
Gross Profits 21.3 25.0 20.5 -3.9% -18.1%
SG & A 7.0 9.0 9.7
EBITDA 14.3 16.0 10.8 -24.6% -32.4%
Depreciation & Amortisation 3.4 2.9 3.1
EBIT 10.9 13.1 7.7 -29.1% -40.9%
Gross Margin 38.6% 44.2% 35.8%
EBITDA Margin 26.0% 28.3% 18.9%
EBIT Margin 19.8% 23.1% 13.5%
30-Sep-07 30-Jun-08 30-Sep-08 YoY QoQ
Segment wise Profitability
Figures in US $ million A. Consolidated IT Services (Core software [A1] & Infrastructure services [A2])
Quarter ended Growth
Particulars
Revenues 373.9 447.4 447.5 19.7% 0.0%
Direct Costs 236.3 268.4 269.2
Gross Profits 137.6 179.0 178.3 29.6% -0.4%
SG & A 60.6 76.8 75.9
EBITDA 77.0 102.2 102.3 32.9% 0.2%
Depreciation & Amortisation 13.8 16.9 16.3
EBIT 63.2 85.3 86.0 36.1% 0.9%
Gross Margin 36.8% 40.0% 39.8%
EBITDA Margin 20.6% 22.8% 22.9%
EBIT Margin 16.9% 19.1% 19.2%
30-Sep-07 30-Jun-08 30-Sep-08 YoY QoQ
www.hcltech.com/Investors12

Figures in US $ million A2. Infrastructure Services
Quarter ended Growth %
Revenues 64.7 76.2 79.0 22.0% 3.7%
Direct Costs 45.6 50.8 53.2
Gross Profits 19.2 25.4 25.8 34.3% 1.6%
SG & A 8.3 11.1 10.8
EBITDA 10.9 14.3 14.9 37.1% 4.6%
Depreciation & Amortisation 3.2 3.6 3.4
EBIT 7.7 10.7 11.5 50.0% 7.7%
Gross Margin 29.6% 33.3% 32.6%
EBITDA Margin 16.8% 18.7% 18.9%
EBIT Margin 11.8% 14.0% 14.5%
30-Sep-07 30-Jun-08 30-Sep-08 YoY QoQ
Figures in US $ million
A1. Core Software Services
Quarter ended Growth %
Particulars
Revenues 309.1 371.2 368.5 19.2% -0.7%
Direct Costs 190.7 217.6 216.0
Gross Profits 118.4 153.6 152.5 28.8% -0.7%
SG & A 52.3 65.8 65.1
EBITDA 66.1 87.9 87.4 32.2% -0.6%
Depreciation & Amortisation 10.5 13.3 12.8
EBIT 55.6 74.6 74.6 34.2% 0.0%
Gross Margin 38.3% 41.4% 41.4%
EBITDA Margin 21.4% 23.7% 23.7%
EBIT Margin 18.0% 20.1% 20.2%
30-Sep-07 30-Jun-08 30-Sep-08 YoY QoQ
www.hcltech.com/Investors13
www.hcltech.com/Investors14
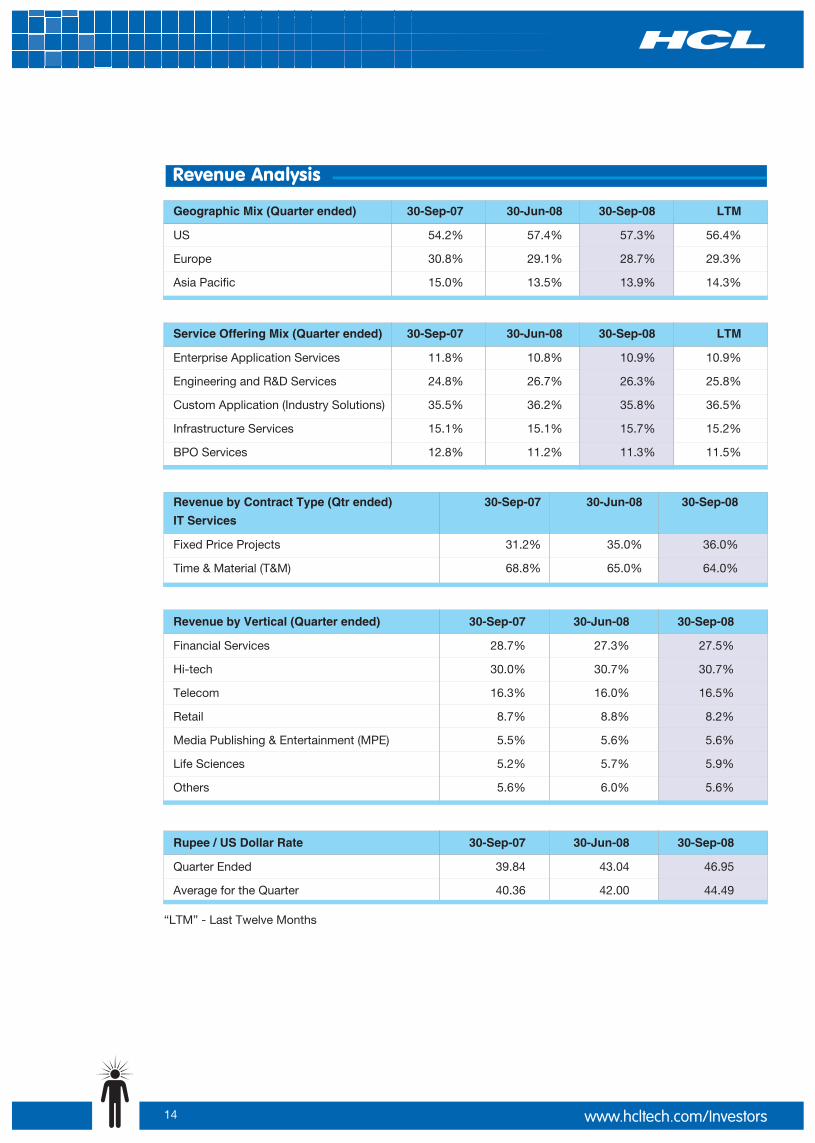
Revenue Analysis
Geographic Mix (Quarter ended) LTM
US 54.2% 57.4% 57.3% 56.4%
Europe 30.8% 29.1% 28.7% 29.3%
Asia Pacific 15.0% 13.5% 13.9% 14.3%
30-Sep-07 30-Jun-08 30-Sep-08
Service Offering Mix (Quarter ended) LTM
Enterprise Application Services 11.8% 10.8% 10.9% 10.9%
Engineering and R&D Services 24.8% 26.7% 26.3% 25.8%
Custom Application (Industry Solutions) 35.5% 36.2% 35.8% 36.5%
Infrastructure Services 15.1% 15.1% 15.7% 15.2%
BPO Services 12.8% 11.2% 11.3% 11.5%
30-Sep-07 30-Jun-08 30-Sep-08
Revenue by Contract Type (Qtr ended)
Fixed Price Projects 31.2% 35.0% 36.0%
Time & Material (T&M) 68.8% 65.0% 64.0%
30-Sep-07 30-Jun-08 30-Sep-08
IT Services
Revenue by Vertical (Quarter ended)
Financial Services 28.7% 27.3% 27.5%
Hi-tech 30.0% 30.7% 30.7%
Telecom 16.3% 16.0% 16.5%
Retail 8.7% 8.8% 8.2%
Media Publishing & Entertainment (MPE) 5.5% 5.6% 5.6%
Life Sciences 5.2% 5.7% 5.9%
Others 5.6% 6.0% 5.6%
30-Sep-07 30-Jun-08 30-Sep-08
“LTM” - Last Twelve Months
Rupee / US Dollar Rate
Quarter Ended 39.84 43.04 46.95
Average for the Quarter 40.36 42.00 44.49
30-Sep-07 30-Jun-08 30-Sep-08
www.hcltech.com/Investors15
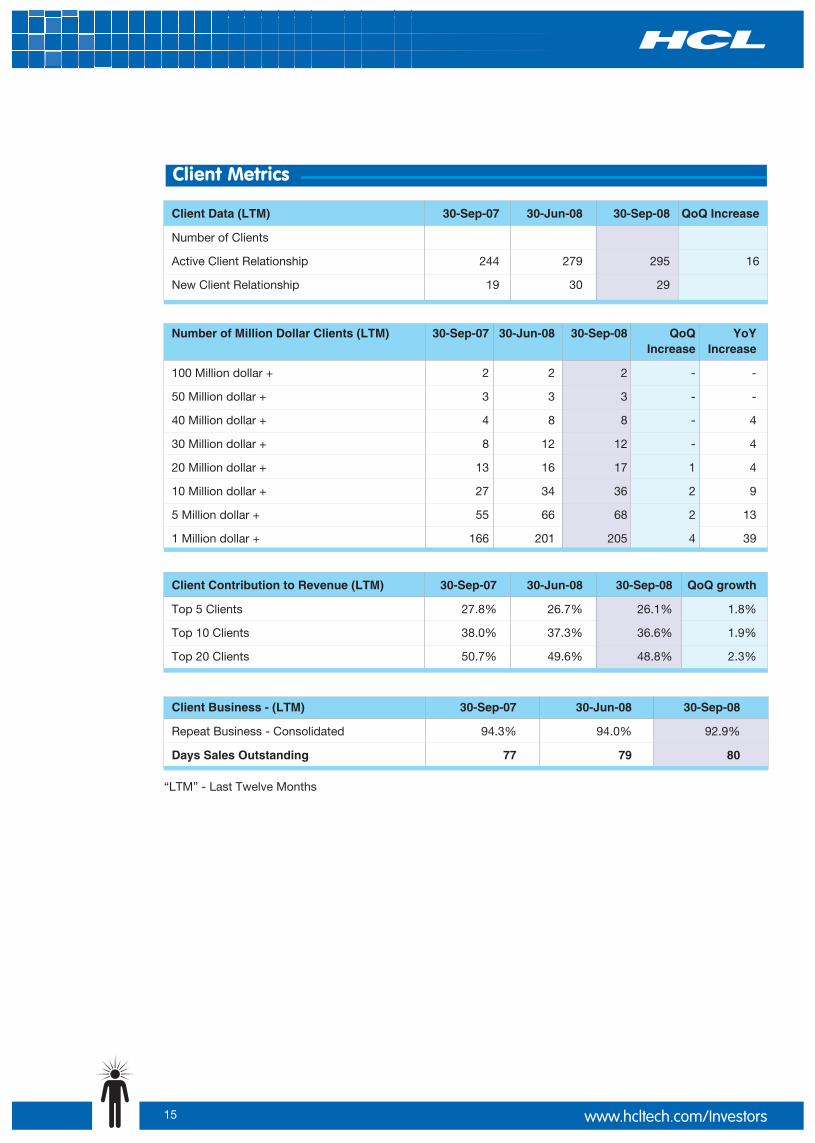
Client Metrics
Client Data (LTM) QoQ Increase
Number of Clients
Active Client Relationship 244 279 295 16
New Client Relationship 19 30 29
30-Sep-07 30-Jun-08 30-Sep-08
Number of Million Dollar Clients (LTM) QoQ YoYIncrease Increase
100 Million dollar + 2 2 2 - -
50 Million dollar + 3 3 3 - -
40 Million dollar + 4 8 8 - 4
30 Million dollar + 8 12 12 - 4
20 Million dollar + 13 16 17 1 4
10 Million dollar + 27 34 36 2 9
5 Million dollar + 55 66 68 2 13
1 Million dollar + 166 201 205 4 39
30-Sep-07 30-Jun-08 30-Sep-08
Client Contribution to Revenue (LTM) QoQ growth
Top 5 Clients 27.8% 26.7% 26.1% 1.8%
Top 10 Clients 38.0% 37.3% 36.6% 1.9%
Top 20 Clients 50.7% 49.6% 48.8% 2.3%
30-Sep-07 30-Jun-08 30-Sep-08
Client Business - (LTM)
Repeat Business - Consolidated 94.3% 94.0% 92.9%
Days Sales Outstanding 77 79 80
30-Sep-07 30-Jun-08 30-Sep-08
“LTM” - Last Twelve Months

Core Software Services (Quarter Ended)
Efforts
Offshore 73.9% 74.7% 74.9%
Onsite 26.1% 25.3% 25.1%
Revenue
Offshore 49.4% 50.2% 52.0%
Onsite 50.6% 49.8% 48.0%
Utilization
Offshore - Including trainees 69.2% 73.9% 74.4%
Offshore - Excluding trainees 77.2% 74.1% 74.7%
Onsite 95.8% 96.8% 96.5%
30-Sep-07 30-Jun-08 30-Sep-08
Operational Metrics - Core Software
Effort (Man Months)
Efforts Billed - Offshore 41,187 48,957 49,603
Efforts Billed – Onsite 14,567 16,608 16,644
Total Billed Efforts 55,754 65,566 66,247
Not Billed 12,813 17,705 17,427
Trainee 6,186 135 213
Not Billed (including trainees) 18,999 17,840 17,640
30-Sep-07 30-Jun-08 30-Sep-08
www.hcltech.com/Investors16
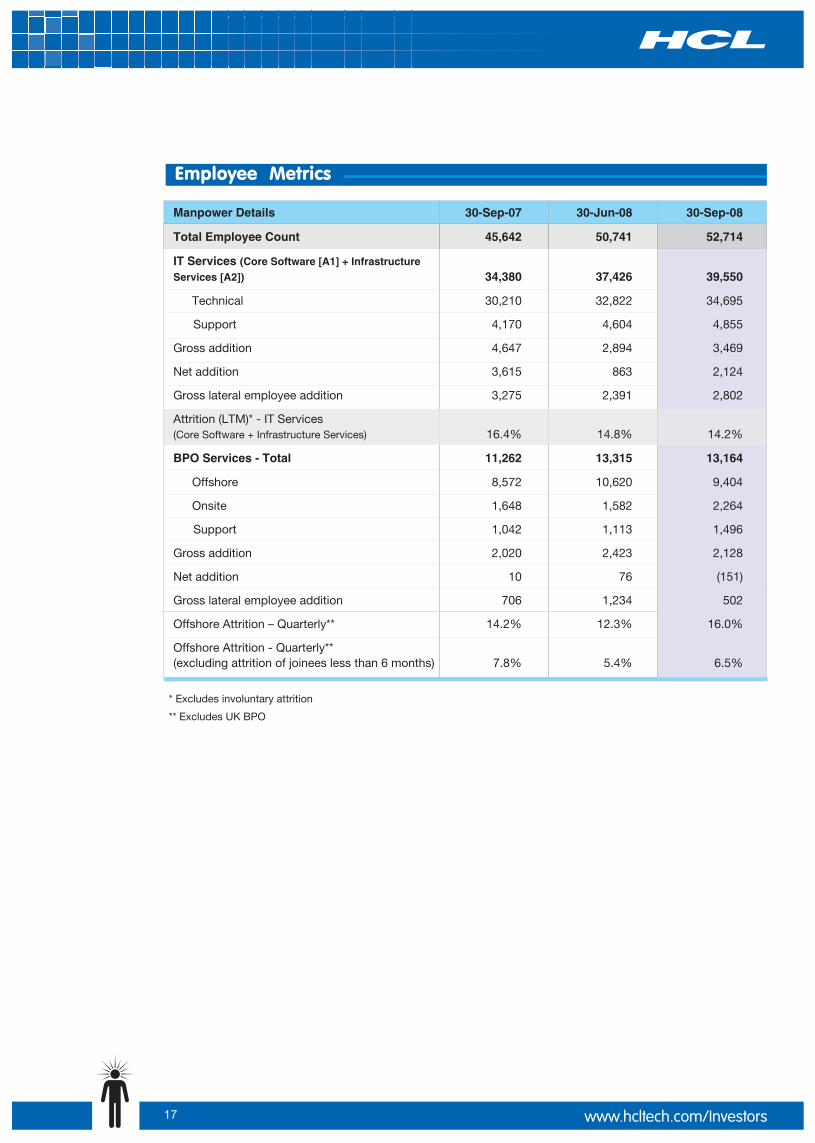
Employee Metrics
* Excludes involuntary attrition
Manpower Details
Total Employee Count 45,642 50,741 52,714
IT Services (Services [A2]) 34,380 37,426 39,550
Technical 30,210 32,822 34,695
Support 4,170 4,604 4,855
Gross addition 4,647 2,894 3,469
Net addition 3,615 863 2,124
Gross lateral employee addition 3,275 2,391 2,802
Attrition (LTM)* - IT Services (Core Software + Infrastructure Services) 16.4% 14.8% 14.2%
BPO Services - Total 11,262 13,315 13,164
Offshore 8,572 10,620 9,404
Onsite 1,648 1,582 2,264
Support 1,042 1,113 1,496
Gross addition 2,020 2,423 2,128
Net addition 10 76 (151)
Gross lateral employee addition 706 1,234 502
Offshore Attrition – Quarterly** 14.2% 12.3% 16.0%
Offshore Attrition - Quarterly**(excluding attrition of joinees less than 6 months) 7.8% 5.4% 6.5%
30-Sep-07 30-Jun-08 30-Sep-08
Core Software [A1] + Infrastructure
www.hcltech.com/Investors17
* Excludes UK BPO*

www.hcltech.com/Investors18
Core Software - Total 29,157 30,391 31,271
Technical 25,667 26,592 27,282
Support 3,490 3,799 3,989
Gross addition 3,735 1,792 2,007
Net addition 2,831 4 880
Gross lateral employee addition 2,523 1,580 1,767
Attrition (LTM) * 16.5% 14.8% 14.2%
30-Sep-07 30-Jun-08 30-Sep-08
A1. Core Software Services
Gurgaon 343,200 3,020 17,200 200
Noida (NCR) 1,384,855 15,654 465,545 3,746 31.0
Chennai 2,430,333 21,712 619,557 5,188 27.0
Bangalore 864,900 7,800 518,000 4,400 13.0
Mumbai 28,300 300
Kolkatta 35,600 300 57,683 652
Hyderabad 104,954 1,141
Manesar (Haryana) 10.
UK 88,613 923
USA 56,532 205
Northern Ireland (NI) 100,000 1,400
Poland 16,100 190
China 15,300 140
Total 5,468,687 52,785 1,677,985 14,186 81.0
As of 30-Sep-08 Completed Work in Progress Land Available for expansion -
in acresBuilt Up area
(Sq. ft.) No. of seatsBuilt Up area
(Sq. ft.) No. of seatsDelivery Locations
Facility Details
A2. Infrastructure Services - Total
Infrastructure Services - Total 5,223 7,035 8,279
Technical 4,543 6,230 7,413
Support 680 805 866
Gross addition 912 1,102 1,462
Net addition 784 859 1,244
Gross lateral employee addition 752 811 1,035
Attrition (LTM)* 15.9% 14.9% 14.3%
30-Sep-07 30-Jun-08 30-Sep-08
* Excludes involuntary attrition

Income Statement Quarter ending… Growth
YoY QoQ
Revenues 1,709.2 2,168.8 2,369.3 38.6% 9.2%
Direct Costs 1,076.3 1,291.0 1,436.3
Gross Profits 632.9 877.8 933.0 47.4% 6.3%
SG & A 269.0 369.4 401.9
EBITDA 363.9 508.4 531.1 46.0% 4.5%
Depreciation & Amortisation 68.6 85.0 90.8
EBIT 295.3 423.4 440.3 49.1% 4.0%
Other Income, net 35.9 35.5 55.8
Provision for Tax 34.6 20.3 43.9
Share from Equity Investment /of
Minority Interest (2.8) 2.3 1.4
Net Income [before foreign 293.9 440.9 453.6 54.3% 2.9%
exchange gain/(loss)]
Foreign Exchange Gains 14.5 (299.9) (97.4)/ (loss)
Net Income 308.4 141.0 356.2 15.5% 152.5%
30-Sep-07 30-Jun-08 30-Sep-08
Note:- The above result does not take into account
a) Unrealized gains on treasury investments of Rs 84.3 crores as on Sep 30, 2008 (Rs 83.7 crores as of June 30, 2008 and Rs 82.9 crores as on Sep 30, 2007)
Financials in INR as per convenience translation
(The financials in INR are based on a convenience translation using the closing rate as of the last day of the quarter: US$1 = Rs. 46.95 for the quarter ended on 30 Sep 2008; US $1 = Rs. 43.04 for the quarter ended on 30 Jun 2008; US$ 1 = Rs. 39.84 for the quarter ended 30 Sep 2007)
Unaudited Financial results for the quarter ended 30th September 2008 drawn under US GAAP
Consolidated Income Statement
www.hcltech.com/Investors19
Figures in rupees crore
Gross Margin 37.0% 40.5% 39.4%
EBITDA Margin 21.3% 23.4% 22.4%
EBIT Margin 17.3% 19.5% 18.6%
Earnings Per Share (EPS) -
Diluted – in Rupees (FV Rs. 2/-) 18.11 8.26 20.99
“Weighted average number of Shares used in computing EPS”
Basic 663,710,658 665,561,705 667,208,948
Diluted 681,021,338 682,648,533 678,781,727
Annualized
Basic – in Rupees (FV Rs. 2/-) 18.59 8.47 21.35

Particulars (in )
Options at market price
Options at less than market price 18.7 19.9 18.2
Total 24.7 25.4 20.4
Tax benefit 2.0 2.3 1.7
Total (net of tax) 22.7 23.1 18.7
Rs crores 30-Sep-07 30-Jun-08 30-Sep-08
6.0 5.5 2.2
Outstanding Options (in equivalent no of shares)
Options at market price
Options at less than market price 14,045,200 12,749,200 11,036,068
30-Sep-07 30-Jun-08 30-Sep-08
32,833,216 28,208,456 26,381,152
These options will vest in tranches from year 2007 to 2011
b) Details as under:Non cash employee stock options charge computed under FAS 123R, are not part of reported net income.
www.hcltech.com/Investors20
Consolidated Balance Sheet
Figures in Rs crores
Particulars As on
30-Jun-08 30-Sep-08
Assets
a) Cash and Cash Equivalents 384.0 305.6
b) Accounts Receivable, net 1,894.0 2,101.0
c) Treasury Investments 2,077.9 2,303.2
d) Other Current Assets 871.3 1,045.5
A) Total current assets (a+b+c+d) 5,227.2 5,755.3
B) Property and Equipment, net 1,331.7 1,412.2
C) Intangible Assets, net 958.5 1,089.6
D) Investment in Equity Investee 10.1 11.5
E) Other Assets 506.3 564.7
Total assets (A+B+C+D+E) 8,033.8 8,833.3
Liabilities and Stockholders' Equity
e) Total Current Liabilities 2,214.5 2,575.3
f) Other Liabilities 595.9 843.2
F) Total Liabilities (e+f) 2,810.3 3,418.5
G) Minority Interest 5.7 6.2
H) Total Stockholders equity 5,217.7 5,408.5
Total liabilities and stockholders equity (F+G+H) 8,033.8 8,833.3

Figures in Rs croresB. BPO Services
Quarter ended Growth
Particulars YoY QoQ
Revenues 219.8 243.3 268.3 22.2% 10.3%
Direct Costs 134.8 135.8 172.3
Gross Profits 84.8 107.5 96.1 13.2% -10.6%
SG & A 27.7 38.7 45.4
EBITDA 57.1 68.8 50.7 -11.2% -26.3%
Depreciation & Amortisation 13.7 12.5 14.4
EBIT 43.4 56.3 36.3 -16.4% -35.6%
Gross Margin 38.6% 44.2% 35.8%
EBITDA Margin 26.0% 28.3% 18.9%
EBIT Margin 19.8% 23.1% 13.5%
30-Sep-07 30-Jun-08 30-Sep-08
Segment wise Profitability
Figures in Rs croresA. Consolidated IT Services (Core software [A1] & Infrastructure services [A2])
Quarter ended Growth
Particulars YoY QoQ
Revenues 1,489.5 1,925.5 2,101.0 41.1% 9.1%
Direct Costs 941.5 1,155.2 1,264.0
Gross Profits 548.0 770.3 837.0 52.7% 8.7%
SG & A 241.2 330.7 356.6
EBITDA 306.8 439.6 480.4 56.6% 9.3%
Depreciation & Amortisation 54.9 72.5 76.4
EBIT 251.9 367.1 404.0 60.4% 10.1%
Gross Margin 36.8% 40.0% 39.8%
EBITDA Margin 20.6% 22.8% 22.9%
EBIT Margin 16.9% 19.1% 19.2%
30-Sep-07 30-Jun-08 30-Sep-08
www.hcltech.com/Investors21

Figures in Rs croresA2. Infrastructure Services
Quarter ended Growth
YoY QoQ
Revenues 258.0 328.0 370.9 43.8% 13.1%
Direct Costs 181.6 218.8 249.9
Gross Profits 76.4 109.1 120.9 58.3% 10.8%
SG & A 33.0 47.7 50.8
EBITDA 43.4 61.4 70.1 61.5% 14.1%
Depreciation & Amortisation 12.9 15.5 16.1
EBIT 30.5 45.9 53.9 76.8% 17.5%
Gross Margin 29.6% 33.3% 32.6%
EBITDA Margin 16.8% 18.7% 18.9%
EBIT Margin 11.8% 14.0% 14.5%
30-Sep-07 30-Jun-08 30-Sep-08
Figures in Rs croresA1. Core Software Services
Quarter ended Growth
Particulars YoY QoQ
Revenues 1,231.6 1,597.6 1,730.1 40.5% 8.3%
Direct Costs 759.9 936.4 1,014.1
Gross Profits 471.7 661.2 716.0 51.8% 8.3%
SG & A 208.2 283.0 305.7
EBITDA 263.4 378.2 410.3 55.8% 8.5%
Depreciation & Amortisation 42.0 57.0 60.3
EBIT 221.4 321.2 350.0 58.1% 9.0%
Gross Margin 38.3% 41.4% 41.4%
EBITDA Margin 21.4% 23.7% 23.7%
EBIT Margin 18.0% 20.1% 20.2%
30-Sep-07 30-Jun-08 30-Sep-08
www.hcltech.com/Investors22

www.hcltech.com/Investors23
About HCL Technologies
About HCL Enterprise
Forward-looking Statements
Certain statements in this release are forward-looking statements, which involve a number of risks, uncertainties, assumptions and other factors that could cause actual results to differ materially from those in such forward-looking statements. All statements, other than statements of historical fact are statements that could be deemed forward looking statements, including but not limited to the statements containing the words 'planned', 'expects', 'believes', 'strategy', 'opportunity', 'anticipates', 'hopes' or other similar words. The risks and uncertainties relating to these statements include, but are not limited to, risks and uncertainties regarding impact of pending regulatory proceedings, fluctuations in earnings, our ability to manage growth, intense competition in IT services, Business Process Outsourcing and consulting services including those factors which may affect our cost advantage, wage increases in India, customer acceptances of our services, products and fee structures, our ability to attract and retain highly skilled professionals, our ability to integrate acquired assets in a cost effective and timely manner, time and cost overruns on fixed-price, fixed-time frame contracts, client concentration, restrictions on immigration, our ability to manage our international operations, reduced demand for technology in our key focus areas, disruptions in telecommunication networks, our ability to successfully complete and integrate potential acquisitions, the success of our brand development efforts, liability for damages on our service contracts, the success of the companies / entities in which we have made strategic investments, withdrawal of governmental fiscal incentives, political instability, legal restrictions on raising capital or acquiring companies outside India, and unauthorized use of our intellectual property, other risks, uncertainties and general economic conditions affecting our industry. There can be no assurance that the forward looking statements made herein will prove to be accurate, and issuance of such forward looking statements should not be regarded as a representation by the Company, or any other person, that the objective and plans of the Company will be achieved. All forward looking statements made herein are based on information presently available to the management of the Company and the Company does not undertake to update any forward-looking statement that may be made from time to time by or on behalf of the Company.
HCL Technologies is a leading global IT services company, working with clients in the areas that impact and redefine the core of their businesses. Since its inception into the global landscape after its IPO in 1999, HCL focuses on ‘transformational outsourcing’, underlined by innovation and value creation, and offers integrated portfolio of services including software-led IT solutions, remote infrastructure management, engineering and R&D services and BPO. HCL leverages its extensive global offshore infrastructure and network of offices in 19 countries to provide holistic, multi-service delivery in key industry verticals including Financial Services, Manufacturing, Aerospace & Defense, Telecom, Retail & CPG, Life Sciences & Healthcare, Media & Entertainment, Travel, Transportation & Logistics, Automotive, Government and Energies & Utilities. HCL takes pride in its philosophy of ‘Employee First’ which empowers our 52,714 transformers to create a real value for the customers. HCL Technologies, along with its subsidiaries, had consolidated revenues of US$ 2.0 billion (Rs. 8300 crores), as on 30th September 2008. For more information, please visit www.hcl.in
HCL is a $5 billion leading Global Technology and IT Enterprise that comprises two companies listed in India - HCL Technologies & HCL Infosystems. The 3-decade-old Enterprise, founded in 1976, is one of India's original IT garage start-ups. Its range of offerings spans Product Engineering, Custom & Package Applications, BPO, IT Infrastructure Services, IT Hardware, Systems Integration, and distribution of ICT products. The HCL team comprises over 56,000 professionals of diverse nationalities, who operate from 19 countries including 360 points of presence in India. HCL has global partnerships with several leading Fortune 1000 firms, including leading IT and Technology firms. For more information, please visit www.hcl.in

Hello there. I'm from HCL Technologies. We work behind the scenes, helping our customers to shift paradigms & start revolutions. We use digital engineering to build superhuman capabilities. We make sure that the rate of progress far exceeds the price. And right now, over 52,000 of us bright sparks are busy developing solutions for over 500 customers in 19 countries across the world. How can I help you?
www.hcltech.com/Investors
Talk to me
INVESTOR RELATIONS
Sanjay Mendiratta
+91- 9312065108
Renu Yadav
+91- 98713 89754
MEDIA RELATIONS
Geetanjali Bhatia
+91- 98119 87765
Abhishek Gulyani abhishek.gulyani
+91- 9899045766
@bm.com
For details, contact:
HCL Technologies Ltd.,A 10-11, Sector-III, Noida - 201301
www.hcltech.com