HCL Technologies 4 -...
26
Initiating Coverage February 3, 2011 Keynote Capitals Institutional Research is also available on Bloomberg KNTE <GO>, Thomson One Analytics, Reuters Knowledge, Capital IQ, TheMarkets.com and securities.com Keynote Capitals Institutional Research - awarded “India’s Best IPO Analyst 2009" by MCX-Zee Business Krishna Mahale, Analyst ([email protected]) (+9122-30266059) HCL Technologies Ltd. K E Y N O T E INSTITUTIONAL RESEARCH
Transcript of HCL Technologies 4 -...
Initiating Coverage
February 3, 2011
Keynote Capitals Institutional Research is also available onBloomberg KNTE <GO>, Thomson One Analytics, Reuters Knowledge, Capital IQ, TheMarkets.com and securities.com
Keynote Capitals Institutional Research - awarded “India’s Best IPO Analyst 2009" by MCX-Zee Business
Krishna Mahale, Analyst
(+9122-30266059)
HCL Technologies Ltd.
K E Y N O T EINSTITUTIONAL RESEARCH

2 Keynote Capitals Institutional Research
K E Y N O T E
Source: Company, E: Keynote Capitals Institutional Research Estimates ($1=`46)*Financials constructed from quarterly numbers
(`Cr)Key financials*
HCL Technologies Ltd.Close, but no cigar… February 3, 2011
Key Stock Data
Sector Information
Techology
CMP `498.2
52-wk High / Low: `517.2/317.6
Market Cap `338.18bn
($7421.88mn)
Avg 6m daily vol. 866209
NSE Nifty 5432.0
Reco Buy
TP `584
For y.e. Jun. 30 2009 2010 2011E 2012E
Net operating income 10608.40 12565.00 15598.83 19176.89
EBITDA 2323.90 2572.90 2513.93 3564.05
PAT 1782.20 1301.50 1461.28 2290.33
EBITDA margin 21.9% 20.5% 16.1% 18.6%
EPS (`) 26.59 19.17 21.53 33.74
BV (`) 73.75 92.65 108.79 134.10
PAT margin 16.8% 10.4% 9.4% 11.9%
RoANW 36.1% 23.2% 19.7% 27.8%
HCL Technologies Ltd. (HCLT), incorporated in 1991, is a Gurgaon based IT and ITeScompany, employing 70000+ employees, serving more than 300 clients in variousindustries across the globe. The company has exhibited robust 30% CAGR in operationsspanning 5 years.
The company primarily focuses on software and applications alongwith Infrastructure,BPO and Engineering & R&D services and, is well known for its employee-friendly HRpolicies. Following, is a brief summary of our investment thesis;
Sustainability -not a concern; deserves valuation premium vis-à-vis peers
With supply-side concerns plaguing the domestic IT sector, HCLT is well-positionedto tap and retain key-talent compared to peers. The company is well known for its"Theory-Y" HR philosophy. In recent quarters, the company has established 'the talentmagnet' track record and we expect similar performance, in future.
Additionally, the company has been reporting broad-based q-o-q growth across verticals.Currently the largest industry segment, Manufacturing, comprises less than 30%revenues. Accordingly, we consider the business to be well-diversified w.r.t. peers andcapable of withstanding sudden changes in economic cycles.
Finally, with ~40% fixed price revenue-contribution, the company has satisfactorilyaddressed concerns related to long term growth.
Additional headwinds seen on package, custom-implementations fronts
Apart from the fastest growing Infrastructure (RIMS) segment, the company boasts ofone of the largest SAP practice, on a global scale, metamorphosed post AXON-acquisition. Further, HCLT is well-positioned to leverage its reach, domain expertiseand quality-product-portfolio to build on discretionary and transformational spends,which have gained significant industrywide-momentum during the last three quarters.
Huge scope for exercising margin levers
We see 'margin expansion'-options on the table. The management has hinted atemployee-pyramid rationalisation and lower SG&A costs going forward. But, HCLT'sdismal track record of operations cannot be disregarded and, concerns continue,unabated.Price Performance (%)
1 Mth 3 Mths 6 Mths 1 Yr
8.0% 20.4% 24.1% 37.3%
Price Performance (%)
Stock Codes
Bloomberg Code HCLT.IN
Reuters Code HCLT.BO
BSE Code 532281
NSE Code HCLTECH
Face Value `2 per share
Shareholding Pattern (Dec-31-10)
Price Performance (%)Stock Price Performance
Institutions,5.8%Foreign,
23.3%
Promoters,64.8%
Public & Others,3.1%
Non PromoterCorporate Holding,
3.0%
80
90
100
110
120
130
15-J
an-1
0
15-F
eb-1
0
15-M
ar-
10
15-A
pr-
10
15-M
ay-1
0
15-J
un-1
0
15-J
ul-10
15-A
ug-1
0
15-S
ep-1
0
15-O
ct-
10
15-N
ov-1
0
15-D
ec-1
0
15-J
an-1
1
HCLT norm. NIFTY norm.
(continued...)

Keynote Capitals Institutional Research 3
K E Y N O T E
Previously, during 2009-10, HCLT was aggressively cross-hiring, coupled with elevatedSG&A-activity. Going forward, SG&A cost-structure will improve on account of comfortabledeal position. However, wage levers remain contingent on medium-long term growth rates.
Valuation
At CMP HCLT's common stock is trading at 14.8x FY12E earnings. Considering the improveddeal-position and robust business environment, we initiate coverage with a "buy"recommendation for target price of `584, arriving at 18.5x FY12E earnings for the unleveredfirm.
Company background
Following the ‘.com bust’ in 2000, HCLT has evolved from a .com focused applications firmto an end-to-end IT services company. In 2007, the management formulated the ‘Blue Ocean’strategy for addressing growth concerns, by formally addressing large deals within a formalstrategic framework.
Presently, the company employs a “holistic” technology base to meet its customerrequirements; chips to applications to systems. From an operations perspective,HCLT houses, Custom Application Services (CAS), Enterprise Application Services (EAS),Infrastructure (RIMS), Engineering & R&D (Engg) and BPO departments, serving awell –diversified industry base sampled through 312 active clients, spread across the globe(see charts 1, 2, 3).
BPOOrdinaryfunctional
outsourcing;voice andnon-voice.
Going forward,will shift focusto non-voice.
~6.3%
EnggDeals in
embeddedlogic, productdevelopment
(incl. software)and other
design issues~18.9%
RIMSIMS serviceslike hosting,datacenter
services andother supportservices likehelp-desk etc
~22.4%
CASCustomisedproducts andindigenous IP
~30.7%
EASDriven by HCL-AXON. Packageimplementations:SAP and Oracle
~21.6%
Applications~52%
Consolidated IT~93.7%
HCL Technologies Ltd.
Service offerings
Chart 1
Source: Company
Need to build significantdomain-expertise. This aint how
an IT company should lookthese days

4 Keynote Capitals Institutional Research
K E Y N O T E
Source: Company
Geographical spread
Chart 3
58.7% 57.0% 59.5% 61.5% 58.0% 57.1%
29.0% 29.5% 26.7% 24.6% 26.7% 26.6%
12.3% 13.5% 13.8% 13.9% 15.3% 16.3%
0%
10%
20%
30%
40%
50%
60%
70%
80%
90%
100%
Q1FY10 Q2FY10 Q3FY10 Q4FY10 Q1FY11 Q2FY11
Americas Europe RoW
Business in depth
The company provides a full-suite of services through the ‘Thinking IT’ framework, whichcan be broadly categorized from software (incl. chips) to systems. On the application side,the company offers product development, customization and maintenance/support servicesspanning across all major industrial verticals.
The company employs a proven intellectual-framework and work-flow/operating procedures,acquired both, organically and otherwise, over a decorated history of operations, to ensureSLA-fulfillment in every circumstance.
A-Pac and Europe viewed asgrowth-engines for intermediate
term
Source: Company
Industry presence
Chart 2
Others
6%
Utilities
7%
Telecom
11%
Retail &
CPG
8%
Media
publishing &
Entertainment
7%
Healthcare
8%
Manufacturing
28%
Financial
25%
Well diversified industryexposure

Keynote Capitals Institutional Research 5
K E Y N O T E
Software development services
Chart 4
Waterfall Prototyping Spiral RapidDevelop-
ment
Iterative RationalUnifiedProcess
SCRUM
Source: Company
Application maintenance services
Chart 5
HCL Application Management Services
Application Maintenance
• Transition
• 24”7 Application Support
• Incident and ProblemManagement
• Enhancements
• Testing Services
• 3rd Party Vendor Management
Application Operations
• L1 and L2 Support
• Monitoring
• Service Desk
• Production Support & Adminis-tration
• Release Management
Application & Data
• Transformation Services
• Application PortfolioOptimization
• Application TransformationServices
• Data Transformation Services
Operations Transformation
Packaged Applications
• SAP• Oracle Suite• Siebel• Peoplesoft• Documentum• Microsoft Dynamics
Legacy Applications
• Mainframe• AS 400• VAX / VMS• Tandem
IT Transformation
• Multi-Tiered Governance & Reporting • Robust Processes & Methodologies • Reduced costs of operations• Mature Transition Framework • Tool based Approach • Continuous Improvement
Source: Company
Bespoke Applications
• Java• Net• Cobol• C/ C++• ASP etc.
Excellent applications-trackrecord. History can be traced
from 'Neanderthal Age'
Better Innovation-Faster!
Differentiated Customer Experience!
Optimized Monetization!
Innovation / Product lifecycle
New TechnologyServices
New TechnologyServices
Participationin R&D Ecosystem
Access to HCL researchlabs / resources
ArchitectureConsulting Services Professional Services
L1-L4Technical Support
Sustanance Engineering/Bug Fixes
Product Based ServiceExtensions: WhiteLabeling / Saas
Differentiated CustomerExperienced
Life cycle Extension
L1-L4Technical Support
Sustenance Engineering/Bug Fixes
EOL ProductOwnership / Carve-outs
Optimized Monetization!
Product Development
Testing Services- on demand lab
Prototyping &Implementation
Better Innovation - Faster!
ProductDevelopment
Active Product Services /Professional Services
End-of-life ProducrSolutions
Maximized Potential - Exploit Market Adjacecies, Reach new market etc...
Integrated Lifecycle Services

6 Keynote Capitals Institutional Research
K E Y N O T E
Software services delivery (SaaS)
Chart 6
HCL’s Integrated Services Framework for SaaS Enablement
Market Analysis
End userBusiness NeedIdentification
Bootstrap Enablement Service Delivery
SolutionStandardization
SolutionOptimization
ProductArchitectureAssessmentArchitectureBlueprint androadmap
ProductEngineering
Enterprise appsImplementationand Integration
Customizations &Continuous Upgrades
L2 and L3 Support
OperationalReadiness Plan
Do
mai
n
Remote Infrastructureand ApplicationManagement
Process Standardization
24/7 Customer Support
Managed Hosting
OpeeationalProcess andProceduresRemoteManagement
Tech
no
log
yO
per
atio
ns
Service Oriented Architecture (SOA)
EAI Services
• EAI productevaluation
• Integration Design• Implementation• Milgrations &
Upgrades• Supports &
Maintences
BPM Services
• Process Imple-mentation
• Process Modeling• Process Optimiza-
tion• Support & Mainte-
nance• Testing
EDI Services
• EDI Migrations• EDI
Implementations• Upgrades• Support & Mainte-
nance
SOA Services
• SOA Roadmapand Consulting
• ESB Implementa-tion
• SOA Testing• Service creation• Service extraction
Process Transformation
Business FocusAgility & IT Alignment Broad Vertical Focus Product Focus
Middleware & SOA
ArchitectureTransformation
ProductTransformation
Middleware & SOATransformation
• ConnectorDevelopment
• Testing services• Interoperabi l i ty
& certification• SOA Enablement• SOA Product
development
Integration FocusERP, CRM
On the engineering side, the firm offers services in circuit-design, embedded, mechanicalengineering and other software products.
Source: Company
Well balanced delivery model
Keynote Capitals Institutional Research 7
K E Y N O T E
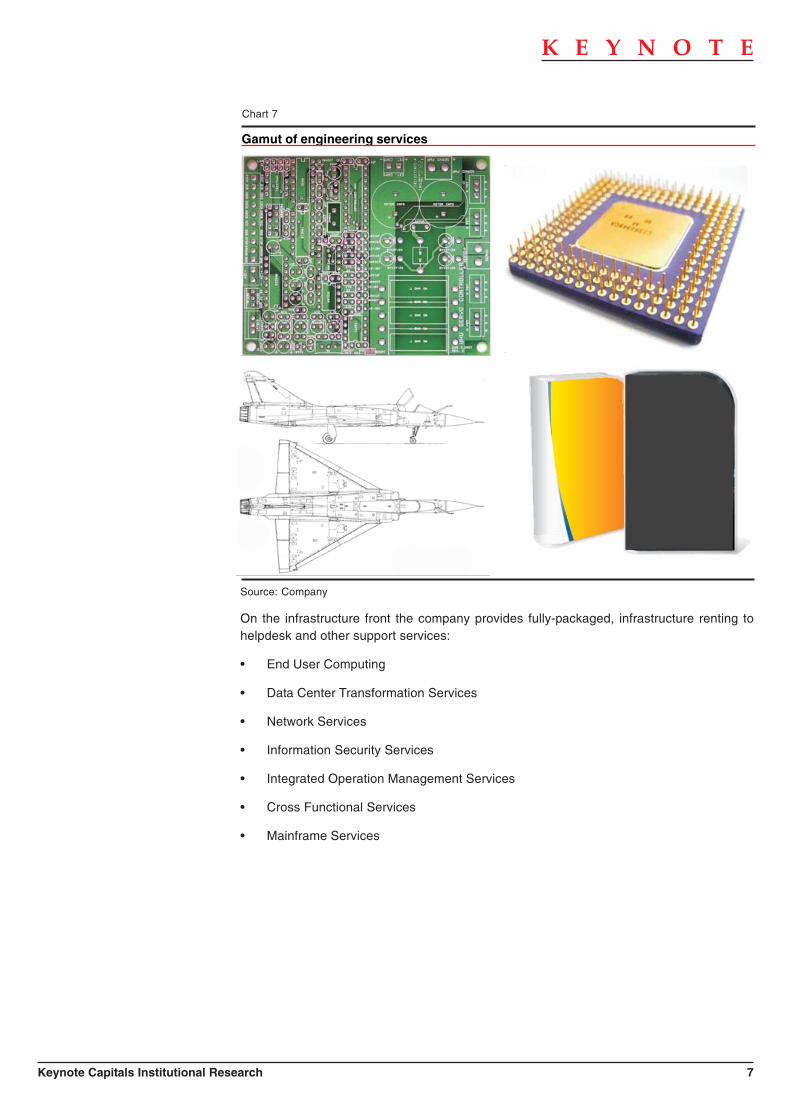
Gamut of engineering services
Chart 7
Source: Company
On the infrastructure front the company provides fully-packaged, infrastructure renting tohelpdesk and other support services:
• End User Computing
• Data Center Transformation Services
• Network Services
• Information Security Services
• Integrated Operation Management Services
• Cross Functional Services
• Mainframe Services

8 Keynote Capitals Institutional Research
K E Y N O T E
Chart 8
Operational excellenceTechnological
excellence Domain expertise Organisational context
2010: Covered in acase-study by OVUM.Previously , in 2007,HCLT adjudged bestRIMS-house amongIndian peers.
2010: 'AwardedService Provider ofthe Year' by NationalOutsourcingAssociation, UK.
2010: Gartner'sMagic Quadrant forSAP, DesktopOutsourcing andhelpdesk, Europe
2010: Gartner'sMarketScope positiverating for ManagedSecurity Service
2010: Honored 'BestVLSI//EmbeddedDesign EstablishedIndian Company' atMentor GraphicsLeadership Awards.
2010: Featured inIDC's MarketScapetop-13 for Discrete &Embedded PE,Testing
2010: ForresterWaveLeader for North-Amapplicationsoutsourcing
2010: F&S honorsHCLT for Aerospace& Defence ITsolutions, A-Pac.
2010: Honored ‘44most democraticworkplaces’,worldwide -WorldBlu
3P recognitions
Source: Company
2P recognitions
Following are some official testimonies by HCLT’s clients, lauding the firm’s operational andtechnological strengths:
Chart 9
• Sun Microsystems recognized HCL for Delivering Superior Quality and namedMeritorious Performance Supplier
• Outstanding Operational Award for Information Technology by Merck & Co.Inc,2007
• Customer Veolia Environmental Services (Australia) wins the SAP ANZ Ex-cellence Award for best eSOA implementation
• Receives the Boeing Performance Excellence Award2008
• Information Week conferred the ‘Value Honors’ awards to 6 HCLT ISD cus-tomers for their immense contribution in creating “value and transformingbusiness" in their global sourcing engagements.2010
Source: Company
Business outlook.
We maintain positive outlook on the company, while duly emphasizing on its deal-pipelineand industry diversification. The company has weathered the 2008 turmoil and has continuedits growth story unscathed. The following discussion forms the basis of our forecasts.
Lack of domain expertise is along-term concern
Awards & Recognitions
Keynote Capitals Institutional Research 9
K E Y N O T E
Sustainability concerns can be comfortably overlooked, considering the over-designedemployee-pyramid. The company, currently, employs a significantly sub-optimal employeepyramid, as a result of aggressive lateral-hiring during the recovery years -2009-10. Goingforward, with the imminent management crunch, due to measly industrywide sourcing duringrecession-hit 2008-09, we see HCLT in a relatively decoupled state compared to peers.
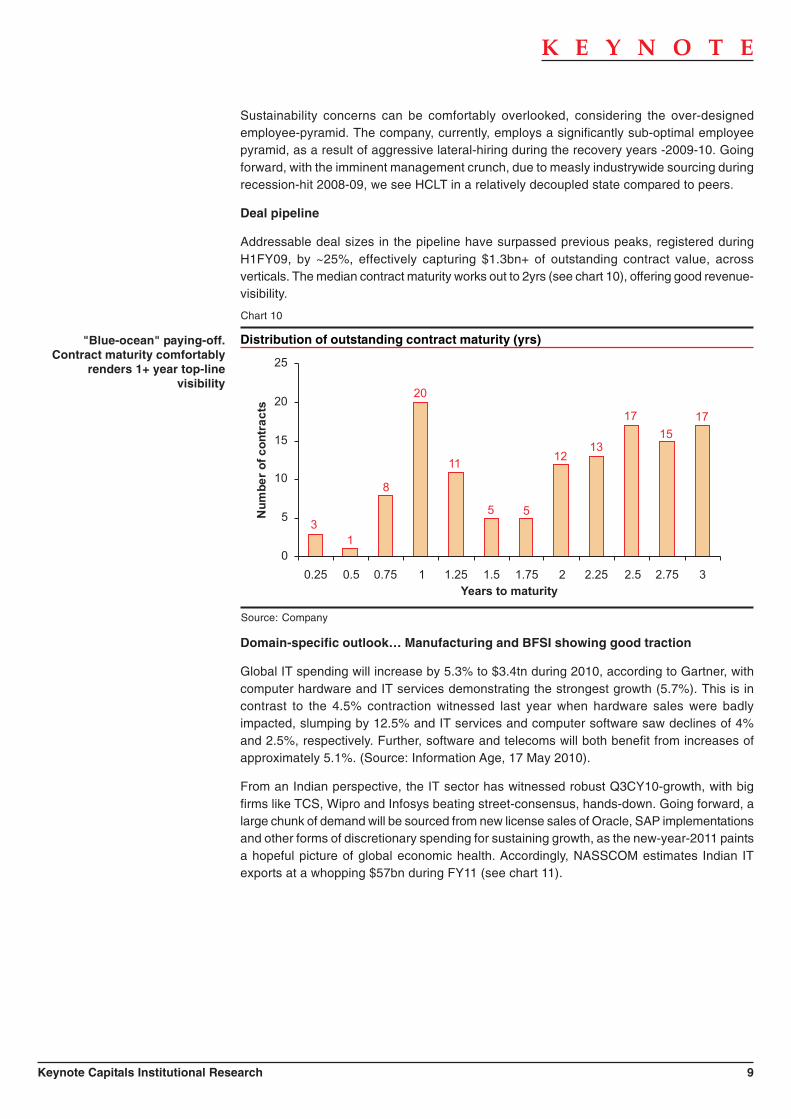
Deal pipeline
Addressable deal sizes in the pipeline have surpassed previous peaks, registered duringH1FY09, by ~25%, effectively capturing $1.3bn+ of outstanding contract value, acrossverticals. The median contract maturity works out to 2yrs (see chart 10), offering good revenue-visibility.
Source: Company
Distribution of outstanding contract maturity (yrs)
Chart 10
3
1
8
20
11
5 5
1213
17
15
17
0
5
10
15
20
25
0.25 0.5 0.75 1 1.25 1.5 1.75 2 2.25 2.5 2.75 3
Years to maturity
Nu
mb
er
of
co
ntr
ac
ts
Domain-specific outlook… Manufacturing and BFSI showing good traction
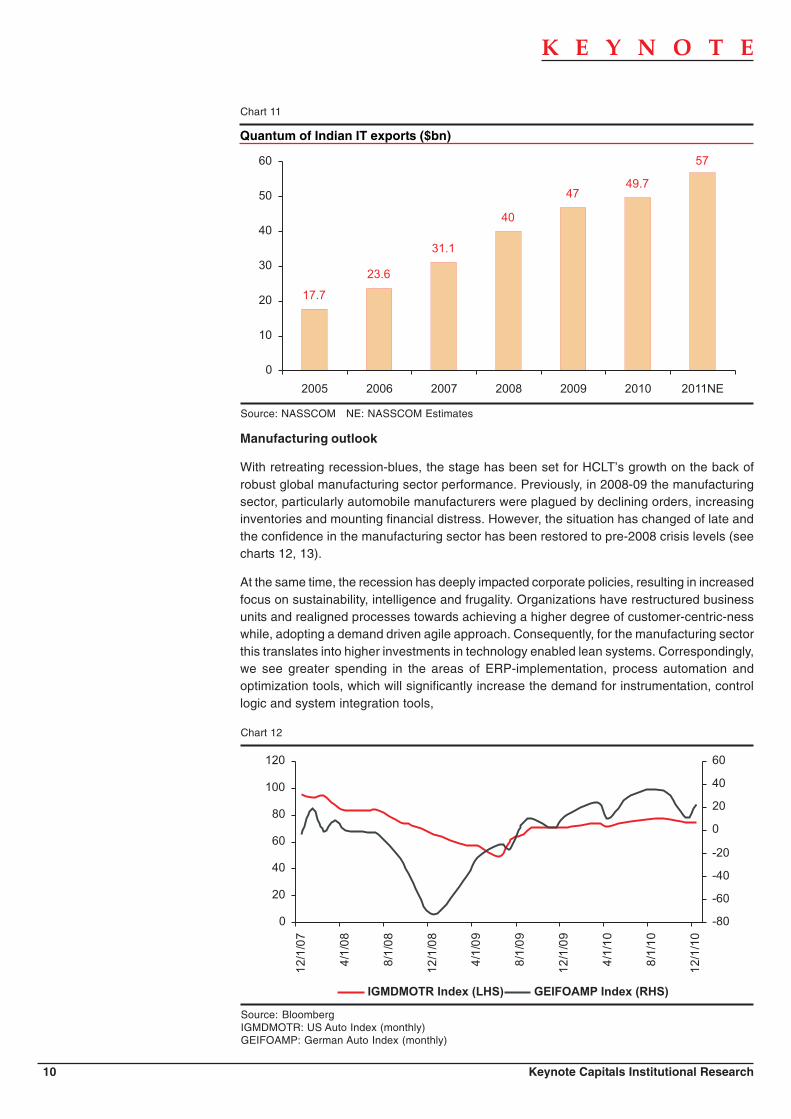
Global IT spending will increase by 5.3% to $3.4tn during 2010, according to Gartner, withcomputer hardware and IT services demonstrating the strongest growth (5.7%). This is incontrast to the 4.5% contraction witnessed last year when hardware sales were badlyimpacted, slumping by 12.5% and IT services and computer software saw declines of 4%and 2.5%, respectively. Further, software and telecoms will both benefit from increases ofapproximately 5.1%. (Source: Information Age, 17 May 2010).
From an Indian perspective, the IT sector has witnessed robust Q3CY10-growth, with bigfirms like TCS, Wipro and Infosys beating street-consensus, hands-down. Going forward, alarge chunk of demand will be sourced from new license sales of Oracle, SAP implementationsand other forms of discretionary spending for sustaining growth, as the new-year-2011 paintsa hopeful picture of global economic health. Accordingly, NASSCOM estimates Indian ITexports at a whopping $57bn during FY11 (see chart 11).
"Blue-ocean" paying-off.Contract maturity comfortably
renders 1+ year top-linevisibility
10 Keynote Capitals Institutional Research
K E Y N O T E
Source: NASSCOM NE: NASSCOM Estimates
Quantum of Indian IT exports ($bn)
Chart 11
17.7
23.6
31.1
40
4749.7
57
0
10
20
30
40
50
60
2005 2006 2007 2008 2009 2010 2011NE
Manufacturing outlook
With retreating recession-blues, the stage has been set for HCLT’s growth on the back ofrobust global manufacturing sector performance. Previously, in 2008-09 the manufacturingsector, particularly automobile manufacturers were plagued by declining orders, increasinginventories and mounting financial distress. However, the situation has changed of late andthe confidence in the manufacturing sector has been restored to pre-2008 crisis levels (seecharts 12, 13).
At the same time, the recession has deeply impacted corporate policies, resulting in increasedfocus on sustainability, intelligence and frugality. Organizations have restructured businessunits and realigned processes towards achieving a higher degree of customer-centric-nesswhile, adopting a demand driven agile approach. Consequently, for the manufacturing sectorthis translates into higher investments in technology enabled lean systems. Correspondingly,we see greater spending in the areas of ERP-implementation, process automation andoptimization tools, which will significantly increase the demand for instrumentation, controllogic and system integration tools,
Source: BloombergIGMDMOTR: US Auto Index (monthly)GEIFOAMP: German Auto Index (monthly)
Chart 12
0
20
40
60
80
100
120
12
/1/0
7
4/1
/08
8/1
/08
12
/1/0
8
4/1
/09
8/1
/09
12
/1/0
9
4/1
/10
8/1
/10
12
/1/1
0
-80
-60
-40
-20
0
20
40
60
IGMDMOTR Index (LHS) GEIFOAMP Index (RHS)

Keynote Capitals Institutional Research 11
K E Y N O T E
30
35
40
45
50
55
60
65
12
/1/2
00
7
2/1
/20
08
4/1
/20
08
6/1
/20
08
8/1
/20
08
10
/1/2
00
8
12
/1/2
00
8
2/1
/20
09
4/1
/20
09
6/1
/20
09
8/1
/20
09
10
/1/2
00
9
12
/1/2
00
9
2/1
/20
10
4/1
/20
10
6/1
/20
10
8/1
/20
10
10
/1/2
01
0
12
/1/2
01
0
Source: ISM
ISM PMI
Chart 13
The shift towards frugality is evident post financial crisis. The commercial applicability ofinformation technology (IT) which was initially restricted to productivity enhancement and ROIhas been expanded to include cost –saving objectives, resulting in concentrated demand forcontrol systems and operations management tools.
At the fore-front has been the recent spurt in PLM and MES tools, followed by a conscientiousapproach towards analytics by meaningful practice and implementation of ERP and SCMsystems. Going forward, we expect this to extend from intelligent querying to process modelingand factory simulation for empowering and automating critical decisions at the enterpriselevel.
Sizing estimates suggest doubling of MES revenue during 2006-12, with Frost predicting~6bn tied into MES and PLM set to achieve $20bn while registering 9% CAGR during2007-12.
On the semicon front, Gartner estimates 4.6% Y-o-Y growth with worldwide semicon revenuestouching $314bn during 2011. Correspondingly, we expect HCLT’s embedded andsemiconductor division to grow by a CAGR of ~13-23% over the next three years, given itsprofound industrial network.
Industrial solutions
Various businesses have been benefitted by HCLT’s expertise in manufac-focused ERPimplementations. HCLT has delivered stellar performance across all supply chain componentsfor many manufacturing organizations.
AMR Research estimates the market for manufacturing operations solutions to grow at 13%five-year CAGR, reaching the $8bn mark by 2011. Overall, the manufacturing operationssolutions market can be subdivided into enterprise asset management, operations intelligenceand MES, with MES accounting for a lion’s share (see chart 14). The total market is estimatedto grow at 13% CAGR during 2006-11 with operations intelligence and MES accounting for18% and 14% resp. while, Asia-Pacific emerges as a clear leader, with an adoption rate of20% over 2006-11 (see chart 15). We expect this momentum to continue till 2013.
HCLT is nicely positioned toappropriate the manufacturing –
bounceback, with ~30%revenues sourced from the
manufacturing-sector

12 Keynote Capitals Institutional Research
K E Y N O T E
Source: AMR
Global market size operation management tools ($mn)
Chart 14
0
1000
2000
3000
4000
5000
6000
7000
8000
9000
2007 2008 2009 2010 2011
0%
5%
10%
15%
20%
25%
Enterprise asset MgmtOperations IntelManufacturing Execution Sys
Enterprise asset Mgmt Y-o-Y growthOperations Intel Y-o-Y growthManufacturing Execution Sys Y-o-Y growth
We see good traction in almostall service lines, with special
attention towards EAS and CAS
Source: AMR
Operations management tools revenues by geographies ($mn)
Chart 15
0
1000
2000
3000
4000
5000
6000
7000
8000
9000
2006 2007 2008 2009 2010 2011
North Am Europe A-Pac Latin Am RoW
HCLT’s significant A-Pacexposure (~15%) will help
sustain the tempo
Given its global footprint, and acceleration abilities acquired through AXON, HCLT is wellpositioned to exploit the expected growth in manufacturing related IT solutions by leveragingits SAP practice and niche expertise in the manufacturing space. Accordingly, we estimate~12-20% three year forward CAGR in enterprise solutions (EAS and CAS) for HCLT.
BFSI outlook
The company has registered 18.1% y-o-y growth in BFSI business during the year, effectivelychanging the business-mix. We believe that, BFSI vertical offers a sustainable passage ofgrowth for HCLT, going forward. Our view has been further reinforced by HCLT’s willingnessto evaluate inorganic alternatives, given the acquisition of UK-based SAP-accelerator, AXON.
The environment is particularly ripe for deals in BFSI, with business events snowballing tocritical proportions (see chart 16). This has been further aided by technological advances invirtualisation and cloud computing, offering significant cost advantages.

Keynote Capitals Institutional Research 13
K E Y N O T E
Source: Everest Research
Event frequency for a sample of 100 American BFSI institutions (2007-09)
Chart 16
0 150 300 450 600 750 900
Business contraction
Executive joinees
Inorganic expansion
Negative legal impact
Performance decline
Performance warning
Positive legal impact
Reduce stake
2007 2008 2009
According to Everest Research(EAR-model), these events are
precursors to new IT deals/contracts. HCLT seems to have
taken the perfect approach,upping the SG&A-ante and
striking the iron when it washottest
Other high growth services… RIMS
IT Infrastructure Management Services are expected to offer a market opportunity of around$500bn. Globally, the RIMS industry is likely to achieve a penetration of 25-27% by 2013;$20-21bn increase over $6-7bn revenues presently. Further, based on a global CIO survey,India emerges as “primary” offshore destination, the country will capture greater than 50% ofthe world market i.e. $13-15bn 2013 revenues (Source: NASSCOM-McKinsey) (see chart17).
Source: NASSCOM-McKinsey
RIMS potential w.r.t. Indian IT industry
Chart 17
7
28
15
0
5
10
15
20
25
30
2008 2013
Global ITO demand India share
Cloud compute… ready reckoner
Most organizations tend to under-utilize in-house compute capacities, estimated at 15%(Source: white paper - “Capturing the Potential of Cloud” by IBM Global BusinessServices).Cloud computing can dynamically satisfy compute demand through multipleinstances that can be remotely accessed from a terminal. The billing is based on compute

14 Keynote Capitals Institutional Research
K E Y N O T E
time per instance. This marks a paradigm shift in IT related cost-structure for organizations,whereby capex and licensing costs of proprietary software will be completely transformedinto variable costs
and compute capacity can be invoked at will without constraints, making it useful especiallyfor smaller firms. Other benefits related to external economies of scale include savings relatedto maintenance and IT personnel (see chart 18).
* Development time = requirements, coding testing, verification and deliverySource: Force.com savings calculator
Time Savings
Chart 18
Cost Savings
$47,504$42,324
$32,964
$349,296
$135,000
$245,292
$27,473$49,058
$0
$100,000
$200,000
$300,000
$400,000
$500,000
$600,000
$700,000
$800,000
On-Premise Force.com
Application maintenance Application developmentSoftware license & maintenance fees Infrastructure administrationHardware infrastructure Data center infrastructure
~78% Savings
Development time (months)* 1.63 1.07Maintenance over 5 years (hours) 237.52 26.21 Cost for 100 users for 5 years $760,947 $167,964
65.75 45.84
72.5754.85
39.21
16.16
34.09
21.75
237.52
26.21
0
100
200
300
400
500
On-Premise Force.com
Ho
urs
Required design hours Code and test hours
Requirements testing Software delivery
~63% Savings
Maintenance
The potential applications of Cloud Compute are almost general purpose; going forward, theconcept can completely displace the existing arrangement for both organizational as well ashousehold computational requirements to a model wherein computational needs will beaddressed as a public utility. Given adequate internet bandwidth, the Cloud can also be usedfor High Performance Compute (HPC), which most organizations are currently unable to supportin the traditional arrangement. Beyond the apparent benefits, the Cloud has deep reachingeconomic consequences related to easing entry barriers in specific businesses involving digitalcontent development (like animation, game development, design etc.) which rely on heavycomputational requirements (both hardware and software). The Cloud also offers scalabilitybenefits related to API standardization and will be instrumental as a change agent fortransforming existing revenue models.
Estimated Demand for Cloud Compute
Initially, we expect application and database workloads to be moved to private clouds andinfrastructure workloads to public clouds, with elevated activity in BFSI, healthcare andgovernment sectors. The potential for cloud appears quite robust. Gartner predicts 20% ofbusinesses will have zero IT assets by 2012. IBM expects growth at 26% CAGR in cloudservices during FY10-13, with $66bn tied into core services like Software as a Service (SaaS)by 2012. Total business size including Business Process as a Service (BPaaS) and supportservices can be well over $100bn (see charts 19, 20).

Keynote Capitals Institutional Research 15
K E Y N O T E
Source: IDC
Cloud Compute Market Size Forecast ($bn)
Chart 19
367 359 416
16 17 44
0%
10%
20%
30%
40%
50%
60%
70%
80%
90%
100%
2008 2009 2013E
On-Premises IT IT Cloud Services
Source: IDC
Global Cloud Compute Spend by Product/Service Type ($bn)
Chart 20
9.23 8.53 16.80
2.923.48
8.84
1.781.74
5.75
1.462.09
6.63
0.81 1.57 6.19
0%
10%
20%
30%
40%
50%
60%
70%
80%
90%
100%
2008 2009 2013E
Business Apps Infra Soft App Dev & Deploy Server Storage

16 Keynote Capitals Institutional Research
K E Y N O T E
HCLT's cloud arsenal
Chart 21
• Better utilization, lower costs• Scalability on demand
Enterprise cloud user
Low demandvariability,core applications
High demand variabilitynon core applications
Access through the internet
Scaling &provisioning
Userinterface
Monitoring Billing
Provisioning and management
Virtualization
Servers Networks Security
Cloud providerEnterprise data center
Virtualizedserver
Virtualizedstorage
Virtualizednetwork
Storage
Physical infrastructure
Source: Company
Currently HCLT has 35+ clients in early adoption stage...
HCLT provides the entire spectrum of services incl. setting-up and migration to cloud under the Migration++ framework and,currently employs an IP-portfolio, Nimbo and Agora, for addressing provisioning and management needs, resp.
HCLT also hosts software and infrastructure services, focused at industrial belts/clusters. The downside risks to these projectshave been capped through 3P-insurance contracts
New focus areas… Utilities
With a view to protect the environment from emissions and enhance energy security, mostcountries are improving electricity transmission (T&D) efficiencies through the adoption ofsmartgrids, with the US Govt allocating ~$5bn for selective implementation. Expected to growat a whopping 38% CAGR during 2009-13, smartgrids require substantial investment in systemintegration and, need to be empowered by analytics and optimization tools.
On the Advanced Metering Infrastructure (AMI) front, HCLT, currently a Smartgrid Task ForceMember, India, has bagged a crucial domestic assignment on systems integration that, maydecide the fate of HCLT’s smartgrid foray. Pursuant to demonstrated exhibition capabilities,we believe the potential upsides to be significant, allowing HCLT to unlock a brand-new growth-engine.
As of 2009, ~$10bn is tied into smartgrids globally, with US accounting for ~$5bn. Goingforward, with policy thrust towards greener technology global smartgrid investments areexpected to peak up to ~$36 by 2013 and aggregating a capital stock of ~$200bn by 2015.Among HCLT’s smartgrid focus areas, DA will account for a substantially larger share of growthat ~57% four year CAGR followed by AMI and SA at four year CAGRs of ~26% and 19%respectively (see chart 22).

Keynote Capitals Institutional Research 17
K E Y N O T E
Source: Pike Research
Smartgrid revenue by application, World Markets
Chart 22
3000 4500 6000 5500 5000
1500
3000
6000
90009500
2500 2500
4000
50004500
0
1000
2000
3000
4000
5000
6000
7000
8000
9000
10000
2009 2010 2011 2012 2013
$m
n
SA DA AMI
Expect peaking of smartgridinvestments during, 2013. Onthe domestic front, HCLT haslanded a crucial AMI systems
integration assignment. We seegood scope for a new growth-
engine
Considered as a technologyleader in this area (Pike), HCLThas one lab each, in India and
US, dedicated to smartgridsolutions.
Client portfolio
The company serves a large client portfolio with comfortably diversified exposure (see chart23), while appropriating more than 94% repeat business. Following is a demonstrative list ofclients across industry-verticals.
Industrywise list of marquee clients
Financial services : NASDAQ, Singapore Exchange, Equitable Life,American Family Insurance, Deutsche Bank, Bankof Ireland
Manufacturing : Danfoss, XEROX, Sony Corp, AgilentTechnologies,Nokia Corp
Telecom : Vodafone, BelgacomRetail & CPG : Dr Pepper Snapple Group. Coca-ColaMedia, Publishing & Entertainment : Viacom, AdvanstarHealthcare : Merck & Co Inc, Quest DiagnosticsUtilitie : Malaysian Airlines,
Source: Company
Source: Company
Client concentration
Chart 23
-60%
-50%
-40%
-30%
-20%
-10%
0%
10%
20%
30%
40%
50%
Q1FY10 Q2FY10 Q3FY10 Q4FY10 Q1FY11 Q2FY11
> $100mn > $50mn >$40mn>$30mn >$20mn >$10mn>$5mn >$1mn
Top 5 clients
Top 10 clients
Top 20 clients
Client base -not a concern,further strengthens our
argument for valuation premiumw.r.t. peers
Well diversified client exposure;in high-growth trajectory -icing
on the cake

18 Keynote Capitals Institutional Research
K E Y N O T E
Cost levers
On the services side, HCLT has witnessed robust volume growth. The manpower additionhas been aggressive, resulting in a bulky employee pyramid. We see immense scope foroptimisation from pyramid-streamlining.
Further, during the recovery period -2010, HCLT has aggressively invested in SG&A (seechart 24), peaking at 17.5% of total revenues during Q2FY09. There has been a recentuptick, ~93bps q-o-q, during Q1FY11. However, with a healthy deal-pipeline, the managementhas guided for lower SG&A spend, going forward.
Comfortable deal pipeline,management may consider
SG&A as possible margin lever,going forward.
HR policy at HCLT
The firm is well known for its ‘employee first’ HR policy. Long term implications are positive,allowing the firm to command a ‘talent premium’, thus, effectively addressing supply-sideconcerns.
Recently, during the initial recovery phase, HCLT has been aggressively hiring, with lateralsovershadowing freshers, across segments. The company is well positioned to sustain growth,and has significant headroom for margin expansion.
Source: Company
Investments in SG&A (% revenues)
Chart 24
17.0%
17.5%
15.7%
15.5%
14.1%
14.6%
14.0%
14.4%
15.4%
15.2%
17.0%
13.0%
13.5%
14.0%
14.5%
15.0%
15.5%
16.0%
16.5%
17.0%
17.5%
18.0%Q
4F
Y0
8
Q1
FY
09
Q2
FY
09
Q3
FY
09
Q4
FY
09
Q1
FY
10
Q2
FY
10
Q3
FY
10
Q4
FY
10
Q1
FY
11
Q2
FY
11
Source: Company
Employee pyramid at HCLT
Chart 25
Current state of affairs Projected pyramid

Keynote Capitals Institutional Research 19
K E Y N O T E
Source: Company
Lateral/gross hiring schedule
Chart 26
48.5%
66.4%
77.5%
70.3%
53.8% 56.2%
0%
10%
20%
30%
40%
50%
60%
70%
80%
90%
Q1
FY
10
Q2
FY
10
Q3
FY
10
Q4
FY
10
Q1
FY
11
Q2
FY
11
Sustainability -not an issue withHCLT. However, it remains to be
seen how nicely can themanagement orchestrate
margin control, going forward
Demand levers
HCLT has held a steady Fixed:T&M mix over the last few quarters (see chart 27). The revenuemodel is generally driven by Service Level Agreements (SLAs) for most of the services,classic example being the core software services.
Source: Company
Contract payoff-structure
Chart 27
40.0% 39.6% 40.5% 40.9% 41.1% 41.5%
60.0% 60.4% 59.5% 59.1% 58.9% 58.5%
0%
10%
20%
30%
40%
50%
60%
70%
80%
90%
100%
Q1FY10 Q2FY10 Q3FY10 Q4FY10 Q1FY11 Q2FY11
Fixed price T&M
No glass ceilings here:Comfortable Fixed to T&M
composition
Pricing .. software services
We see improved pricing, going forward, on account of channel enrichment. Pricing pressuresare generally seen in sub-contracting engagements, which have been subsiding over lastfew quarters.
Other revenue models employed
A significant portion of RIMS- component is packaged as ‘Infrastructure as a Service’ (IaaS)or pseudo-IaaS, thus, satisfactorily decoupling revenues from headcount.
On the BPO front, the firm is migrating towards platform based services. The payoff structurebeing primarily linked with output. Currently the firm employs three lines of services; voice,

20 Keynote Capitals Institutional Research
K E Y N O T E
insurance claims and media. Assuming a balanced line the billing rate can be directly linkedto number of workstations /employees
Engineering and R&D services provide for fixed price revenues and other license/Software asa Service (SaaS) revenues. The company has a portfolio of products on the infrastructure andend-user levels. Pertinent IPs have been acquired through, both, organic and inorganic means.
Source: Company
Bu
sin
es
sv
olu
me
s(Q
1F
Y0
9=
10
0) 24.6% 23.7% 22.8%
21.2%17.9% 17.5%19.7%
17.7% 18.4% 18.8% 17.8% 18.0%14.3%
7.9%
-4.5%
-11.4%-8.8%
-4.8%
0
20
40
60
80
100
120
140
160
180
200
Q1FY10 Q2FY10 Q3FY10 Q4FY10 Q1FY11 Q2FY11
-15%
-10%
-5%
0%
5%
10%
15%
20%
25%
30%
EB
ITD
Am
arg
in
Applications Infrastructure BPOApplications Infrastructure BPO
Significant acquisitions… synergies yet to be appropriated
• Q2FY09: AXON SAP-accelerator/(£438.5mn consideration)
� Currently fields >$1bn deal pipeline
� Cross selling synergies yet to be fully realized.
• Q1FY09: Liberata Financial Services, Control Point Solutions
� BPO under transition, net losses reported during Q4FY10-Q1FY11
• Q3FY08: Capital Stream: Lending Automation Systems ($40mn consideration)
BPO is undergoingtransformation from voice to
platform-based delivery
Volume growth & profitability
Chart 28
Source: Company E: Keynote Capitals Institutional Research Estimates ($1=`46)*Financials constructed from quarterly numbers
Financial projections
Chart 29
Compared to FY10performance, we expect further
decline in FY11 margins,factoring probable wage
inflation and tax-rate expansionto ~24% by FY12
10608.40 12565.00 15598.83 19176.89
21.9%20.5%
16.1%
18.6%
16.8%
10.4%9.4%
11.9%
0
5000
10000
15000
20000
25000
FY09 FY10 FY11E FY12E
0%
5%
10%
15%
20%
25%
Net operating income EBITDA margin PAT margin
`C
r
* *
Keynote Capitals Institutional Research 21
K E Y N O T E
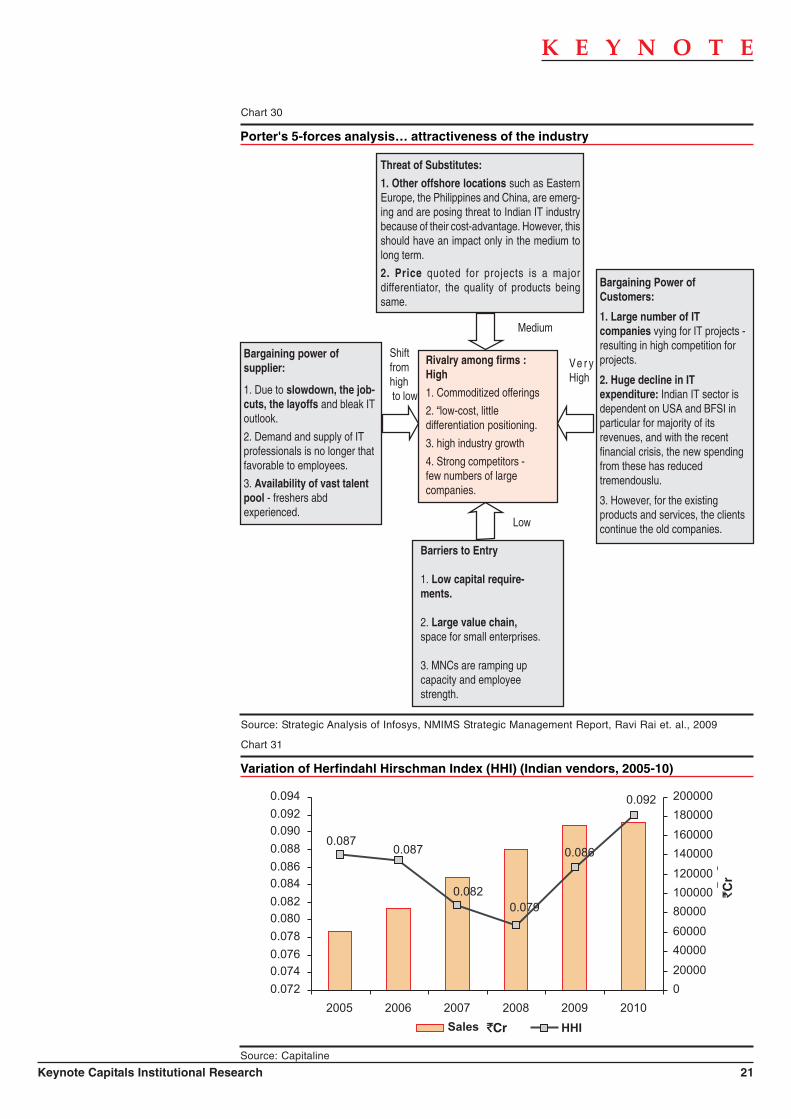
Bargaining Power ofCustomers:
1. Large number of ITcompanies vying for IT projects -resulting in high competition forprojects.
2. Huge decline in ITexpenditure: Indian IT sector isdependent on USA and BFSI inparticular for majority of itsrevenues, and with the recentfinancial crisis, the new spendingfrom these has reducedtremendouslu.
3. However, for the existingproducts and services, the clientscontinue the old companies.
Barriers to Entry
1. Low capital require-ments.
2. Large value chain,space for small enterprises.
3. MNCs are ramping upcapacity and employeestrength.
Bargaining power ofsupplier:
1. Due to slowdown, the job-cuts, the layoffs and bleak IToutlook.
2. Demand and supply of ITprofessionals is no longer thatfavorable to employees.
3. Availability of vast talentpool - freshers abdexperienced.
Rivalry among firms :High
1. Commoditized offerings
2. “low-cost, littledifferentiation positioning.
3. high industry growth
4. Strong competitors -few numbers of largecompanies.
Medium
Ve r yHigh
Low
Shiftfromhigh to low
Threat of Substitutes:
1. Other offshore locations such as EasternEurope, the Philippines and China, are emerg-ing and are posing threat to Indian IT industrybecause of their cost-advantage. However, thisshould have an impact only in the medium tolong term.
2. Price quoted for projects is a majordifferentiator, the quality of products beingsame.
Porter's 5-forces analysis… attractiveness of the industry
Chart 30
Source: Strategic Analysis of Infosys, NMIMS Strategic Management Report, Ravi Rai et. al., 2009
Source: Capitaline
Variation of Herfindahl Hirschman Index (HHI) (Indian vendors, 2005-10)
Chart 31
0.087
0.082
0.079
0.086
0.092
0.087
0.072
0.074
0.076
0.078
0.080
0.082
0.084
0.086
0.088
0.090
0.092
0.094
2005 2006 2007 2008 2009 2010
0
20000
40000
60000
80000
100000
120000
140000
160000
180000
200000
RC
Sales (RsCr) HHI
`C
r
`Cr

22 Keynote Capitals Institutional Research
K E Y N O T E
Pricing volatility seen subsiding
Valuation
We have conservatively valued the unlevered-company at 18.5x FY12E earnings, whichworks out to a 23.3% premium to our ITeS universe (MphasiS being the only other company),owing to sustainability of HCLT’s business (see table below). Historically the stock has beentrading at 11.0x 2yr-fwd earnings (see charts 33, 34). Compared to peers (see ‘Peercomparison’ below), we believe, that the stock is attractively priced, after factoring both growthand returns.
Valuation table
FY09 FY10 FY11E FY12E
EPS (`) 26.59 19.17 21.53 33.74
EBITDA (`Cr) 2323.90 2572.90 2513.93 3564.05P/E (x) 18.7 26.0 23.1 14.8EV/EBITDA (x) 14.7 13.3 13.6 9.6
Source: Company E: Keynote Capitals Institutional Research Estimates ($1=`46)
Source: Company
Price movements HCLT (Q2FY10-Q2FY11)
Chart 32
-20%
-15%
-10%
-5%
0%
5%
10%
15%
20%
25%
Q1
FY
09
Q2
FY
09
Q3
FY
09
Q4
FY
09
Q1
FY
10
Q2
FY
10
Q3
FY
10
Q4
FY
10
Q1
FY
11
Q2
FY
11
Applications -Offshore Applications-Onsite
Infrastructure (technical only) BPO (offshore only)

Keynote Capitals Institutional Research 23
K E Y N O T E
TCS Infosys Wipro HCL Tech* MphasiS* Patni# Hexaware# Polaris NIIT Tech
Revenues (`Cr) FY10 30028.92 22742.00 27212.90 12565.00 5036.56 3146.15 1038.56 1353.76 913.71FY11E 37306.03 27673.66 31335.32 15598.83 5924.63 3605.95 1243.45 1552.56 1213.90FY12E 46201.70 34047.42 37168.94 19176.89 7067.33 4056.36 1444.71 1812.08 1291.86
FY10-12E CAGR 24.0% 22.4% 16.9% 23.5% 18.5% 8.8% 11.6% 15.7% 18.9%EPS (`) FY10 35.68 109.84 19.07 19.17 51.82 45.74 9.34 15.48 21.51
FY11E 43.99 121.35 22.02 21.53 42.43 40.16 8.78 20.37 29.62FY12E 51.55 149.44 24.84 33.74 48.15 43.14 10.12 22.12 29.58
EBITDA (`Cr) FY10 8694.55 7911.00 6081.10 2572.90 1264.57 666.07 198.50 223.43 191.06FY11E 11096.45 9177.09 6693.91 2513.93 1174.35 691.69 150.26 230.71 240.82FY12E 13613.00 11256.73 7930.59 3564.05 1367.43 756.09 183.54 276.04 267.46
EV/EBITDA (x) FY10 25.7 20.6 17.1 13.3 9.6 6.1 5.7 5.2 5.1FY11E 20.1 17.8 15.5 13.6 10.3 5.8 7.6 5.0 4.0FY12E 16.4 14.5 13.1 9.6 8.8 5.4 6.2 4.2 3.6
RoAA FY10 27.9% 25.1% 15.3% 15.3% 38.3% 14.5% 12.2% 13.8% 15.4%FY11E 28.6% 28.7% 16.0% 14.4% 24.0% 11.6% 11.1% 18.5% 19.6%FY12E 27.3% 31.4% 15.7% 22.4% 22.3% 11.3% 10.0% 17.8% 15.9%
P/E (x) FY10 33.1 28.1 23.0 26.0 12.5 10.2 11.4 10.9 9.0FY11E 26.9 25.5 19.9 23.1 15.3 11.6 12.2 8.3 6.5FY12E 22.9 20.7 17.6 14.8 13.5 10.8 10.6 7.6 6.5
EV(`Cr) 223131.7 163055.0 103718.3 34133.7 12085.5 4046.2 1140.2 1164.7 967.7MCap (`Cr) 231429.11 177322.95 107360.82 33817.82 13678.56 6115.74 1550.05 1675.62 1135.50
Peer comparison
Chart 33 Chart 34
2yr forward EV bands*
Source: Respective companiesE: Bloomberg consensus, except, *: Keynote Capitals Institutional Research Estimates ($1=`46)#: FY ended 31 Dec 2009
Source: Capitaline, E: Keynote Capitals Institutional Research Estimates ($1=`46)*: EV computed using FY-1 balance sheet numbers
2yr forward price bands
0
100
200
300
400
500
600
700
2-J
ul-
07
2-J
ul-
08
2-J
ul-
09
2-J
ul-
10
Close Price ( )`
5x EPS ( )`
8x EPS ( )`
11x EPS ( )`
14x EPS ( )`
0
5000
10000
15000
20000
25000
30000
35000
40000
02
-Ju
l-0
7
02
-Ju
l-0
8
02
-Ju
l-0
9
02
-Ju
l-1
0
Close EV ( Cr))`
2x EBITDA ( Cr)`
4x EBITDA ( Cr)`
6x EBITDA ( Cr)`
8x EBITDA ( Cr)`
Risks and concerns
Foreign exchange risks
Our estimates suggest not more than 82bps EBITDA margin contraction for every percentagepoint decrease in USD/INR exchange rates.
Protectionism
With more than 55% revenues from the Americas, we see sustainability concerns fromprotectionist-lobbies.

24 Keynote Capitals Institutional Research
K E Y N O T E
Financials
For y.e. Jun. 30 2009 2010 2011E 2012E
INCOME : Net operating income 10608.40 12565.00 15598.83 19176.89EXPENDITURE : Direct expenses 6548.40 8195.90 10729.06 12919.59SG&A 1736.10 1796.20 2355.84 2693.24
Total expenditure 8284.50 9992.10 13084.90 15612.84EBITDA 2323.90 2572.90 2513.93 3564.05Other income 162.00 -54.30 127.30 164.25
Interest 0.00 0.00 222.92 189.33Gross profit 2485.90 2518.60 2418.31 3538.97Depreciation & Amortisation 449.40 501.00 544.88 525.39
Forex gains -508.10 -475.70PBT 2036.50 1541.90 1873.43 3013.59Tax 254.30 240.40 412.16 723.26
PAT 1782.20 1301.50 1461.28 2290.33Cost structure Direct expenses 61.7% 65.2% 68.8% 67.4%
SG&A 16.4% 14.3% 15.1% 14.0%
Profit & Loss statements* (`Cr)
Balance sheets (`Cr)
As at y.e. Jun. 30 2009 2010 2011E 2012E
Shareholders’ funds 4942.80 6288.83 7668.19 9898.45Minority interest 2.97 3.68Secured loans 2595.37 2345.90 2145.41 1785.41Unsecured loans 420.85 378.34 7.24 3.24
Total debt 3019.19 2727.92 2152.65 1788.65Total liabilities 7961.99 9016.75 9820.84 11687.10APPLICATION OF FUNDS :
Gross block+CWIP 7268.77 7670.73 8020.73 8370.73Less: accumulated depreciation 1863.87 2221.98 2766.86 3292.24Net block 5404.90 5448.75 5253.88 5078.49Investments 40.34 831.70 873.29 916.95Current assets, loans & advances Inventories 169.56 65.17 0.00 0.00
Sundry debtors 2175.05 2521.06 3404.51 4185.43Cash and bank 1898.70 1580.37 2131.60 3771.27Loans and advances 1618.40 1780.00 2476.01 3043.95
Total current assets 5861.71 5946.60 8012.11 11000.66Less : current liabilities and provisions Current liabilities 3278.00 2979.93 3699.44 4548.01
Provisions 523.48 606.04 619.00 760.99Total current liabilities 3801.48 3585.97 4318.44 5309.00Net current assets 2060.23 2360.63 3693.67 5691.66Deferred tax assets 456.52 375.67Net deferred tax 456.52 375.67 0.00 0.00Total assets 7961.99 9016.75 9820.83 11687.09
Source: Company E: Keynote Capitals Institutional Research Estimates ($1=`46)*Financials constructed from quarterly numbers
Source: Company E: Keynote Capitals Institutional Research Estimates ($1=`46)

Keynote Capitals Institutional Research 25
K E Y N O T E
Cash flow statements# (`Cr)
For y.e. Jun. 30 2009 2010 2011E 2012E
Cash flow from operating activity 1117.75 1791.18 1695.63 2482.48Cash flow investing activity -3472.56 -1014.11 -391.59 -393.66
Cash flow financing activity 2249.89 -727.84 -1036.21 -961.66Cash at beginning of period 471.14 404.26 483.32 751.16Exchange rate effects 38.04 29.83 0.00 0.00
Cash at end of period 404.26 483.32 751.16 1878.31
Source: Company E: Keynote Capitals Institutional Research Estimates#excl. FDs and other LT investments
Margin ratios 2009 2010 2011E 2012E
EBITDA 21.9% 20.5% 16.1% 18.6%
EBIT 17.7% 16.5% 12.6% 15.8%PBT 19.2% 12.3% 12.0% 15.7%PAT 16.8% 10.4% 9.4% 11.9%
Financial ratios (for y.e. Jun. 30)*
Efficiency ratios 2009 2010 2011E 2012E
Average asset turnover (x) 1.3 1.5 1.5 1.9RoANW 36.1% 23.2% 19.7% 27.8%
RoAA 22.4% 15.3% 14.4% 22.4%
Capital structure ratios 2009 2010 2011E 2012E
Average D/E 0.6 0.5 0.4 0.2
Operational ratios 2009 2010 2011E 2012E
Recievable days 94 88 95 95Payable days 90 72 70 70Cash Conversion Cycle (days) 4 16 25 25
Valuation ratios 2009 2010 2011E 2012E
EPS (`) 26.59 19.17 21.53 33.74EBITDA (`Cr) 2323.90 2572.90 2513.93 3564.05
P/E (x) 18.7 26.0 23.1 14.8EV/EBITDA (x) 14.7 13.3 13.6 9.6
Other ratios 2009 2010 2011E 2012E
Dividend payout 51.2% 26.8% 25.0% 25.0%
Source: Company E: Keynote Capitals Institutional Research Estimates ($1=`46)*Financials constructed from quarterly numbers
26 Keynote Capitals Institutional Research
K E Y N O T E
Subramanyam Ravisankar
Director - Equities [email protected] +91 22 3026 6018
Institutional Equity Team
Analysts / Associates
Krishna Mahale [email protected] +91 22 3026 6059
Denil Savla [email protected] +91 22 3026 6073
Hetal Shah [email protected] +91 22 2269 4325
Ashwin Chavan [email protected] +91 22 3026 6059
Rohan Admane [email protected] +91 22 2269 4322
Rajesh Sinha [email protected] +91 22 3026 6073
Mamta Singh [email protected] +91 22 3026 6057
Sanjay Bhatia [email protected] +91 22 3026 6065
Technical Analyst
Nilesh Dhruv [email protected] +91 22 3026 6040
Puja Shah [email protected] +91 22 3026 6057
Farha Shaikh [email protected] +91 22 3026 6057
Dealing / Sales
KEYNOTE CAPITALS LTD.Member
Stock Exchange, Mumbai (INB 010930556)National Stock Exchange of India Ltd. (INB 230930539)
Over the Counter Exchange of India Ltd. (INB 200930535)Central Depository Services Ltd. (IN-DP-CDSL-152-2001)
4th Floor, Balmer Lawrie Building, 5, J. N. Heredia Marg, Ballard Estate, Mumbai 400 001. INDIATel. : 9122-2269 4322 / 24 / 25 • www.keynoteindia.net
DISCLAIMER
• This report has been prepared and issued by Keynote Capitals Limited, based solely on public information and sources believed to be reliable.• Neither the information nor any opinion expressed herein, constitutes an offer, or an invitation to make an offer, to buy or sell any securities or any
options, futures or other derivatives related to such securities and also for the purpose of trading activities.• Keynote Capitals Limited makes no guarantee, representation or warranty, express or implied and accepts no responsibility or liability as to the
accuracy or completeness or correctness of the information in this report.• Keynote Capitals and its affiliates and their respective officers, directors and employees may hold positions in any securities mentioned in this
Report (or in any related investment) and may from time to time add to or dispose of any securities or investments.• Keynote Capitals may also have proprietary trading positions in securities covered in this report or in related instruments.• An affiliate of Keynote Capitals Limited may also perform or seek to perform broking, investment banking and other banking services for the
company under coverage.• If ‘Buy’, ‘Sell’, or ‘Hold’ recommendation is made in this Report, such recommendation or view or opinion expressed on investments in this Report
is not intended to constitute investment advice and should not be intended or treated as a substitute for necessary review or validation or anyprofessional advice. The views expressed in this Report are those of the analyst which are subject to change and do not represent to be an authorityon the subject. Keynote Capitals may or may not subscribe to any and/ or all the views expressed herein.
• The opinions presented herein are liable to change without any notice.• Though due care has been taken in the preparation of this report, Keynote Capitals limited or any of its directors, officers or employees shall be in
any way be responsible for any loss arising from the use thereof.• Investors are advised to apply their judgment before acting on the contents of this report.• This report or any portion hereof may not be reprinted, sold or redistributed without the written consent of Keynote Capitals Limited.