HCL Technologies Quarterly Results 2010-11 - … Meet/132281_20101020.pdf · HCL Technologies...
33
HCL Technologies Quarterly Results 2010-11 Financial Highlights 2 Corporate Overview 3 Business Highlights 4 Financials 10 Segment wise Profitability 13 Revenue Analysis 15 Constant Currency Reporting 16 Client Metrics 17 Operational Metrics - Software Services 18 Employee Metrics 19 Facility Details 21 Cash and Cash Equivalent, Investments & Borrowing 21 Financials in INR as per convenience translation - Average Exchange Rate for the Quarter 22 - Closing Rate for the Quarter 26 F i r s t Q u a r t e r R e s u l t s F Y 2010-11 Q1 Revenues at US$ 804 mn; up 9.0% QoQ; up 27.6% YoY Net Income at US$ 72 mn; up 7.9% YoY Q1 Revenues at Rs. 3,708 crores; up 10.0% QoQ; up 21.9% YoY Net Income at Rs. 331 crores; up 3.1% YoY ? Begins the financial year with high single digit growth of 9% QoQ ? 3 out of 7 verticals post double digit sequential growth ? Net Headcount Addition in IT Services exceeds 5000 for second consecutive quarter ? Declares Dividend of Rs. 1.50 per Share. 50% Increase in dividend per share.
Transcript of HCL Technologies Quarterly Results 2010-11 - … Meet/132281_20101020.pdf · HCL Technologies...

HCL Technologies Quarterly Results 2010-11
Financial Highlights 2
Corporate Overview 3
Business Highlights 4
Financials 10
Segment wise Profitability 13
Revenue Analysis 15
Constant Currency Reporting 16
Client Metrics 17
Operational Metrics - Software Services 18
Employee Metrics 19
Facility Details 21
Cash and Cash Equivalent, Investments & Borrowing 21
Financials in INR as per convenience translation - Average Exchange Rate for the Quarter 22
- Closing Rate for the Quarter 26
F i r s t Q u a r t e r R e s u l t s F Y 2010-11
Q1 Revenues at US$ 804 mn; up 9.0% QoQ; up 27.6% YoYNet Income at US$ 72 mn; up 7.9% YoY
Q1 Revenues at Rs. 3,708 crores; up 10.0% QoQ; up 21.9% YoY Net Income at Rs. 331 crores; up 3.1% YoY
?Begins the financial year with high single digit growth of 9% QoQ?3 out of 7 verticals post double digit sequential growth?Net Headcount Addition in IT Services exceeds 5000 for second consecutive quarter?Declares Dividend of Rs. 1.50 per Share. 50% Increase in dividend per share.

2
Highlights for the Quarter (US$)
?Revenue at US$ 804 mn; up 27.6% YoY & 9.0% sequentially
?Revenue on constant currency basis up 28.5% YoY & 7.4% sequentially
?EBIT at US$ 104 mn; lower by 8.8% YoY
?Net Income at US$ 72 mn; up 7.9% YoY
?Announces dividend of Rs. 1.50 per share, 31st consecutive quarter of dividend payout. 50% Increase in dividend per share
?Gross & Net Employee addition of 11,785 & 5,661 respectively taking total headcount to 70,218
Highlights for the Quarter (INR convenience translation at Quarterly Average Rate of
Rs.46.13/US$)
?Revenue at Rs. 3,708 crores; up 21.9% YoY & 10.0% sequentially
?EBIT at Rs. 478 crores; lower by 12.9% YoY
?Net Income at Rs. 331 crores; up 3.1% YoY
?Announces dividend of Rs. 1.50 per share, 31st consecutive quarter of dividend payout. 50% Increase in dividend per share
?Gross & Net Employee addition of 11,785 & 5,661 respectively taking total headcount to 70,218
Financial Highlights
3
Corporate Overview
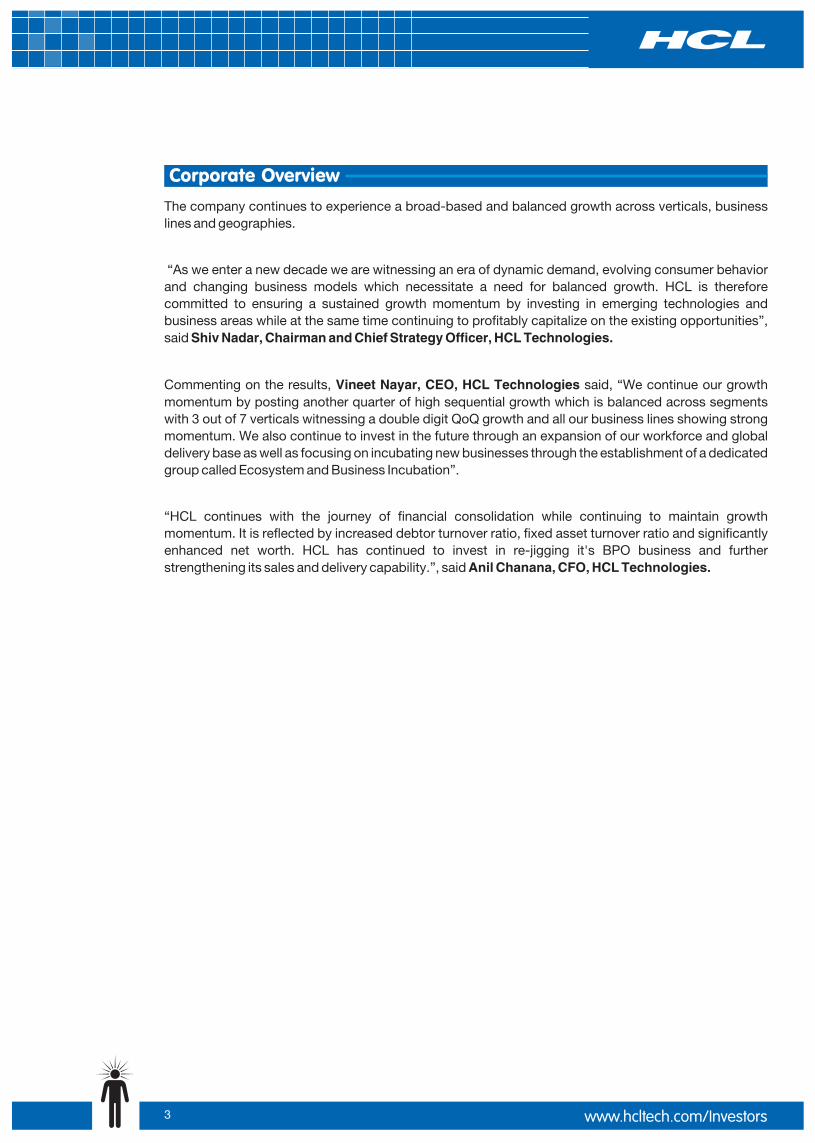
The company continues to experience a broad-based and balanced growth across verticals, business lines and geographies.
“As we enter a new decade we are witnessing an era of dynamic demand, evolving consumer behavior and changing business models which necessitate a need for balanced growth. HCL is therefore committed to ensuring a sustained growth momentum by investing in emerging technologies and business areas while at the same time continuing to profitably capitalize on the existing opportunities”, said Shiv Nadar, Chairman and Chief Strategy Officer, HCL Technologies.
Commenting on the results, Vineet Nayar, CEO, HCL Technologies said, “We continue our growth momentum by posting another quarter of high sequential growth which is balanced across segments with 3 out of 7 verticals witnessing a double digit QoQ growth and all our business lines showing strong momentum. We also continue to invest in the future through an expansion of our workforce and global delivery base as well as focusing on incubating new businesses through the establishment of a dedicated group called Ecosystem and Business Incubation”.
“HCL continues with the journey of financial consolidation while continuing to maintain growth momentum. It is reflected by increased debtor turnover ratio, fixed asset turnover ratio and significantly enhanced net worth. HCL has continued to invest in re-jigging it's BPO business and further strengthening its sales and delivery capability.”, said Anil Chanana, CFO, HCL Technologies.

4
Performance Highlights
Overall Company
QoQ Revenue Growth %
3.8%3.4%
5.1%
7.7%
9.0%
3.0%
4.0%
5.0%
6.0%
7.0%
8.0%
9.0%
10.0%
Sep'09 Dec'09 Mar'10 Jun'10 Sep'10
Qo
Qgr
ow
th%
YoY Revenue Growth %
25.8%
21.5%
27.6%
21.4%
28.5%
17.0%
19.0%
21.0%
23.0%
25.0%
27.0%
29.0%
31.0%
Sep'09 Dec'09 Mar'10 Jun'10 Sep'10
YoY
gro
wth
%
EBIT Trends
92.4109.5 113.7 108 110.8 113
103.7
25
75
125
175
Mar'09 Jun'09 Sep'09 Dec'09 Mar'10 Jun'10 Sep'10
USD
Mn

US$ Growth
5
Key Catalysts for Growth
? Revenue grows by 9.0%
? IT Services leading the broad based revenue growth at 9.2%
?Revenue growth across all IT Services offerings namely, Custom Applications at 15.0%, Infrastructure Services at 8.9%, Enterprise Applications at 6.3% and Engineering and R&D at 4.0%
?All verticals have reported positive growth with Retail & CPG, Healthcare and Financial Services posting a double digit growth.
?Retail & CPG grew 13.0%, Healthcare by 11.7% and Financial Services by 10.0%
?All geographies reported positive growth
* Constant Currency
JAS ’10Particulars Segments #YoY QoQ QoQ (CC)* 4Q CQGR
Consolidated For the Company 27.6% 9.0% 7.4% 6.3%
Geography Rest of the World 58.6% 19.8% 16.7% 12.2%
Europe 17.5% 18.2% 13.4% 4.1%
Americas 26.0% 2.8% 2.8% 6.0%
Service Offering
Enterprise Application Services 25.9% 6.3% 4.7% 5.9%
Engineering and R&D Services 27.8% 4.0% 3.2% 6.3%
Industry
Custom Application Services 30.3% 15.0% 12.9% 6.8%
Infrastructure Services 46.9% 8.9% 7.6% 10.1%
Retail & CPG 54.6% 13.0% 11.2% 11.5%
Healthcare 68.2% 11.7% 10.5% 13.9%
Financial Services 21.9% 10.0% 7.2% 5.1%
Telecom 8.5% 9.9% 7.2% 2.1%
Manufacturing 26.4% 8.7% 7.9% 6.0%
Energy-Utilities-Public Sector 27.5% 7.9% 6.5% 6.3%
Media, Publishing & 30.3% 1.9% 1.3% 6.8%Entertainment (MPE)
* Note: All numbers are on reported currency (US$) basis and the growth rates given are Quarter on Quarter (QoQ)
# CQGR numbers are for 4 quarters beginning from Jul-Sep'09 quarter.

6
• HCL won 14 major deals during the last quarter from leading global companies. These deals span across all services lines and the vertical segments including Financial Services, Manufacturing, Automobiles, Travel, Transportation & Logistics and Healthcare. These deals have been won from across geographies; Americas, followed by UK, Continental Europe and the Rest of the World.
Multi-Year, Multi-Million Dollar Deals
• HCL continues to strengthen its relationship with the World Economic Forum (WEF). The company was invited to speak at WEF’s Annual Meeting of New Champions 2010, at Tianjin, People’s Republic of China and also chaired a ‘Meet the Leader’ workshop with the ‘Young Global Leaders Forum’, a multi-stakeholder community of exceptional young leaders identified by WEF from across the world.
• HCL was invited into the panel of “Mavericks” (the term used to describe management gurus in this forum) on the Management Innovation eXchange (MIX), an open innovation project (founded and led by Professor Gary Hamel of the London Business School) designed to socially collaborate with innovators across the world keen on developing Management 2.0 practices.
• At the Gartner Outsourcing & Vendor Management Summit 2010, two of our Customers namely, Pearson and Oncor Electric Delivery Company showcased the benefits derived as result of their successful engagement with HCL.
• HCL signed the largest IT contract for power distribution reforms in India which will enable ‘Smart Grid’ deployment for a power distribution agency. The company also contributed to World Economic Forum’s Report on Smart Grids titled, ‘Accelerating successful smart grid pilots’ in its capacity as a Smart Grid Task Force Member.
Transformation @ HCL

7
• For the first time, HCL Technologies was included in Forbes magazine’s prestigious ‘Asia’s Fab 50 List’ for 2010. This List is Forbes’ “annual compilation of the best big public companies in the Asia-Pacific region”. The companies are shortlisted based on their five-year track record of revenues, operating earnings and return on capital. Other factors taken into account include most recent results, share-price movements, business outlook, transparency and accounting among others.
• HCL was named a leader in the August 2010 report ‘Forrester Wave™: North American Applications Outsourcing’, Q3 2010. HCL was among a select group of 12 vendors that Forrester evaluated based on current offerings, strategy and market presence. According to this report, "HCL is another company that is growing more rapidly than its direct competitors.”
• HCL was positioned in the Gartner Magic Quadrant for Desktop Outsourcing, Europe and Gartner's Magic Quadrant for Helpdesk Outsourcing for Europe. It also received a positive rating MarketScope for Managed Security Services in Europe from Gartner.
• Gartner published a case study titled ‘Genzyme Diagnostics Leverages Oracle and HCL Technologies to Eliminate Demand Latency’, Sept 2010 by Michael Dominy.
• HCL rated ‘Positive’ in Gartner MarketScope for Managed Security Services in Europe.
• HCL was named a leader in IDC’s MarketScape Global Discrete & Embedded Product Engineering Testing Services Vendor Assessment Report of September 2010. HCL was among a group of 13 vendors that IDC evaluated based on current offerings, strategy and market presence. HCL was also named a ‘major player’ in the Enterprise Application Testing Services vendor assessment.
• IDC identified HCL as one of the “rising players in the Nordic IT services” space. As per IDC, HCL’s current position in the Nordics is a Challenger position with strong propositions in key verticals such as Manufacturing, Consumers Services (Retail & T&M), Financial Services, Healthcare and Energy/utilities.
• Information Week conferred the ‘Value Honors’ awards to 6 HCL ISD customers. The customers were recognized for their immense contribution in creating “value and transforming business” in their global sourcing engagements.
• The Harvard Business Press book “Employees First, Customers Second - Turning Conventional Management Upside Down” authored by HCL Technologies’ CEO Vineet Nayar, was launched in Japan and talked about widely by leading analysts and publications. The book, available globally in English since June, is already being translated into several languages, including Spanish, Portugese, Complex Chinese and Korean.
Recognitions

8
Corporate
• HCL launched an on-premise software application - ‘manageCarbon’ that helps businesses aggregate, analyze, and manage carbon emissions data. This cloud application is delivered from the Windows Azure platform, lowering the investment required by customers, trimming deployment to one-quarter of the time, simplifying the development and maintenance of the application, and lowering the total cost of ownership.
• HCL entered into a strategic, go-to-market partnership with Oracle to help pharmaceutical organizations comply with new and increasingly stringent regulatory requirements while reducing business risk. This partnership will help support HCL’s customers in the life sciences industry, to facilitate compliance and reduce business and reputational risk associated with the rising incidence of drug counterfeiting and product diversion.
• HCL tied up a strategic partnership with Daon, a leading provider of biometric identity assurance software, to help aviation, transportation, government and public sector clients solve their identity program challenges through innovative biometric technology solutions.
• HCL became a member of Texas Instruments (TI) Elite Design House program, a premier group of independent, well-established companies that offer system-level design services. HCL will leverage this partnership in building product components and solution accelerators for three major segments - Aerospace, Medical Electronics and Consumer Electronics, with a specific focus on medical imaging, wireless communication and analog system applications.
• HCL launched AeroPASS(TM), a future-proofed, flexible and secure biometric Airport Security Solution for expediting the passage of pilots and flight attendants through security checkpoints and into sterile airport areas.
Americas
During Q1 FY11, the Americas contributed US$ 466 mn in revenues which is about 58% of overall revenues of HCL Technologies. Revenue grew 2.8% QoQ & 26% YoY during the quarter ended September 2010.
• HCL won several contracts across Americas this quarter including a SAP implementation engagement for a leading utility company and a multi-million, multi-year Infrastructure services contract from a leading consumer goods MNC; both in Latin America. It also won an IT Infrastructure services deal from a major Pharmaceutical company in North America and a strategic contract from a leading insurance provider in Canada
• HCL has undertaken a CRM strategy assessment for a top 3 Pharma company to define landscape for contact centers for processes, technology and people, develop a business case and help implement the roll out and another engagement for implementing SAP CRM, BI and Business Objects with a leading distributor of fuel and lubricants.
• HCL partnered with Health Language Inc. (HLI), the global leader in medical terminology management, to help healthcare entities lower the cost and simplify the ICD-10 conversion across the provider-payer continuum by leveraging HLI’s Language Engine® as part of the company’s end-to-end ICD-10 conversion solution.
• HCL’s CapitalStream™ “Straight Through Processing” (STP) solution went live for the Boston Private Bank & Trust Company. The CapitalStream solution was selected by the Boston Private Bank for its proven track record of success along with the ability to automate and integrate into existing systems and functions throughout the lending process, providing faster and easier access to information.
• HCL announced that Central Bancshares (Central), a leading financial services holding company, is realizing significant operational benefits and improved processing efficiency by 23% in a little more than one year after implementing the CapitalStream™ straight through processing (STP) solution.
Business Highlights

Geo Overview
9
Business Highlights
Europe
During Q1 FY11, the Europe business has contributed US$ 215 mn in revenues which is 26.7%of overall revenues of HCL Technologies. Europe witnessed 17.5% YoY and 18.2% QoQ growth.
• HCL inked several new contracts across Europe this quarter, including one of the largest financial institutions in Ireland and a top General Insurance company in the Nordics regions where HCL will be providing business transformation through development, implementation and support & maintenance of their claims management system.
• HCL reinforced its relationship with GFI Infortmatique, with an order for one of the major aerospace companies in France. HCL has a partnership with GFI, who is well positioned to provide on-site in-French IT Services for customers in France, allowing HCL to provide scalability and standardization.
Rest of the World
During Q1 FY11, the ROW region contributed US$ 123 mn in revenues this year which is about 15.3 % of overall revenues of HCL Technologies. This geography posted an encouraging growth of 19.8% QoQ and 58.6% YoY.
• South East Asia’s (SEA) largest telecommunication company entrusted HCL with implementation of their enterprise wide Data Warehousing system. This is engagement marks a significant milestone in HCL’s focus on the telecommunication markets in Emerging geographies.
• Other strategic deals in this region included a seven year Total IT Outsourcing Services agreement with Kingdom of Saudi Arabia based Al Majdouie Group, a large IT Infrastructure services deal with a Hong Kong based leading airline company for the roll out of best-of-breed IT Operations Tools and an IT Infrastructure support services contract with Australia’s leading provider of general insurance and reinsurance services.
• HCL also inked a deal with New Zealand Department of Corrections to develop technology solutions for the country’s prison system.
10
Financials
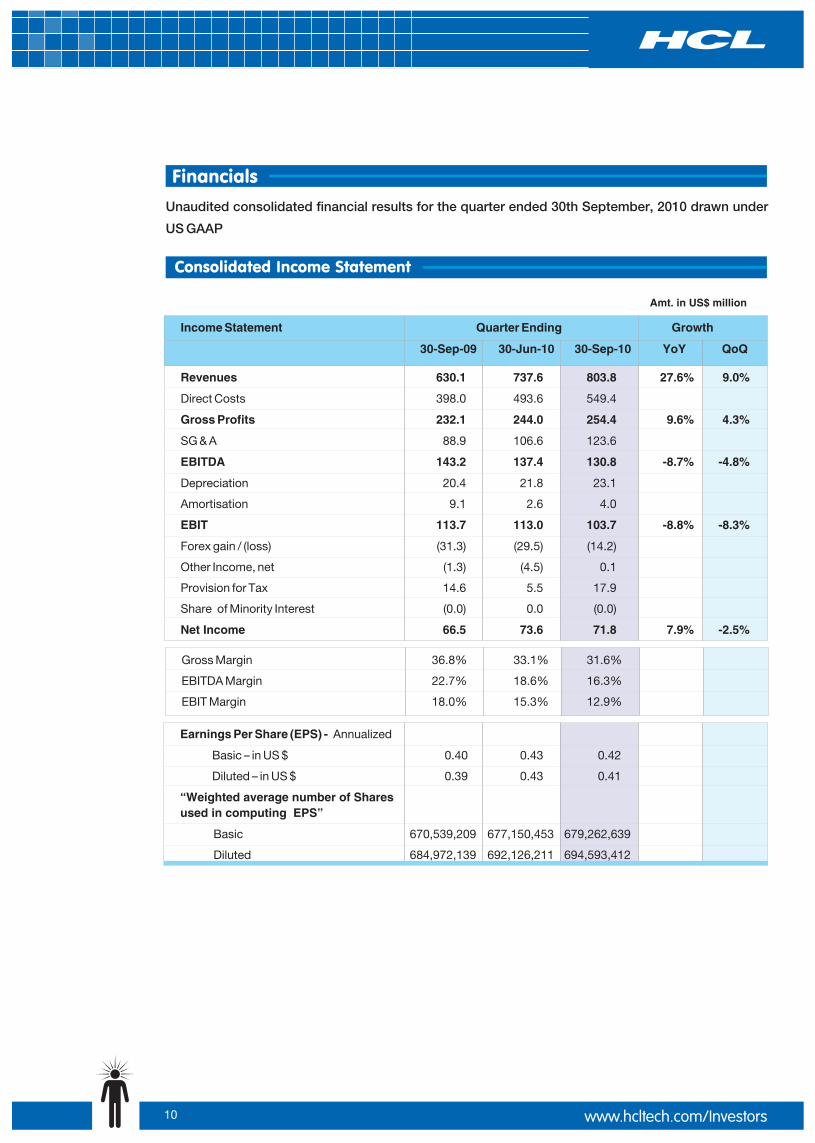
Unaudited consolidated financial results for the quarter ended 30th September, 2010 drawn under
US GAAP
Consolidated Income Statement
Income Statement Quarter Ending Growth
YoY QoQ
Revenues 630.1 737.6 803.8 27.6% 9.0%
Direct Costs 398.0 493.6 549.4
Gross Profits 232.1 244.0 254.4 9.6% 4.3%
SG & A 88.9 106.6 123.6
EBITDA 143.2 137.4 130.8 -8.7% -4.8%
Depreciation 20.4 21.8 23.1
Amortisation 9.1 2.6 4.0
EBIT 113.7 113.0 103.7 -8.8% -8.3%
Forex gain / (loss) (31.3) (29.5) (14.2)
Other Income, net (1.3) (4.5) 0.1
Provision for Tax 14.6 5.5 17.9
Share of Minority Interest (0.0) 0.0 (0.0)
Net Income 66.5 73.6 71.8 7.9% -2.5%
30-Sep-09 30-Jun-10 30-Sep-10
Amt. in US$ million
Earnings Per Share (EPS) -
Basic – in US $ 0.40 0.43 0.42
Diluted – in US $ 0.39 0.43 0.41
“Weighted average number of Shares used in computing EPS”
Basic 670,539,209 677,150,453 679,262,639
Diluted 684,972,139 692,126,211 694,593,412
Annualized
Gross Margin 36.8% 33.1% 31.6%
EBITDA Margin 22.7% 18.6% 16.3%
EBIT Margin 18.0% 15.3% 12.9%

11
Note: - The above result does not take into account non cash employee stock options charge computed under FAS 123R, as per details given here:-
The options will vest in tranches till 2015
Consolidated Balance SheetAmt. in US$ million
Particulars As on
30-Jun-10 30-Sep-10
Assets
a) Cash & Cash Equivalents 100.9 94.6
b) Account Receivables, net 541.3 546.2
d) Fixed Deposits with Banks 235.0 291.5
g) Investment Securities, available for sale 168.4 60.8
h) Other Current Assets 190.5 220.7
A) Total Current Assets (a+b+c+d+e+f+g+h) 1,373.0 1,415.1
B) Property and Equipments, net 398.1 424.4
C) Intangible Assets, net 928.6 945.8
D) Investment Securities, held to maturity 10.8 21.2
E Deposits with HDFC Ltd. - 11.1
F - 24.6
G) Investment in Equity Investee 4.5 4.4
H) Other Assets 207.6 239.0
Total Assets (A+B+C+D+E+F ) 2,922.4 3,085.7
Liabilities & Stockholders' Equity
a) Total Current Liabilities 674.6 691.4
b) Borrowings 573.5 577.3
c) Other Liabilities 159.0 159.2
I) Total Liabilities (a+b+c) 1,407.1 1,428.0
J) Total Stockholders Equity 1,515.3 1,657.7
Total Liabilities and Stockholders Equity 2,922.4 3,085.7
c) Unbilled Revenues* 115.4 168.2
e) Deposits with HDFC Ltd. 21.5 22.3
f) Investment Securities, held till maturity - 10.7
)
) Fixed Deposits with Banks
+G+H
(I+J)
* Note: Historically the Unbilled Revenues has remained in the range of 16-19 Days of Sales, which is 19 Days for the current Quarter.
Particulars (in US $ mn)
Option Charge 4.2 5.2 5.4
Tax benefit 0.3 0.2 0.5
Option Charge (net-of Tax benefit) 3.9 5.1 4.9
30-Sep-09 30-Jun-10 30-Sep-10
Outstanding Options (in equivalent no of shares)
Options at market price 23,408,288 15,806,128 13,812,152
Options at less than market price 9,630,216 8,006,468 15,444,396
30-Sep-09 30-Jun-10 30-Sep-10
Consolidated Cash Flow Statement
12
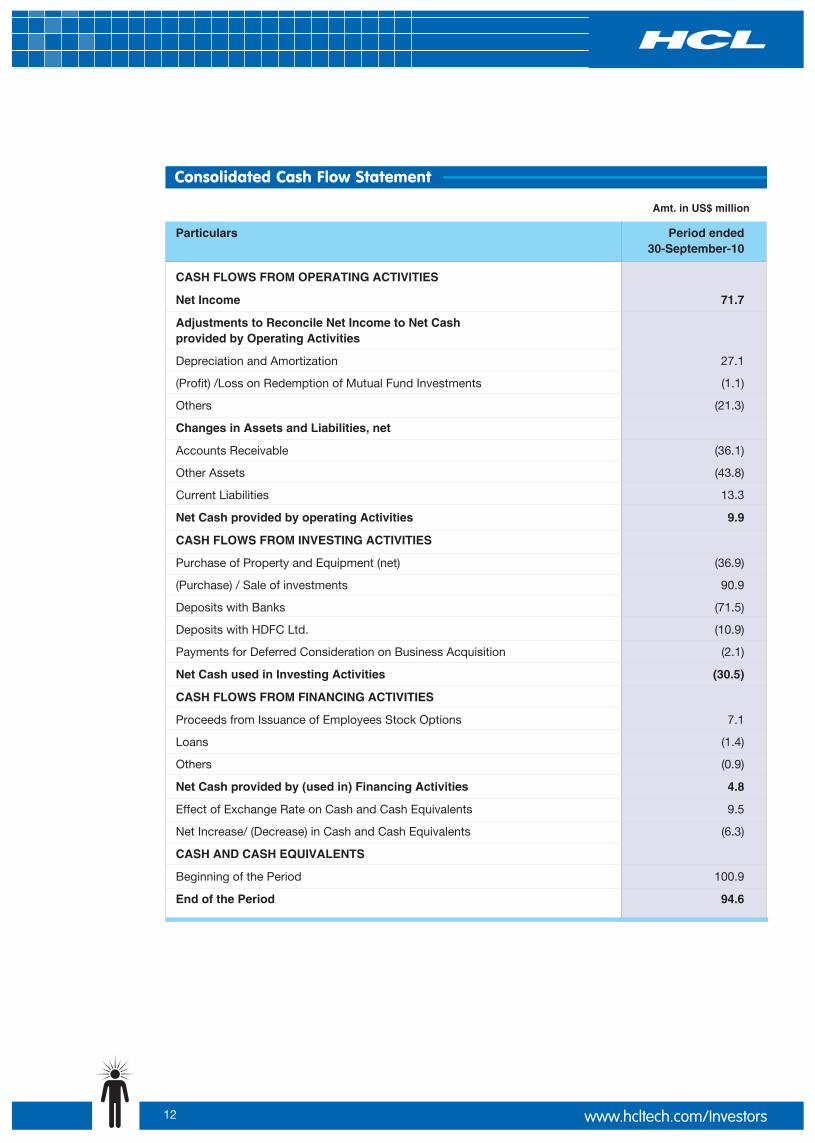
Consolidated Cash Flow Statement
Amt. in US$ million
Particulars Period ended30-September-10
CASH FLOWS FROM OPERATING ACTIVITIES
Net Income 71.7
Adjustments to Reconcile Net Income to Net Cash provided by Operating Activities
Depreciation and Amortization 27.1
(Profit) /Loss on Redemption of Mutual Fund Investments (1.1)
Others (21.3)
Changes in Assets and Liabilities, net
Accounts Receivable (36.1)
Other Assets (43.8)
Current Liabilities 13.3
Net Cash provided by operating Activities 9.9
CASH FLOWS FROM INVESTING ACTIVITIES
Purchase of Property and Equipment (net) (36.9)
(Purchase) / Sale of investments 90.9
Deposits with Banks (71.5)
Deposits with HDFC Ltd. (10.9)
Payments for Deferred Consideration on Business Acquisition (2.1)
Net Cash used in Investing Activities (30.5)
CASH FLOWS FROM FINANCING ACTIVITIES
Proceeds from Issuance of Employees Stock Options 7.1
Loans (1.4)
Others (0.9)
Net Cash provided by (used in) Financing Activities 4.8
Effect of Exchange Rate on Cash and Cash Equivalents 9.5
Net Increase/ (Decrease) in Cash and Cash Equivalents (6.3)
CASH AND CASH EQUIVALENTS
Beginning of the Period 100.9
End of the Period 94.6

Segment wise Profitability
A. Consolidated IT Services (Software Services [A1] & Infrastructure services [A2])
13
Amt. in US$ million
B. BPO Services
Amt. in US$ million
Quarter ended Growth%
Particulars
Revenues 571.3 692.1 755.7 32.3% 9.2%
Direct Costs 357.4 453.8 510.0
Gross Profits 213.9 238.3 245.7 14.9% 3.1%
SG & A 79.1 95.7 110.7
EBITDA 134.8 142.6 135.0 0.2% -5.3%
Depreciation 17.9 19.4 20.4
Amortisation 8.6 3.7 3.8
EBIT 108.3 119.5 110.8 2.4% -7.3%
Gross Margin 37.4% 34.4% 32.5%
EBITDA Margin 23.6% 20.6% 17.9%
EBIT Margin 19.0% 17.3% 14.7%
30-Sep-09 30-Jun-10 30-Sep-10 YoY QoQ
Quarter ended Growth%
Particulars
Revenues 58.8 45.5 48.1 -18.2% 5.7%
Direct Costs 40.6 39.8 39.4
Gross Profits 18.2 5.7 8.7 -52.2% 53.6%
SG & A 9.8 10.8 12.9
EBITDA 8.4 (5.2) (4.2) -150.3% 18.4%
Depreciation 2.5 2.4 2.7
Amortisation 0.5 (1.1) 0.2
EBIT 5.4 (6.5) (7.1) -231.8% -10.2%
Gross Margin 31.0% 12.5% 18.1%
EBITDA Margin 14.3% -11.4% -8.8%
EBIT Margin 9.2% -14.2% -14.8%
30-Sep-09 30-Jun-10 30-Sep-10 YoY QoQ

14
Amt. in US$ million
A2. Infrastructure Services
Amt. in US$ million
A1. Software Services
Quarter ended Growth%
Particulars
Revenues 448.8 526.8 575.7 28.3% 9.3%
Direct Costs 272.9 335.3 376.9
Gross Profits 175.9 191.5 198.9 13.1% 3.9%
SG & A 65.3 80.0 95.8
EBITDA 110.6 111.4 103.1 -6.8% -7.5%
Depreciation 13.6 13.1 14.0
Amortisation 8.6 3.7 3.8
EBIT 88.4 94.6 85.2 -3.6% -10.0%
Gross Margin 39.2% 36.3% 34.5%
EBITDA Margin 24.6% 21.2% 17.9%
EBIT Margin 19.7% 18.0% 14.8%
30-Sep-09 30-Jun-10 30-Sep-10 YoY QoQ
Quarter ended Growth%
Particulars
Revenues 122.5 165.3 180.0 46.9% 8.9%
Direct Costs 84.5 118.5 133.2
Gross Profits 38.0 46.8 46.8 23.2% -0.1%
SG & A 13.8 15.7 14.8
EBITDA 24.2 31.1 32.0 32.2% 2.7%
Depreciation 4.3 6.3 6.3
EBIT 19.9 24.9 25.6 28.9% 3.0%
Gross Margin 31.0% 28.3% 26.0%
EBITDA Margin 19.7% 18.8% 17.8%
EBIT Margin 16.2% 15.0% 14.2%
30-Sep-09 30-Jun-10 30-Sep-10 YoY QoQ
15
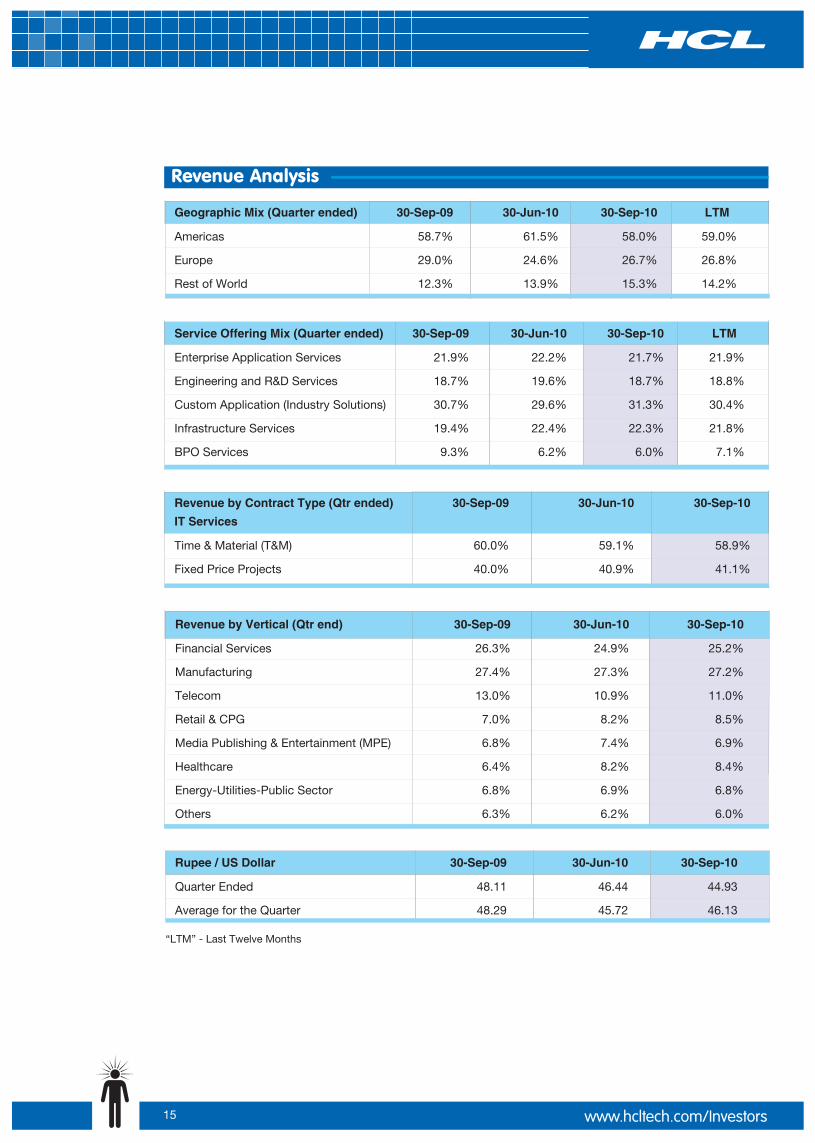
Revenue Analysis
Geographic Mix (Quarter ended)
Americas 58.7% 61.5% 58.0% 59.0%
Europe 29.0% 24.6% 26.7% 26.8%
Rest of World 12.3% 13.9% 15.3% 14.2%
30-Sep-09 30-Jun-10 30-Sep-10 LTM
Service Offering Mix (Quarter ended)
Enterprise Application Services 21.9% 22.2% 21.7% 21.9%
Engineering and R&D Services 18.7% 19.6% 18.7% 18.8%
Custom Application (Industry Solutions) 30.7% 29.6% 31.3% 30.4%
Infrastructure Services 19.4% 22.4% 22.3% 21.8%
BPO Services 9.3% 6.2% 6.0% 7.1%
30-Sep-09 30-Jun-10 30-Sep-10 LTM
Revenue by Contract Type (Qtr ended)
IT Services
Time & Material (T&M) 60.0% 59.1% 58.9%
Fixed Price Projects 40.0% 40.9% 41.1%
30-Sep-09 30-Jun-10 30-Sep-10
“LTM” - Last Twelve Months
Rupee /
Quarter Ended 48.11 46.44 44.93
Average for the Quarter 48.29 45.72 46.13
US Dollar 30-Sep-09 30-Jun-10 30-Sep-10
Revenue by Vertical (Qtr end)
Financial Services 26.3% 24.9% 25.2%
Manufacturing 27.4% 27.3% 27.2%
Telecom 13.0% 10.9% 11.0%
Retail & CPG 7.0% 8.2% 8.5%
Media Publishing & Entertainment (MPE) 6.8% 7.4% 6.9%
Healthcare 6.4% 8.2% 8.4%
Energy-Utilities-Public Sector 6.8% 6.9% 6.8%
Others 6.3% 6.2% 6.0%
30-Sep-09 30-Jun-10 30-Sep-10
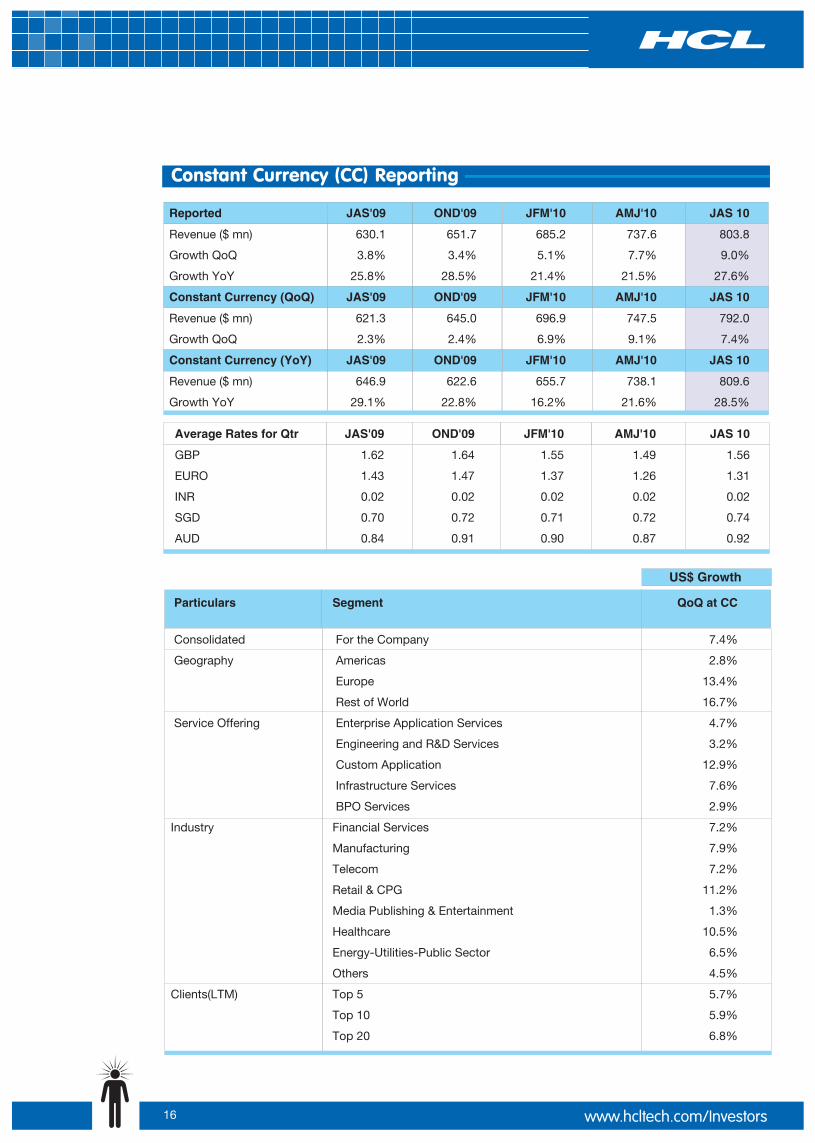
Constant Currency (CC) Reporting
Reported JAS'09 OND'09 JFM'10 AMJ'10 JAS 10
Revenue ($ mn) 630.1 651.7 685.2 737.6 803.8
Growth QoQ 3.8% 3.4% 5.1% 7.7% 9.0%
Growth YoY 25.8% 28.5% 21.4% 21.5% 27.6%
Constant Currency (QoQ) JAS'09 OND'09 JFM'10 AMJ'10 JAS 10
Revenue ($ mn) 621.3 645.0 696.9 747.5 792.0
Growth QoQ 2.3% 2.4% 6.9% 9.1% 7.4%
Constant Currency (YoY) JAS'09 OND'09 JFM'10 AMJ'10 JAS 10
Revenue ($ mn) 646.9 622.6 655.7 738.1 809.6
Growth YoY 29.1% 22.8% 16.2% 21.6% 28.5%
16
Average Rates for Qtr JAS'09 OND'09 JFM'10 AMJ'10 JAS 10
GBP 1.62 1.64 1.55 1.49 1.56
EURO 1.43 1.47 1.37 1.26 1.31
INR 0.02 0.02 0.02 0.02 0.02
SGD 0.70 0.72 0.71 0.72 0.74
AUD 0.84 0.91 0.90 0.87 0.92
Particulars Segment QoQ at CC
Consolidated For the Company 7.4%
Geography Americas 2.8%
Europe 13.4%
Rest of World 16.7%
Service Offering Enterprise Application Services 4.7%
Engineering and R&D Services 3.2%
Custom Application 12.9%
Infrastructure Services 7.6%
BPO Services 2.9%
Industry Financial Services 7.2%
Manufacturing 7.9%
Telecom 7.2%
Retail & CPG 11.2%
Media Publishing & Entertainment 1.3%
Healthcare 10.5%
Energy-Utilities-Public Sector 6.5%
Others 4.5%
Clients(LTM) Top 5 5.7%
Top 10 5.9%
Top 20 6.8%
US$ Growth
17
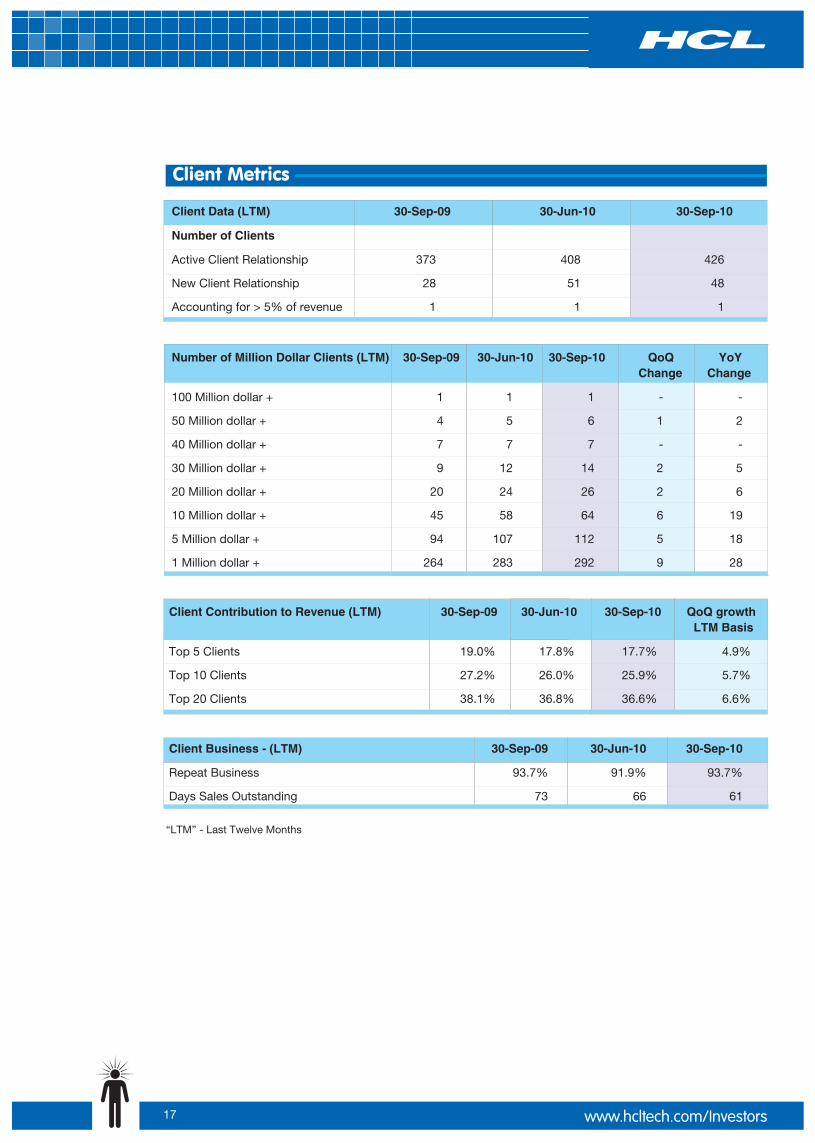
Client Metrics
“LTM” - Last Twelve Months
Client Business - (LTM) 30-Sep-09 30-Jun-10 30-Sep-10
Repeat Business 93.7% 91.9% 93.7%
Days Sales Outstanding 73 66 61
Client Contribution to Revenue (LTM) QoQ growth LTM Basis
Top 5 Clients 19.0% 17.8% 17.7% 4.9%
Top 10 Clients 27.2% 26.0% 25.9% 5.7%
Top 20 Clients 38.1% 36.8% 36.6% 6.6%
30-Sep-09 30-Jun-10 30-Sep-10
Client Data (LTM)
Number of Clients
Active Client Relationship 373 408 426
New Client Relationship 28 51 48
Accounting for > 5% of revenue 1 1 1
30-Sep-09 30-Jun-10 30-Sep-10
Number of Million Dollar Clients (LTM) QoQ YoYChange Change
100 Million dollar + 1 1 1 - -
50 Million dollar + 4 5 6 1 2
40 Million dollar + 7 7 7 - -
30 Million dollar + 9 12 14 2 5
20 Million dollar + 20 24 26 2 6
10 Million dollar + 45 58 64 6 19
5 Million dollar + 94 107 112 5 18
1 Million dollar + 264 283 292 9 28
30-Sep-09 30-Jun-10 30-Sep-10
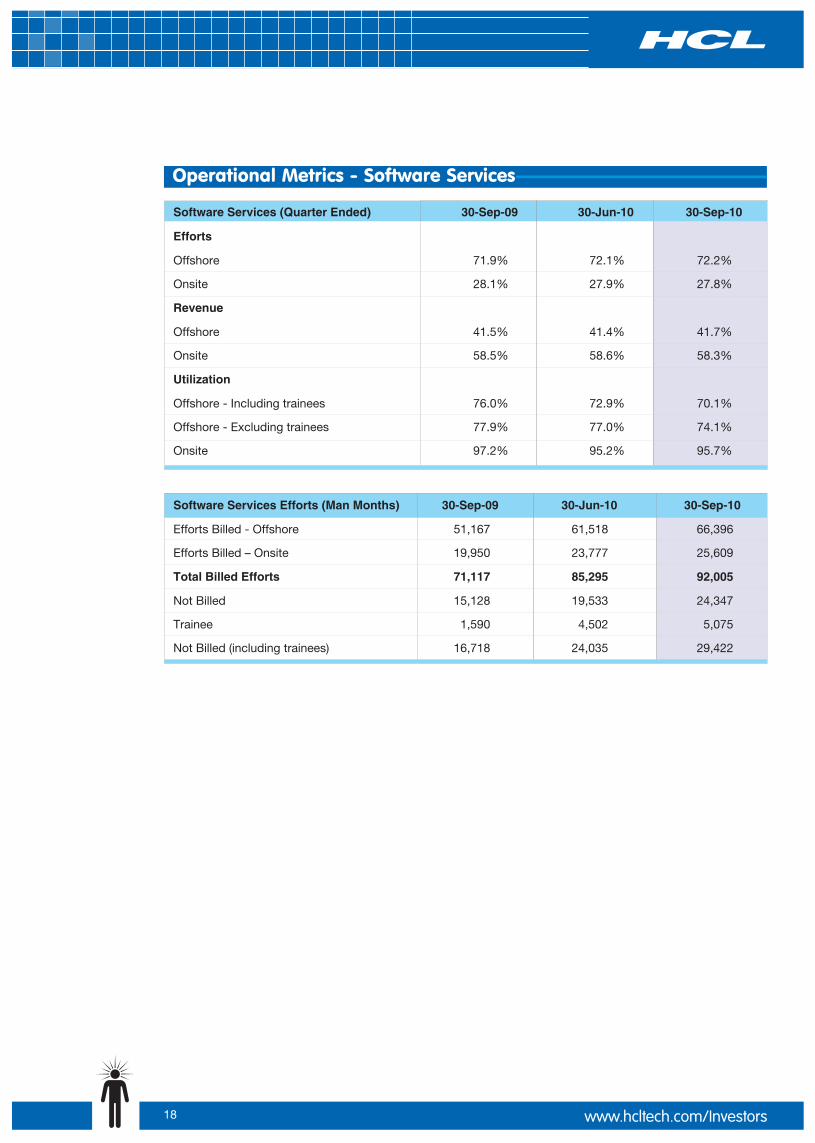
Operational Metrics - Software Services
18
Software Services (Quarter Ended)
Efforts
Offshore 71.9% 72.1% 72.2%
Onsite 28.1% 27.9% 27.8%
Revenue
Offshore 41.5% 41.4% 41.7%
Onsite 58.5% 58.6% 58.3%
Utilization
Offshore - Including trainees 76.0% 72.9% 70.1%
Offshore - Excluding trainees 77.9% 77.0% 74.1%
Onsite 97.2% 95.2% 95.7%
30-Sep-09 30-Jun-10 30-Sep-10
Software Services Efforts (Man Months)
Efforts Billed - Offshore 51,167 61,518 66,396
Efforts Billed – Onsite 19,950 23,777 25,609
Total Billed Efforts 71,117 85,295 92,005
Not Billed 15,128 19,533 24,347
Trainee 1,590 4,502 5,075
Not Billed (including trainees) 16,718 24,035 29,422
30-Sep-09 30-Jun-10 30-Sep-10
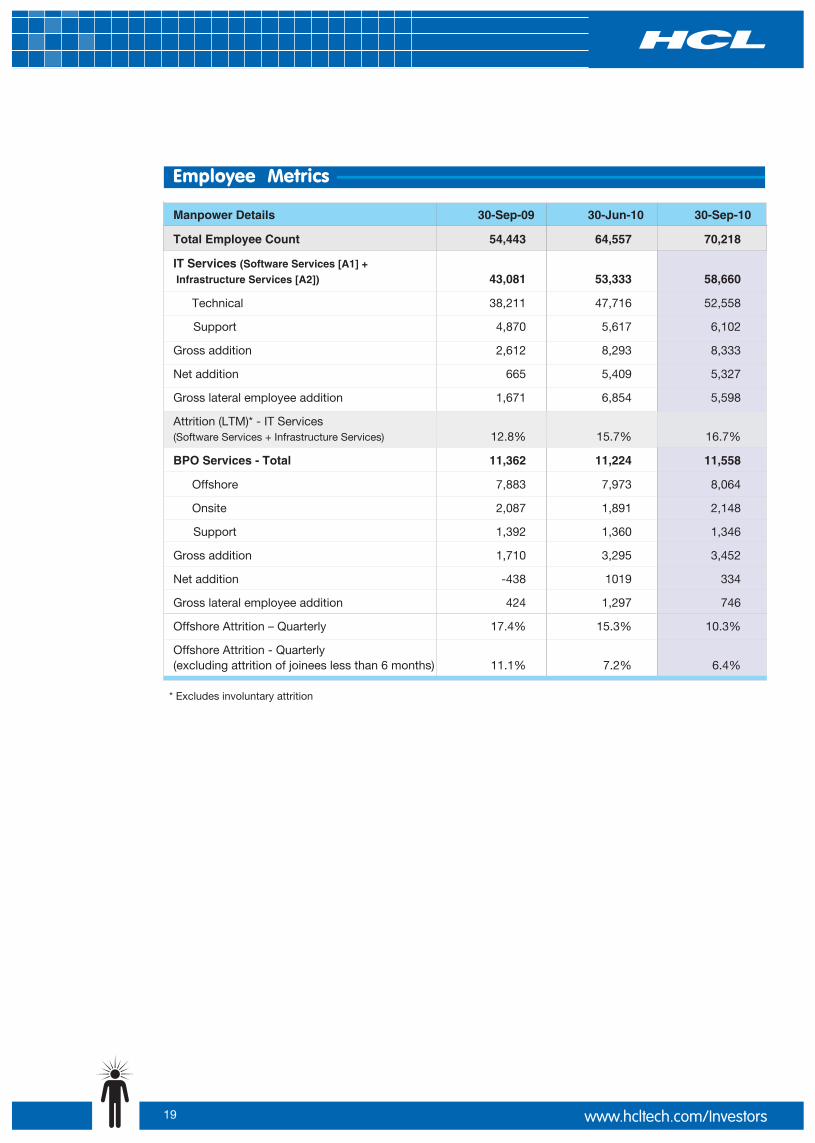
* Excludes involuntary attrition
Manpower Details
Total Employee Count 54,443 64,557 70,218
IT Services ( Infrastructure Services [A2]) 43,081 53,333 58,660
Technical 38,211 47,716 52,558
Support 4,870 5,617 6,102
Gross addition 2,612 8,293 8,333
Net addition 665 5,409 5,327
Gross lateral employee addition 1,671 6,854 5,598
Attrition (LTM)* - IT Services (Software Services + Infrastructure Services) 12.8% 15.7% 16.7%
BPO Services - Total 11,362 11,224 11,558
Offshore 7,883 7,973 8,064
Onsite 2,087 1,891 2,148
Support 1,392 1,360 1,346
Gross addition 1,710 3,295 3,452
Net addition -438 1019 334
Gross lateral employee addition 424 1,297 746
Offshore Attrition – Quarterly 17.4% 15.3% 10.3%
Offshore Attrition - Quarterly(excluding attrition of joinees less than 6 months) 11.1% 7.2% 6.4%
30-Sep-09 30-Jun-10 30-Sep-10
Software Services [A1] +
19
Employee Metrics

A2. Infrastructure Services
Infrastructure Services - Total 10,769 12,220 13,200
Technical 9,829 11,061 11,963
Support 940 1,159 1,237
Gross addition 1,092 1,205 1,738
Net addition 717 465 980
Gross lateral employee addition 608 1,112 1,109
Attrition (LTM) 13.2% 16.0% 16.9%
30-Sep-09 30-Jun-10 30-Sep-10
Software Services - Total 32,312 41,113 45,460
Technical 28,382 36,655 40,595
Support 3,930 4,458 4,865
Gross addition 1,520 7,088 6,595
Net addition -52 4,944 4,347
Gross lateral employee addition 1,063 5,742 4,489
Attrition (LTM) 12.7% 15.5% 16.6%
30-Sep-09 30-Jun-10 30-Sep-10
A1. Software Services
20
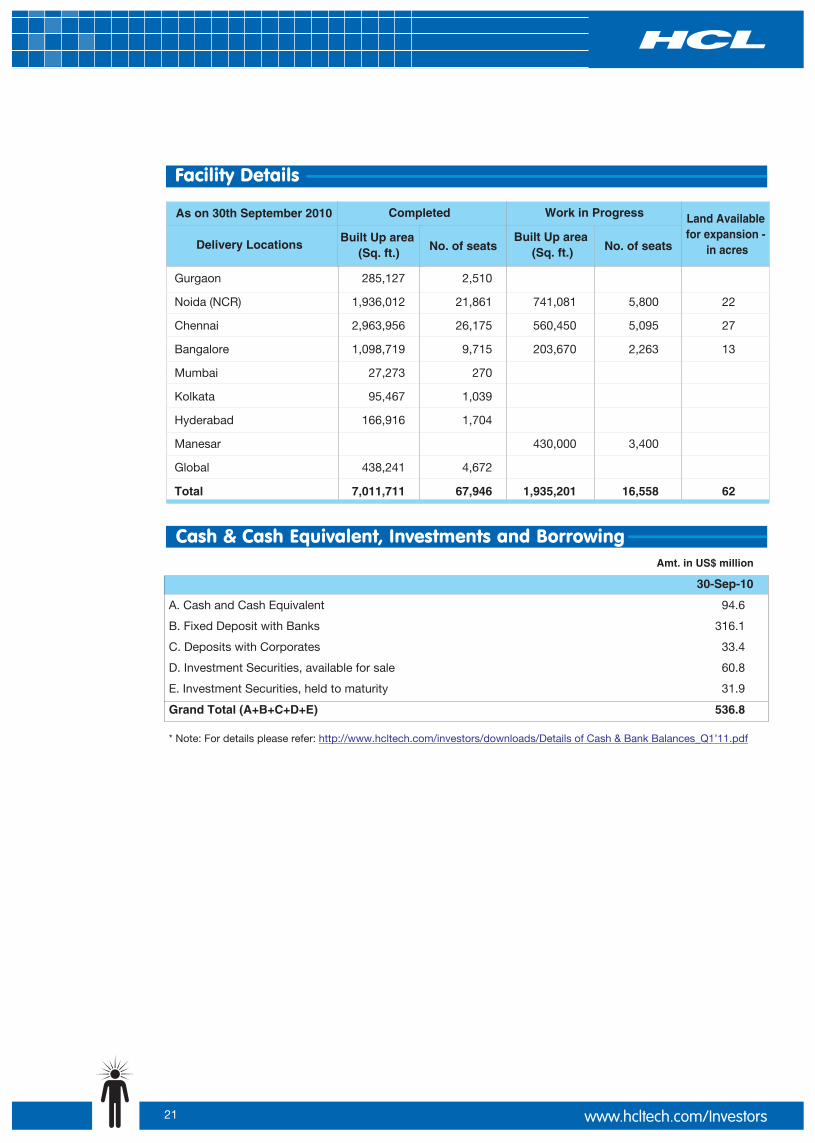
As on 30th September 2010 Completed Work in Progress Land Available for expansion -
in acresBuilt Up area
(Sq. ft.) No. of seatsBuilt Up area
(Sq. ft.) No. of seatsDelivery Locations
Facility Details
Gurgaon 285,127 2,510
Noida (NCR) 1,936,012 21,861 741,081 5,800 22
Chennai 2,963,956 26,175 560,450 5,095 27
Bangalore 1,098,719 9,715 203,670 2,263 13
Mumbai 27,273 270
Kolkata 95,467 1,039
Hyderabad 166,916 1,704
Manesar 430,000 3,400
Global 438,241 4,672
Total 7,011,711 67,946 1,935,201 16,558 62
21
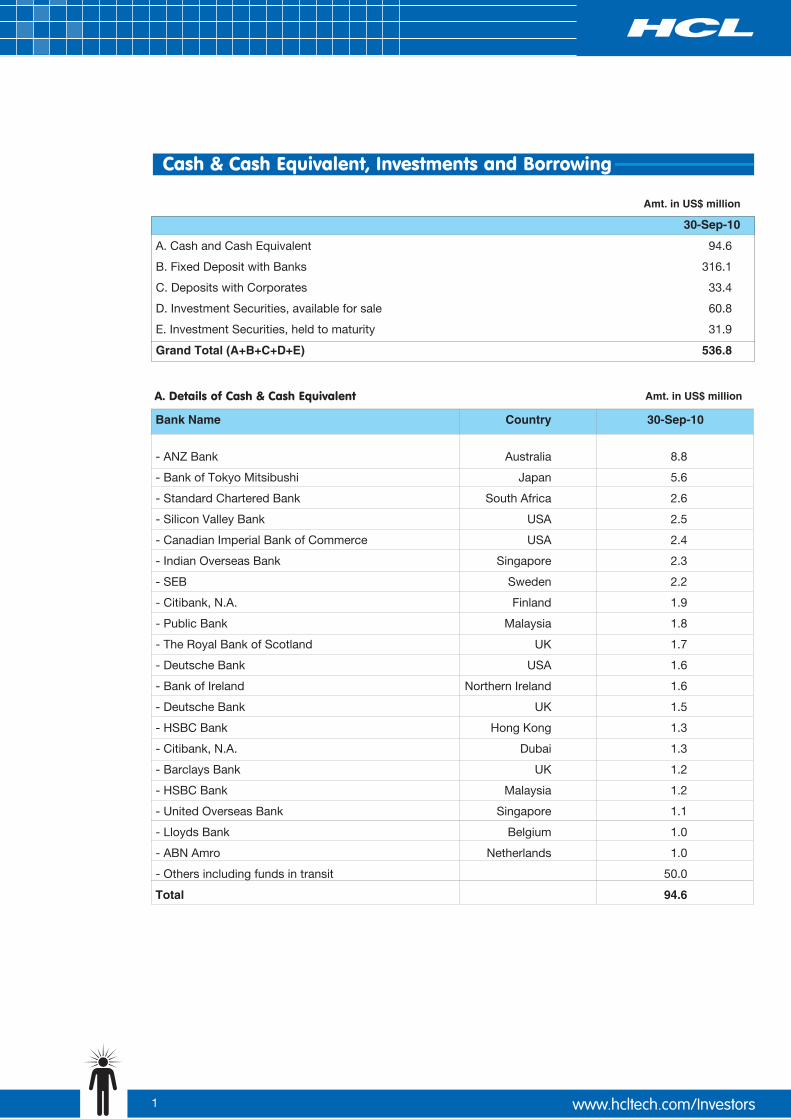
Cash & Cash Equivalent, Investments and Borrowing
Amt. in US$ million
30-Sep-10
A. Cash and Cash Equivalent 94.6
B. Fixed Deposit with Banks 316.1
C. Deposits with Corporates 33.4
D. Investment Securities, available for sale 60.8
E. Investment Securities, held to maturity 31.9
Grand Total (A+B+C+D+E) 536.8
* Note: For details please refer: http://www.hcltech.com/investors/downloads/Details of Cash & Bank Balances_Q1’11.pdf
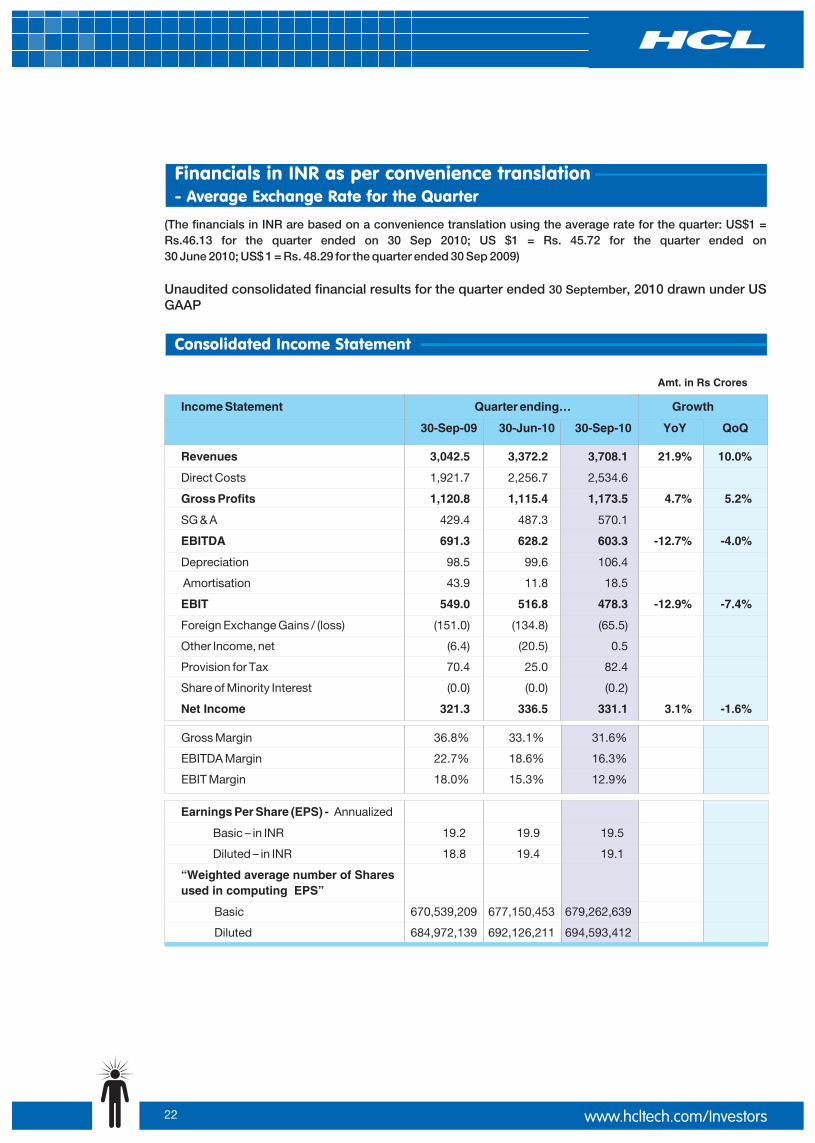
Financials in INR as per convenience translation- Average Exchange Rate for the Quarter
(The financials in INR are based on a convenience translation using the average rate for the quarter: US$1 = Rs.46.13 for the quarter ended on 30 Sep 2010; US $1 = Rs. 45.72 for the quarter ended on
; US$ 1 = Rs. 48.29 for the quarter ended 2009)
Unaudited consolidated financial results for the quarter ended , 2010 drawn under US GAAP
30 June 2010 30 Sep
30 September
Consolidated Income Statement
22
Amt. in Rs Crores
Income Statement Quarter ending… Growth
YoY QoQ
Revenues 3,042.5 3,372.2 3,708.1 21.9% 10.0%
Direct Costs 1,921.7 2,256.7 2,534.6
Gross Profits 1,120.8 1,115.4 1,173.5 4.7% 5.2%
SG & A 429.4 487.3 570.1
EBITDA 691.3 628.2 603.3 -12.7% -4.0%
Depreciation 98.5 99.6 106.4
Amortisation 43.9 11.8 18.5
EBIT 549.0 516.8 478.3 -12.9% -7.4%
Foreign Exchange Gains / (loss) (151.0) (134.8) (65.5)
Other Income, net (6.4) (20.5) 0.5
Provision for Tax 70.4 25.0 82.4
Share of Minority Interest (0.0) (0.0) (0.2)
Net Income 321.3 336.5 331.1 3.1% -1.6%
30-Sep-09 30-Jun-10 30-Sep-10
Gross Margin 36.8% 33.1% 31.6%
EBITDA Margin 22.7% 18.6% 16.3%
EBIT Margin 18.0% 15.3% 12.9%
Earnings Per Share (EPS) -
Basic – in INR 19.2 19.9 19.5
Diluted – in INR 18.8 19.4 19.1
“Weighted average number of Shares used in computing EPS”
Basic 670,539,209 677,150,453 679,262,639
Diluted 684,972,139 692,126,211 694,593,412
Annualized

Note: - The above result does not take into account non cash employee stock options charge computed under FAS 123R, as per details given here:-
Particulars (in Rs. Crore)
Option Charge
Tax benefit 1.4 0.9 2.4
Option Charge (net-of Tax benefit) 18.8 23.3 22.6
30-Sep-09 30-Jun-10 30-Sep-10
20.3 23.8 25.0
Outstanding Options (in equivalent no of shares)
Options at market price 23,408,288 15,806,128 13,812,152
Options at less than market price 9,630,216 8,006,468 15,444,396
30-Sep-09 30-Jun-10 30-Sep-10
The options will vest in tranches till 2015
23
Consolidated Balance Sheet (At Quarter Closing Exchange Rate of RS. 44.93/US$)
Amt. in Rs. Crore
Particulars As on
30-Jun-10 30-Sep-10
Assets
a) Cash & Cash Equivalents 468.6 425.2
b) Account Receivables, net 2,513.9 2,454.1
d) Fixed Deposits with Banks 1,091.3 1,309.9
g) Investment Securities, available for sale 782.0 273.2
h) Other Current Assets 884.5 991.6
A) Total Current Assets (a+b+c+d+e+f+g+h) 6,376.0 6,358.0
B) Property and Equipments, net 1,848.6 1,906.9
C) Intangible Assets, net 4,312.2 4,249.5
D) Investment Securities, held to maturity 50.0 95.2
E Deposit with HDFC Ltd. - 50.0
F - 110.6
G) Investment in Equity Investee 20.7 19.7
H) Other Assets 964.0 1,074.0
Total Assets (A+B+C+D+E+F ) 13,571.5 13,863.9
Liabilities & Stockholders' Equity
a) Total Current Liabilities 3,132.9 3,106.6
b) Borrowings 2,663.2 2,593.9
c) Other Liabilities 738.6 715.5
I) Total Liabilities (a+b+c) 6,534.7 6,416.0
J) Total Stockholders Equity 7,036.8 7,447.9
Total Liabilities and Stockholders Equity 13,571.5 13,863.9
c) Unbilled Revenues* 535.7 755.9
e) Deposits with HDFC Ltd. 100.0 100.0
f) Investment Securities, held till maturity - 48.2
)
) Fixed Deposits with Banks
+G+H
(I+J)
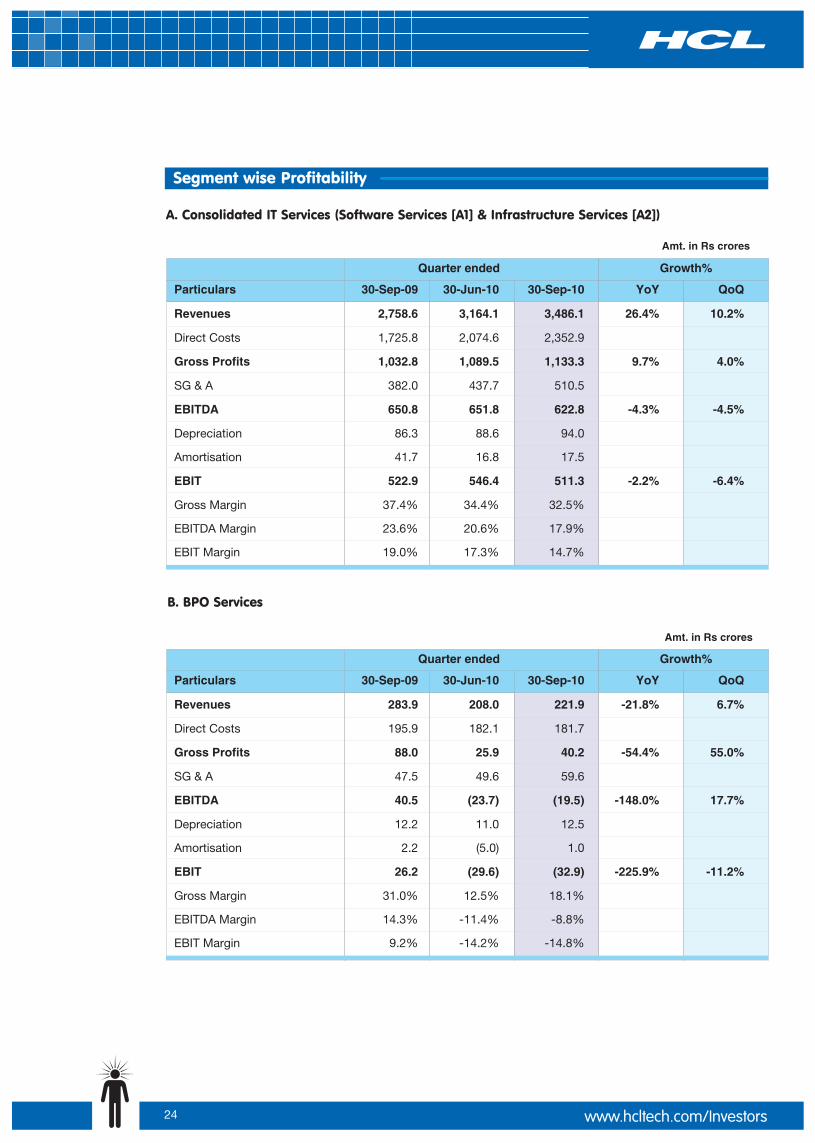
Amt. in Rs crores
B. BPO Services
Segment wise Profitability
Amt. in Rs crores
A. Consolidated IT Services (Software Services [A1] & Infrastructure Services [A2])
24
Quarter ended Growth%
Particulars 30-Sep-09 30-Jun-10 30-Sep-10 YoY QoQ
Revenues 2,758.6 3,164.1 3,486.1 26.4% 10.2%
Direct Costs 1,725.8 2,074.6 2,352.9
Gross Profits 1,032.8 1,089.5 1,133.3 9.7% 4.0%
SG & A 382.0 437.7 510.5
EBITDA 650.8 651.8 622.8 -4.3% -4.5%
Depreciation 86.3 88.6 94.0
Amortisation 41.7 16.8 17.5
EBIT 522.9 546.4 511.3 -2.2% -6.4%
Gross Margin 37.4% 34.4% 32.5%
EBITDA Margin 23.6% 20.6% 17.9%
EBIT Margin 19.0% 17.3% 14.7%
Quarter ended Growth%
Particulars 30-Sep-09 30-Jun-10 30-Sep-10 YoY QoQ
Revenues 283.9 208.0 221.9 -21.8% 6.7%
Direct Costs 195.9 182.1 181.7
Gross Profits 88.0 25.9 40.2 -54.4% 55.0%
SG & A 47.5 49.6 59.6
EBITDA 40.5 (23.7) (19.5) -148.0% 17.7%
Depreciation 12.2 11.0 12.5
Amortisation 2.2 (5.0) 1.0
EBIT 26.2 (29.6) (32.9) -225.9% -11.2%
Gross Margin 31.0% 12.5% 18.1%
EBITDA Margin 14.3% -11.4% -8.8%
EBIT Margin 9.2% -14.2% -14.8%
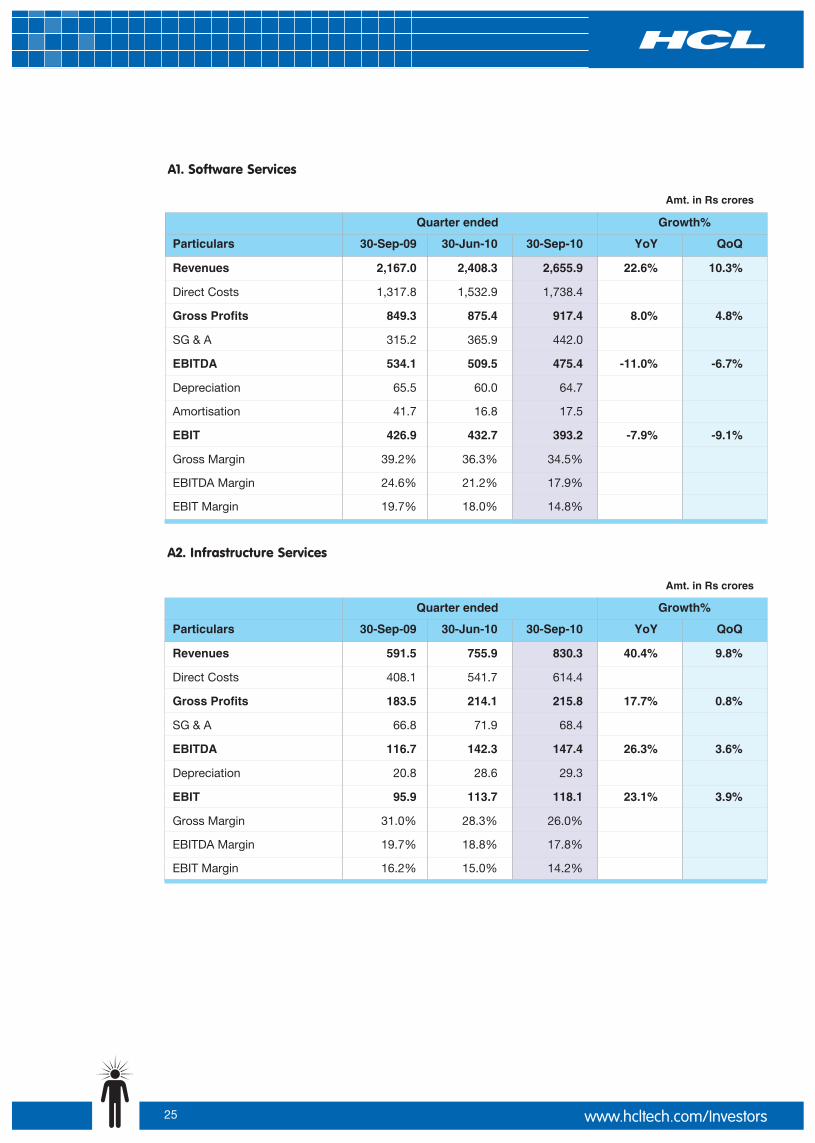
A1. Software Services
Amt. in Rs crores
A2. Infrastructure Services
Amt. in Rs crores
Quarter ended Growth%
Particulars 30-Sep-09 30-Jun-10 30-Sep-10 YoY QoQ
Revenues 2,167.0 2,408.3 2,655.9 22.6% 10.3%
Direct Costs 1,317.8 1,532.9 1,738.4
Gross Profits 849.3 875.4 917.4 8.0% 4.8%
SG & A 315.2 365.9 442.0
EBITDA 534.1 509.5 475.4 -11.0% -6.7%
Depreciation 65.5 60.0 64.7
Amortisation 41.7 16.8 17.5
EBIT 426.9 432.7 393.2 -7.9% -9.1%
Gross Margin 39.2% 36.3% 34.5%
EBITDA Margin 24.6% 21.2% 17.9%
EBIT Margin 19.7% 18.0% 14.8%
Quarter ended Growth%
Particulars 30-Sep-09 30-Jun-10 30-Sep-10 YoY QoQ
Revenues 591.5 755.9 830.3 40.4% 9.8%
Direct Costs 408.1 541.7 614.4
Gross Profits 183.5 214.1 215.8 17.7% 0.8%
SG & A 66.8 71.9 68.4
EBITDA 116.7 142.3 147.4 26.3% 3.6%
Depreciation 20.8 28.6 29.3
EBIT 95.9 113.7 118.1 23.1% 3.9%
Gross Margin 31.0% 28.3% 26.0%
EBITDA Margin 19.7% 18.8% 17.8%
EBIT Margin 16.2% 15.0% 14.2%
25

Financials in INR as per convenience translation- Closing Rate for the Quarter
(The financials in INR are based on a convenience translation using the closing rate as of the last day of the quarter: US$1 = Rs.44.93 for the quarter ended on 30 Sep 2010; US $1 = Rs. 46.44 for the quarter ended on
; US$ 1 = Rs. 48.11 for the quarter ended 2009)
Unaudited consolidated financial results for the quarter ended , 2010 drawn under US GAAP
30 June 2010 30 Sep
30 September
Consolidated Income Statement
26
Amt. in Rs Crores
Income Statement Quarter ending… Growth
YoY QoQ
Revenues 3,031.4 3,425.4 3,611.6 19.1% 5.4%
Direct Costs 1,914.7 2,292.3 2,468.7
Gross Profits 1,116.7 1,133.1 1,142.9 2.4% 0.9%
SG & A 427.9 495.0 555.3
EBITDA 688.8 638.1 587.6 -14.7% -7.9%
Depreciation 98.1 101.1 103.7
Amortisation 43.7 12.0 18.1
EBIT 547.0 524.9 465.9 -14.8% -11.2%
Forex gain / (loss) (150.4) (137.0) (63.8)
Other Income, net (6.3) (20.8) 0.4
Provision for Tax 70.2 25.4 80.2
Share of Minority Interest (0.1) 0.0 (0.2)
Net Income 320.1 341.8 322.5 0.8% -5.6%
30-Sep-09 30-Jun-10 30-Sep-10
Gross Margin 36.8% 33.1% 31.6%
EBITDA Margin 22.7% 18.6% 16.3%
EBIT Margin 18.0% 15.3% 12.9%
Earnings Per Share (EPS) -
Basic – in INR 19.3 20.2 19.0
Diluted – in INR 18.7 19.8 18.6
“Weighted average number of Shares used in computing EPS”
Basic 670,539,209 677,150,453 679,262,639
Diluted 684,972,139 692,126,211 694,593,412
Annualized
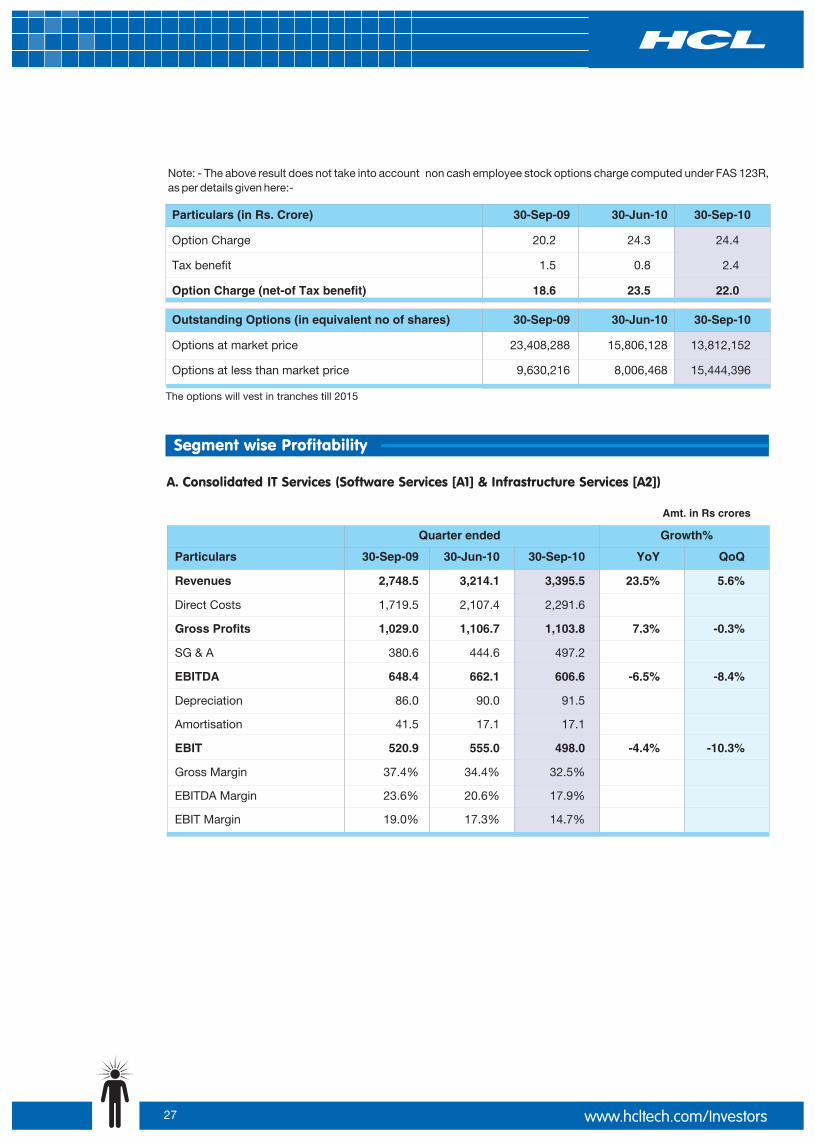
Segment wise Profitability
Amt. in Rs crores
A. Consolidated IT Services (Software Services [A1] & Infrastructure Services [A2])
Quarter ended Growth%
Particulars
Revenues 2,748.5 3,214.1 3,395.5 23.5% 5.6%
Direct Costs 1,719.5 2,107.4 2,291.6
Gross Profits 1,029.0 1,106.7 1,103.8 7.3% -0.3%
SG & A 380.6 444.6 497.2
EBITDA 648.4 662.1 606.6 -6.5% -8.4%
Depreciation 86.0 90.0 91.5
Amortisation 41.5 17.1 17.1
EBIT 520.9 555.0 498.0 -4.4% -10.3%
Gross Margin 37.4% 34.4% 32.5%
EBITDA Margin 23.6% 20.6% 17.9%
EBIT Margin 19.0% 17.3% 14.7%
30-Sep-09 30-Jun-10 30-Sep-10 YoY QoQ
Note: - The above result does not take into account non cash employee stock options charge computed under FAS 123R, as per details given here:-
Particulars (in Rs. Crore)
Option Charge 20.2 24.3 24.4
Tax benefit 1.5 0.8 2.4
Option Charge (net-of Tax benefit) 18.6 23.5 22.0
30-Sep-09 30-Jun-10 30-Sep-10
Outstanding Options (in equivalent no of shares)
Options at market price 23,408,288 15,806,128 13,812,152
Options at less than market price 9,630,216 8,006,468 15,444,396
30-Sep-09 30-Jun-10 30-Sep-10
The options will vest in tranches till 2015
27
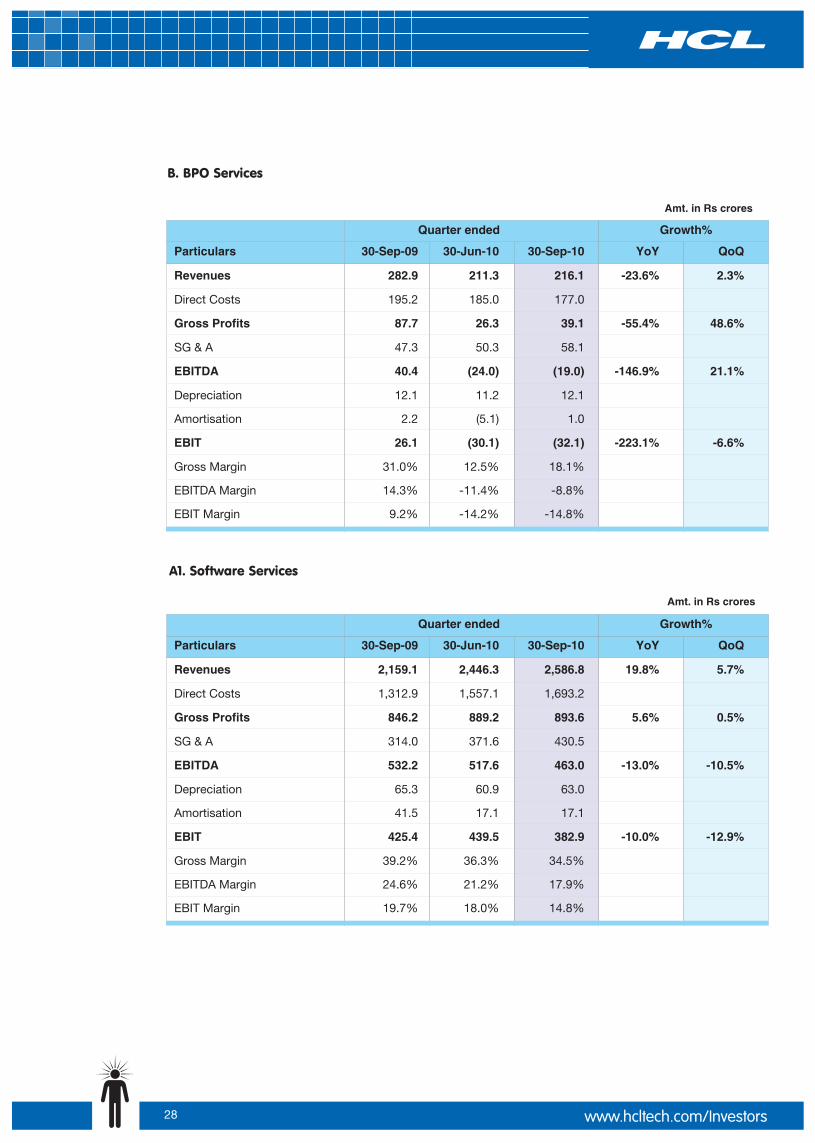
28
Amt. in Rs crores
B. BPO Services
Quarter ended Growth%
Particulars
Revenues 282.9 211.3 216.1 -23.6% 2.3%
Direct Costs 195.2 185.0 177.0
Gross Profits 87.7 26.3 39.1 -55.4% 48.6%
SG & A 47.3 50.3 58.1
EBITDA 40.4 (24.0) (19.0) -146.9% 21.1%
Depreciation 12.1 11.2 12.1
Amortisation 2.2 (5.1) 1.0
EBIT 26.1 (30.1) (32.1) -223.1% -6.6%
Gross Margin 31.0% 12.5% 18.1%
EBITDA Margin 14.3% -11.4% -8.8%
EBIT Margin 9.2% -14.2% -14.8%
30-Sep-09 30-Jun-10 30-Sep-10 YoY QoQ
A1. Software Services
Amt. in Rs crores
Quarter ended Growth%
Particulars
Revenues 2,159.1 2,446.3 2,586.8 19.8% 5.7%
Direct Costs 1,312.9 1,557.1 1,693.2
Gross Profits 846.2 889.2 893.6 5.6% 0.5%
SG & A 314.0 371.6 430.5
EBITDA 532.2 517.6 463.0 -13.0% -10.5%
Depreciation 65.3 60.9 63.0
Amortisation 41.5 17.1 17.1
EBIT 425.4 439.5 382.9 -10.0% -12.9%
Gross Margin 39.2% 36.3% 34.5%
EBITDA Margin 24.6% 21.2% 17.9%
EBIT Margin 19.7% 18.0% 14.8%
30-Sep-09 30-Jun-10 30-Sep-10 YoY QoQ

Amt. in Rs crores
A2. Infrastructure Services
Quarter ended Growth%
Particulars
Revenues 589.4 767.8 808.7 37.2% 5.3%
Direct Costs 406.6 550.3
Gross Profits 182.8 217.5 210.2 15.0% -3.4%
SG & A 66.5 73.0 66.7
EBITDA 116.3 144.5 143.6 23.5% -0.7%
Depreciation 20.7 29.0 28.5
EBIT 95.6 115.5 115.1 20.4% -0.4%
Gross Margin 31.0% 28.3% 26.0%
EBITDA Margin 19.7% 18.8% 17.8%
EBIT Margin 16.2% 15.0% 14.2%
30-Sep-09 30-Jun-10 30-Sep-10 YoY QoQ
598.4
29
Certain statements in this release are forward-looking statements, which involve a number of risks, uncertainties, assumptions and other factors that could cause actual results to differ materially from those in such forward-looking statements. All statements, other than statements of historical fact are statements that could be deemed forward looking statements, including but not limited to the statements containing the words 'planned', 'expects', 'believes', 'strategy', 'opportunity', 'anticipates', 'hopes' or other similar words. The risks and uncertainties relating to these statements include, but are not limited to, risks and uncertainties regarding impact of pending regulatory proceedings, fluctuations in earnings, our ability to manage growth, intense competition in IT services, Business Process Outsourcing and consulting services including those factors which may affect our cost advantage, wage increases in India, customer acceptances of our services, products and fee structures, our ability to attract and retain highly skilled professionals, our ability to integrate acquired assets in a cost effective and timely manner, time and cost overruns on fixed-price, fixed-time frame contracts, client concentration, restrictions on immigration, our ability to manage our international operations, reduced demand for technology in our key focus areas, disruptions in telecommunication networks, our ability to successfully complete and integrate potential acquisitions, the success of our brand development efforts, liability for damages on our service contracts, the success of the companies / entities in which we have made strategic investments, withdrawal of governmental fiscal incentives, political instability, legal restrictions on raising capital or acquiring companies outside India, and unauthorized use of our intellectual property, other risks, uncertainties and general economic conditions affecting our industry. There can be no assurance that the forward looking statements made herein will prove to be accurate, and issuance of such forward looking statements should not be regarded as a representation by the Company, or any other person, that the objective and plans of the Company will be achieved. All forward looking statements made herein are based on information presently available to the management of the Company and the Company does not undertake to update any forward-looking statement that may be made from time to time by or on behalf of the Company.
Forward-looking Statements
About HCL Technologies
HCL Technologies is a leading global IT services company, working with clients in the areas that impact and redefine the core of their businesses. Since its inception into the global landscape after its IPO in 1999, HCL focuses on ‘transformational outsourcing’, underlined by innovation and value creation, and offers integrated portfolio of services including software-led IT solutions, remote infrastructure management, engineering and R&D services and BPO. HCL leverages its extensive global offshore infrastructure and network of offices in 26 countries to provide holistic, multi-service delivery in key industry verticals including Financial Services, Manufacturing, Consumer Services, Public Services and Healthcare. HCL takes pride in its philosophy of ‘Employee First’ which empowers our 70,218 in the 8th row transformers to create a real value for the customers. HCL Technologies, along with its subsidiaries, had consolidated revenues of US$ 2.9 billion (Rs. 13,145 crores), as on 30th September 2010 (on LTM basis). For more information, please visit www.hcltech.com
About HCL Enterprise
HCL is a $5 billion leading global Technology and IT Enterprise that comprises two companies listed in India - HCL Technologies & HCL Infosystems. Founded in 1976, HCL is one of India's original IT garage start-ups, a pioneer of modern computing, and a global transformational enterprise today. Its range of offerings spans Product Engineering, Custom & Package Applications, BPO, IT Infrastructure Services, IT Hardware, Systems Integration, and distribution of ICT products across a wide range of focused industry verticals. The HCL team comprises over 72,000 professionals of diverse nationalities, who operate from 26 countries including over 500 points of presence in India. HCL has global partnerships with several leading Fortune 1000 firms, including leading IT and Technology firms. For more information, please visit www.hcl.in
30

Hello there. I'm from HCL. We work behind the scenes, helping our customers to shift paradigms & start revolutions. We use digital engineering to build superhuman capabilities. We make sure that the rate of progress far exceeds the price. And right now, over of us bright sparks are busy developing solutions for over 500 customers in 26 countries across the world. How can I help you?
72,000
Talk to me
INVESTOR RELATIONS
Sanjay Mendiratta
+91- 9312065108
Ronit Dutta
+91- 9711002816
MEDIA RELATIONS
Ajay Davessar
+91 - 9650122336
Deepika
+91-9811292247
For details, contact:
HCL Technologies Ltd.,A 10-11, Sector-III, Noida - 201301
www.hcltech.com
Cash & Cash Equivalent, Investments and Borrowing
Amt. in US$ million
Amt. in US$ million A. Details of Cash & Cash Equivalent
Bank Name Country 30-Sep-10
- ANZ Bank Australia 8.8
Bank of Tokyo Mitsibushi Japan 5.6
Standard Chartered Bank South Africa 2.6
Silicon Valley Bank USA 2.5
Canadian Imperial Bank of Commerce USA 2.4
Indian Overseas Bank Singapore 2.3
- SEB Sweden 2.2
- Citibank, N.A. Finland 1.9
- Public Bank Malaysia 1.8
- The Royal Bank of Scotland UK 1.7
- Deutsche Bank USA 1.6
- Bank of Ireland Northern Ireland 1.6
- Deutsche Bank UK 1.5
- HSBC Bank Hong Kong 1.3
- Citibank, N.A. Dubai 1.3
- Barclays Bank UK 1.2
- HSBC Bank Malaysia 1.2
- United Overseas Bank Singapore 1.1
- Lloyds Bank Belgium 1.0
- ABN Amro Netherlands 1.0
- Others including funds in transit 50.0
Total 94.6
-
-
-
-
-
30-Sep-10
A. Cash and Cash Equivalent 94.6
B. Fixed Deposit with Banks 316.1
C. Deposits with Corporates 33.4
D. Investment Securities, available for sale 60.8
E. Investment Securities, held to maturity 31.9
Grand Total (A+B+C+D+E) 536.8
1
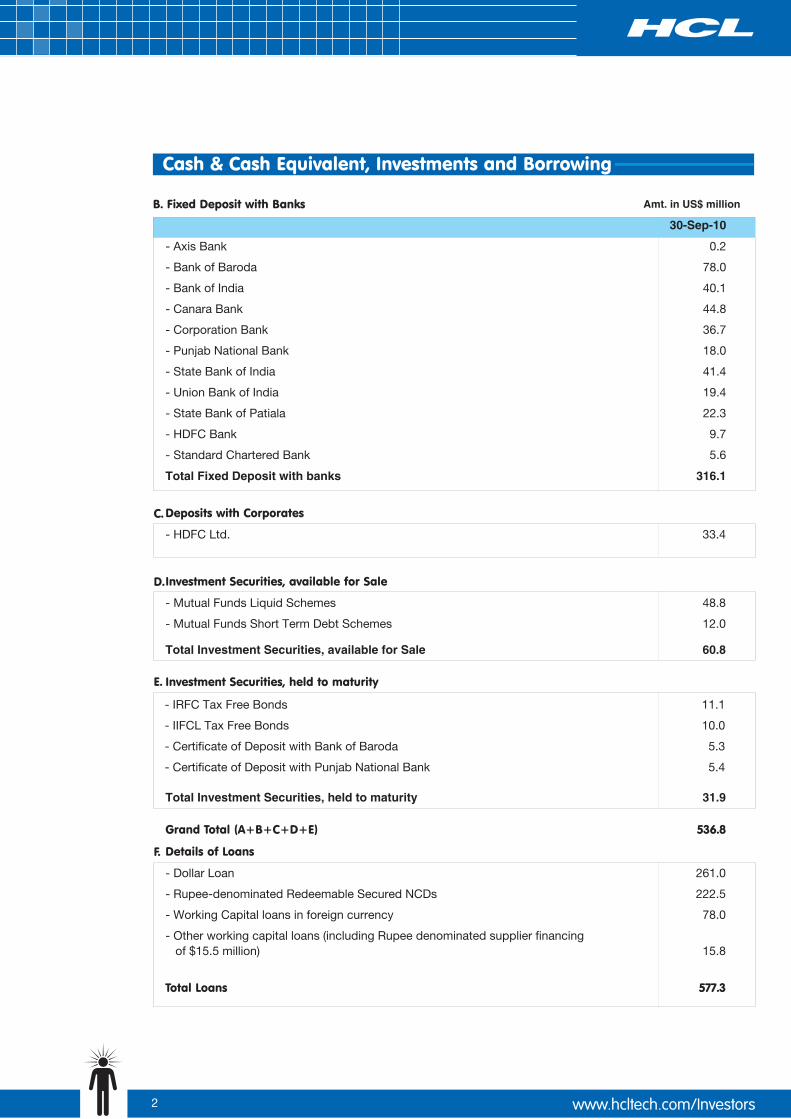
Amt. in US$ million B. Fixed Deposit with Banks
C.
D.
30-Sep-10
- Axis Bank 0.2
- Bank of Baroda 78.0
- Bank of India 40.1
- Canara Bank 44.8
- Corporation Bank 36.7
- Punjab National Bank 18.0
- State Bank of India 41.4
- Union Bank of India 19.4
- State Bank of Patiala 22.3
- HDFC Bank 9.7
- Standard Chartered Bank 5.6
Total Fixed Deposit with banks 316.1
Deposits with Corporates
- HDFC Ltd. 33.4
Investment Securities, available for Sale
- Mutual Funds Liquid Schemes 48.8
- Mutual Funds Short Term Debt Schemes 12.0
Total Investment Securities, available for Sale 60.8
Investment Securities, held to maturity
- IIFCL Tax Free Bonds 10.0
- Certificate of Deposit with Bank of Baroda 5.3
- Certificate of Deposit with Punjab National Bank 5.4
Grand Total (A+B+C+D+E) 536.8
Details of Loans
- Dollar Loan 261.0
- Rupee-denominated Redeemable Secured NCDs 222.5
- Working Capital loans in foreign currency 78.0
- Other working capital loans (including Rupee denominated supplier financing of $15.5 million) 15.8
Total Loans 577.3
- IRFC Tax Free Bonds 11.1
Total Investment Securities, held to maturity 31.9
Cash & Cash Equivalent, Investments and Borrowing
E.
F.
2