HARLEY-DAVIDSON, INC. - 2020 THIRD QUARTER BUSINESS UPDATE
21
October 27, 2020 Conference Call Slide Presentation HARLEY-DAVIDSON, INC. - 2020 THIRD QUARTER BUSINESS UPDATE October 27, 2020
Transcript of HARLEY-DAVIDSON, INC. - 2020 THIRD QUARTER BUSINESS UPDATE
October 27, 2020 Conference Call Slide Presentation
HARLEY-DAVIDSON, INC. - 2020 THIRD QUARTER BUSINESS UPDATEOctober 27, 2020
October 27, 2020 Conference Call Slide Presentation
2020 THIRD QUARTER BUSINESS UPDATE
Jochen Zeitz, Chairman, President and CEO Gina Goetter, Vice President, Chief Financial Officer Larry Hund, Chief Commercial Officer Shannon Burns, Director, Investor Relations
CALL PARTICIPANTS
2
This presentation includes forward-looking statements that are subject to risks that could cause actual results to be materially different. Those risks include, among others, matters we have noted in our latest earnings presentation and filings with the SEC. Harley-Davidson disclaims any obligation to update information in this presentation. Additional information and risk factors are included at the end of this presentation.
2
This presentation supports the audio call. The audio playback for today’s call will be available atHarley-Davidson.com, or call (855) 859-2056 or (404) 537-3406 until November 10th. ID 4341979.
October 27, 2020 Conference Call Slide Presentation3
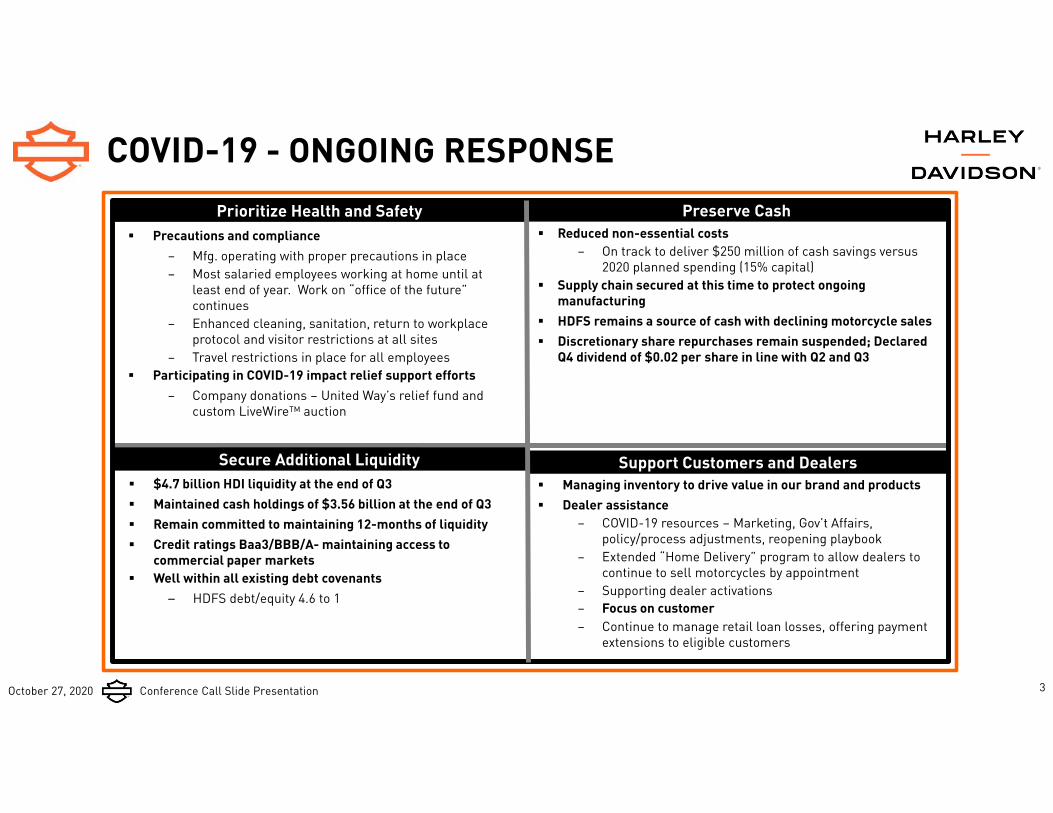
COVID-19 - ONGOING RESPONSE
Reduced non-essential costs– On track to deliver $250 million of cash savings versus
2020 planned spending (15% capital) Supply chain secured at this time to protect ongoing
manufacturing HDFS remains a source of cash with declining motorcycle sales Discretionary share repurchases remain suspended; Declared
Q4 dividend of $0.02 per share in line with Q2 and Q3
Precautions and compliance– Mfg. operating with proper precautions in place– Most salaried employees working at home until at
least end of year. Work on “office of the future” continues
– Enhanced cleaning, sanitation, return to workplace protocol and visitor restrictions at all sites
– Travel restrictions in place for all employees Participating in COVID-19 impact relief support efforts
– Company donations – United Way’s relief fund and custom LiveWire™ auction
Managing inventory to drive value in our brand and products Dealer assistance
– COVID-19 resources – Marketing, Gov’t Affairs, policy/process adjustments, reopening playbook
– Extended “Home Delivery” program to allow dealers to continue to sell motorcycles by appointment
– Supporting dealer activations– Focus on customer– Continue to manage retail loan losses, offering payment
extensions to eligible customers
$4.7 billion HDI liquidity at the end of Q3 Maintained cash holdings of $3.56 billion at the end of Q3 Remain committed to maintaining 12-months of liquidity Credit ratings Baa3/BBB/A- maintaining access to
commercial paper markets Well within all existing debt covenants
– HDFS debt/equity 4.6 to 1
Prioritize Health and Safety
Secure Additional Liquidity Support Customers and Dealers
Preserve Cash
3
October 27, 2020 Conference Call Slide Presentation
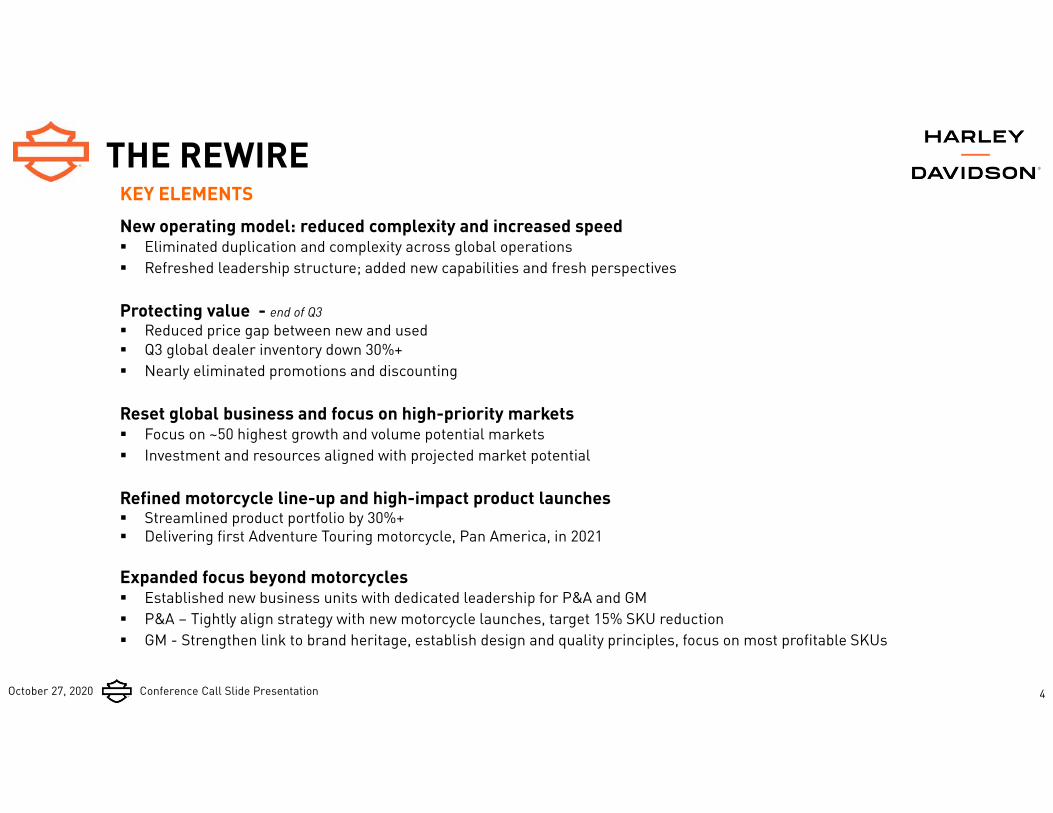
THE REWIREKEY ELEMENTSNew operating model: reduced complexity and increased speed Eliminated duplication and complexity across global operations Refreshed leadership structure; added new capabilities and fresh perspectives
Protecting value - end of Q3 Reduced price gap between new and used Q3 global dealer inventory down 30%+ Nearly eliminated promotions and discounting
Reset global business and focus on high-priority markets Focus on ~50 highest growth and volume potential markets Investment and resources aligned with projected market potential
Refined motorcycle line-up and high-impact product launches Streamlined product portfolio by 30%+ Delivering first Adventure Touring motorcycle, Pan America, in 2021
Expanded focus beyond motorcycles Established new business units with dedicated leadership for P&A and GM P&A – Tightly align strategy with new motorcycle launches, target 15% SKU reduction GM - Strengthen link to brand heritage, establish design and quality principles, focus on most profitable SKUs
4
October 27, 2020 Conference Call Slide Presentation
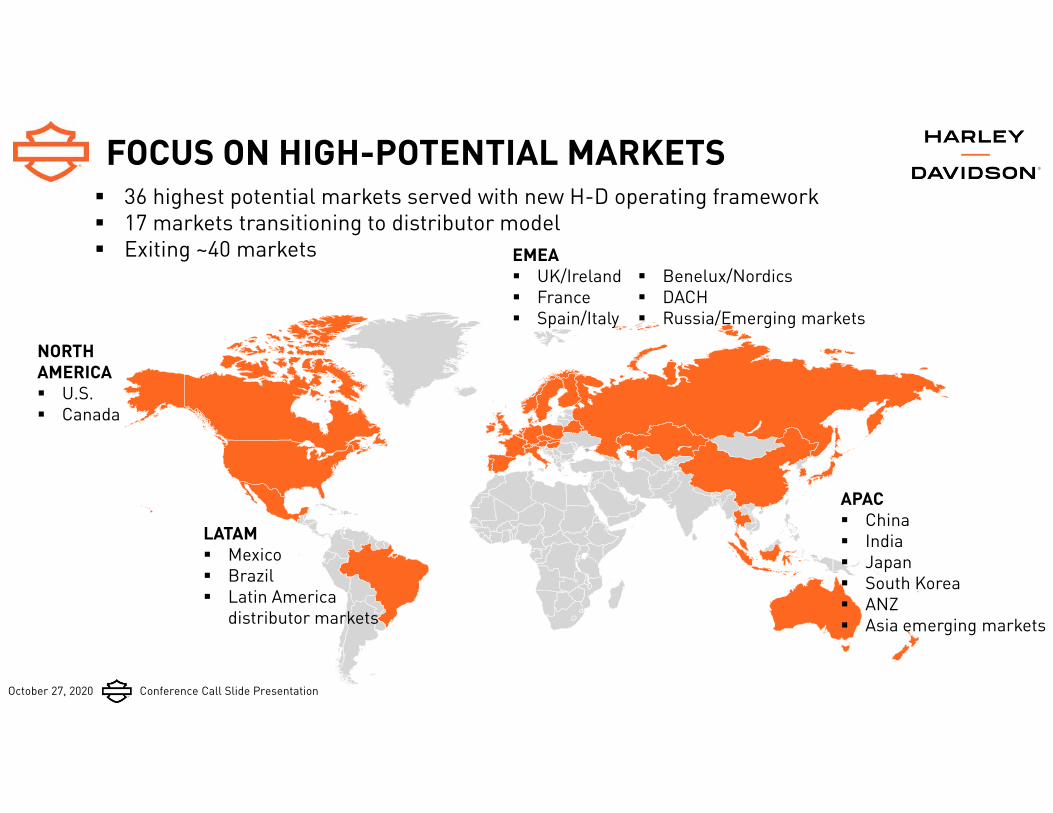
FOCUS ON HIGH-POTENTIAL MARKETS
5
36 highest potential markets served with new H-D operating framework 17 markets transitioning to distributor model Exiting ~40 markets
NORTH AMERICA U.S. Canada
APAC China India Japan South Korea ANZ Asia emerging markets
LATAM Mexico Brazil Latin America
distributor markets
EMEA UK/Ireland France Spain/Italy
Benelux/Nordics DACH Russia/Emerging markets

October 27, 2020 Conference Call Slide Presentation
- L O N G W A Y U P -
MARKETING
1 0 0 M I L L I O NOVER
POSITIVE MEDIAIMPRESSIONS
OVER5 O O M I L L I O N
VIDEO VIEWS
October 27, 2020 Conference Call Slide Presentation
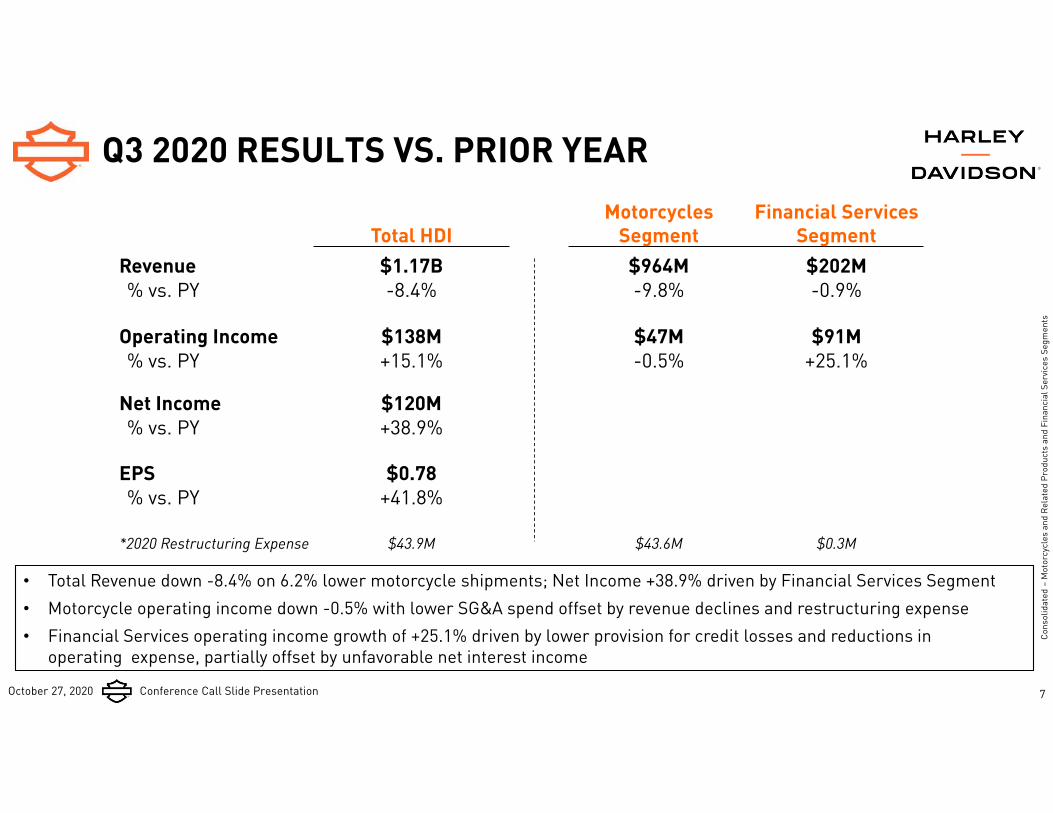
Q3 2020 RESULTS VS. PRIOR YEAR
7
Cons
olid
ated
–M
otor
cycl
es a
nd R
elat
ed P
rodu
cts
and
Fina
ncia
l Ser
vices
Seg
men
ts
Total HDIMotorcycles
SegmentFinancial Services
SegmentRevenue $1.17B $964M $202M% vs. PY -8.4% -9.8% -0.9%
Operating Income $138M $47M $91M% vs. PY +15.1% -0.5% +25.1%
Net Income $120M% vs. PY +38.9%
EPS $0.78 % vs. PY +41.8%
*2020 Restructuring Expense $43.9M $43.6M $0.3M
• Total Revenue down -8.4% on 6.2% lower motorcycle shipments; Net Income +38.9% driven by Financial Services Segment• Motorcycle operating income down -0.5% with lower SG&A spend offset by revenue declines and restructuring expense• Financial Services operating income growth of +25.1% driven by lower provision for credit losses and reductions in
operating expense, partially offset by unfavorable net interest income
October 27, 2020 Conference Call Slide Presentation
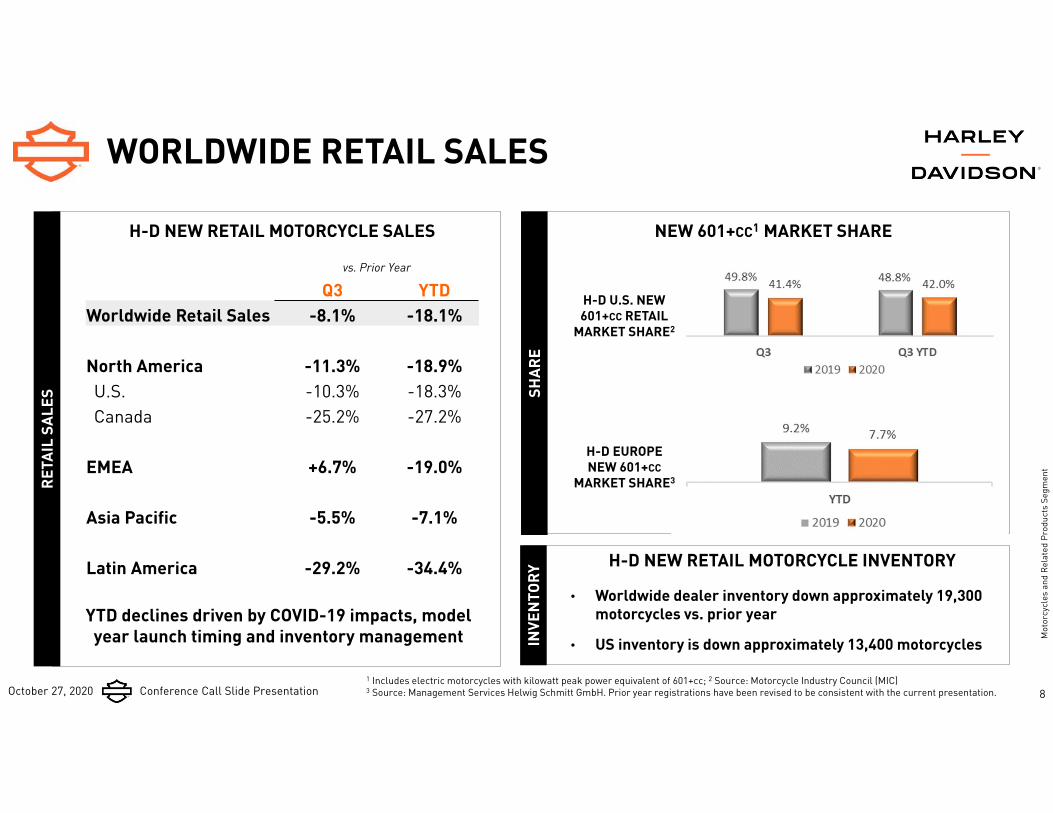
WORLDWIDE RETAIL SALES
8
NEW 601+CC1 MARKET SHARE
RETA
IL S
ALES
INVE
NTOR
YSH
ARE
Mot
orcy
cles
and
Rel
ated
Pro
duct
s Se
gmen
t
H-D NEW RETAIL MOTORCYCLE SALES
1 Includes electric motorcycles with kilowatt peak power equivalent of 601+cc; 2 Source: Motorcycle Industry Council (MIC)3 Source: Management Services Helwig Schmitt GmbH. Prior year registrations have been revised to be consistent with the current presentation.
• Worldwide dealer inventory down approximately 19,300 motorcycles vs. prior year
• US inventory is down approximately 13,400 motorcycles
H-D NEW RETAIL MOTORCYCLE INVENTORY
H-D U.S. NEW 601+CC RETAIL
MARKET SHARE2
H-D EUROPE NEW 601+CC
MARKET SHARE3
(1.1) pts. (0.9) pts.(6.8) pts.(8.5) pts.
vs. Prior Year
Q3 YTDWorldwide Retail Sales -8.1% -18.1%
North America -11.3% -18.9%U.S. -10.3% -18.3%Canada -25.2% -27.2%
EMEA +6.7% -19.0%
Asia Pacific -5.5% -7.1%
Latin America -29.2% -34.4%
YTD declines driven by COVID-19 impacts, model year launch timing and inventory management
October 27, 2020 Conference Call Slide Presentation
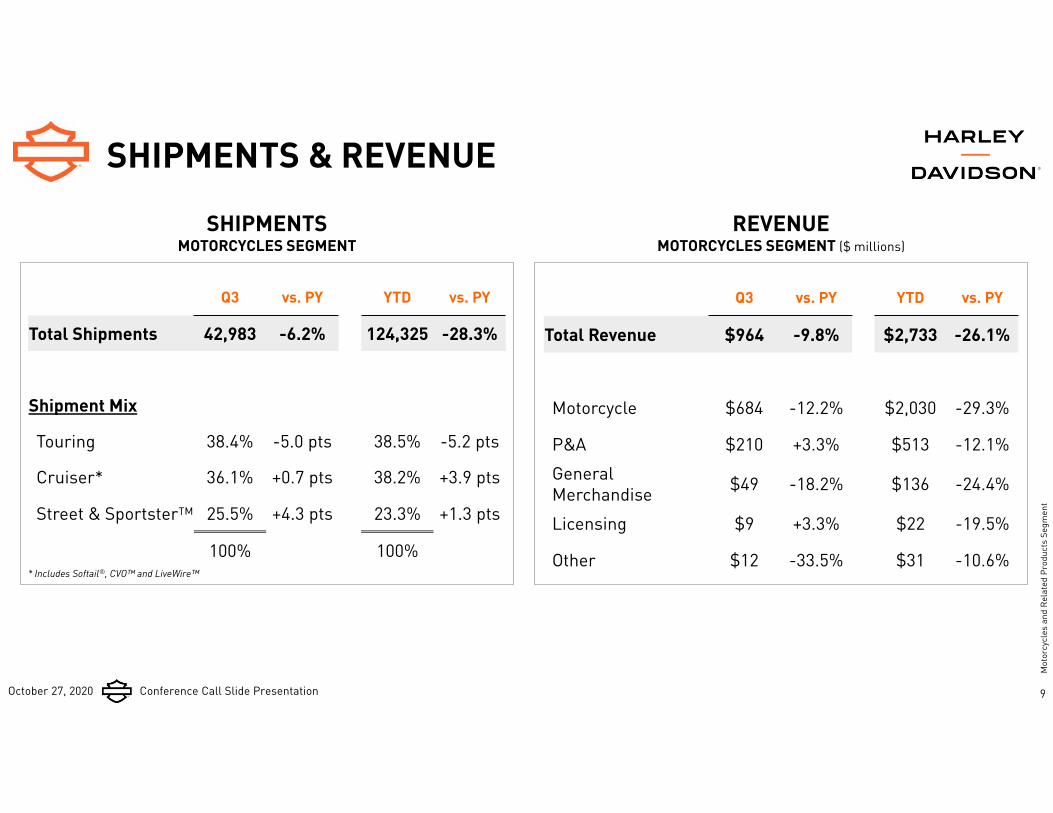
SHIPMENTS & REVENUE
SHIPMENTS MOTORCYCLES SEGMENT
9
Mot
orcy
cles
and
Rel
ated
Pro
duct
s Se
gmen
t
* Includes Softail®, CVO™ and LiveWire™
REVENUEMOTORCYCLES SEGMENT ($ millions)
Q3 vs. PY YTD vs. PY
Total Shipments 42,983 -6.2% 124,325 -28.3%
Shipment Mix
Touring 38.4% -5.0 pts 38.5% -5.2 pts
Cruiser* 36.1% +0.7 pts 38.2% +3.9 pts
Street & Sportster™ 25.5% +4.3 pts 23.3% +1.3 pts
100% 100%
Q3 vs. PY YTD vs. PY
Total Revenue $964 -9.8% $2,733 -26.1%
Motorcycle $684 -12.2% $2,030 -29.3%
P&A $210 +3.3% $513 -12.1%General Merchandise $49 -18.2% $136 -24.4%
Licensing $9 +3.3% $22 -19.5%
Other $12 -33.5% $31 -10.6%
October 27, 2020 Conference Call Slide Presentation
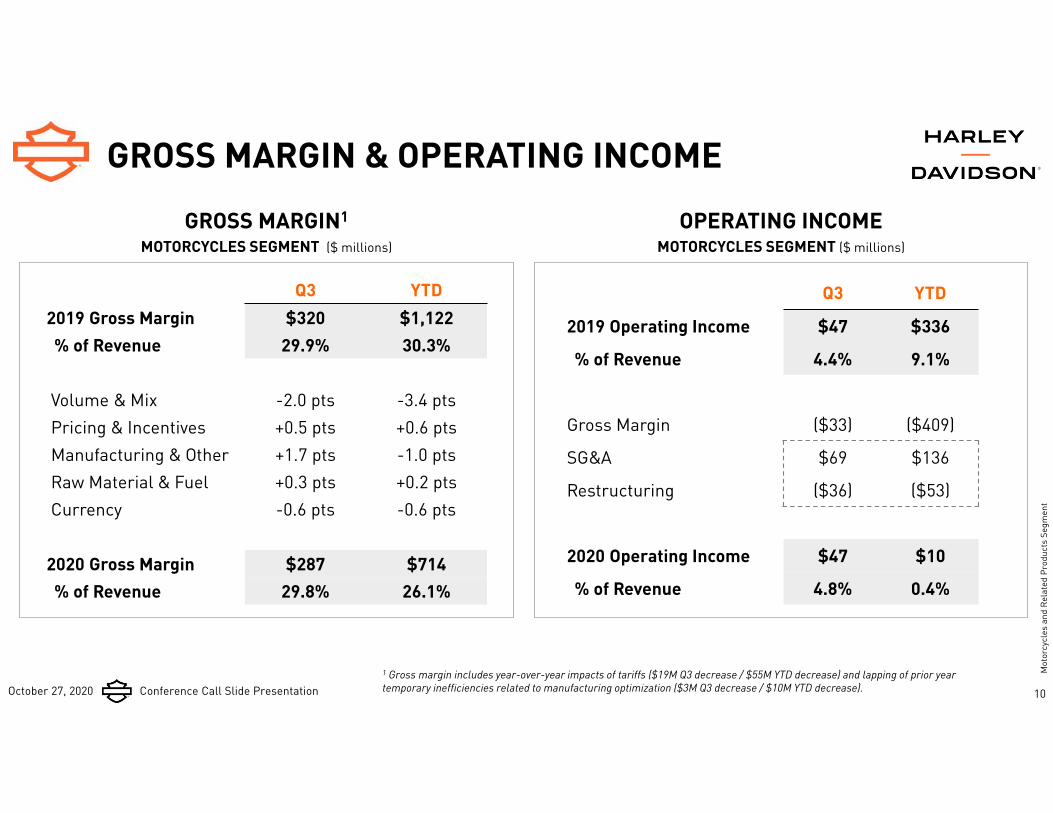
GROSS MARGIN & OPERATING INCOME
10
Mot
orcy
cles
and
Rel
ated
Pro
duct
s Se
gmen
t
GROSS MARGIN1
MOTORCYCLES SEGMENT ($ millions)
OPERATING INCOMEMOTORCYCLES SEGMENT ($ millions)
Q3 YTD2019 Gross Margin $320 $1,122 % of Revenue 29.9% 30.3%
Volume & Mix -2.0 pts -3.4 ptsPricing & Incentives +0.5 pts +0.6 ptsManufacturing & Other +1.7 pts -1.0 ptsRaw Material & Fuel +0.3 pts +0.2 ptsCurrency -0.6 pts -0.6 pts
2020 Gross Margin $287 $714 % of Revenue 29.8% 26.1%
1 Gross margin includes year-over-year impacts of tariffs ($19M Q3 decrease / $55M YTD decrease) and lapping of prior year temporary inefficiencies related to manufacturing optimization ($3M Q3 decrease / $10M YTD decrease).
Q3 YTD
2019 Operating Income $47 $336
% of Revenue 4.4% 9.1%
Gross Margin ($33) ($409)
SG&A $69 $136
Restructuring ($36) ($53)
2020 Operating Income $47 $10
% of Revenue 4.8% 0.4%
October 27, 2020 Conference Call Slide Presentation
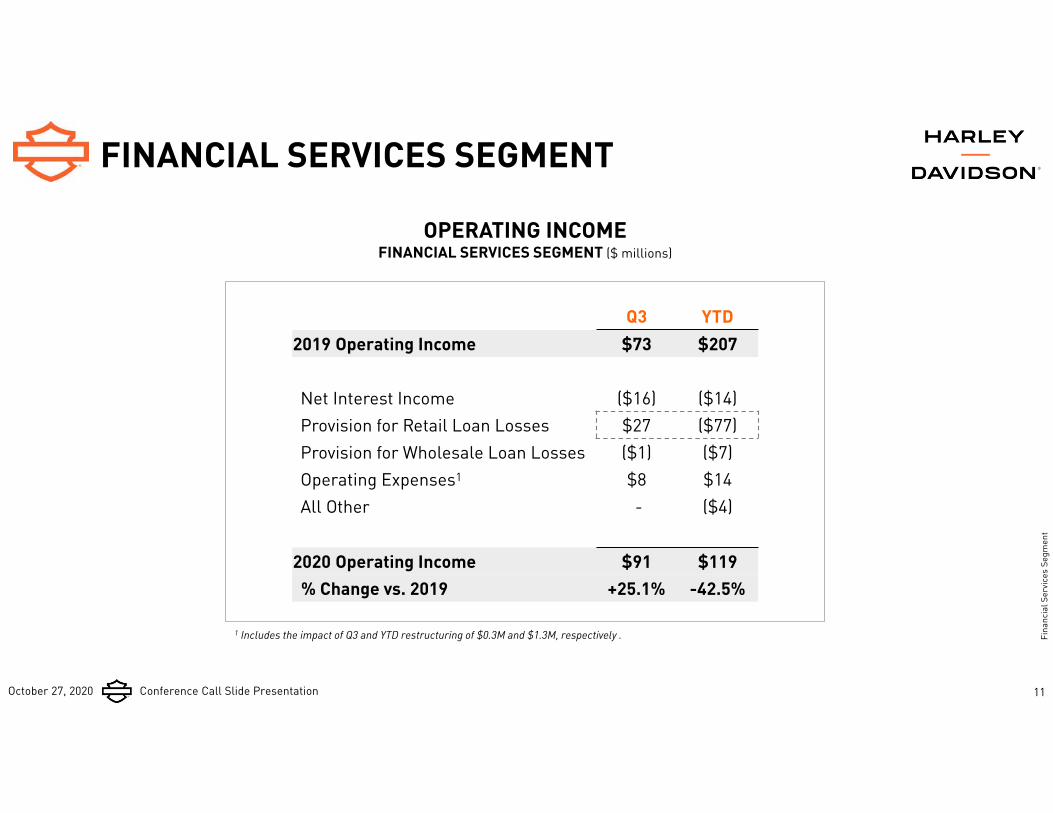
FINANCIAL SERVICES SEGMENT
OPERATING INCOMEFINANCIAL SERVICES SEGMENT ($ millions)
11
Fina
ncia
l Ser
vice
s Se
gmen
t
1 Includes the impact of Q3 and YTD restructuring of $0.3M and $1.3M, respectively .
Q3 YTD2019 Operating Income $73 $207
Net Interest Income ($16) ($14)Provision for Retail Loan Losses $27 ($77)Provision for Wholesale Loan Losses ($1) ($7)Operating Expenses1 $8 $14 All Other - ($4)
2020 Operating Income $91 $119 % Change vs. 2019 +25.1% -42.5%
October 27, 2020 Conference Call Slide Presentation
FINANCIAL SERVICES OPERATIONS
12
Fina
ncia
l Ser
vice
s Se
gmen
t
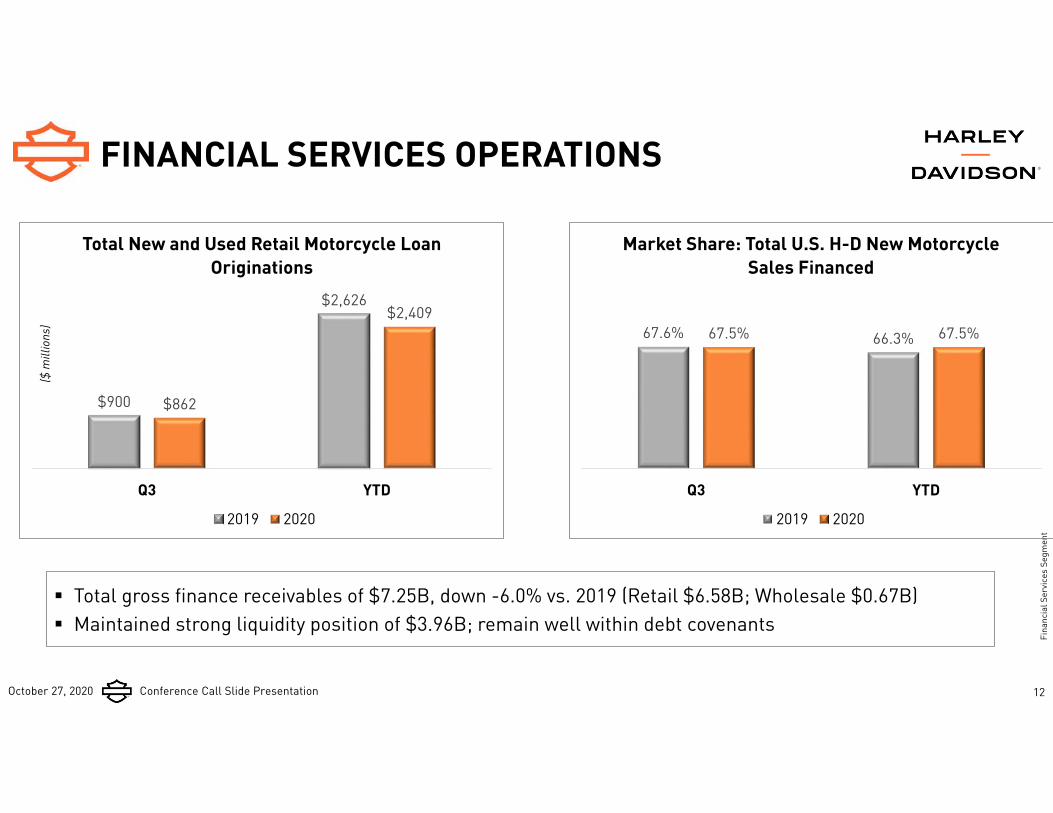
Total gross finance receivables of $7.25B, down -6.0% vs. 2019 (Retail $6.58B; Wholesale $0.67B) Maintained strong liquidity position of $3.96B; remain well within debt covenants
$900
$2,626
$862
$2,409
Q3 YTD
Total New and Used Retail Motorcycle Loan Originations
2019 2020
67.6% 66.3%67.5% 67.5%
Q3 YTD
Market Share: Total U.S. H-D New Motorcycle Sales Financed
2019 2020
($ m
illio
ns)
October 27, 2020 Conference Call Slide Presentation
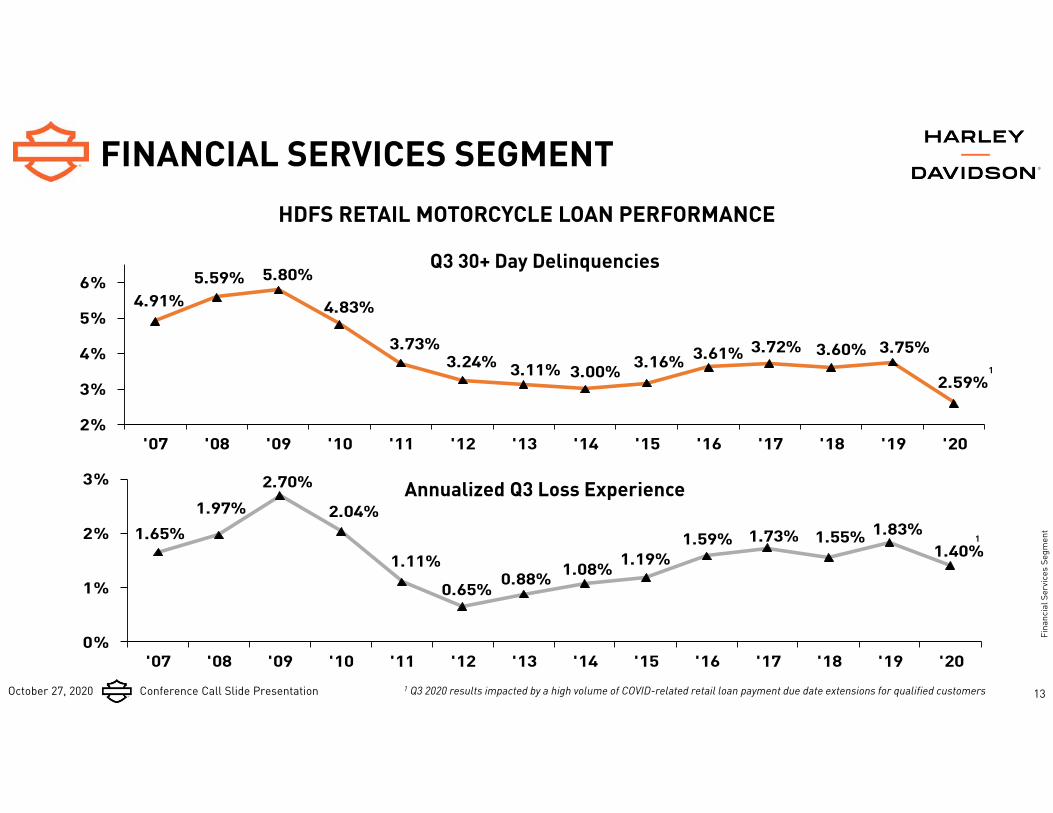
4.91%5.59% 5.80%
4.83%
3.73%3.24% 3.11% 3.00% 3.16% 3.61% 3.72% 3.60% 3.75%
2.59%
2%
3%
4%
5%
6%
'07 '08 '09 '10 '11 '12 '13 '14 '15 '16 '17 '18 '19 '20
1.65%1.97%
2.70%
2.04%
1.11%
0.65% 0.88% 1.08% 1.19%1.59% 1.73% 1.55% 1.83%
1.40%
0%
1%
2%
3%
'07 '08 '09 '10 '11 '12 '13 '14 '15 '16 '17 '18 '19 '20
FINANCIAL SERVICES SEGMENT
13
Q3 30+ Day Delinquencies
Fina
ncia
l Ser
vice
s Se
gmen
t
HDFS RETAIL MOTORCYCLE LOAN PERFORMANCE
Annualized Q3 Loss Experience
FINANCIAL SERVICES SEGMENT
1 Q3 2020 results impacted by a high volume of COVID-related retail loan payment due date extensions for qualified customers
1
1
October 27, 2020 Conference Call Slide Presentation
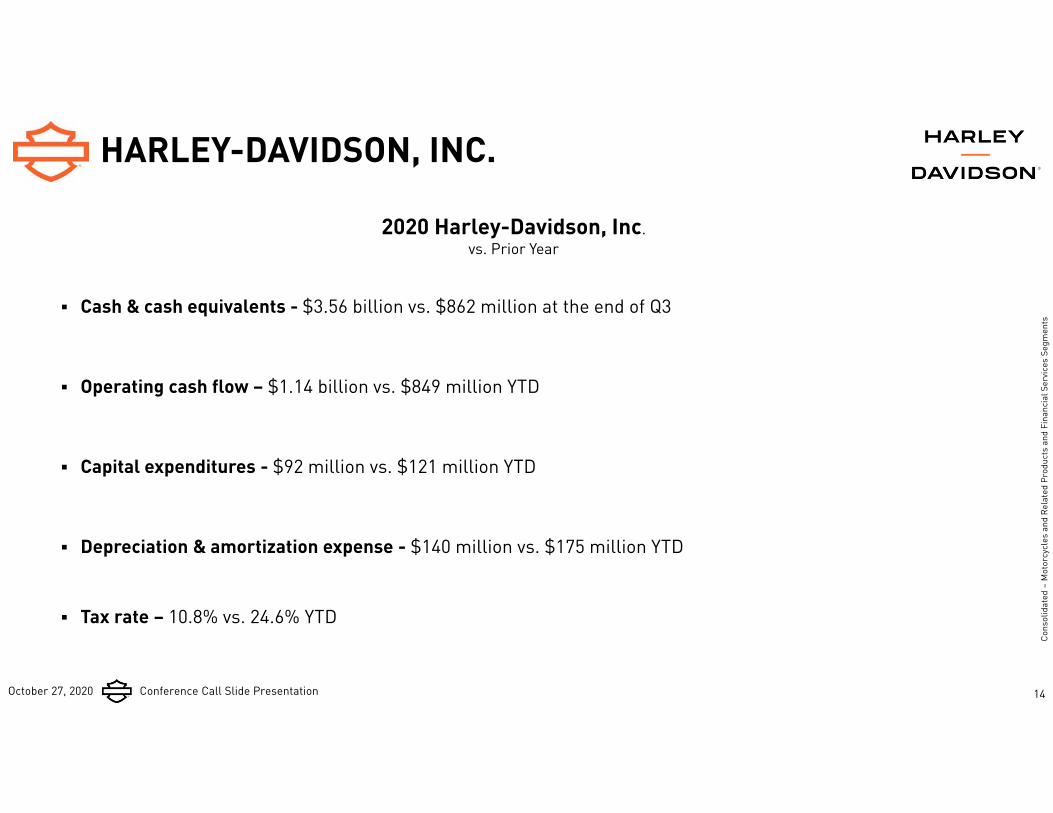
2020 Harley-Davidson, Inc.vs. Prior Year
Cons
olid
ated
–M
otor
cycl
es a
nd R
elat
ed P
rodu
cts
and
Fina
ncia
l Ser
vices
Seg
men
ts
HARLEY-DAVIDSON, INC.
Cash & cash equivalents - $3.56 billion vs. $862 million at the end of Q3
Operating cash flow – $1.14 billion vs. $849 million YTD
Capital expenditures - $92 million vs. $121 million YTD
Depreciation & amortization expense - $140 million vs. $175 million YTD
Tax rate – 10.8% vs. 24.6% YTD
14
October 27, 2020 Conference Call Slide Presentation 15
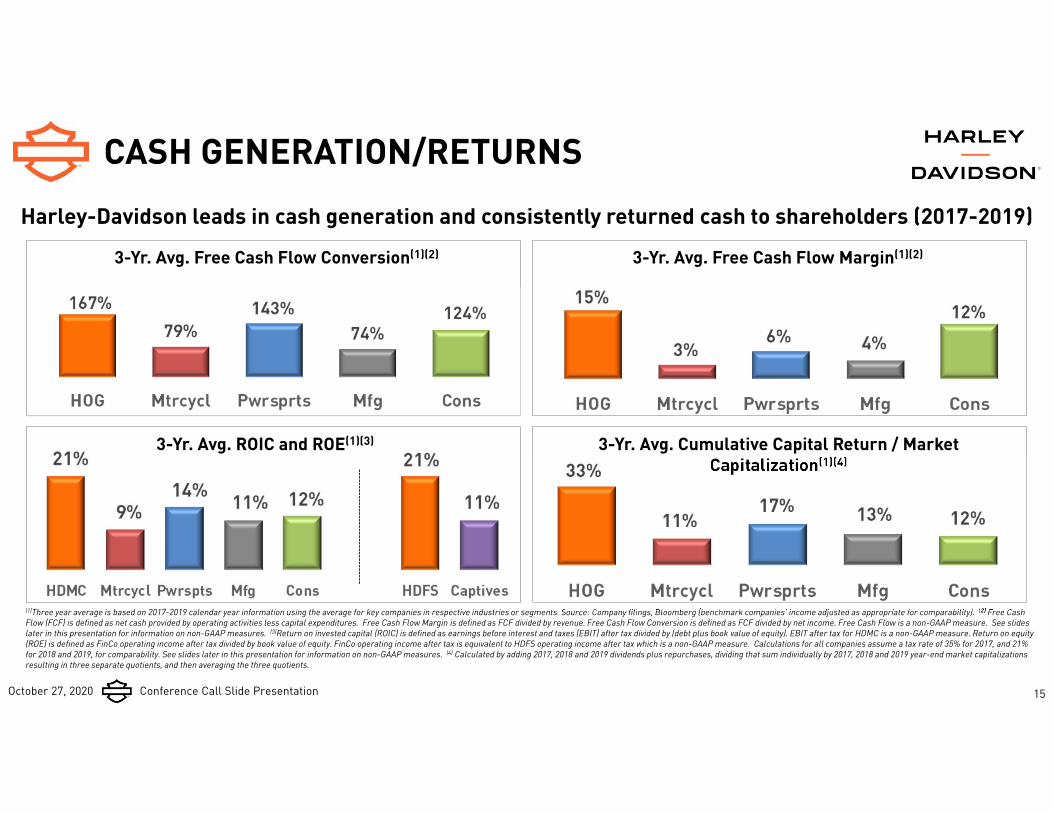
CASH GENERATION/RETURNSHarley-Davidson leads in cash generation and consistently returned cash to shareholders (2017-2019)
3-Yr. Avg. Free Cash Flow Conversion(1)(2) 3-Yr. Avg. Free Cash Flow Margin(1)(2)
3-Yr. Avg. Cumulative Capital Return / Market Capitalization(1)(4)
3-Yr. Avg. ROIC and ROE(1)(3)
(1)Three year average is based on 2017-2019 calendar year information using the average for key companies in respective industries or segments. Source: Company filings, Bloomberg (benchmark companies’ income adjusted as appropriate for comparability). (2) Free Cash Flow (FCF) is defined as net cash provided by operating activities less capital expenditures. Free Cash Flow Margin is defined as FCF divided by revenue. Free Cash Flow Conversion is defined as FCF divided by net income. Free Cash Flow is a non-GAAP measure. See slides later in this presentation for information on non-GAAP measures. (3)Return on invested capital (ROIC) is defined as earnings before interest and taxes (EBIT) after tax divided by (debt plus book value of equity). EBIT after tax for HDMC is a non-GAAP measure. Return on equity (ROE) is defined as FinCo operating income after tax divided by book value of equity. FinCo operating income after tax is equivalent to HDFS operating income after tax which is a non-GAAP measure. Calculations for all companies assume a tax rate of 35% for 2017, and 21% for 2018 and 2019, for comparability. See slides later in this presentation for information on non-GAAP measures. (4) Calculated by adding 2017, 2018 and 2019 dividends plus repurchases, dividing that sum individually by 2017, 2018 and 2019 year-end market capitalizations resulting in three separate quotients, and then averaging the three quotients.
October 27, 2020 Conference Call Slide Presentation
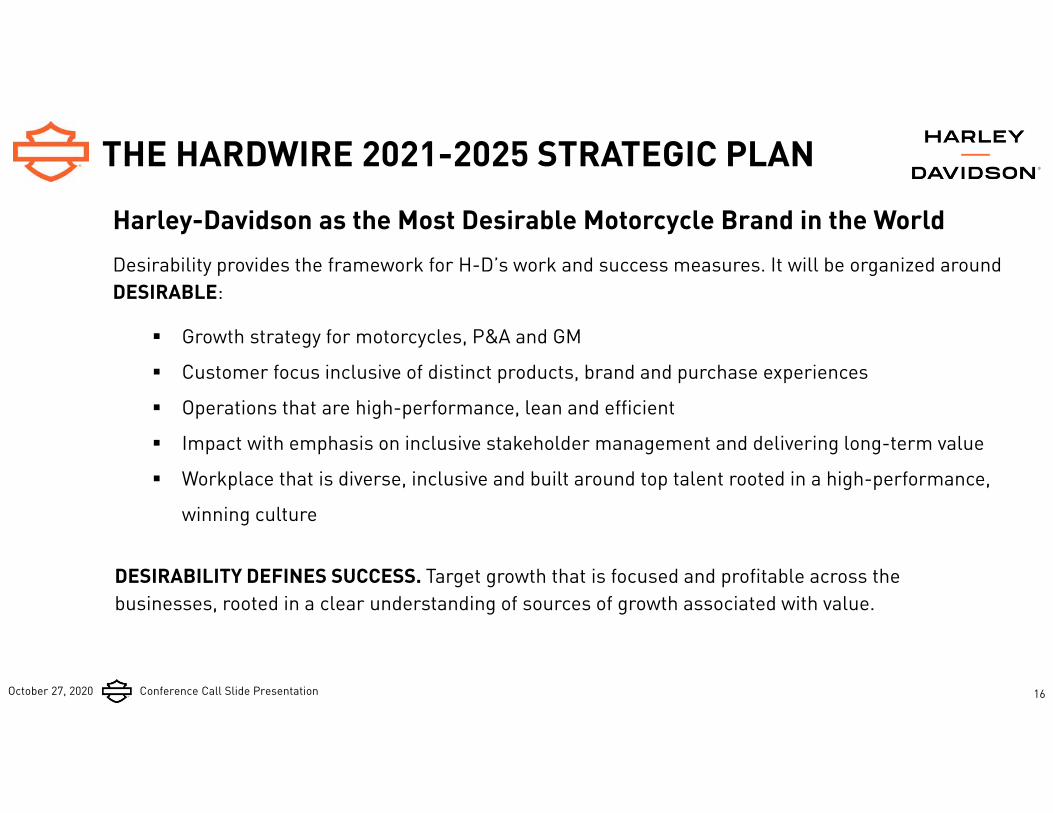
THE HARDWIRE 2021-2025 STRATEGIC PLAN
16
Harley-Davidson as the Most Desirable Motorcycle Brand in the World Desirability provides the framework for H-D’s work and success measures. It will be organized around DESIRABLE:
Growth strategy for motorcycles, P&A and GM
Customer focus inclusive of distinct products, brand and purchase experiences
Operations that are high-performance, lean and efficient
Impact with emphasis on inclusive stakeholder management and delivering long-term value
Workplace that is diverse, inclusive and built around top talent rooted in a high-performance,
winning culture
DESIRABILITY DEFINES SUCCESS. Target growth that is focused and profitable across the businesses, rooted in a clear understanding of sources of growth associated with value.
October 27, 2020 Conference Call Slide Presentation
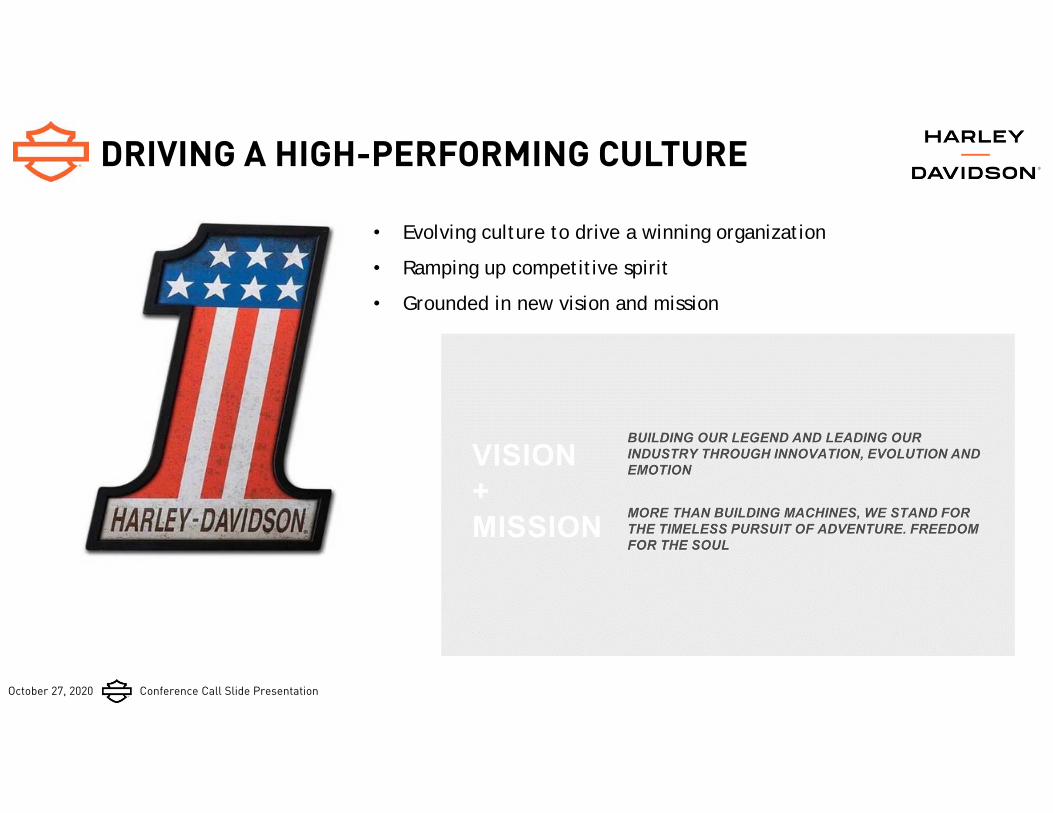
DRIVING A HIGH-PERFORMING CULTURE
17
• Evolving culture to drive a winning organization
• Ramping up competitive spirit
• Grounded in new vision and mission
October 27, 2020 Conference Call Slide Presentation 18
NON-GAAP MEASURES
This presentation includes financial measures that have not been calculated in accordance with U.S. generally accepted accounting principles (GAAP) and are therefore referred to as non-GAAP financial measures. The non-GAAP measures listed below are intended to be considered by users as supplemental information to the equivalent GAAP measures, to aid investors in better understanding the company’s financial results. The company believes that these non-GAAP measures provide useful perspective on underlying business results and trends, and a means to assess period-over-period results. These non-GAAP measures should not be considered as a substitute for, or superior to, measures of financial performance prepared in accordance with GAAP. These non-GAAP measures may not be the same as similarly titled measures used by other companies due to possible differences in method and in items or events being adjusted.
The non-GAAP measures are as follows:• Net income excluding restructuring plan costs and the impact of tariffs• Diluted EPS excluding restructuring plan costs and the impact of tariffs• HDI free cash flow• HDMC EBIT after tax• HDFS operating income after tax
Restructuring plan costs include restructuring expenses as presented in the Consolidated Statements of Operations and costs associated with temporary inefficiencies incurred in connection with the manufacturing optimization initiative included in Motorcycles and Related Products cost of goods sold. The impact of tariffs includes incremental European Union and China tariffs imposed beginning in 2018 on the company's products shipped from the U.S., as well as incremental U.S. tariffs imposed beginning in 2018 on certain items imported from China. The impact of tariffs excludes higher metals cost resulting from the U.S. steel and aluminum tariffs. These adjustments are consistent with the approach used for 2018 to determine performance relative to financial objectives under the company’s incentive compensation plans.
Refer to the reconciliations of GAAP to non-GAAP amounts included in this presentation.
October 27, 2020 Conference Call Slide Presentation 19
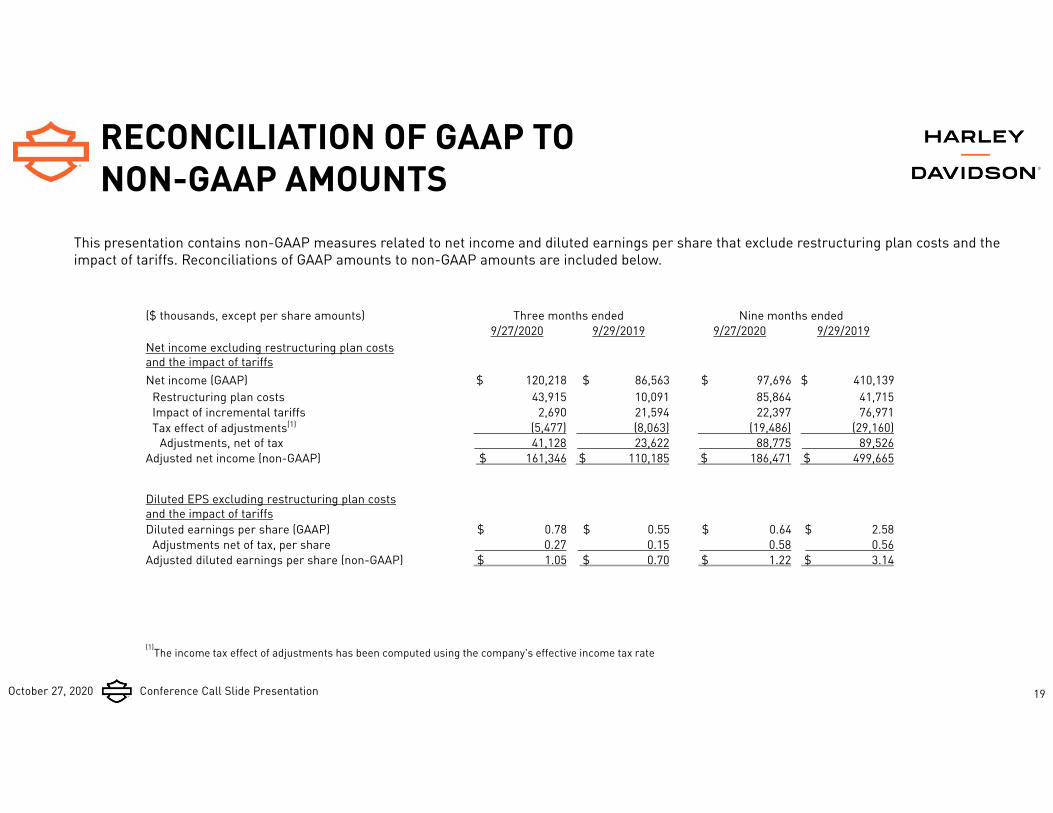
RECONCILIATION OF GAAP TO NON-GAAP AMOUNTS
This presentation contains non-GAAP measures related to net income and diluted earnings per share that exclude restructuring plan costs and the impact of tariffs. Reconciliations of GAAP amounts to non-GAAP amounts are included below.
($ thousands, except per share amounts) Three months ended Nine months ended9/27/2020 9/29/2019 9/27/2020 9/29/2019
Net income excluding restructuring plan costs and the impact of tariffsNet income (GAAP) $ 120,218 $ 86,563 $ 97,696 $ 410,139
Restructuring plan costs 43,915 10,091 85,864 41,715 Impact of incremental tariffs 2,690 21,594 22,397 76,971Tax effect of adjustments(1) (5,477) (8,063) (19,486) (29,160)
Adjustments, net of tax 41,128 23,622 88,775 89,526Adjusted net income (non-GAAP) $ 161,346 $ 110,185 $ 186,471 $ 499,665
Diluted EPS excluding restructuring plan costs and the impact of tariffsDiluted earnings per share (GAAP) $ 0.78 $ 0.55 $ 0.64 $ 2.58
Adjustments net of tax, per share 0.27 0.15 0.58 0.56 Adjusted diluted earnings per share (non-GAAP) $ 1.05 $ 0.70 $ 1.22 $ 3.14
(1)The income tax effect of adjustments has been computed using the company's effective income tax rate
October 27, 2020 Conference Call Slide Presentation 20
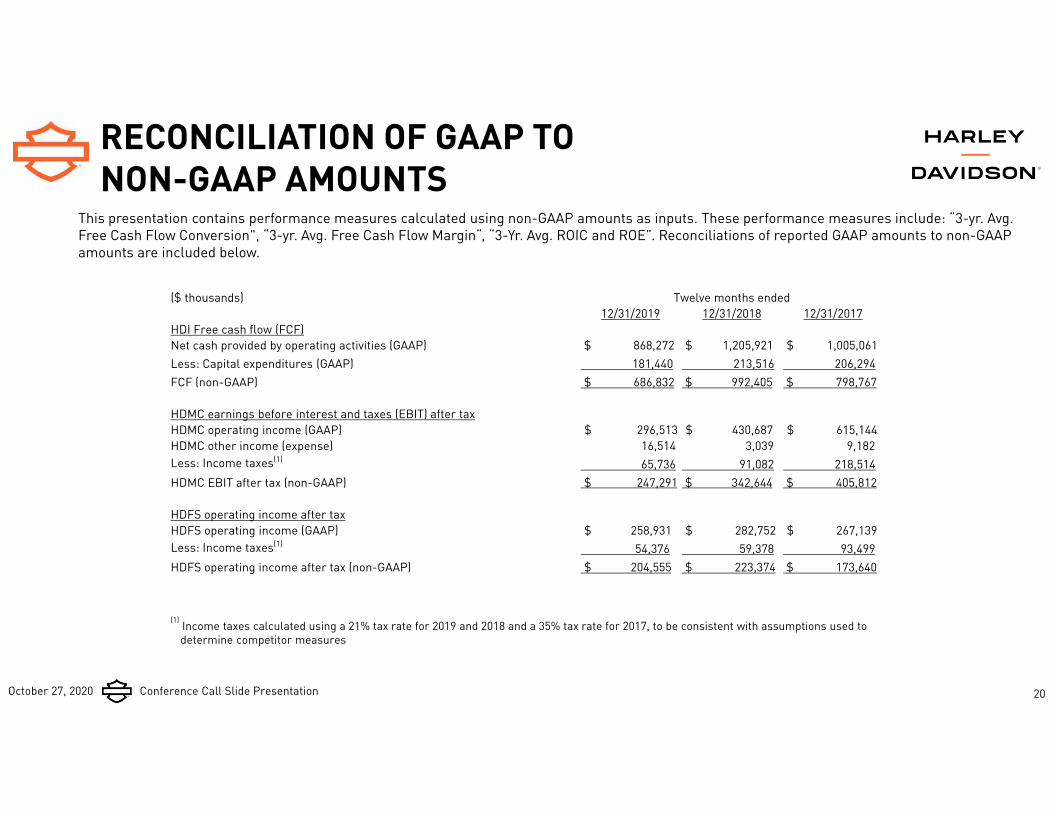
This presentation contains performance measures calculated using non-GAAP amounts as inputs. These performance measures include: “3-yr. Avg. Free Cash Flow Conversion", “3-yr. Avg. Free Cash Flow Margin“, “3-Yr. Avg. ROIC and ROE”. Reconciliations of reported GAAP amounts to non-GAAP amounts are included below.
($ thousands) Twelve months ended12/31/2019 12/31/2018 12/31/2017
HDI Free cash flow (FCF) Net cash provided by operating activities (GAAP) $ 868,272 $ 1,205,921 $ 1,005,061Less: Capital expenditures (GAAP) 181,440 213,516 206,294 FCF (non-GAAP) $ 686,832 $ 992,405 $ 798,767
HDMC earnings before interest and taxes (EBIT) after taxHDMC operating income (GAAP) $ 296,513 $ 430,687 $ 615,144HDMC other income (expense) 16,514 3,039 9,182 Less: Income taxes(1) 65,736 91,082 218,514 HDMC EBIT after tax (non-GAAP) $ 247,291 $ 342,644 $ 405,812
HDFS operating income after taxHDFS operating income (GAAP) $ 258,931 $ 282,752 $ 267,139Less: Income taxes(1) 54,376 59,378 93,499 HDFS operating income after tax (non-GAAP) $ 204,555 $ 223,374 $ 173,640
(1) Income taxes calculated using a 21% tax rate for 2019 and 2018 and a 35% tax rate for 2017, to be consistent with assumptions used to determine competitor measures
RECONCILIATION OF GAAP TO NON-GAAP AMOUNTS
October 27, 2020 Conference Call Slide Presentation
Cautionary Note Regarding Forward-Looking StatementsThe company intends that certain matters discussed in this press release are "forward-looking statements" intended to qualify for the safe harbor from liability established by the Private Securities Litigation Reform Act of 1995. These forward-looking statements can generally be identified as such because the context of the statement will include words such as the company "believes," "anticipates," "expects," "plans," "may," "will," "estimates," "is on-track" or words of similar meaning. Similarly, statements that describe or refer to future expectations, future plans, strategies, objectives, outlooks, targets, guidance, commitments, or goals are also forward-looking statements. Such forward-looking statements are subject to certain risks and uncertainties that could cause actual results to differ materially, unfavorably or favorably, from those anticipated as of the date of this press release. Certain of such risks and uncertainties are described below. Shareholders, potential investors, and other readers are urged to consider these factors in evaluating the forward-looking statements and are cautioned not to place undue reliance on such forward-looking statements. The forward-looking statements included in this press release are only made as of the date of this press release, and the company disclaims anyobligation to publicly update such forward-looking statements to reflect subsequent events or circumstances.
Important factors that could affect future results and cause those results to differ materially from those expressed in the forward-looking statements include, among others, the following: (i) the COVID-19 pandemic, including the length and severity of the pandemic across the globe and the pace of recovery following the pandemic and (ii) the company’s ability to: (A) create and execute its business plans and strategies, including developing The Hardwire, successfully executing its remodeled approach to supply and inventory management, and strengthening its existing business while allowing for desirable growth; (B) accurately analyze, predict and react to changing market conditions and successfully adjust to shifting global consumer needs and interests, including successfully implementing and executing plans to exit international markets where volumes and profitability do not support continued investment, in line with The Rewire actions, and successfully transitioning to a distributor model in seventeen markets; (C) successfully access the capital and/or credit markets on terms that are acceptable to the company and within its expectations; (D) successfully carry out its global manufacturing and assembly operations; (E) develop and introduce products, services and experiences on a timely basis that the market accepts, that enable the company to generate desired sales levels and that provide the desired financial returns; (F) perform in a manner that enables the company to benefit from market opportunities while competing against existing and newcompetitors; (G) prevent, detect, and remediate any issues with its motorcycles or any issues associated with the manufacturing processes to avoid delays in new model launches, recall campaigns, regulatory agency investigations, increased warranty costs orlitigation and adverse effects on its reputation and brand strength, and carry out any product programs or recalls within expected costs and timing; (H) manage supply chain issues, including quality issues and any unexpected interruptions or price increases caused by raw material shortages or natural disasters; (I) manage the impact that prices for and supply of used motorcycles may have on its business, including on retail sales of new motorcycles; (J) realize expectations concerning market demand for electric models, which will depend in part on the building of necessary infrastructure; (K) successfully manage and reduce costs throughout the business; (L) balance production volumes for its new motorcycles with consumer demand; (M) manage through changes in general economic and business conditions, including changing capital, credit and retail markets, and the changing political environment; (N) continue to develop the capabilities of its distributors and dealers, effectively implement changes relating to its dealers and distribution methods and manage the risks that its independent dealers may have difficulty obtaining capital and managing through changing economic conditions and consumer demand; (O) develop and maintain a productive relationship with Zhejiang Qianjiang Motorcycle Co., Ltd. and launch related products in a timely manner; (P) manage and predict the impact that new or adjusted tariffs may have on the company’s ability to sell products internationally, and the cost of raw materials and components; (Q) successfully determine, implement on a timely basis, and maintain a manner in which to sell motorcycles in the European Union, China, and the company’s ASEAN countries that does not subject its motorcycles to incremental tariffs; (R) manage its Thailand corporate and manufacturing operation in a manner that allows the company to avail itself of preferential free trade agreements and duty rates, and sufficiently lower prices of its motorcycles in certain markets; (S) accurately estimate and adjust to fluctuations in foreign currency exchange rates, interest rates and commodity prices; (T) retain and attract talented employees, and eliminate personnel duplication, inefficiencies and complexity throughout the organization; (U) prevent a cybersecurity breach involving consumer, employee, dealer, supplier, or company data and respond to evolving regulatory requirements regarding data security; (V) manage the credit quality, the loan servicing and collection activities, and the recovery rates of HDFS' loan portfolio; (W) adjust to tax reform, healthcare inflation and reform and pension reform, and successfully estimate the impact of any such reform on the company's business; (X) manage through the effects inconsistent and unpredictable weather patterns may have on retail sales of motorcycles; (Y) implement and manage enterprise-wide information technology systems, including systems at its manufacturing facilities; (Z) manage changes and prepare for requirements in legislative and regulatory environments for its products, services and operations; (AA) manage its exposure to product liability claims and commercial or contractual disputes; (BB) continue to manage the relationships and agreements that the company has with its labor unions to help drive long-term competitiveness; and (CC) accurately predict the margins of its Motorcycles and Related Productssegment in light of, among other things, tariffs, the cost associated with product development initiatives and the company’s complex global supply chain.
The company’s operations, demand for its products, and its liquidity could be adversely impacted by work stoppages, facility closures, strikes, natural causes, widespread infectious disease, terrorism, or other factors. Other factors are described in risk factors that the company has disclosed in documents previously filed with the Securities and Exchange Commission. Many of these risk factors are impacted by the current changing capital, credit and retail markets and the company's ability to manage through inconsistenteconomic conditions.
The company's ability to sell its motorcycles and related products and services and to meet its financial expectations also depends on the ability of the company's independent dealers to sell its motorcycles and related products and services to retail customers. The company depends on the capability and financial capacity of its independent dealers to develop and implement effective retail sales plans to create demand for the motorcycles and related products and services they purchase from the company. In addition, the company's independent dealers and distributors may experience difficulties in operating their businesses and selling Harley-Davidson motorcycles and related products and services as a result of weather, economic conditions, the impact of COVID-19, or otherfactors. In recent years, HDFS has experienced historically low levels of retail credit losses, but there is no assurance that this will continue. The company believes that HDFS' retail credit losses may increase over time due to changing consumer credit behavior and HDFS' efforts to increase prudently structured loan approvals to sub-prime borrowers, as well as actions that the company has taken and could take that impact motorcycle values. Refer to "Risk Factors" under Item 1A of the company's Annual Report on Form 10-K for the year ended December 31, 2019 and Part II, Item 1A of any subsequently filed Quarterly Report on Form 10-Q, for a discussion of additional risk factors and a more complete discussion of some of the cautionary statements noted above.
FORWARD-LOOKING STATEMENTS
21