HARLEY-DAVIDSON, INC. 2018 FIRST QUARTER UPDATE
32
April 24, 2018 | Conference Call Slide Presentation HARLEY-DAVIDSON, INC. 2018 FIRST QUARTER UPDATE APRIL 24, 2018
Transcript of HARLEY-DAVIDSON, INC. 2018 FIRST QUARTER UPDATE

April 24, 2018 | Conference Call Slide Presentation
HARLEY-DAVIDSON, INC.
2018 FIRST QUARTER UPDATE
APRIL 24, 2018
April 24, 2018 | Conference Call Slide Presentation
2018 FIRST QUARTER UPDATE
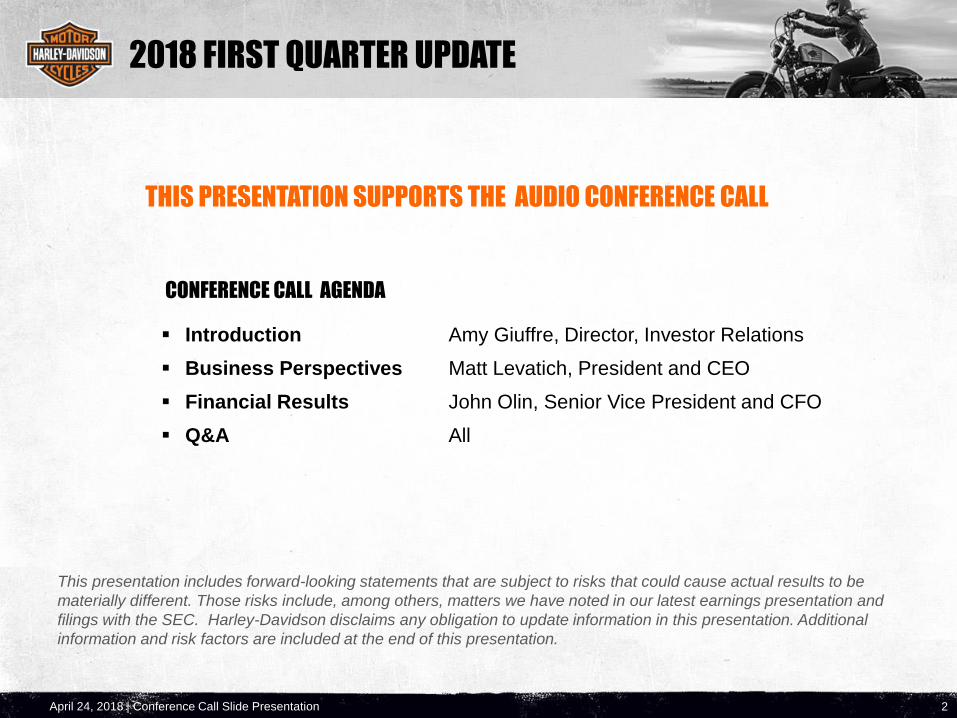
▪ Introduction Amy Giuffre, Director, Investor Relations
▪ Business Perspectives Matt Levatich, President and CEO
▪ Financial Results John Olin, Senior Vice President and CFO
▪ Q&A All
CONFERENCE CALL AGENDA
2
This presentation includes forward-looking statements that are subject to risks that could cause actual results to be
materially different. Those risks include, among others, matters we have noted in our latest earnings presentation and
filings with the SEC. Harley-Davidson disclaims any obligation to update information in this presentation. Additional
information and risk factors are included at the end of this presentation.
THIS PRESENTATION SUPPORTS THE AUDIO CONFERENCE CALL
April 24, 2018 | Conference Call Slide Presentation
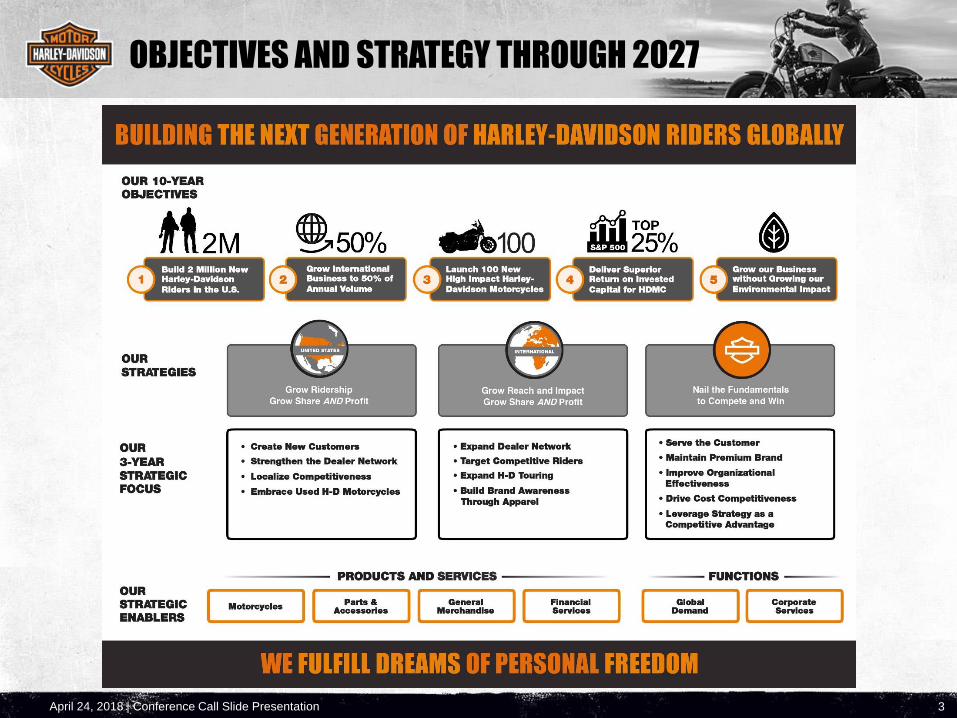
OBJECTIVES AND STRATEGY THROUGH 2027
3

April 24, 2018 | Conference Call Slide Presentation
BUSINESS PERSPECTIVESMATT LEVATICH, PRESIDENT & CEO, HARLEY-DAVIDSON, INC.
April 24, 2018 | Conference Call Slide Presentation
Q1 2018
5
Highlights
▪ EPS of $1.03 ($1.24 excluding manufacturing optimization costs)
▪ Consolidated revenue up 2.7%
▪ HDFS operating income up 20.8%, year-over-year credit losses down
▪ Increased dividend 1.4%, repurchased 1.4 million shares
▪ Growth in international retail sales
▪ Manufacturing optimization initiative on-track
▪ Confirmed full-year shipment guidance
▪ Strategy enhancement and acceleration planned
Committed to driving long-term value and maintaining brand premium
April 24, 2018 | Conference Call Slide Presentation
BUILDING RIDERSHIP
6
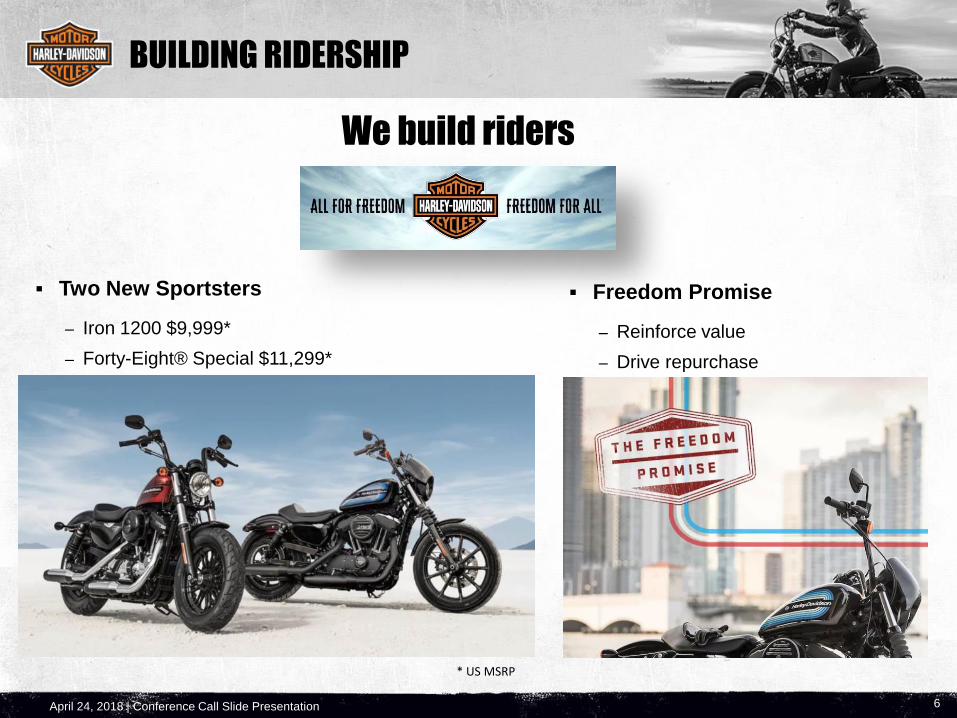
▪ Two New Sportsters
– Iron 1200 $9,999*
– Forty-Eight® Special $11,299*
We build riders
* US MSRP
▪ Freedom Promise
– Reinforce value
– Drive repurchase
April 24, 2018 | Conference Call Slide Presentation
INTERNATIONAL MOMENTUM
7
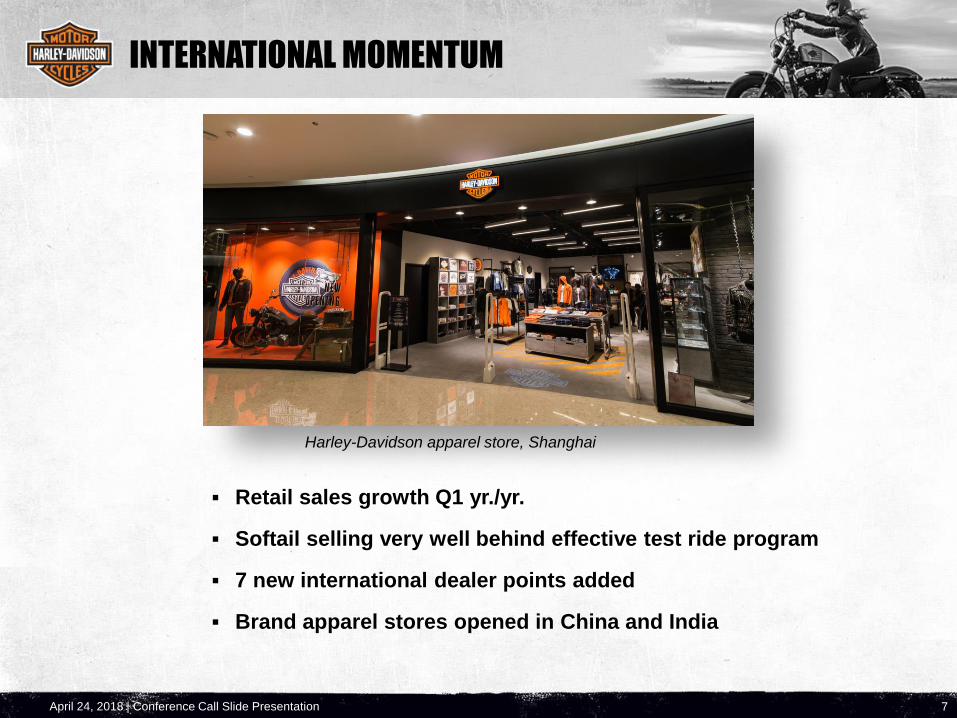
Harley-Davidson apparel store, Shanghai
▪ Retail sales growth Q1 yr./yr.
▪ Softail selling very well behind effective test ride program
▪ 7 new international dealer points added
▪ Brand apparel stores opened in China and India
April 24, 2018 | Conference Call Slide Presentation
▪ Bold new moves to deliver long-term objectives and accelerate
performance through 2022
▪ Refining plans, will announce details this summer
STRATEGY
8
Enhanced Strategy
April 24, 2018 | Conference Call Slide Presentation
OUTLOOK
9
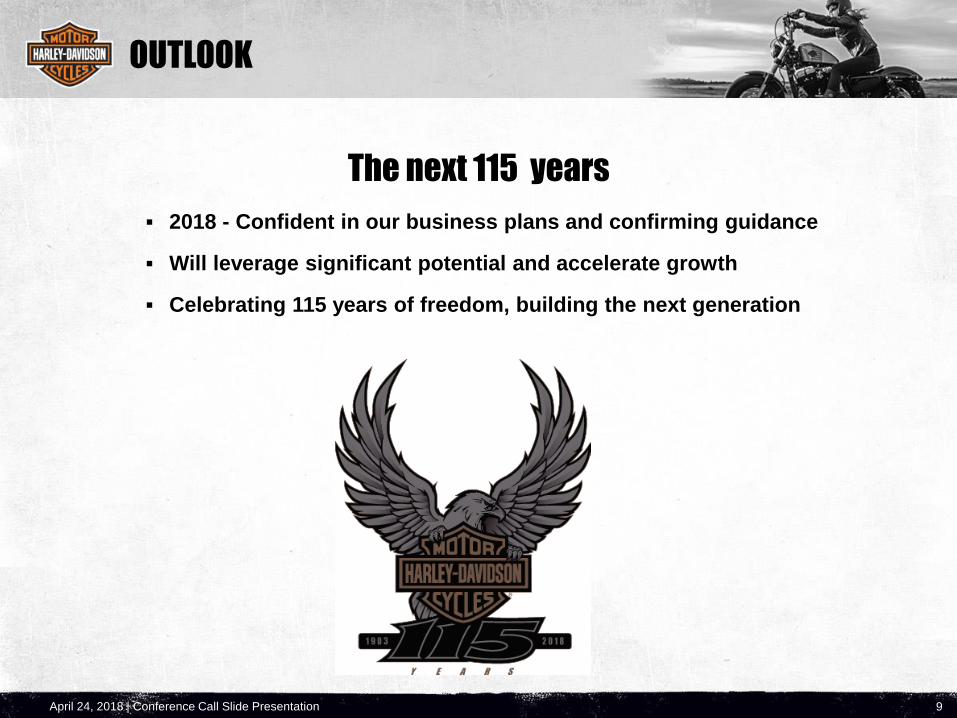
The next 115 years
▪ 2018 - Confident in our business plans and confirming guidance
▪ Will leverage significant potential and accelerate growth
▪ Celebrating 115 years of freedom, building the next generation

April 24, 2018 | Conference Call Slide Presentation
FINANCIAL RESULTSJOHN OLIN, SENIOR VICE PRESIDENT & CFO, HARLEY-DAVIDSON, INC.
April 24, 2018 | Conference Call Slide Presentation
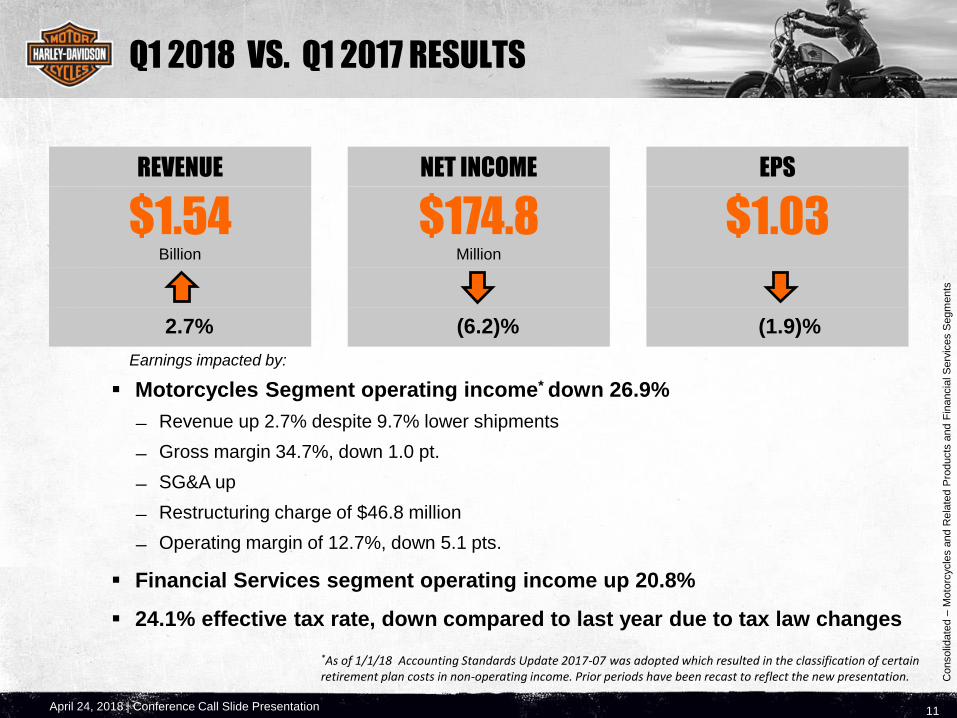
Q1 2018 VS. Q1 2017 RESULTS
▪ Motorcycles Segment operating income* down 26.9%
Revenue up 2.7% despite 9.7% lower shipments
Gross margin 34.7%, down 1.0 pt.
SG&A up
Restructuring charge of $46.8 million
Operating margin of 12.7%, down 5.1 pts.
▪ Financial Services segment operating income up 20.8%
▪ 24.1% effective tax rate, down compared to last year due to tax law changes
Earnings impacted by:
11
Consolid
ate
d –
Moto
rcycle
s a
nd R
ela
ted P
roducts
and F
inancia
l S
erv
ices S
egm
ents
REVENUE NET INCOME EPS
$1.54 $174.8 $1.03Billion Million
2.7% (6.2)% (1.9)%
*As of 1/1/18 Accounting Standards Update 2017-07 was adopted which resulted in the classification of certain retirement plan costs in non-operating income. Prior periods have been recast to reflect the new presentation.
April 24, 2018 | Conference Call Slide Presentation
WORLDWIDE RETAIL SALES
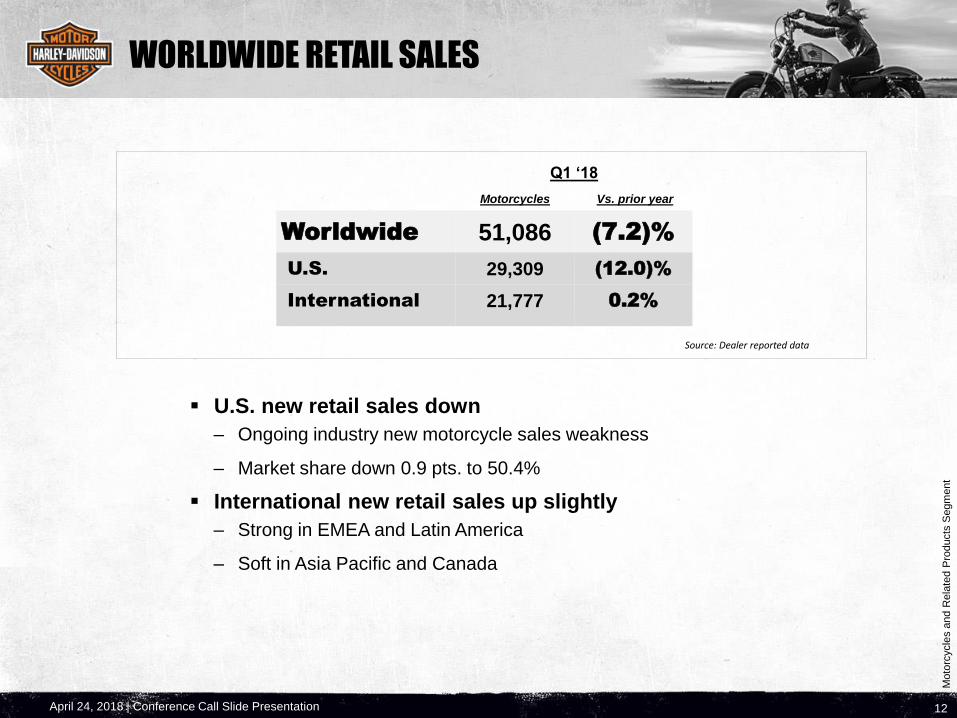
▪ U.S. new retail sales down
– Ongoing industry new motorcycle sales weakness
– Market share down 0.9 pts. to 50.4%
▪ International new retail sales up slightly
– Strong in EMEA and Latin America
– Soft in Asia Pacific and Canada
12
Moto
rcycle
s a
nd R
ela
ted P
roducts
Segm
ent
Source: Dealer reported data
Q1 ‘18
Motorcycles Vs. prior year
Worldwide 51,086 (7.2)%
U.S. 29,309 (12.0)%
International 21,777 0.2%
April 24, 2018 | Conference Call Slide Presentation
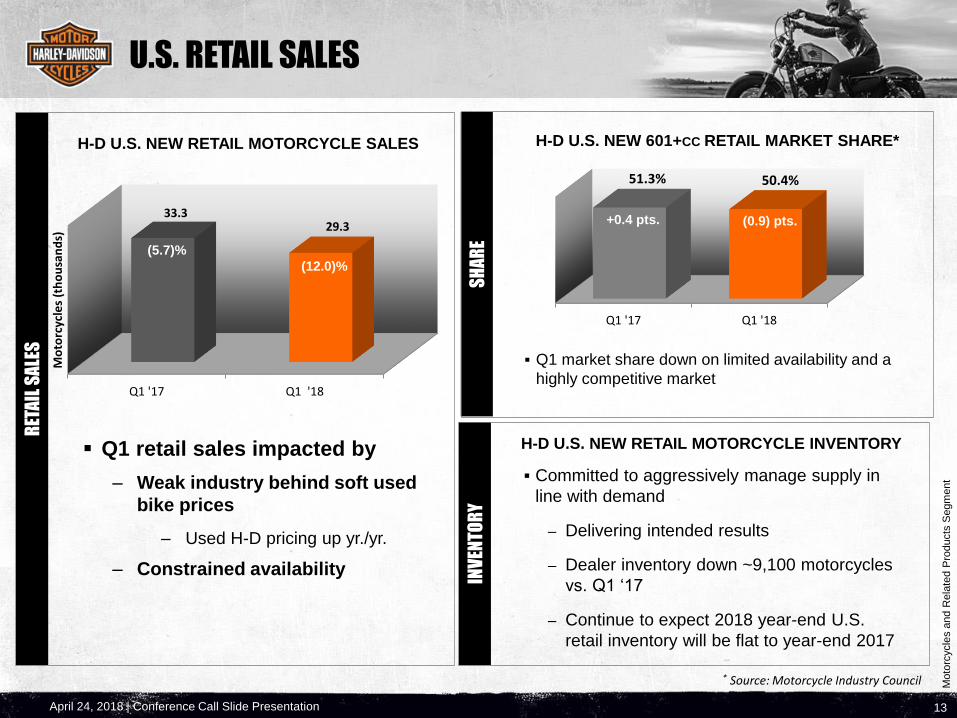
Q1 '17 Q1 '18
51.3% 50.4%
Q1 '17 Q1 '18
33.329.3
Mo
torc
ycle
s (t
ho
usa
nd
s)U.S. RETAIL SALES
13
H-D U.S. NEW 601+CC RETAIL MARKET SHARE*H-D U.S. NEW RETAIL MOTORCYCLE SALES
RET
AIL
SA
LES
SH
AR
EIN
VEN
TO
RY
▪ Q1 retail sales impacted by
– Weak industry behind soft used
bike prices
– Used H-D pricing up yr./yr.
– Constrained availability
▪ Q1 market share down on limited availability and a
highly competitive market
▪ Committed to aggressively manage supply in
line with demand
– Delivering intended results
– Dealer inventory down ~9,100 motorcycles
vs. Q1 ‘17
– Continue to expect 2018 year-end U.S.
retail inventory will be flat to year-end 2017
H-D U.S. NEW RETAIL MOTORCYCLE INVENTORY
Moto
rcycle
s a
nd R
ela
ted P
roducts
Segm
ent
* Source: Motorcycle Industry Council
+0.4 pts.
(5.7)%
(12.0)%
(0.9) pts.
April 24, 2018 | Conference Call Slide Presentation
Q1 '17 Q1 '18
9.1%10.4%
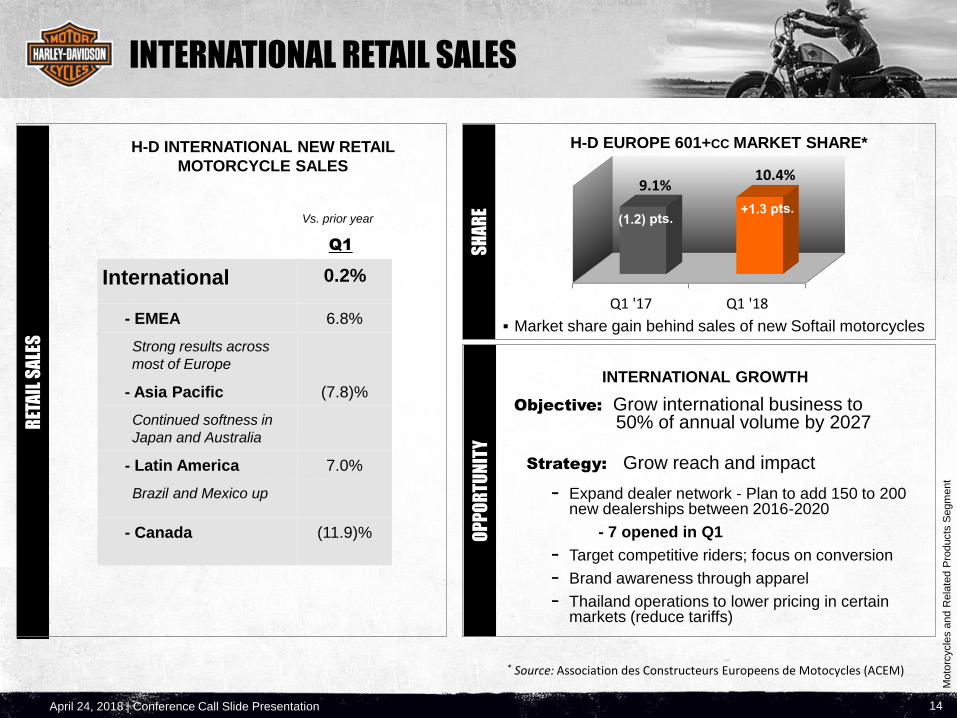
Strategy: Grow reach and impact
- Expand dealer network - Plan to add 150 to 200 new dealerships between 2016-2020
- 7 opened in Q1
- Target competitive riders; focus on conversion
- Brand awareness through apparel
- Thailand operations to lower pricing in certain markets (reduce tariffs)
INTERNATIONAL RETAIL SALES
14
INTERNATIONAL GROWTH
H-D EUROPE 601+CC MARKET SHARE*
RET
AIL
SA
LES
OP
PO
RT
UN
ITY
SH
AR
E
Moto
rcycle
s a
nd R
ela
ted P
roducts
Segm
ent
H-D INTERNATIONAL NEW RETAIL
MOTORCYCLE SALES
* Source: Association des Constructeurs Europeens de Motocycles (ACEM)
Objective: Grow international business to 50% of annual volume by 2027
▪ Market share gain behind sales of new Softail motorcycles
Vs. prior year
Q1
International 0.2%
- EMEA 6.8%
Strong results across
most of Europe
- Asia Pacific (7.8)%
Continued softness in
Japan and Australia
- Latin America 7.0%
Brazil and Mexico up
- Canada (11.9)%
April 24, 2018 | Conference Call Slide Presentation
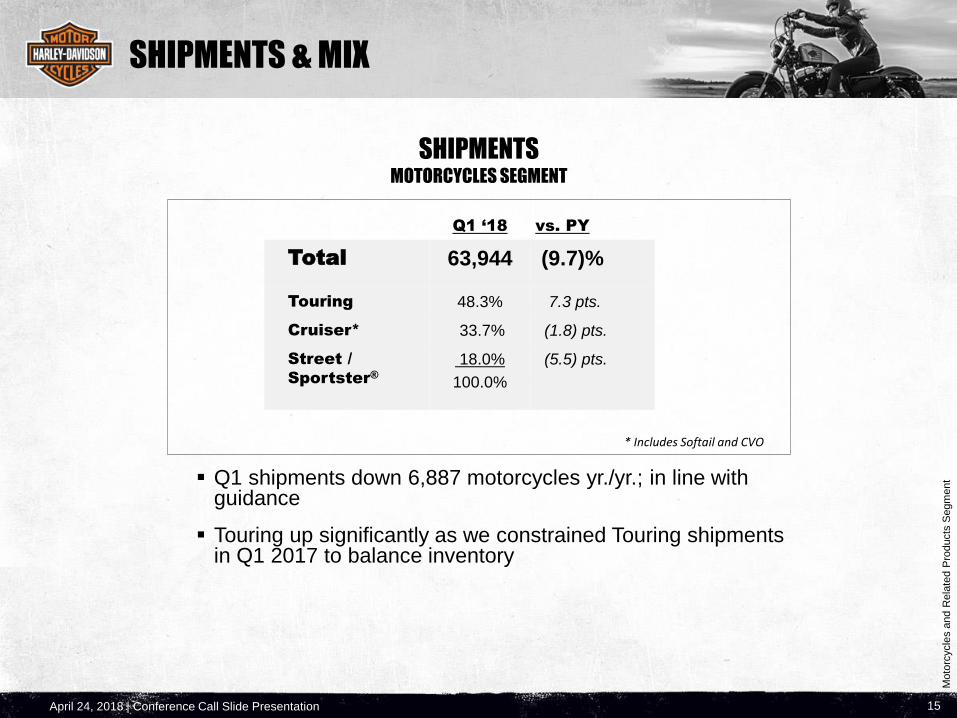
Q1 ‘18 vs. PY
Total 63,944 (9.7)%
Touring 48.3% 7.3 pts.
Cruiser* 33.7% (1.8) pts.
Street /
Sportster®
18.0%
100.0%
(5.5) pts.
SHIPMENTS & MIX
▪ Q1 shipments down 6,887 motorcycles yr./yr.; in line with guidance
▪ Touring up significantly as we constrained Touring shipments in Q1 2017 to balance inventory
SHIPMENTS MOTORCYCLES SEGMENT
15
Moto
rcycle
s a
nd R
ela
ted P
roducts
Segm
ent
* Includes Softail and CVO
April 24, 2018 | Conference Call Slide Presentation
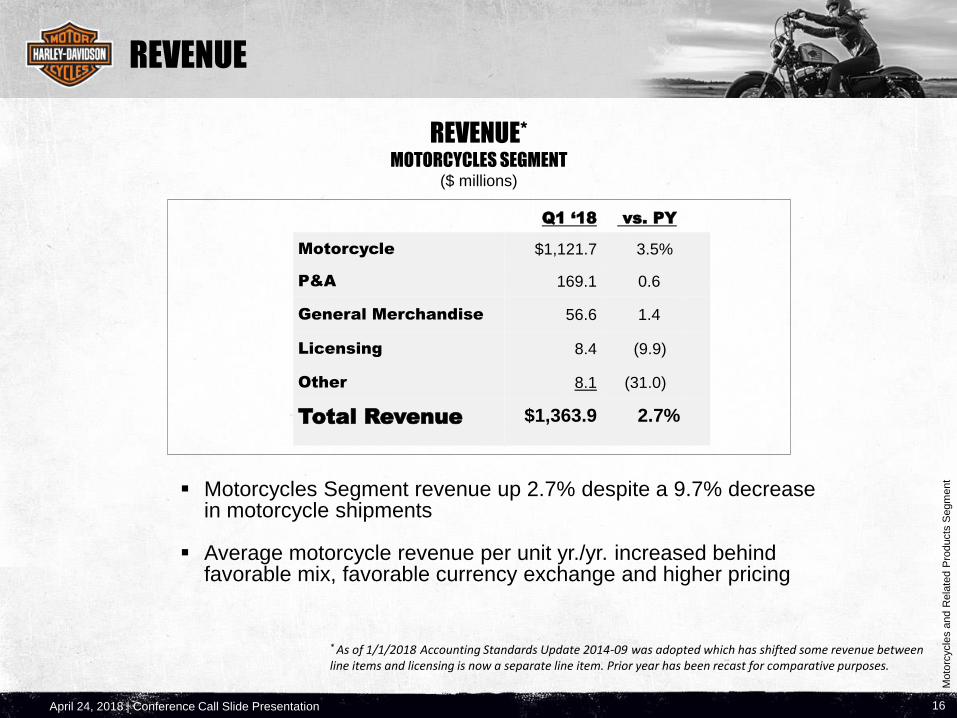
REVENUE
▪ Motorcycles Segment revenue up 2.7% despite a 9.7% decrease in motorcycle shipments
▪ Average motorcycle revenue per unit yr./yr. increased behind favorable mix, favorable currency exchange and higher pricing
REVENUE*MOTORCYCLES SEGMENT
($ millions)
16
Q1 ‘18 vs. PY
Motorcycle $1,121.7 3.5%
P&A 169.1 0.6
General Merchandise 56.6 1.4
Licensing 8.4 (9.9)
Other 8.1 (31.0)
Total Revenue $1,363.9 2.7%
Moto
rcycle
s a
nd R
ela
ted P
roducts
Segm
ent
* As of 1/1/2018 Accounting Standards Update 2014-09 was adopted which has shifted some revenue between line items and licensing is now a separate line item. Prior year has been recast for comparative purposes.
April 24, 2018 | Conference Call Slide Presentation
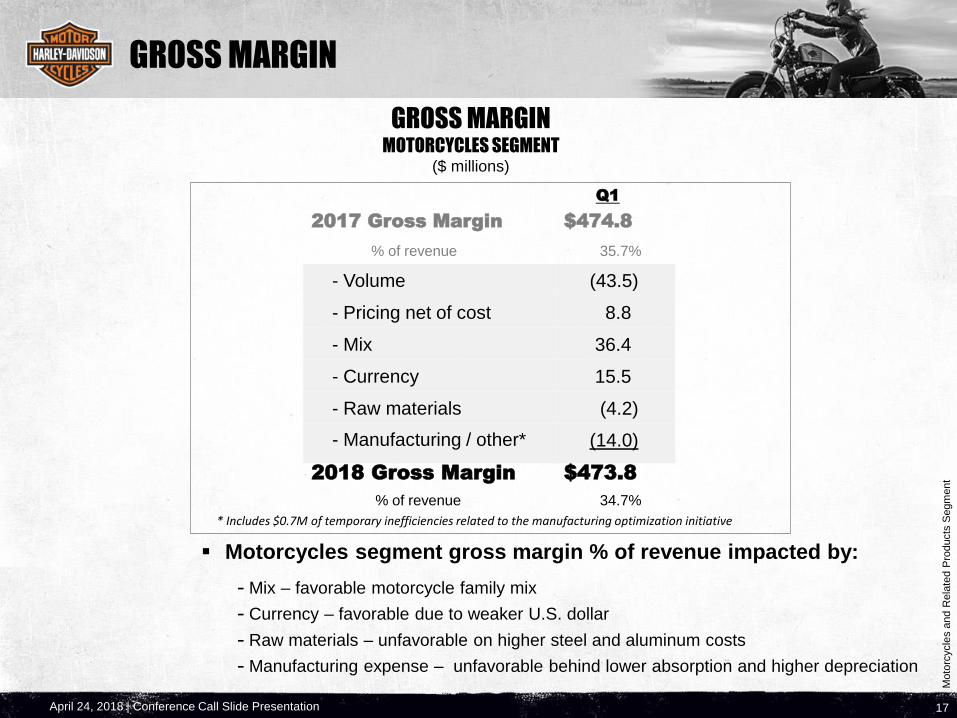
GROSS MARGIN
Q1
2017 Gross Margin $474.8
% of revenue 35.7%
- Volume (43.5)
- Pricing net of cost 8.8
- Mix 36.4
- Currency 15.5
- Raw materials (4.2)
- Manufacturing / other* (14.0)
2018 Gross Margin $473.8
% of revenue 34.7%
GROSS MARGINMOTORCYCLES SEGMENT
($ millions)
17
▪ Motorcycles segment gross margin % of revenue impacted by:
- Mix – favorable motorcycle family mix
- Currency – favorable due to weaker U.S. dollar
- Raw materials – unfavorable on higher steel and aluminum costs
- Manufacturing expense – unfavorable behind lower absorption and higher depreciation
Moto
rcycle
s a
nd R
ela
ted P
roducts
Segm
ent
* Includes $0.7M of temporary inefficiencies related to the manufacturing optimization initiative
April 24, 2018 | Conference Call Slide Presentation
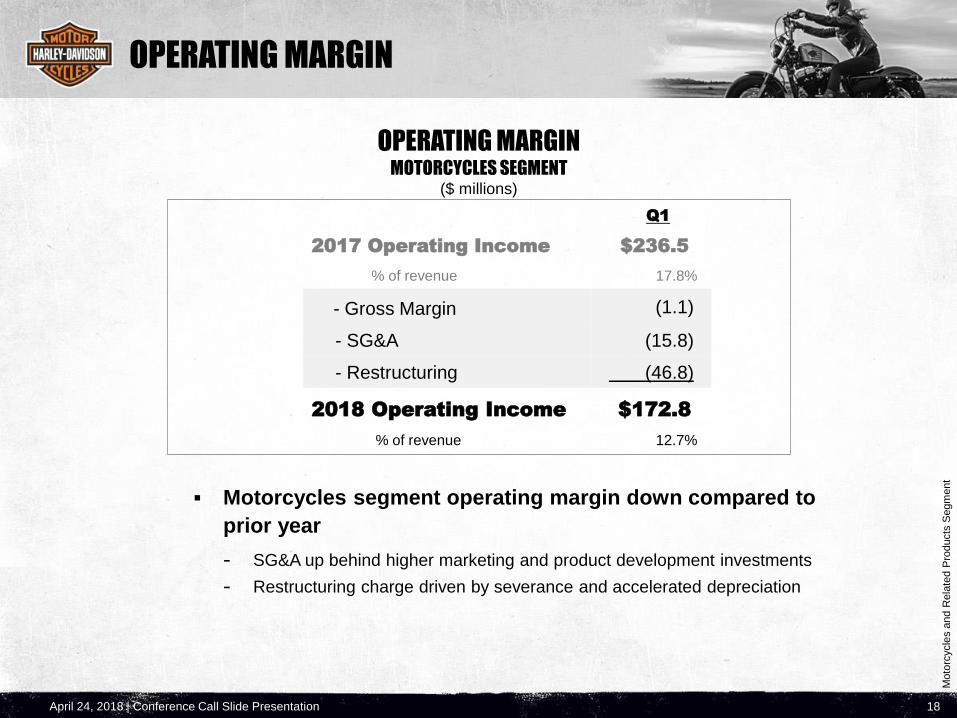
OPERATING MARGIN
Q1
2017 Operating Income $236.5
% of revenue 17.8%
- Gross Margin (1.1)
- SG&A (15.8)
- Restructuring (46.8)
2018 Operating Income $172.8
% of revenue 12.7%
OPERATING MARGINMOTORCYCLES SEGMENT
($ millions)
18
▪ Motorcycles segment operating margin down compared to
prior year
- SG&A up behind higher marketing and product development investments
- Restructuring charge driven by severance and accelerated depreciation
Moto
rcycle
s a
nd R
ela
ted P
roducts
Segm
ent

April 24, 2018 | Conference Call Slide Presentation
Fin
ancia
l S
erv
ices S
egm
ent
HDFS
▪ Financial Services operating income was higher
driven by a lower provision for retail loan losses
OPERATING INCOMEFINANCIAL SERVICES SEGMENT
($ millions)
Q1
2017 Operating Income $52.7
- Net interest income (1.9)
- Provision for retail motorcycle loan losses 14.2
- Provision for wholesale loan losses (0.6)
- Operating expenses (2.4)
- All other 1.6
2018 Operating Income $63.6
19
April 24, 2018 | Conference Call Slide Presentation
Fin
ancia
l S
erv
ices S
egm
ent
HDFS
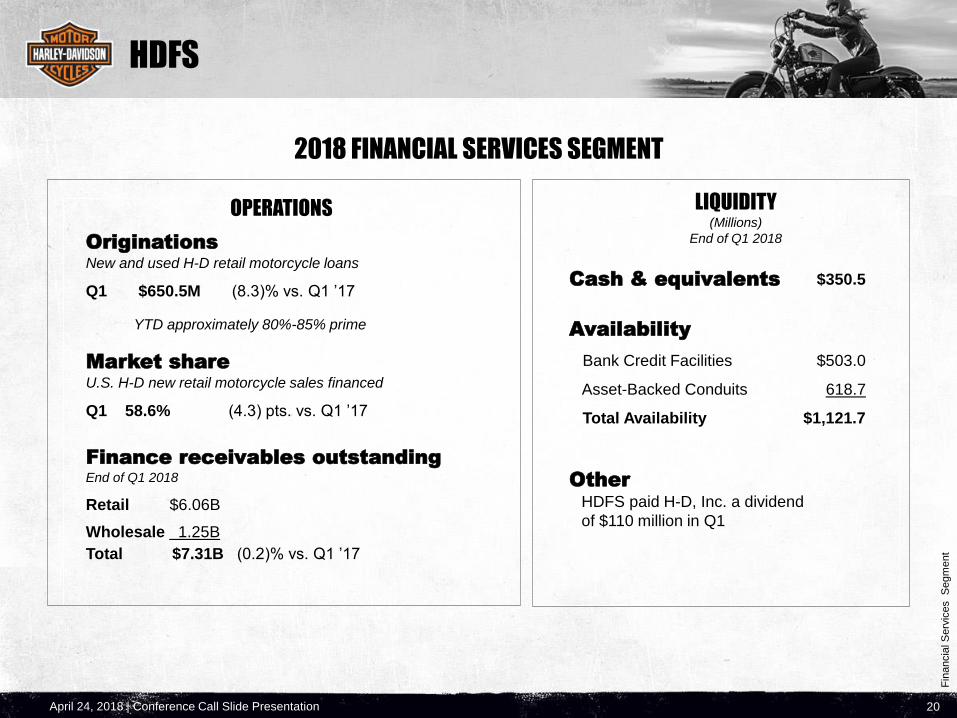
2018 FINANCIAL SERVICES SEGMENT
LIQUIDITY(Millions)
End of Q1 2018
Cash & equivalents $350.5
Availability
Bank Credit Facilities $503.0
Asset-Backed Conduits 618.7
Total Availability $1,121.7
Other
HDFS paid H-D, Inc. a dividend
of $110 million in Q1
OPERATIONS
Originations
New and used H-D retail motorcycle loans
Q1 $650.5M (8.3)% vs. Q1 ’17
YTD approximately 80%-85% prime
Market share
U.S. H-D new retail motorcycle sales financed
Q1 58.6% (4.3) pts. vs. Q1 ’17
Finance receivables outstanding
End of Q1 2018
Retail $6.06B
Wholesale 1.25B
Total $7.31B (0.2)% vs. Q1 ’17
20
April 24, 2018 | Conference Call Slide Presentation
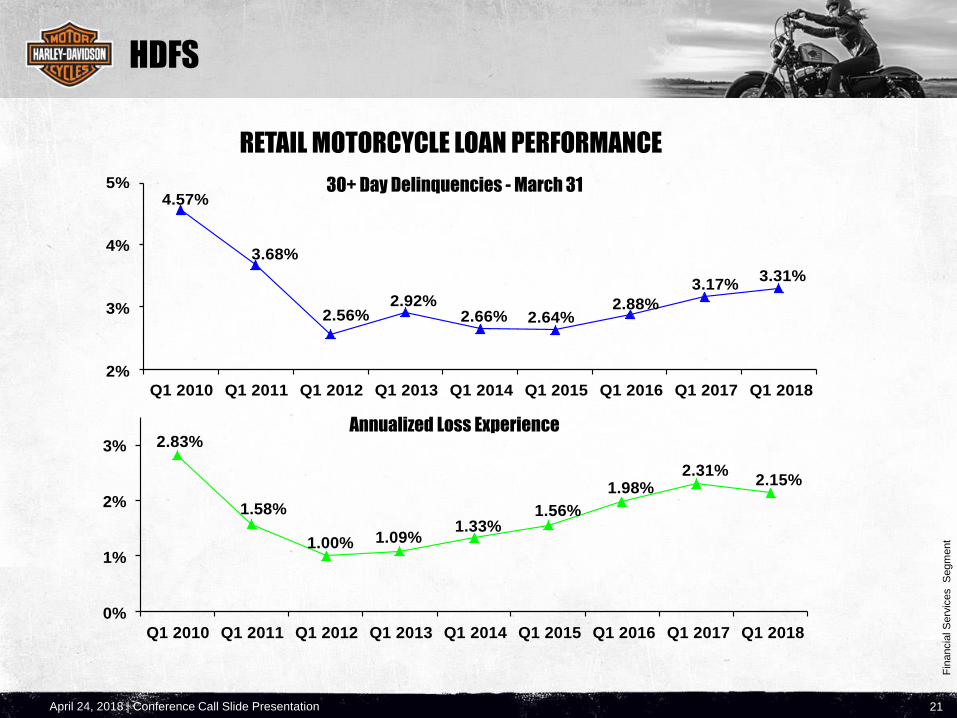
2.83%
1.58%
1.00% 1.09%1.33%
1.56%
1.98%2.31%
2.15%
0%
1%
2%
3%
Q1 2010 Q1 2011 Q1 2012 Q1 2013 Q1 2014 Q1 2015 Q1 2016 Q1 2017 Q1 2018
4.57%
3.68%
2.56%2.92%
2.66% 2.64%2.88%
3.17%3.31%
2%
3%
4%
5%
Q1 2010 Q1 2011 Q1 2012 Q1 2013 Q1 2014 Q1 2015 Q1 2016 Q1 2017 Q1 2018
HDFS
21
30+ Day Delinquencies - March 31
Fin
ancia
l S
erv
ices S
egm
ent
21
RETAIL MOTORCYCLE LOAN PERFORMANCE
Annualized Loss Experience

April 24, 2018 | Conference Call Slide Presentation
Consolid
ate
d –
Moto
rcycle
s a
nd R
ela
ted P
roducts
and F
inancia
l S
erv
ices S
egm
ents
HARLEY-DAVIDSON, INC.
▪ Cash & marketable securities - $753.5 million vs. $844.7 million
▪ Operating cash flow - $191.6 million vs. $159.9 million
▪ Capital spending - $28.4 million vs. $24.0 million
▪ Depreciation/amortization expense - $62.5 million vs. $54.9 million
▪ Tax rate – 24.1% vs. 34.5%
– Impact of new tax legislation
Q1 2018 HARLEY-DAVIDSON, INC.VS. PY
22
April 24, 2018 | Conference Call Slide Presentation 23
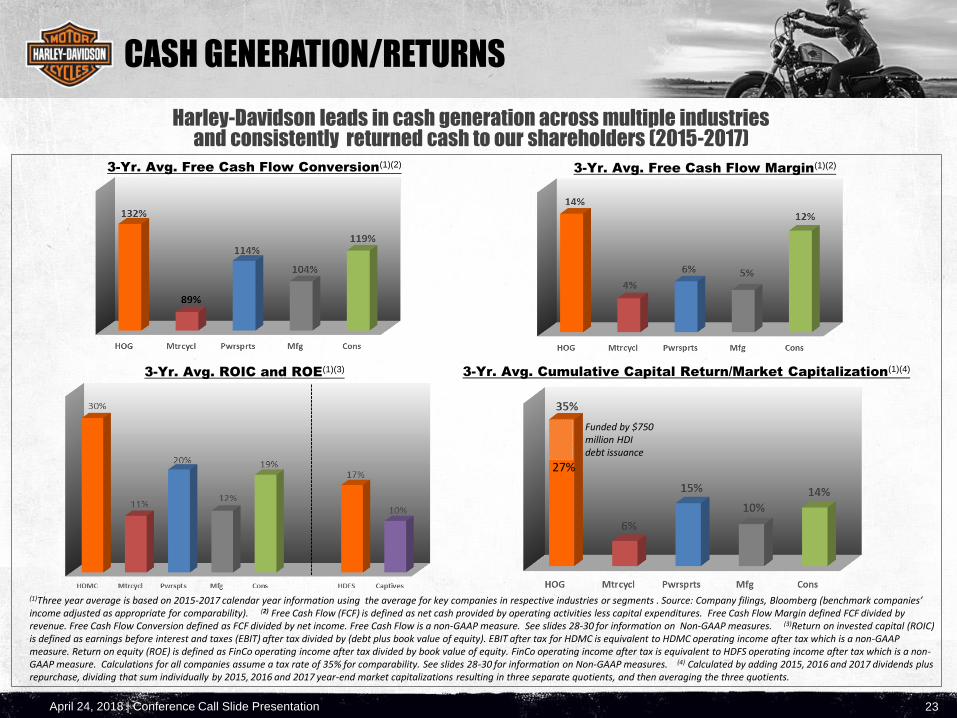
CASH GENERATION/RETURNS
Harley-Davidson leads in cash generation across multiple industries and consistently returned cash to our shareholders (2015-2017)
3-Yr. Avg. Free Cash Flow Conversion(1)(2)
3-Yr. Avg. Free Cash Flow Margin(1)(2)
3-Yr. Avg. Cumulative Capital Return/Market Capitalization(1)(4)
27%
Funded by $750 million HDI debt issuance
3-Yr. Avg. ROIC and ROE(1)(3)
(1)Three year average is based on 2015-2017 calendar year information using the average for key companies in respective industries or segments . Source: Company filings, Bloomberg (benchmark companies’ income adjusted as appropriate for comparability). (2) Free Cash Flow (FCF) is defined as net cash provided by operating activities less capital expenditures. Free Cash Flow Margin defined FCF divided by revenue. Free Cash Flow Conversion defined as FCF divided by net income. Free Cash Flow is a non-GAAP measure. See slides 28-30 for information on Non-GAAP measures. (3)Return on invested capital (ROIC) is defined as earnings before interest and taxes (EBIT) after tax divided by (debt plus book value of equity). EBIT after tax for HDMC is equivalent to HDMC operating income after tax which is a non-GAAP measure. Return on equity (ROE) is defined as FinCo operating income after tax divided by book value of equity. FinCo operating income after tax is equivalent to HDFS operating income after tax which is a non-GAAP measure. Calculations for all companies assume a tax rate of 35% for comparability. See slides 28-30 for information on Non-GAAP measures. (4) Calculated by adding 2015, 2016 and 2017 dividends plus repurchase, dividing that sum individually by 2015, 2016 and 2017 year-end market capitalizations resulting in three separate quotients, and then averaging the three quotients.
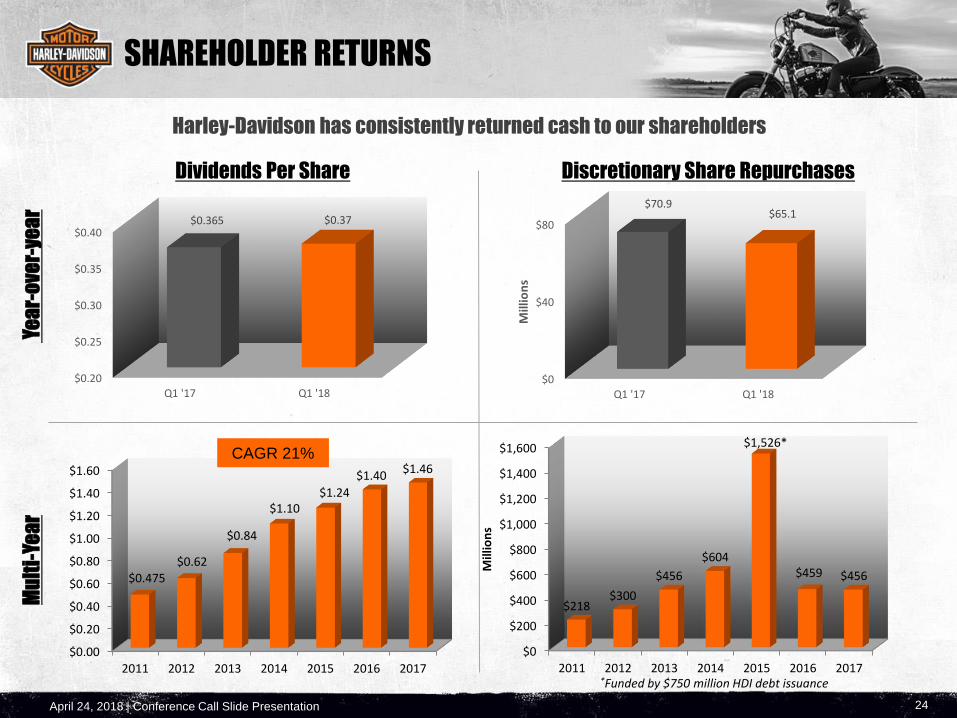
April 24, 2018 | Conference Call Slide Presentation
$0
$200
$400
$600
$800
$1,000
$1,200
$1,400
$1,600
2011 2012 2013 2014 2015 2016 2017
$218$300
$456
$604
$1,526*
$459 $456
Mill
ion
s
$0.20
$0.25
$0.30
$0.35
$0.40
Q1 '17 Q1 '18
$0.365 $0.37
24
SHAREHOLDER RETURNS
Harley-Davidson has consistently returned cash to our shareholders
Yea
r-o
ver-
yea
r
Discretionary Share RepurchasesDividends Per Share
Mu
lti-
Yea
r
*Funded by $750 million HDI debt issuance
$0.00
$0.20
$0.40
$0.60
$0.80
$1.00
$1.20
$1.40
$1.60
2011 2012 2013 2014 2015 2016 2017
$0.475$0.62
$0.84
$1.10$1.24
$1.40$1.46
CAGR 21%
$0
$40
$80
Q1 '17 Q1 '18
$70.9$65.1
Mill
ion
s

April 24, 2018 | Conference Call Slide Presentation 25
Manufacturing Optimization Summary as of 4/24/18
$ Millions (Estimated)
Annual Cash
Savings- $25-30 $45-$50 $65-$75
Temporary Inefficiencies $20-$25 $15-$20 - $35-$45
Restructuring $100-$115 $35-$40 - $135-$155
Total Costs $120-$140 $50-$60 - $170-$200
% Cash Approx. 70% Approx. 75% NA Approx. 70%
2018 2019 2020 Total
Annual 2018 2019 2020 Ongoing
Moto
rcycle
and R
ela
ted P
roducts
Segm
ent
MANUFACTURING OPTIMIZATION
▪ Q1 2018 restructuring $46.8 million; temporary inefficiencies $0.7 million
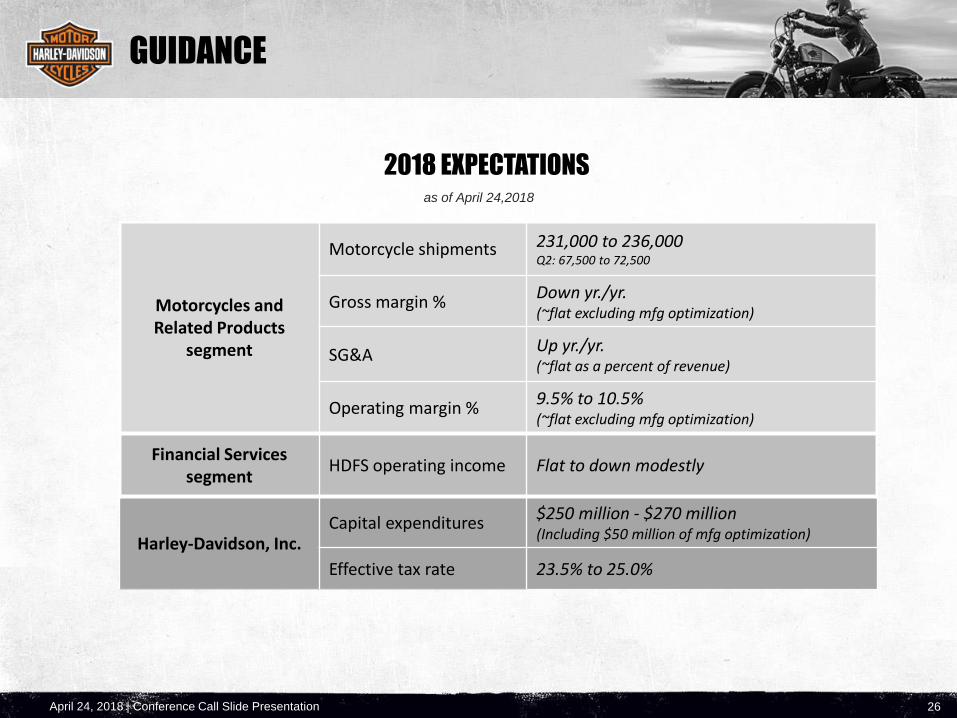
April 24, 2018 | Conference Call Slide Presentation
Motorcycles and Related Products
segment
Motorcycle shipments 231,000 to 236,000Q2: 67,500 to 72,500
Gross margin % Down yr./yr. (~flat excluding mfg optimization)
SG&AUp yr./yr.(~flat as a percent of revenue)
Operating margin %9.5% to 10.5% (~flat excluding mfg optimization)
Financial Services segment
HDFS operating income Flat to down modestly
Harley-Davidson, Inc. Capital expenditures
$250 million - $270 million(Including $50 million of mfg optimization)
Effective tax rate 23.5% to 25.0%
as of April 24,2018
26
GUIDANCE
2018 EXPECTATIONS
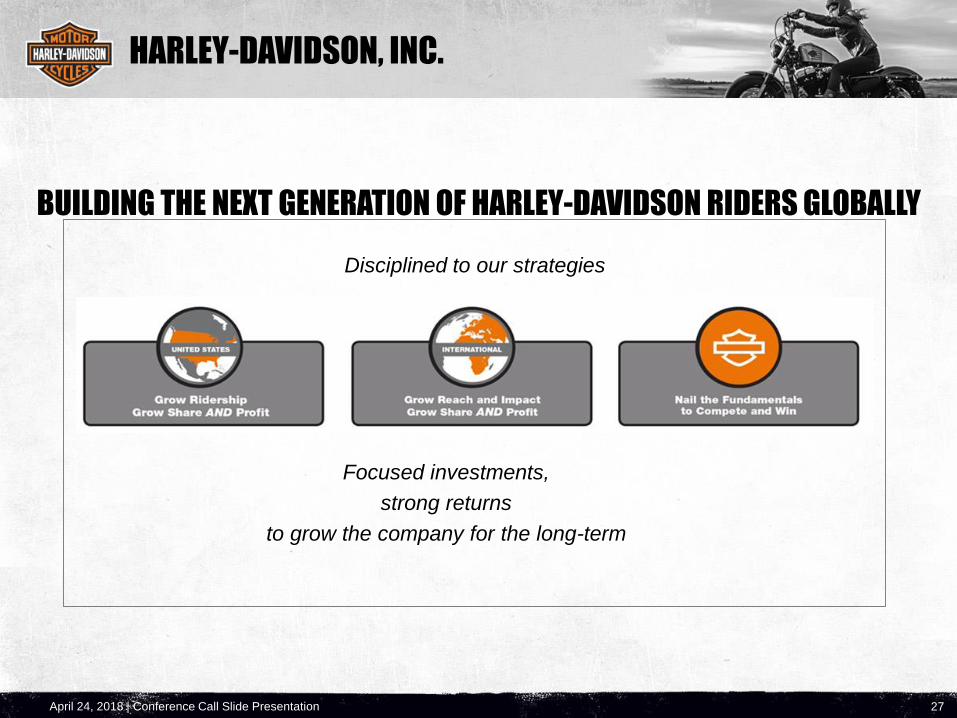
April 24, 2018 | Conference Call Slide Presentation 27
Focused investments,
strong returns
to grow the company for the long-term
HARLEY-DAVIDSON, INC.
BUILDING THE NEXT GENERATION OF HARLEY-DAVIDSON RIDERS GLOBALLY
Disciplined to our strategies
April 24, 2018 | Conference Call Slide Presentation 28
NON-GAAP MEASURES
This presentation includes financial measures that have not been calculated in accordance with U.S. generally
accepted accounting principles (GAAP), and are therefore referred to as non-GAAP financial measures. The non-
GAAP measures listed below are intended to be considered by users as supplemental information to their equivalent
GAAP measures, to aid investors in better understanding the company’s financial results. The company believes that
these non-GAAP measures provide useful perspective on underlying business results and trends, and a means to
assess period-over-period results. These non-GAAP measures should not be considered as a substitute for, or superior
to, measures of financial performance prepared in accordance with GAAP. These non-GAAP measures may not be the
same as similarly titled measures used by other companies due to possible differences in method and in items or
events being adjusted.
The following non-GAAP measures related to earnings exclude restructuring expense and the cost of temporary
inefficiencies incurred in connection with the company’s manufacturing optimization plan:
• Net income excluding manufacturing optimization costs
• Diluted earnings per share excluding manufacturing optimization costs
The following non-GAAP measures are used as inputs into performance measures that allow for a comparison to the
performance of industry competitors:
• HDI free cash flow
• HDMC operating income after tax
• HDFS operating income after tax
A reconciliation of these non-GAAP measures to the comparable GAAP measures follows.
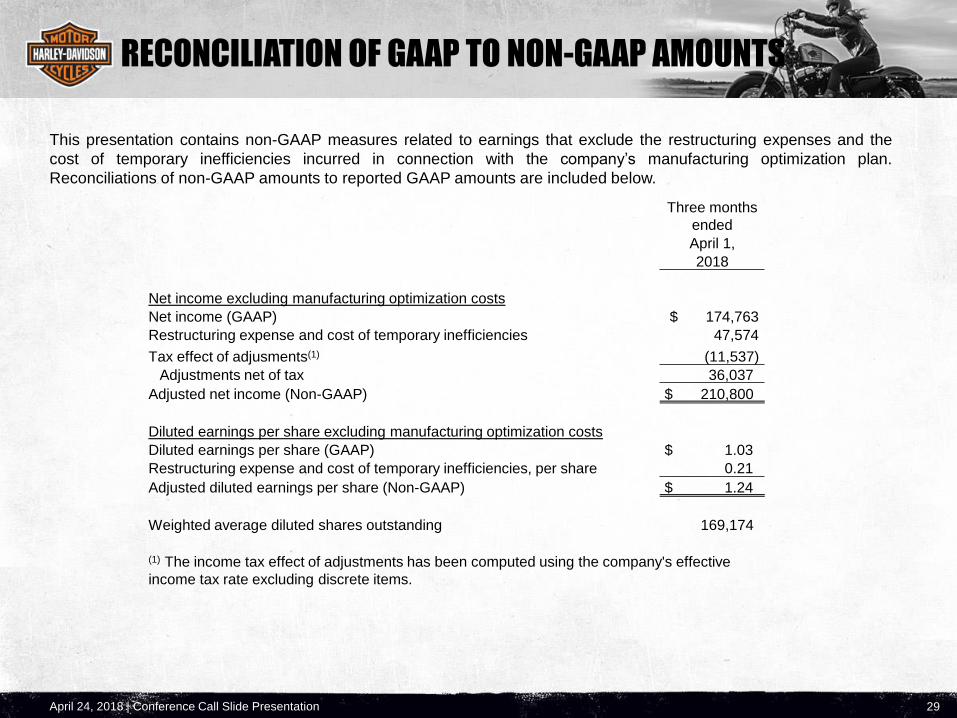
April 24, 2018 | Conference Call Slide Presentation 29
RECONCILIATION OF GAAP TO NON-GAAP AMOUNTS
This presentation contains non-GAAP measures related to earnings that exclude the restructuring expenses and the
cost of temporary inefficiencies incurred in connection with the company’s manufacturing optimization plan.
Reconciliations of non-GAAP amounts to reported GAAP amounts are included below.
Three months
ended
April 1,
2018
Net income excluding manufacturing optimization costs
Net income (GAAP) $ 174,763
Restructuring expense and cost of temporary inefficiencies 47,574
Tax effect of adjusments(1) (11,537)
Adjustments net of tax 36,037
Adjusted net income (Non-GAAP) $ 210,800
Diluted earnings per share excluding manufacturing optimization costs
Diluted earnings per share (GAAP) $ 1.03
Restructuring expense and cost of temporary inefficiencies, per share 0.21
Adjusted diluted earnings per share (Non-GAAP) $ 1.24
Weighted average diluted shares outstanding 169,174
(1) The income tax effect of adjustments has been computed using the company's effective
income tax rate excluding discrete items.
April 24, 2018 | Conference Call Slide Presentation 30
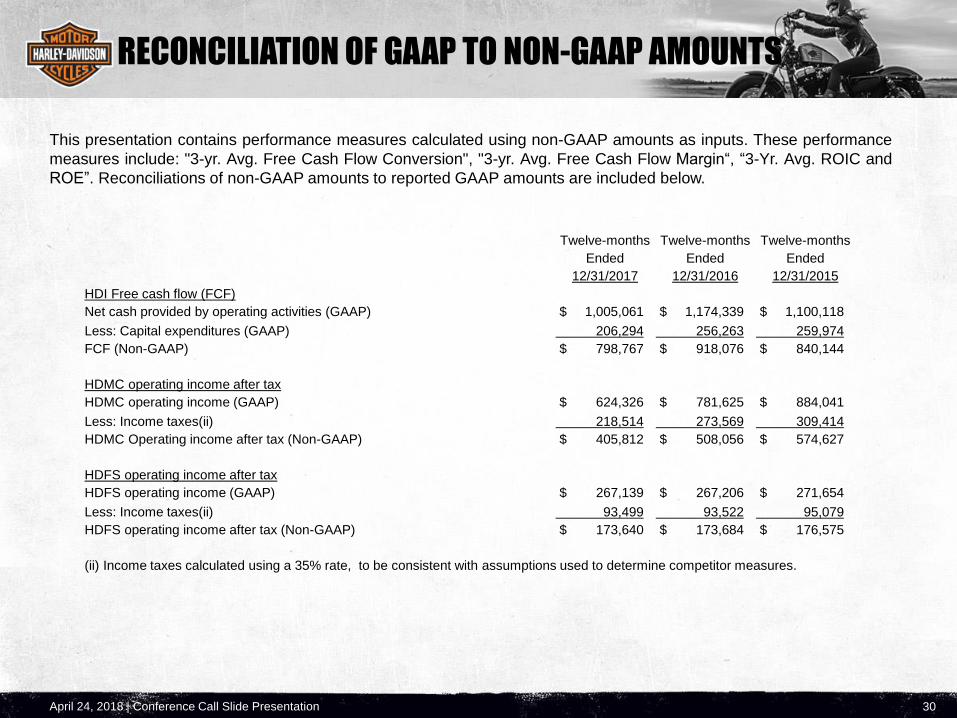
RECONCILIATION OF GAAP TO NON-GAAP AMOUNTS
This presentation contains performance measures calculated using non-GAAP amounts as inputs. These performance
measures include: "3-yr. Avg. Free Cash Flow Conversion", "3-yr. Avg. Free Cash Flow Margin“, “3-Yr. Avg. ROIC and
ROE”. Reconciliations of non-GAAP amounts to reported GAAP amounts are included below.
Twelve-months Twelve-months Twelve-months
Ended Ended Ended
12/31/2017 12/31/2016 12/31/2015
HDI Free cash flow (FCF)
Net cash provided by operating activities (GAAP) $ 1,005,061 $ 1,174,339 $ 1,100,118
Less: Capital expenditures (GAAP) 206,294 256,263 259,974
FCF (Non-GAAP) $ 798,767 $ 918,076 $ 840,144
HDMC operating income after tax
HDMC operating income (GAAP) $ 624,326 $ 781,625 $ 884,041
Less: Income taxes(ii) 218,514 273,569 309,414
HDMC Operating income after tax (Non-GAAP) $ 405,812 $ 508,056 $ 574,627
HDFS operating income after tax
HDFS operating income (GAAP) $ 267,139 $ 267,206 $ 271,654
Less: Income taxes(ii) 93,499 93,522 95,079
HDFS operating income after tax (Non-GAAP) $ 173,640 $ 173,684 $ 176,575
(ii) Income taxes calculated using a 35% rate, to be consistent with assumptions used to determine competitor measures.
April 24, 2018 | Conference Call Slide Presentation
FORWARD-LOOKING STATEMENTS
31
The company intends that certain matters discussed in this release are "forward-looking statements" intended to qualify for the safe harbor from liability established by the Private Securities Litigation Reform Act of 1995. These forward-looking statementscan generally be identified as such because the context of the statement will include words such as the company "believes," "anticipates," "expects," "plans," or "estimates" or words of similar meaning. Similarly, statements that describe future plans,objectives, outlooks, targets, guidance or goals are also forward-looking statements. Such forward-looking statements are subject to certain risks and uncertainties that could cause actual results to differ materially, unfavorably or favorably, from thoseanticipated as of the date of this release. Certain of such risks and uncertainties are described below. Shareholders, potentialinvestors, and other readers are urged to consider these factors in evaluating the forward-looking statements and cautioned not to place undue reliance on such forward-looking statements. The forward-looking statements included in this release are only made as of the date of this release, and the company disclaims any obligation to publicly update such forward-looking statementsto reflect subsequent events or circumstances.
The company's ability to meet the targets and expectations noted depends upon, among other factors, the company's ability to (i) develop and execute its business strategy, (ii) execute its strategy of growing ridership, globally, (iii) effectively execute its manufacturing optimization initiative within expected costs and timing, (iv) develop and introduce products, services and experiences that are successful in the marketplace, (v) manage the impact that new or adjusted tariffs may have on the cost of raw materials and components and our ability to sell product internationally, (vi) manage the impact that prices for and supply of used motorcycles may have on its business, including on retail sales of new motorcycles, (vii) balance production volumes for its new motorcycles with consumer demand, including in circumstances where competitors may be supplying new motorcycles to the market in excess of demand at reduced prices, (viii) manage through changes in general economic and business conditions, including changing capital, credit and retail markets, and the changing political environment, (ix) manage risks that arise through expanding international manufacturing, operations and sales, (x) successfully execute the company’s manufacturing strategy, including its flexible production strategy, (xi) prevent and detect any issues with its motorcycles or any associated manufacturing processes to avoid delays in new model launches, recall campaigns, regulatory agency investigations, increased warranty costs orlitigation and adverse effects on its reputation and brand strength, and carry out any product programs or recalls within expected costs and timing,
Cont.
April 24, 2018 | Conference Call Slide Presentation
FORWARD-LOOKING STATEMENTS
32
(xii) continue to manage the relationships and agreements that the company has with its labor unions to help drive long-term competitiveness, (xiii) accurately estimate and adjust to fluctuations in foreign currency exchange rates, interest rates andcommodity prices, (xiv) manage the credit quality, the loan servicing and collection activities, and the recovery rates of HDFS' loan portfolio, (xv) retain and attract talented employees, (xvi) prevent a cybersecurity breach involving consumer, employee, dealer, supplier, or company data and respond to evolving regulatory requirements regarding data security, (xvii) continue to develop the capabilities of its distributors and dealers and manage the risks that its independent dealers may have difficulty obtaining capital and managing through changing economic conditions and consumer demand, (xviii) adjust to tax reform, healthcare inflation andreform and pension reform, and successfully estimate the impact of any such reform on the company’s business, (xix) manage through the effects inconsistent and unpredictable weather patterns may have on retail sales of motorcycles, (xx) manage supply chain issues, including quality issues and any unexpected interruptions or price increases caused by raw material shortages or natural disasters, (xxi) implement and manage enterprise-wide information technology systems, including systems at its manufacturing facilities, (xxii) manage changes and prepare for requirements in legislative and regulatory environments for its products, services and operations, (xxiii) manage its exposure to product liability claims and commercial or contractual disputes, and (xxiv) successfully access the capital and/or credit markets on terms (including interest rates) that are acceptable to the company and within its expectations.
In addition, the company could experience delays or disruptions in its operations as a result of work stoppages, strikes, natural causes, terrorism or other factors. Other factors are described in risk factors that the company has disclosed in documents previously filed with the Securities and Exchange Commission.
The company's ability to sell its motorcycles and related products and services and to meet its financial expectations also depends on the ability of the company's independent dealers to sell its motorcycles and related products and services to retail customers. The company depends on the capability and financial capacity of its independent dealers and distributors to develop and implement effective retail sales plans to create demand for the motorcycles and related products and services they purchase fromthe company. In addition, the company's independent dealers and distributors may experience difficulties in operating their businesses and selling Harley-Davidson motorcycles and related products and services as a result of weather, economic conditions or other factors.