HARLEY-DAVIDSON, INC. 2018 FOURTH QUARTER UPDATE
32
January 29, 2019 | Conference Call Slide Presentation HARLEY-DAVIDSON, INC. 2018 FOURTH QUARTER UPDATE JANUARY 29, 2019
Transcript of HARLEY-DAVIDSON, INC. 2018 FOURTH QUARTER UPDATE
January 29, 2019 | Conference Call Slide Presentation
HARLEY-DAVIDSON, INC.
2018 FOURTH QUARTER UPDATE
JANUARY 29, 2019
January 29, 2019 | Conference Call Slide Presentation
2018 FOURTH QUARTER UPDATE
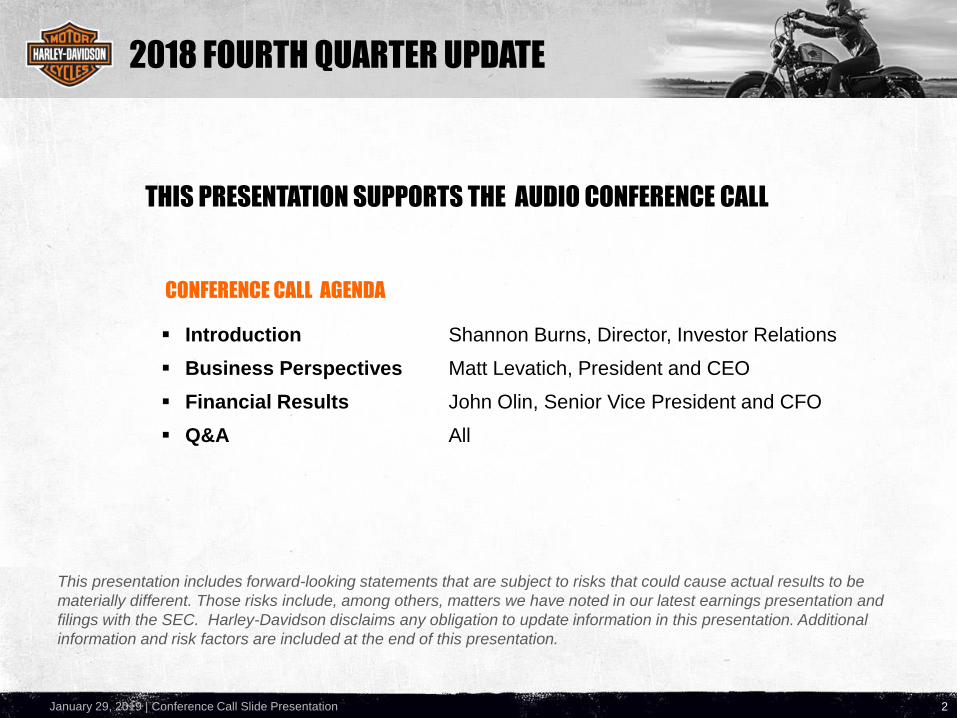
▪ Introduction Shannon Burns, Director, Investor Relations
▪ Business Perspectives Matt Levatich, President and CEO
▪ Financial Results John Olin, Senior Vice President and CFO
▪ Q&A All
CONFERENCE CALL AGENDA
2
This presentation includes forward-looking statements that are subject to risks that could cause actual results to be
materially different. Those risks include, among others, matters we have noted in our latest earnings presentation and
filings with the SEC. Harley-Davidson disclaims any obligation to update information in this presentation. Additional
information and risk factors are included at the end of this presentation.
THIS PRESENTATION SUPPORTS THE AUDIO CONFERENCE CALL
January 29, 2019 | Conference Call Slide Presentation
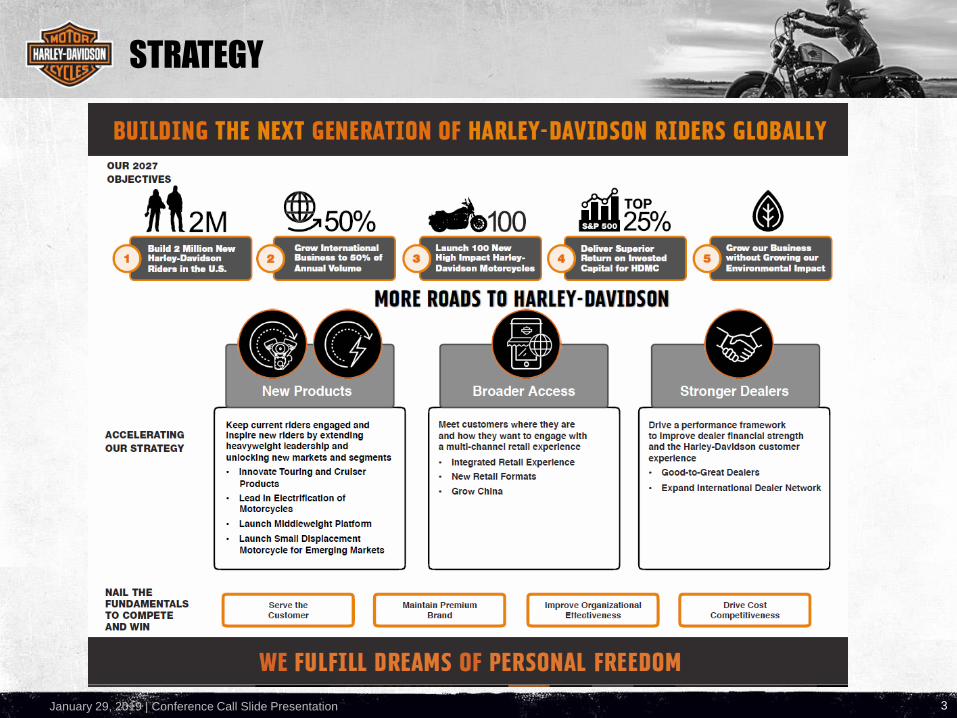
STRATEGY
3

January 29, 2019 | Conference Call Slide Presentation
BUSINESS PERSPECTIVESMATT LEVATICH, PRESIDENT & CEO, HARLEY-DAVIDSON, INC.
January 29, 2019 | Conference Call Slide Presentation
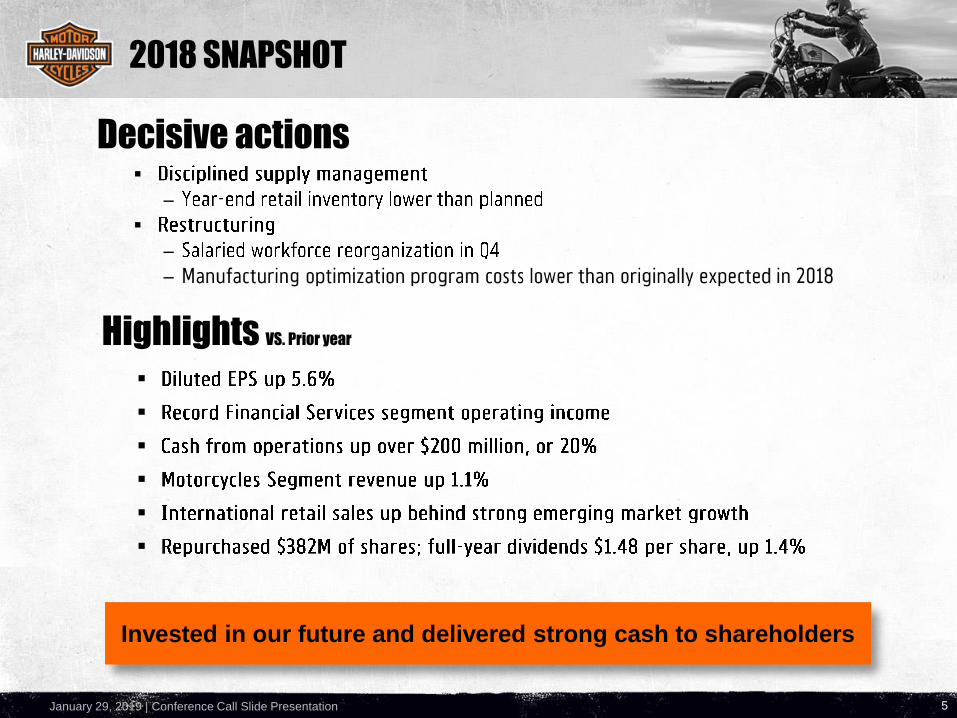
2018 SNAPSHOT
5
Decisive actions
Invested in our future and delivered strong cash to shareholders
▪
–
▪
–
–
Highlights VS. Prior year
▪
▪
▪
▪
▪
▪
January 29, 2019 | Conference Call Slide Presentation
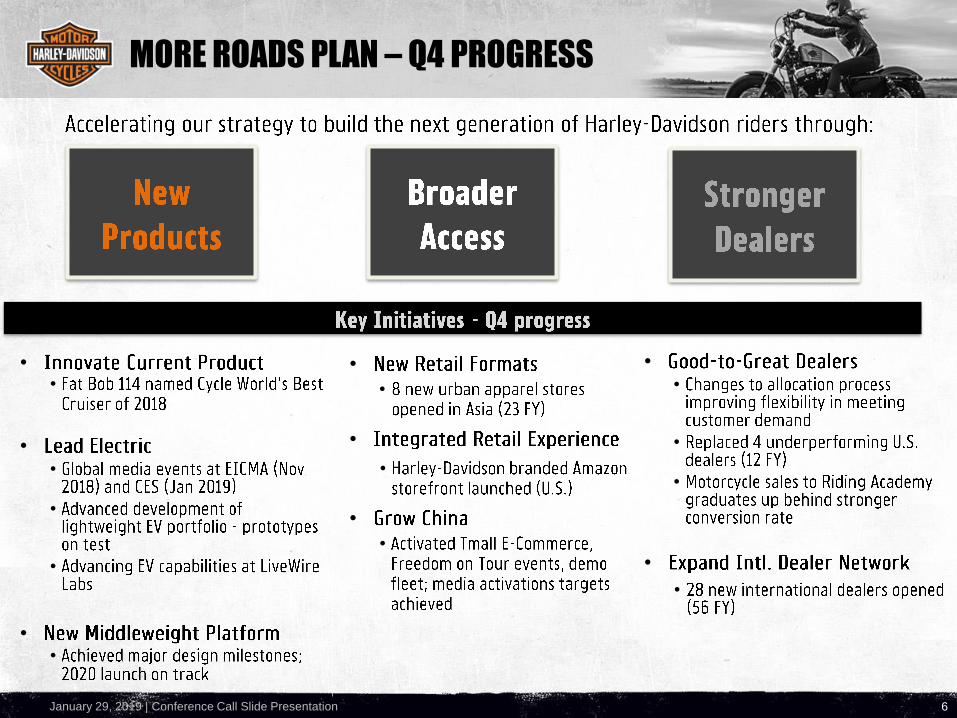
MORE ROADS PLAN – Q4 PROGRESS
6
••
••
•
•
••
••
•
•
••
••
•
•
•
•
January 29, 2019 | Conference Call Slide Presentation
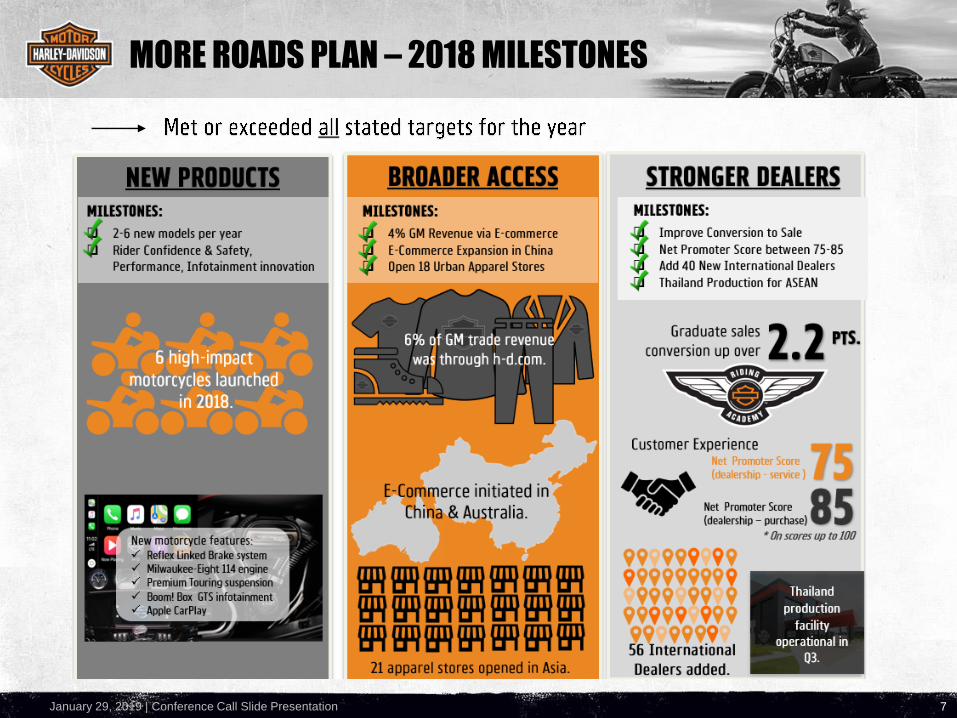
MORE ROADS PLAN – 2018 MILESTONES
7
January 29, 2019 | Conference Call Slide Presentation
2018 RIDERSHIP
8
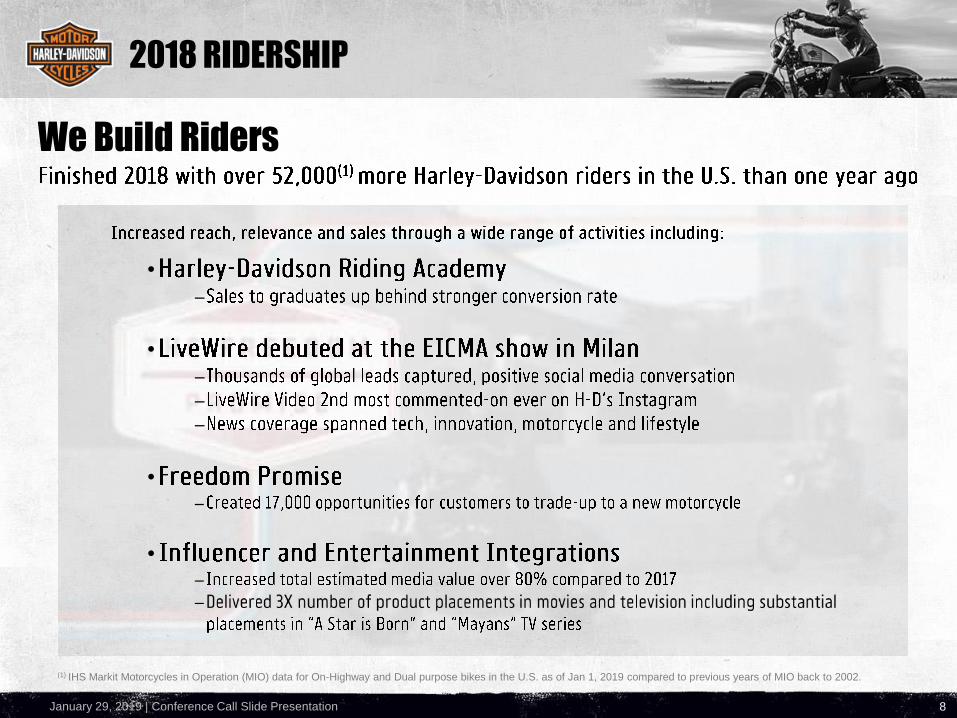
We Build Riders
(1) IHS Markit Motorcycles in Operation (MIO) data for On-Highway and Dual purpose bikes in the U.S. as of Jan 1, 2019 compared to previous years of MIO back to 2002.
•–
•–
–
–
•–
•–
–

January 29, 2019 | Conference Call Slide Presentation
FINANCIAL RESULTSJOHN OLIN, SENIOR VICE PRESIDENT & CFO, HARLEY-DAVIDSON, INC.
January 29, 2019 | Conference Call Slide Presentation
Q4 2018 VS. Q4 2017 RESULTS
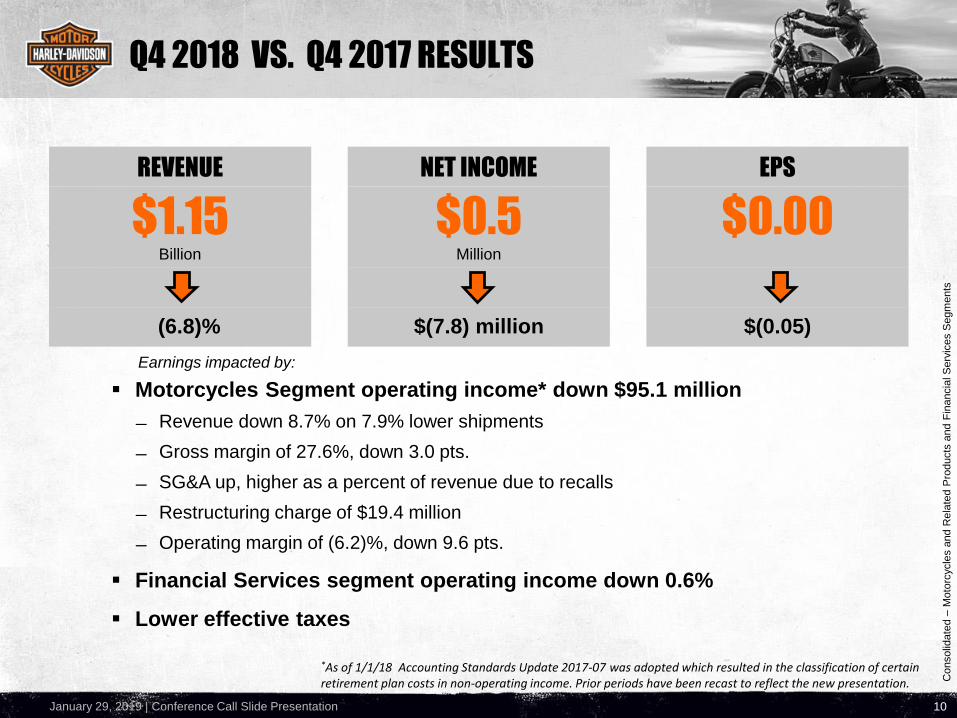
▪ Motorcycles Segment operating income* down $95.1 million
Revenue down 8.7% on 7.9% lower shipments
Gross margin of 27.6%, down 3.0 pts.
SG&A up, higher as a percent of revenue due to recalls
Restructuring charge of $19.4 million
Operating margin of (6.2)%, down 9.6 pts.
▪ Financial Services segment operating income down 0.6%
▪ Lower effective taxes
Earnings impacted by:
10
Consolid
ate
d –
Moto
rcycle
s a
nd R
ela
ted P
roducts
and F
inancia
l S
erv
ices S
egm
ents
REVENUE NET INCOME EPS
$1.15 $0.5 $0.00Billion Million
(6.8)% $(7.8) million $(0.05)
*As of 1/1/18 Accounting Standards Update 2017-07 was adopted which resulted in the classification of certain retirement plan costs in non-operating income. Prior periods have been recast to reflect the new presentation.
January 29, 2019 | Conference Call Slide Presentation
WORLDWIDE RETAIL SALES
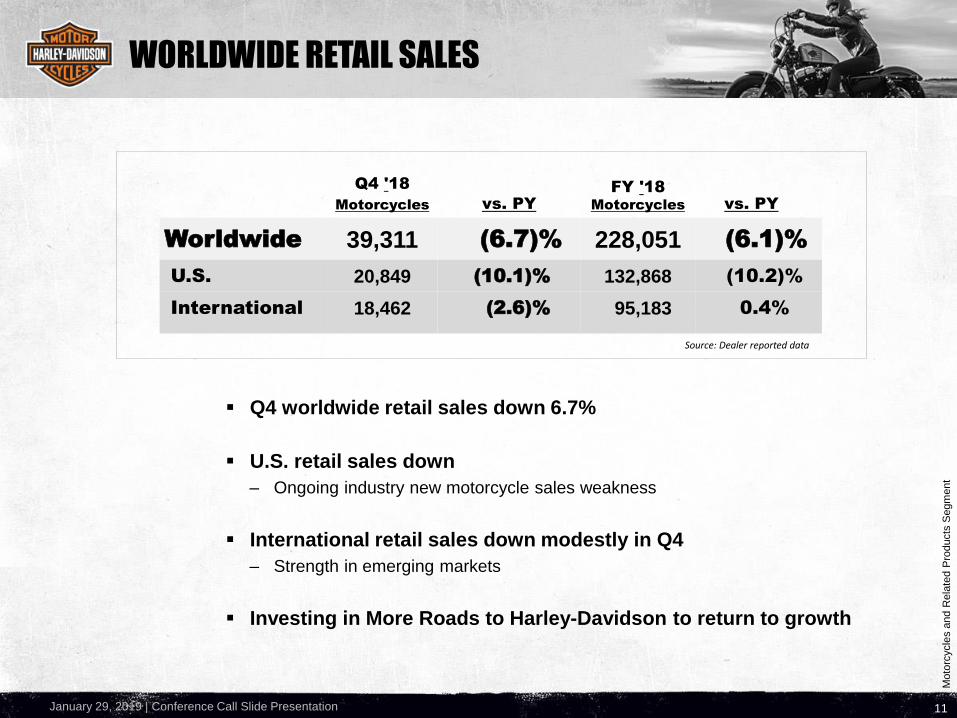
▪ Q4 worldwide retail sales down 6.7%
▪ U.S. retail sales down
– Ongoing industry new motorcycle sales weakness
▪ International retail sales down modestly in Q4
– Strength in emerging markets
▪ Investing in More Roads to Harley-Davidson to return to growth
11
Moto
rcycle
s a
nd R
ela
ted P
roducts
Segm
ent
Source: Dealer reported data
Q4 '18
Motorcycles vs. PY
FY '18
Motorcycles vs. PY
Worldwide 39,311 (6.7)% 228,051 (6.1)%
U.S. 20,849 (10.1)% 132,868 (10.2)%
International 18,462 (2.6)% 95,183 0.4%
January 29, 2019 | Conference Call Slide Presentation
U.S. RETAIL SALES
12
H-D U.S. NEW 601+CC RETAIL MARKET SHARE*H-D U.S. NEW RETAIL MOTORCYCLE SALES
RET
AIL
SA
LES
SH
AR
EIN
VEN
TO
RY
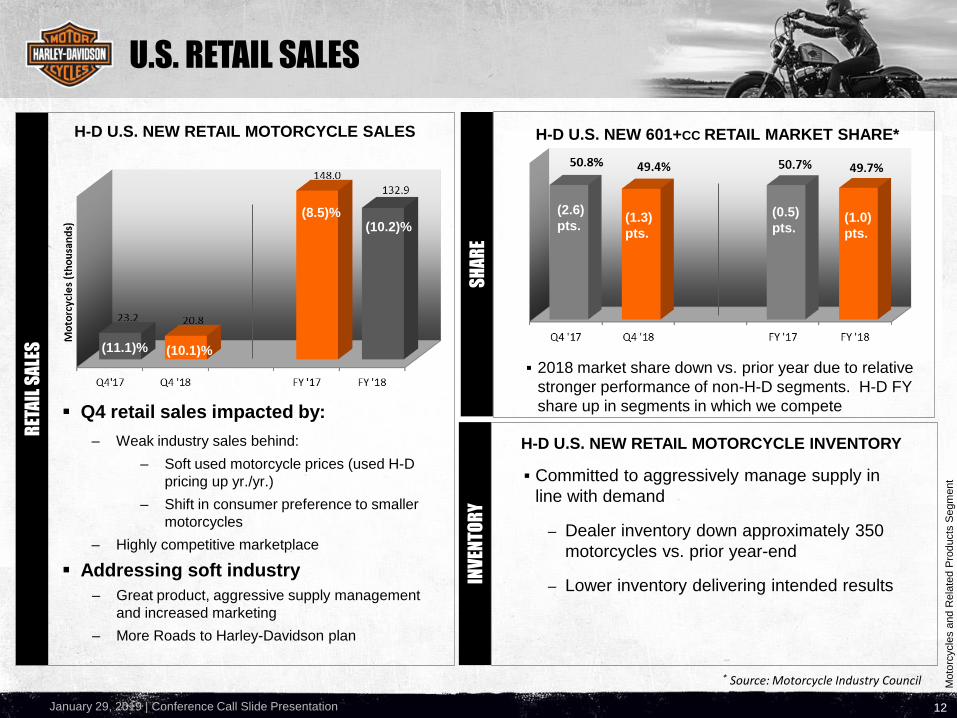
▪ Q4 retail sales impacted by:
– Weak industry sales behind:
– Soft used motorcycle prices (used H-D
pricing up yr./yr.)
– Shift in consumer preference to smaller
motorcycles
– Highly competitive marketplace
▪ Addressing soft industry
– Great product, aggressive supply management
and increased marketing
– More Roads to Harley-Davidson plan
▪ 2018 market share down vs. prior year due to relative
stronger performance of non-H-D segments. H-D FY
share up in segments in which we compete
▪ Committed to aggressively manage supply in
line with demand
– Dealer inventory down approximately 350
motorcycles vs. prior year-end
– Lower inventory delivering intended results
H-D U.S. NEW RETAIL MOTORCYCLE INVENTORY
Moto
rcycle
s a
nd R
ela
ted P
roducts
Segm
ent
* Source: Motorcycle Industry Council
(1.3)
pts.
(1.0)
pts.
(0.5)
pts.
(2.6)
pts.(10.2)%
(10.1)%
(8.5)%
(11.1)%
January 29, 2019 | Conference Call Slide Presentation
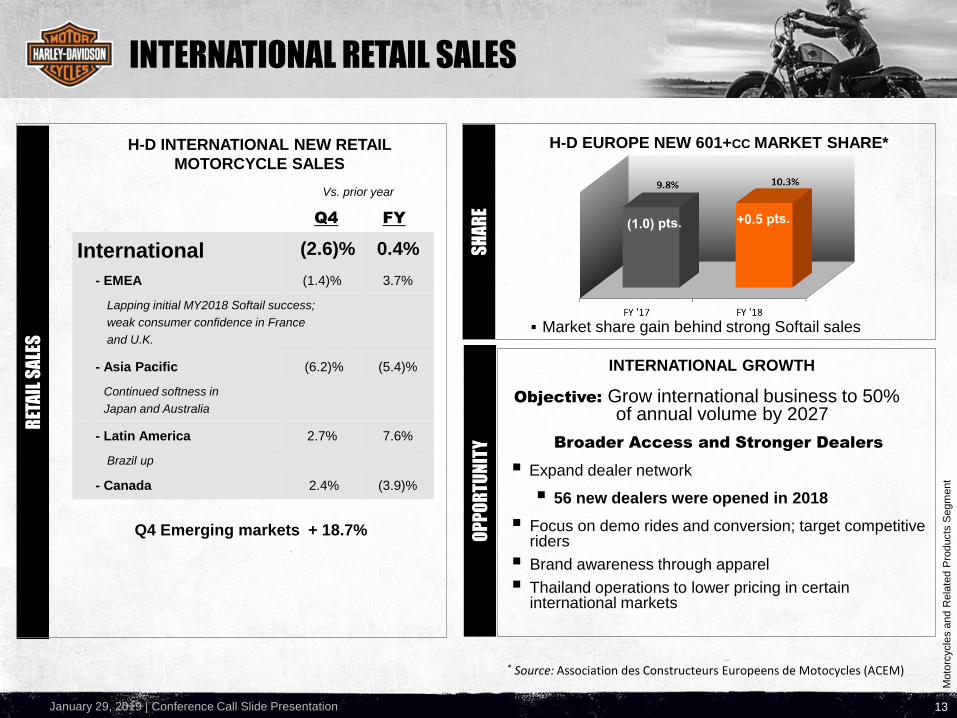
Broader Access and Stronger Dealers
▪ Expand dealer network
▪ 56 new dealers were opened in 2018
▪ Focus on demo rides and conversion; target competitive riders
▪ Brand awareness through apparel
▪ Thailand operations to lower pricing in certain international markets
INTERNATIONAL RETAIL SALES
13
INTERNATIONAL GROWTH
H-D EUROPE NEW 601+CC MARKET SHARE*
RET
AIL
SA
LES
OP
PO
RT
UN
ITY
SH
AR
E
Moto
rcycle
s a
nd R
ela
ted P
roducts
Segm
ent
H-D INTERNATIONAL NEW RETAIL
MOTORCYCLE SALES
* Source: Association des Constructeurs Europeens de Motocycles (ACEM)
Objective: Grow international business to 50% of annual volume by 2027
▪ Market share gain behind strong Softail sales
Vs. prior year
Q4 FY
International (2.6)% 0.4%
- EMEA (1.4)% 3.7%
Lapping initial MY2018 Softail success;
weak consumer confidence in France
and U.K.
- Asia Pacific (6.2)% (5.4)%
Continued softness in
Japan and Australia
- Latin America 2.7% 7.6%
Brazil up
- Canada 2.4% (3.9)%
Q4 Emerging markets + 18.7%
January 29, 2019 | Conference Call Slide Presentation
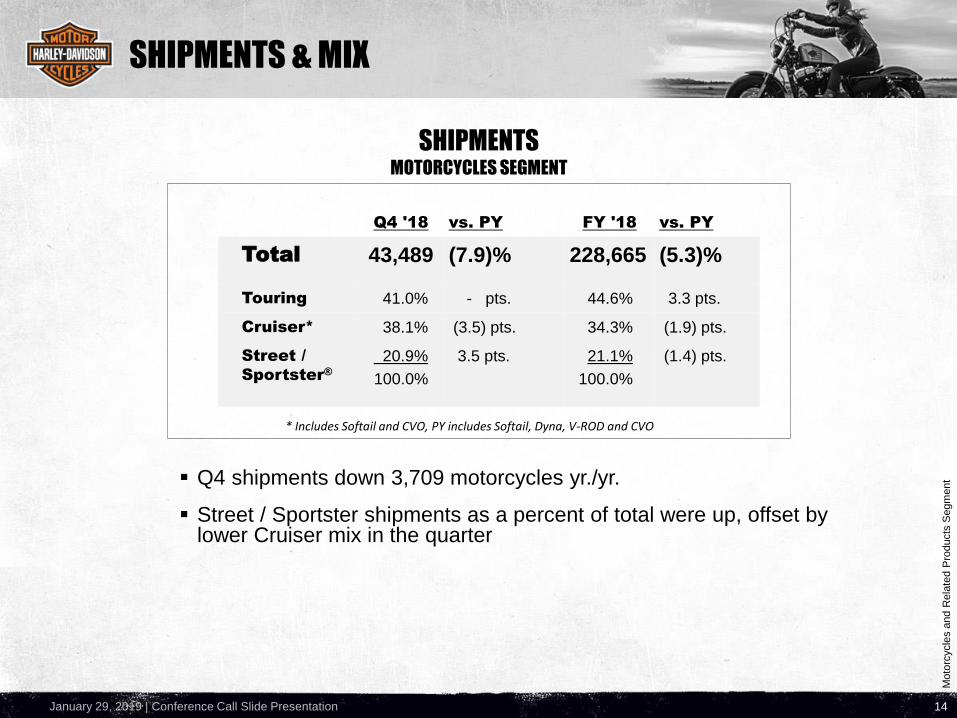
Q4 '18 vs. PY FY '18 vs. PY
Total 43,489 (7.9)% 228,665 (5.3)%
Touring 41.0% - pts. 44.6% 3.3 pts.
Cruiser* 38.1% (3.5) pts. 34.3% (1.9) pts.
Street /
Sportster®
20.9%
100.0%
3.5 pts. 21.1%
100.0%
(1.4) pts.
SHIPMENTS & MIX
▪ Q4 shipments down 3,709 motorcycles yr./yr.
▪ Street / Sportster shipments as a percent of total were up, offset by lower Cruiser mix in the quarter
SHIPMENTS MOTORCYCLES SEGMENT
14
Moto
rcycle
s a
nd R
ela
ted P
roducts
Segm
ent
* Includes Softail and CVO, PY includes Softail, Dyna, V-ROD and CVO
January 29, 2019 | Conference Call Slide Presentation
REVENUE
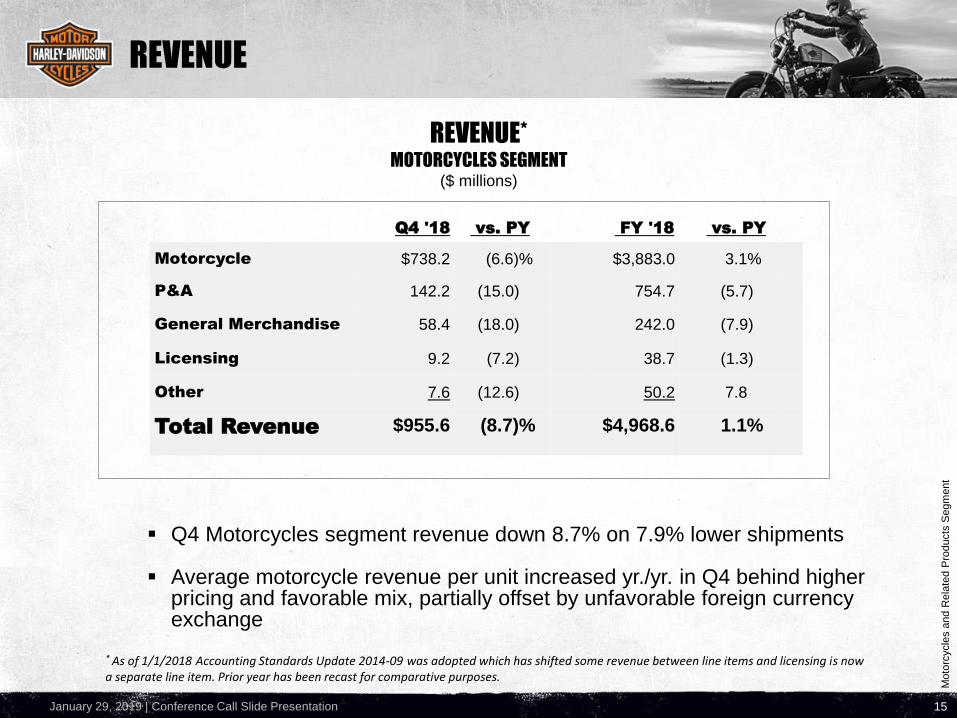
▪ Q4 Motorcycles segment revenue down 8.7% on 7.9% lower shipments
▪ Average motorcycle revenue per unit increased yr./yr. in Q4 behind higher pricing and favorable mix, partially offset by unfavorable foreign currency exchange
REVENUE*MOTORCYCLES SEGMENT
($ millions)
15
Q4 '18 vs. PY FY '18 vs. PY
Motorcycle $738.2 (6.6)% $3,883.0 3.1%
P&A 142.2 (15.0) 754.7 (5.7)
General Merchandise 58.4 (18.0) 242.0 (7.9)
Licensing 9.2 (7.2) 38.7 (1.3)
Other 7.6 (12.6) 50.2 7.8
Total Revenue $955.6 (8.7)% $4,968.6 1.1%
Moto
rcycle
s a
nd R
ela
ted P
roducts
Segm
ent
* As of 1/1/2018 Accounting Standards Update 2014-09 was adopted which has shifted some revenue between line items and licensing is now a separate line item. Prior year has been recast for comparative purposes.
January 29, 2019 | Conference Call Slide Presentation
GROSS MARGIN
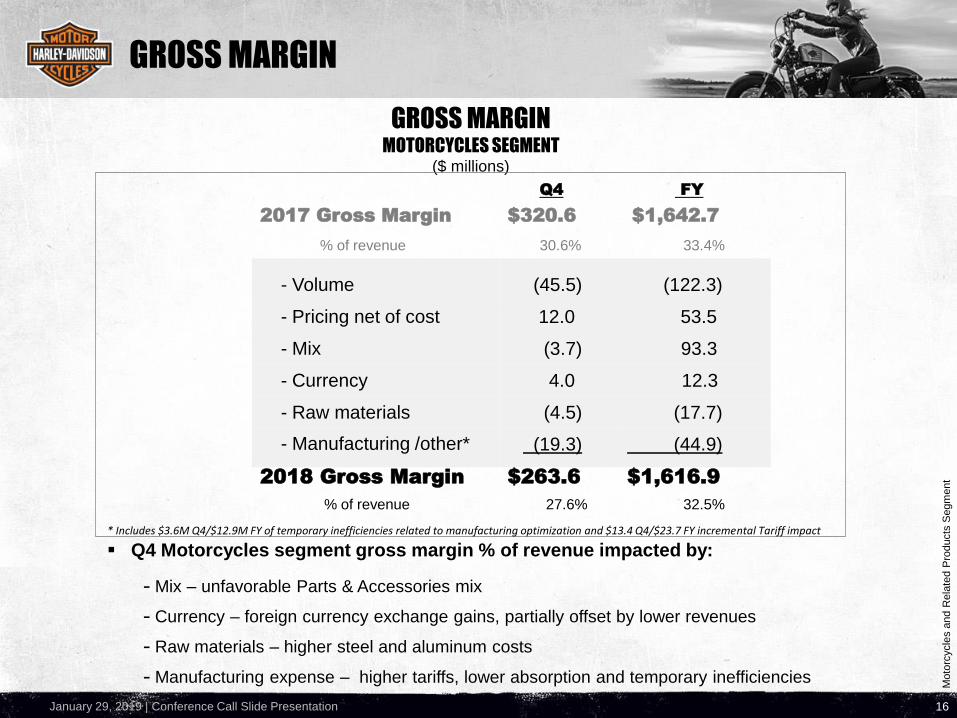
Q4 FY
2017 Gross Margin $320.6 $1,642.7
% of revenue 30.6% 33.4%
- Volume (45.5) (122.3)
- Pricing net of cost 12.0 53.5
- Mix (3.7) 93.3
- Currency 4.0 12.3
- Raw materials (4.5) (17.7)
- Manufacturing /other* (19.3) (44.9)
2018 Gross Margin $263.6 $1,616.9
% of revenue 27.6% 32.5%
GROSS MARGINMOTORCYCLES SEGMENT
($ millions)
16
▪ Q4 Motorcycles segment gross margin % of revenue impacted by:
- Mix – unfavorable Parts & Accessories mix
- Currency – foreign currency exchange gains, partially offset by lower revenues
- Raw materials – higher steel and aluminum costs
- Manufacturing expense – higher tariffs, lower absorption and temporary inefficiencies
Moto
rcycle
s a
nd R
ela
ted P
roducts
Segm
ent
* Includes $3.6M Q4/$12.9M FY of temporary inefficiencies related to manufacturing optimization and $13.4 Q4/$23.7 FY incremental Tariff impact
January 29, 2019 | Conference Call Slide Presentation
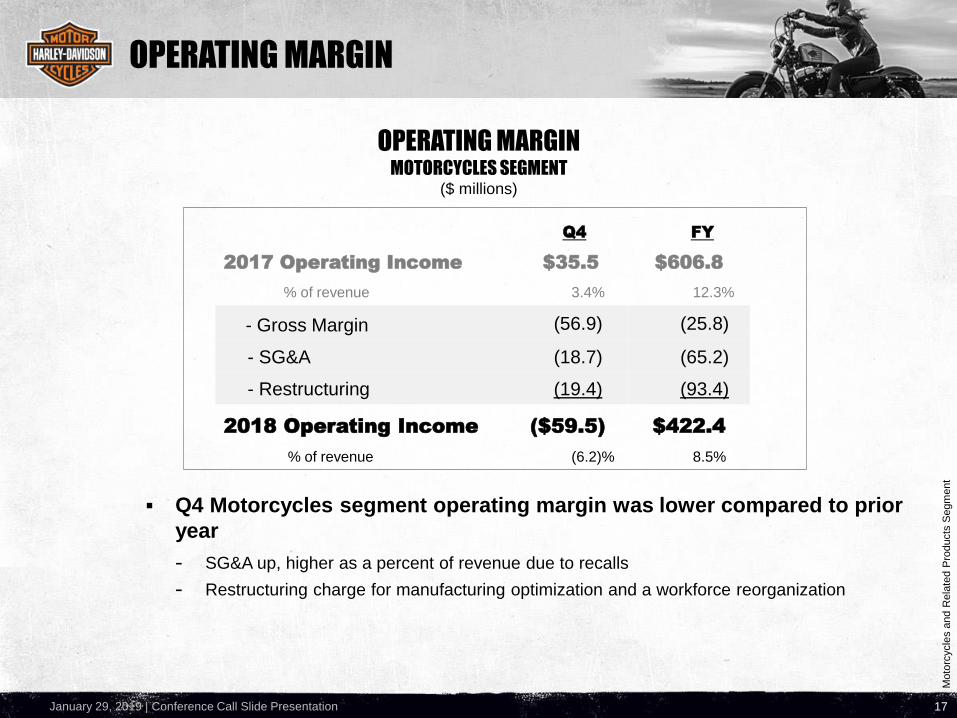
OPERATING MARGIN
Q4 FY
2017 Operating Income $35.5 $606.8
% of revenue 3.4% 12.3%
- Gross Margin (56.9) (25.8)
- SG&A (18.7) (65.2)
- Restructuring (19.4) (93.4)
2018 Operating Income ($59.5) $422.4
% of revenue (6.2)% 8.5%
OPERATING MARGINMOTORCYCLES SEGMENT
($ millions)
17
▪ Q4 Motorcycles segment operating margin was lower compared to prior
year
- SG&A up, higher as a percent of revenue due to recalls
- Restructuring charge for manufacturing optimization and a workforce reorganization
Moto
rcycle
s a
nd R
ela
ted P
roducts
Segm
ent
January 29, 2019 | Conference Call Slide Presentation
Fin
ancia
l S
erv
ices S
egm
ent
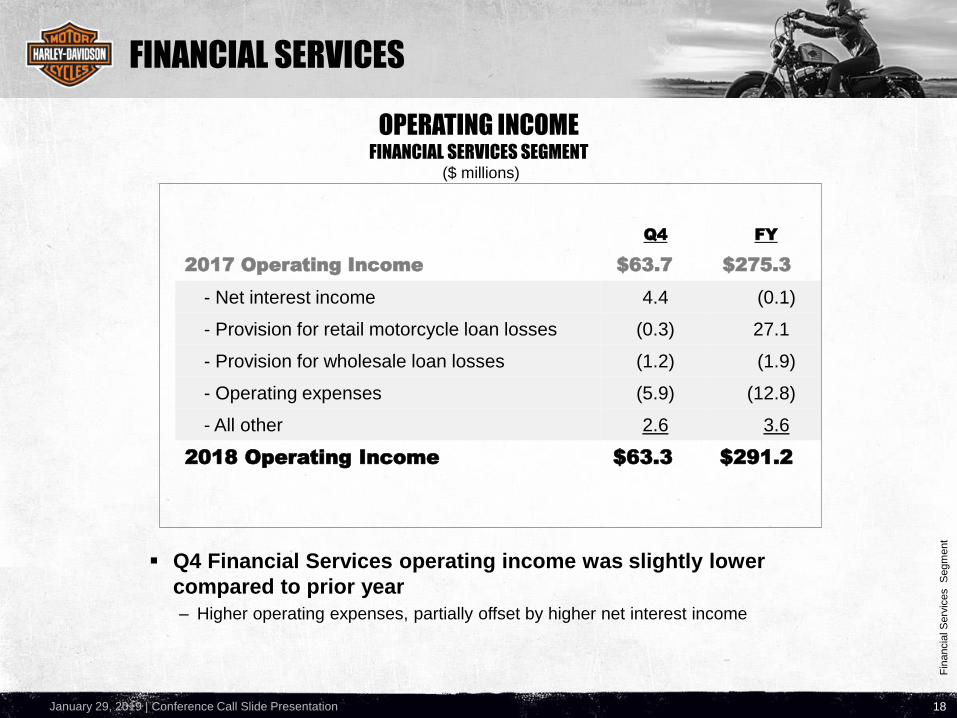
FINANCIAL SERVICES
▪ Q4 Financial Services operating income was slightly lower
compared to prior year
– Higher operating expenses, partially offset by higher net interest income
OPERATING INCOMEFINANCIAL SERVICES SEGMENT
($ millions)
Q4 FY
2017 Operating Income $63.7 $275.3
- Net interest income 4.4 (0.1)
- Provision for retail motorcycle loan losses (0.3) 27.1
- Provision for wholesale loan losses (1.2) (1.9)
- Operating expenses (5.9) (12.8)
- All other 2.6 3.6
2018 Operating Income $63.3 $291.2
18
January 29, 2019 | Conference Call Slide Presentation
Fin
ancia
l S
erv
ices S
egm
ent
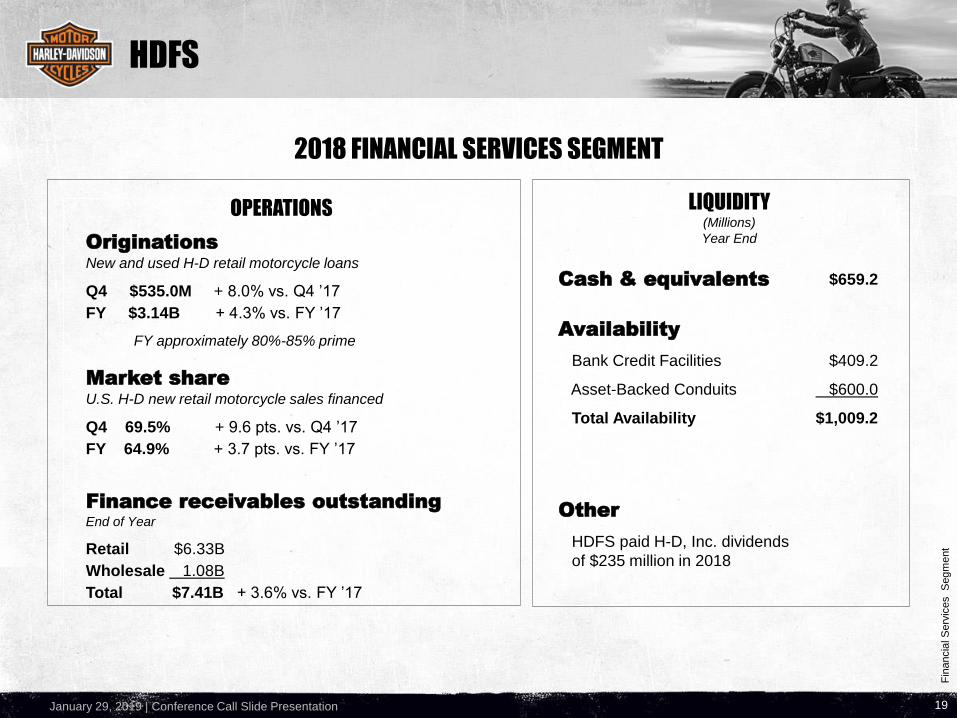
HDFS
2018 FINANCIAL SERVICES SEGMENT
LIQUIDITY(Millions)
Year End
Cash & equivalents $659.2
Availability
Bank Credit Facilities $409.2
Asset-Backed Conduits $600.0
Total Availability $1,009.2
Other
HDFS paid H-D, Inc. dividends
of $235 million in 2018
OPERATIONS
Originations
New and used H-D retail motorcycle loans
Q4 $535.0M + 8.0% vs. Q4 ’17
FY $3.14B + 4.3% vs. FY ’17
FY approximately 80%-85% prime
Market share
U.S. H-D new retail motorcycle sales financed
Q4 69.5% + 9.6 pts. vs. Q4 ’17
FY 64.9% + 3.7 pts. vs. FY ’17
Finance receivables outstanding
End of Year
Retail $6.33B
Wholesale 1.08B
Total $7.41B + 3.6% vs. FY ’17
19
January 29, 2019 | Conference Call Slide Presentation
HDFS
20
Fin
ancia
l S
erv
ices S
egm
ent
20
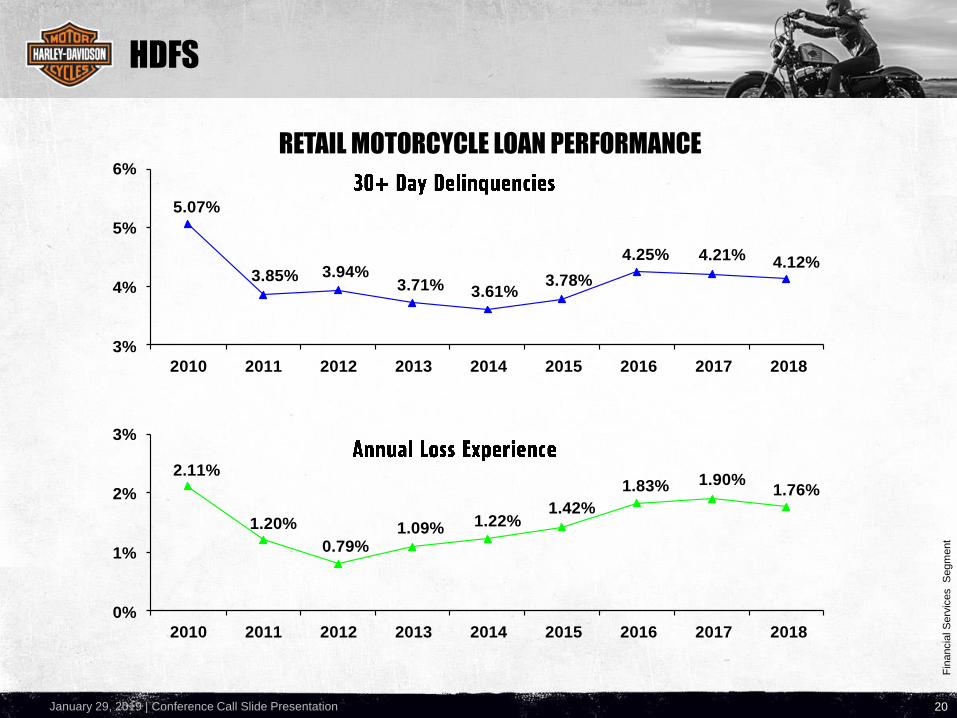
RETAIL MOTORCYCLE LOAN PERFORMANCE
2.11%
1.20%
0.79%1.09% 1.22%
1.42%
1.83% 1.90%1.76%
0%
1%
2%
3%
2010 2011 2012 2013 2014 2015 2016 2017 2018
5.07%
3.85% 3.94%3.71% 3.61%
3.78%
4.25% 4.21% 4.12%
3%
4%
5%
6%
2010 2011 2012 2013 2014 2015 2016 2017 2018
January 29, 2019 | Conference Call Slide Presentation
Consolid
ate
d –
Moto
rcycle
s a
nd R
ela
ted P
roducts
and F
inancia
l S
erv
ices S
egm
ents
HARLEY-DAVIDSON, INC.
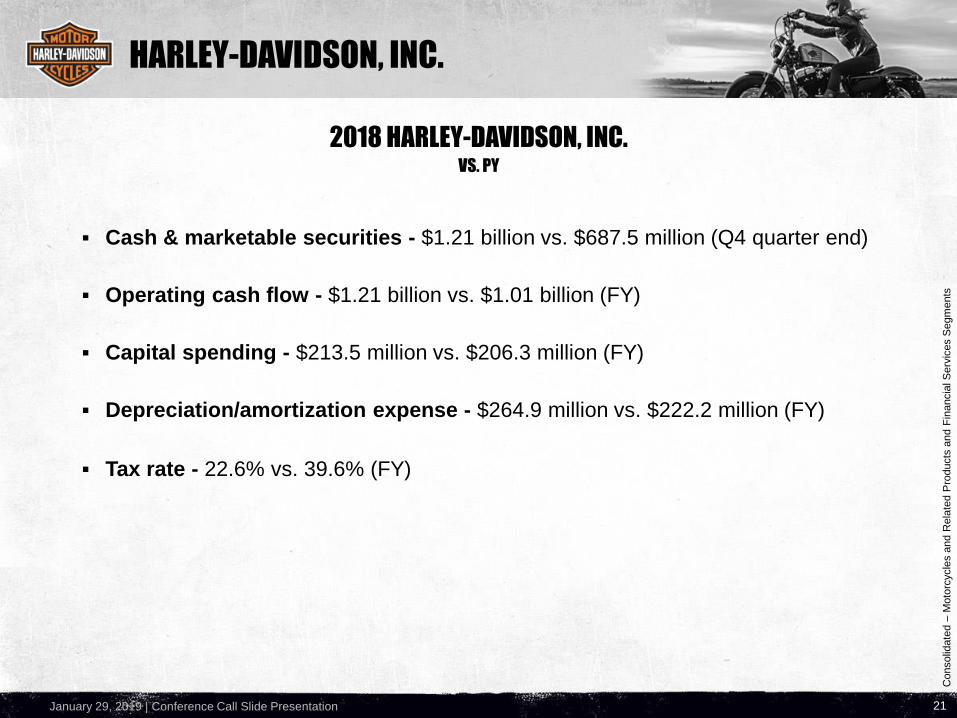
▪ Cash & marketable securities - $1.21 billion vs. $687.5 million (Q4 quarter end)
▪ Operating cash flow - $1.21 billion vs. $1.01 billion (FY)
▪ Capital spending - $213.5 million vs. $206.3 million (FY)
▪ Depreciation/amortization expense - $264.9 million vs. $222.2 million (FY)
▪ Tax rate - 22.6% vs. 39.6% (FY)
2018 HARLEY-DAVIDSON, INC.VS. PY
21
January 29, 2019 | Conference Call Slide Presentation
FY 2018 VS. FY 2017 RESULTS
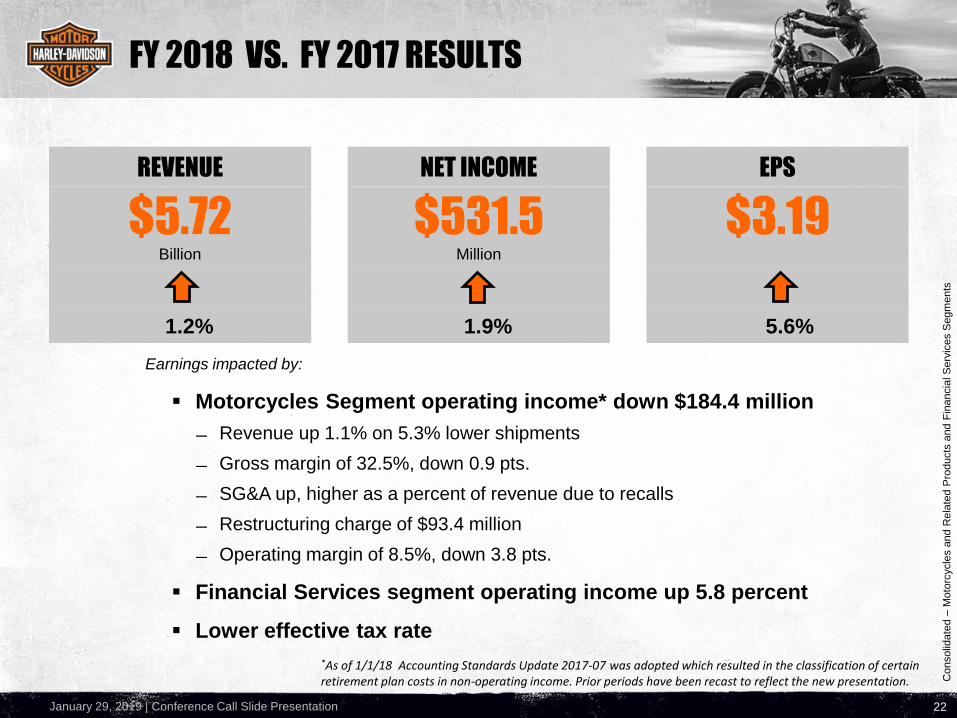
▪ Motorcycles Segment operating income* down $184.4 million
Revenue up 1.1% on 5.3% lower shipments
Gross margin of 32.5%, down 0.9 pts.
SG&A up, higher as a percent of revenue due to recalls
Restructuring charge of $93.4 million
Operating margin of 8.5%, down 3.8 pts.
▪ Financial Services segment operating income up 5.8 percent
▪ Lower effective tax rate
Earnings impacted by:
22
Consolid
ate
d –
Moto
rcycle
s a
nd R
ela
ted P
roducts
and F
inancia
l S
erv
ices S
egm
ents
REVENUE NET INCOME EPS
$5.72 $531.5 $3.19Billion Million
1.2% 1.9% 5.6%
*As of 1/1/18 Accounting Standards Update 2017-07 was adopted which resulted in the classification of certain retirement plan costs in non-operating income. Prior periods have been recast to reflect the new presentation.
January 29, 2019 | Conference Call Slide Presentation 23
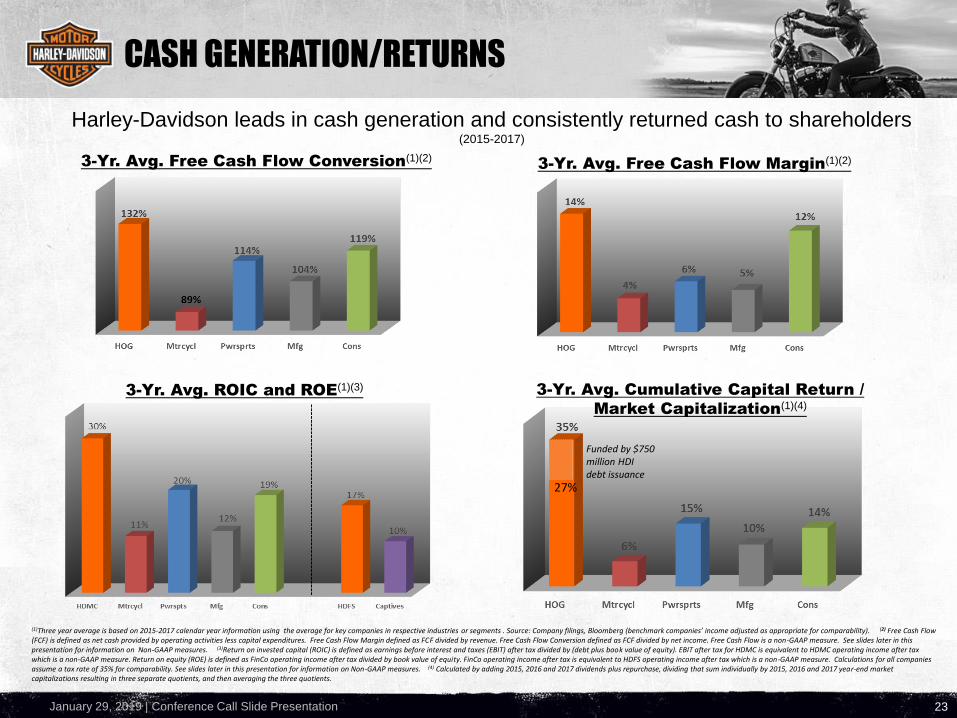
CASH GENERATION/RETURNS
Harley-Davidson leads in cash generation and consistently returned cash to shareholders (2015-2017)
3-Yr. Avg. Free Cash Flow Conversion(1)(2)
3-Yr. Avg. Free Cash Flow Margin(1)(2)
3-Yr. Avg. Cumulative Capital Return /
Market Capitalization(1)(4)
27%
Funded by $750 million HDI debt issuance
3-Yr. Avg. ROIC and ROE(1)(3)
(1)Three year average is based on 2015-2017 calendar year information using the average for key companies in respective industries or segments . Source: Company filings, Bloomberg (benchmark companies’ income adjusted as appropriate for comparability). (2) Free Cash Flow (FCF) is defined as net cash provided by operating activities less capital expenditures. Free Cash Flow Margin defined as FCF divided by revenue. Free Cash Flow Conversion defined as FCF divided by net income. Free Cash Flow is a non-GAAP measure. See slides later in this presentation for information on Non-GAAP measures. (3)Return on invested capital (ROIC) is defined as earnings before interest and taxes (EBIT) after tax divided by (debt plus book value of equity). EBIT after tax for HDMC is equivalent to HDMC operating income after tax which is a non-GAAP measure. Return on equity (ROE) is defined as FinCo operating income after tax divided by book value of equity. FinCo operating income after tax is equivalent to HDFS operating income after tax which is a non-GAAP measure. Calculations for all companies assume a tax rate of 35% for comparability. See slides later in this presentation for information on Non-GAAP measures. (4) Calculated by adding 2015, 2016 and 2017 dividends plus repurchase, dividing that sum individually by 2015, 2016 and 2017 year-end market capitalizations resulting in three separate quotients, and then averaging the three quotients.
January 29, 2019 | Conference Call Slide Presentation 24
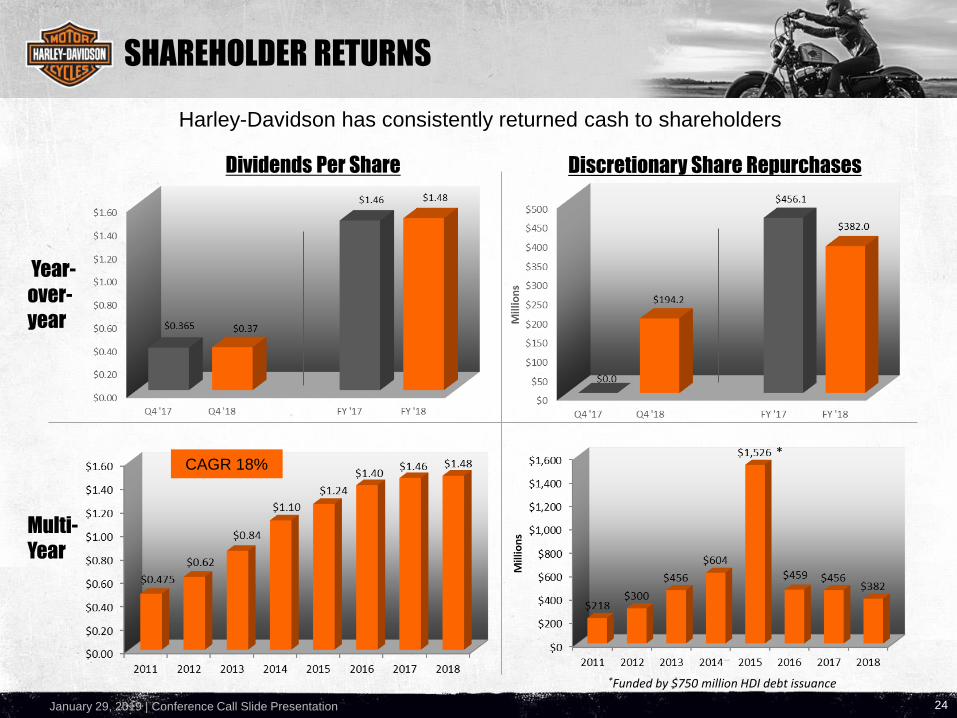
SHAREHOLDER RETURNS
Harley-Davidson has consistently returned cash to shareholders
Year-
over-
year
Discretionary Share RepurchasesDividends Per Share
Multi-
Year
*Funded by $750 million HDI debt issuance
CAGR 18%*
January 29, 2019 | Conference Call Slide Presentation 25
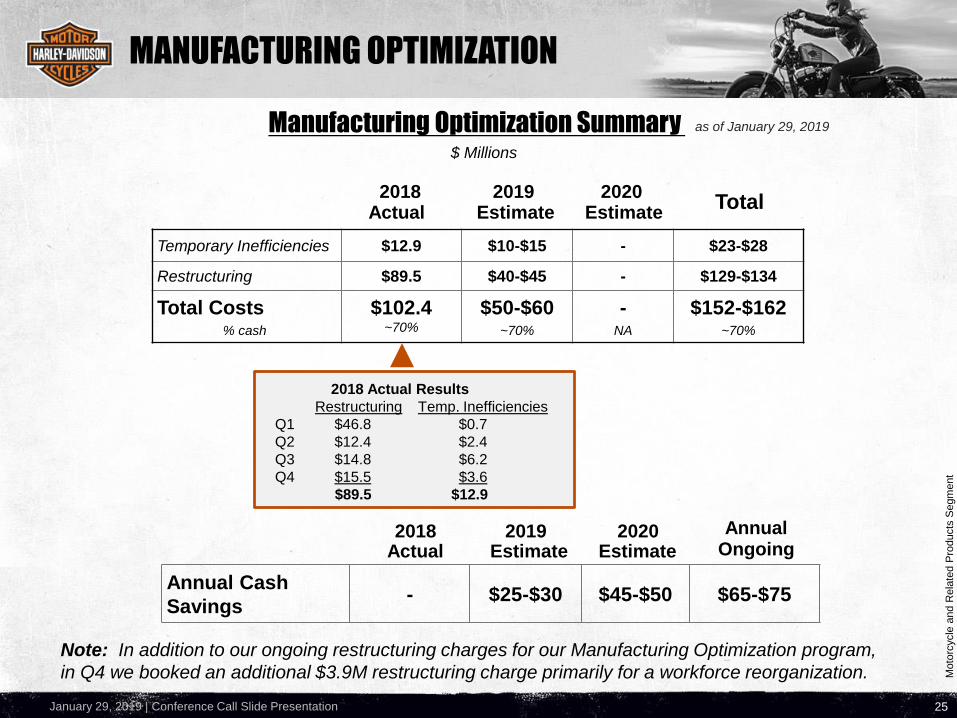
Manufacturing Optimization Summary $ Millions
Annual Cash
Savings- $25-$30 $45-$50 $65-$75
Temporary Inefficiencies $12.9 $10-$15 - $23-$28
Restructuring $89.5 $40-$45 - $129-$134
Total Costs% cash
$102.4 ~70%
$50-$60~70%
-NA
$152-$162~70%
2018 2019 2020
2018 2019 2020
Moto
rcycle
and R
ela
ted P
roducts
Segm
ent
MANUFACTURING OPTIMIZATION
2018 Actual Results
Restructuring Temp. Inefficiencies
Q1 $46.8 $0.7
Q2 $12.4 $2.4
Q3 $14.8 $6.2
Q4 $15.5 $3.6
$89.5 $12.9
as of January 29, 2019
Note: In addition to our ongoing restructuring charges for our Manufacturing Optimization program,
in Q4 we booked an additional $3.9M restructuring charge primarily for a workforce reorganization.
Actual Estimate EstimateTotal
Actual Estimate Estimate
Annual Ongoing
January 29, 2019 | Conference Call Slide Presentation
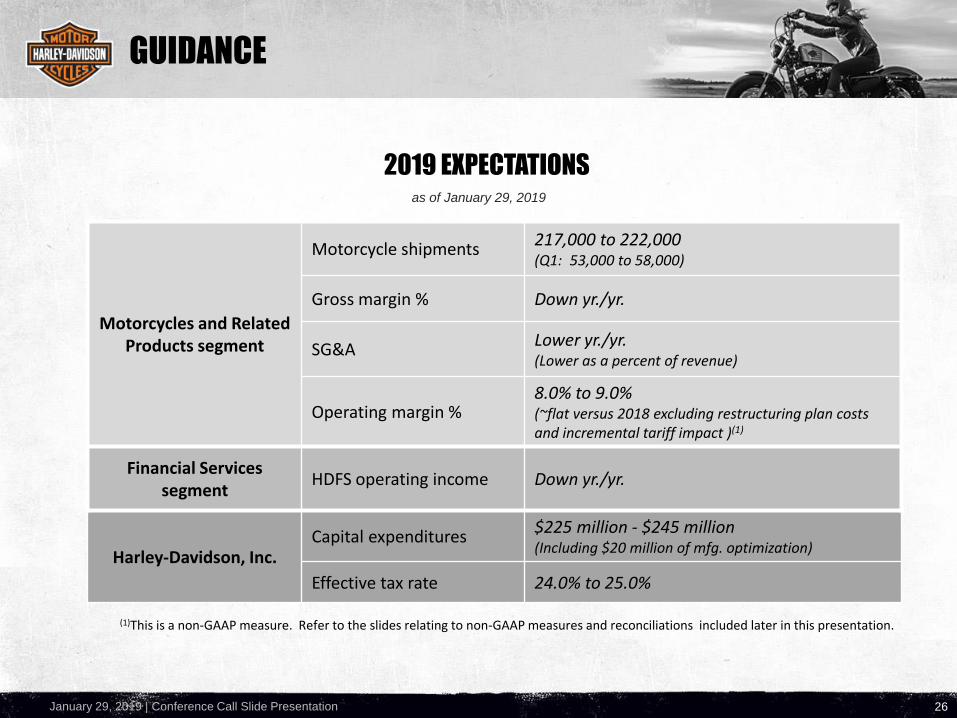
Motorcycles and RelatedProducts segment
Motorcycle shipments217,000 to 222,000(Q1: 53,000 to 58,000)
Gross margin % Down yr./yr.
SG&ALower yr./yr.(Lower as a percent of revenue)
Operating margin %8.0% to 9.0%(~flat versus 2018 excluding restructuring plan costs and incremental tariff impact )(1)
Financial Services segment
HDFS operating income Down yr./yr.
Harley-Davidson, Inc. Capital expenditures
$225 million - $245 million(Including $20 million of mfg. optimization)
Effective tax rate 24.0% to 25.0%
as of January 29, 2019
26
GUIDANCE
2019 EXPECTATIONS
(1)This is a non-GAAP measure. Refer to the slides relating to non-GAAP measures and reconciliations included later in this presentation.
January 29, 2019 | Conference Call Slide Presentation 27
Focused investments,
strong returns
to grow the company for the
long-term
HARLEY-DAVIDSON, INC.
BUILDING THE NEXT GENERATION OF HARLEY-DAVIDSON RIDERS GLOBALLY
January 29, 2019 | Conference Call Slide Presentation 28
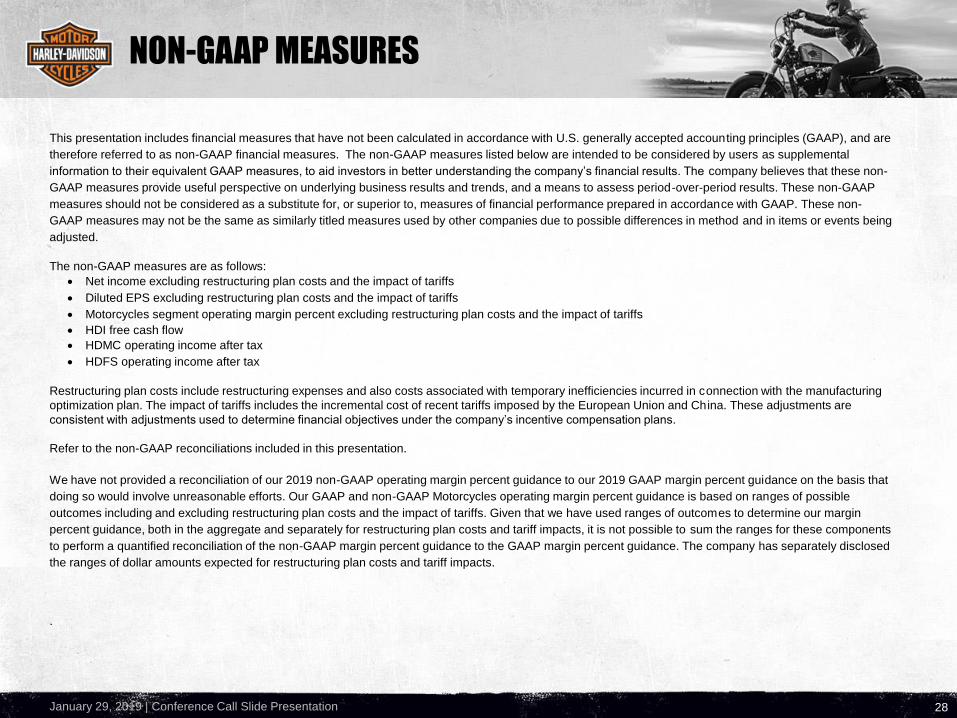
NON-GAAP MEASURES
This presentation includes financial measures that have not been calculated in accordance with U.S. generally accepted accounting principles (GAAP), and are
therefore referred to as non-GAAP financial measures. The non-GAAP measures listed below are intended to be considered by users as supplemental
information to their equivalent GAAP measures, to aid investors in better understanding the company’s financial results. The company believes that these non-
GAAP measures provide useful perspective on underlying business results and trends, and a means to assess period-over-period results. These non-GAAP
measures should not be considered as a substitute for, or superior to, measures of financial performance prepared in accordance with GAAP. These non-
GAAP measures may not be the same as similarly titled measures used by other companies due to possible differences in method and in items or events being
adjusted.
The non-GAAP measures are as follows:
• Net income excluding restructuring plan costs and the impact of tariffs
• Diluted EPS excluding restructuring plan costs and the impact of tariffs
• Motorcycles segment operating margin percent excluding restructuring plan costs and the impact of tariffs
• HDI free cash flow
• HDMC operating income after tax
• HDFS operating income after tax
Restructuring plan costs include restructuring expenses and also costs associated with temporary inefficiencies incurred in connection with the manufacturing
optimization plan. The impact of tariffs includes the incremental cost of recent tariffs imposed by the European Union and China. These adjustments are
consistent with adjustments used to determine financial objectives under the company’s incentive compensation plans.
Refer to the non-GAAP reconciliations included in this presentation.
We have not provided a reconciliation of our 2019 non-GAAP operating margin percent guidance to our 2019 GAAP margin percent guidance on the basis that
doing so would involve unreasonable efforts. Our GAAP and non-GAAP Motorcycles operating margin percent guidance is based on ranges of possible
outcomes including and excluding restructuring plan costs and the impact of tariffs. Given that we have used ranges of outcomes to determine our margin
percent guidance, both in the aggregate and separately for restructuring plan costs and tariff impacts, it is not possible to sum the ranges for these components
to perform a quantified reconciliation of the non-GAAP margin percent guidance to the GAAP margin percent guidance. The company has separately disclosed
the ranges of dollar amounts expected for restructuring plan costs and tariff impacts.
.
January 29, 2019 | Conference Call Slide Presentation 29
RECONCILIATION OF GAAP TO NON-GAAP AMOUNTS
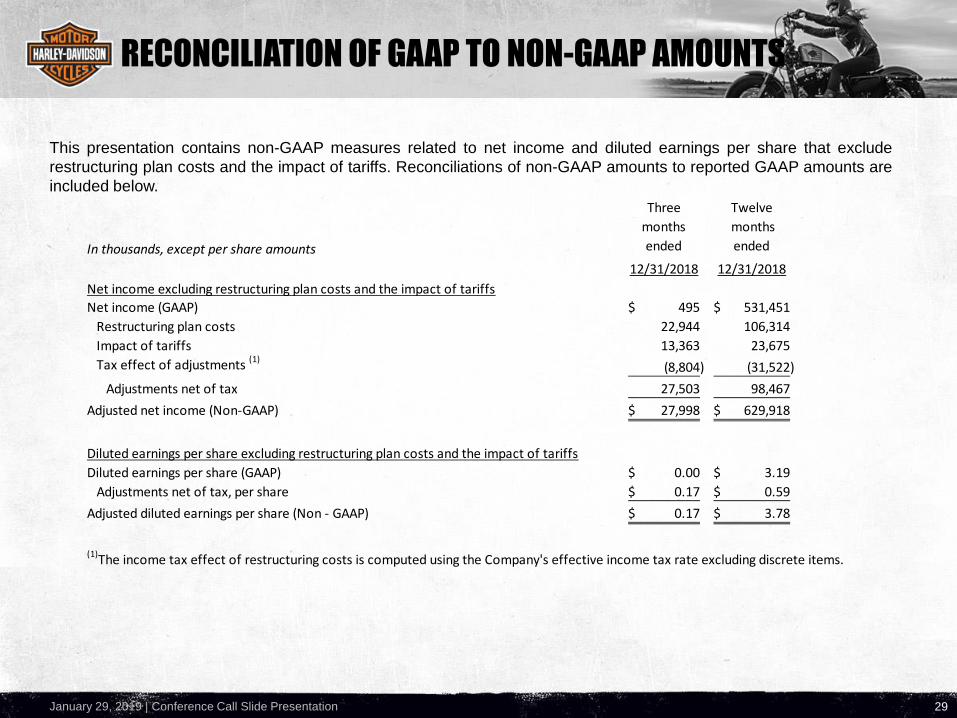
This presentation contains non-GAAP measures related to net income and diluted earnings per share that exclude
restructuring plan costs and the impact of tariffs. Reconciliations of non-GAAP amounts to reported GAAP amounts are
included below.
In thousands, except per share amounts
Three
months
ended
Twelve
months
ended
12/31/2018 12/31/2018
Net income excluding restructuring plan costs and the impact of tariffs
Net income (GAAP) 495$ 531,451$
Restructuring plan costs 22,944 106,314
Impact of tariffs 13,363 23,675
Tax effect of adjustments (1)(8,804) (31,522)
Adjustments net of tax 27,503 98,467
Adjusted net income (Non-GAAP) 27,998$ 629,918$
Diluted earnings per share excluding restructuring plan costs and the impact of tariffs
Diluted earnings per share (GAAP) 0.00$ 3.19$
Adjustments net of tax, per share 0.17$ 0.59$
Adjusted diluted earnings per share (Non - GAAP) 0.17$ 3.78$
(1)The income tax effect of restructuring costs is computed using the Company's effective income tax rate excluding discrete items.
January 29, 2019 | Conference Call Slide Presentation 30
RECONCILIATION OF GAAP TO NON-GAAP AMOUNTS
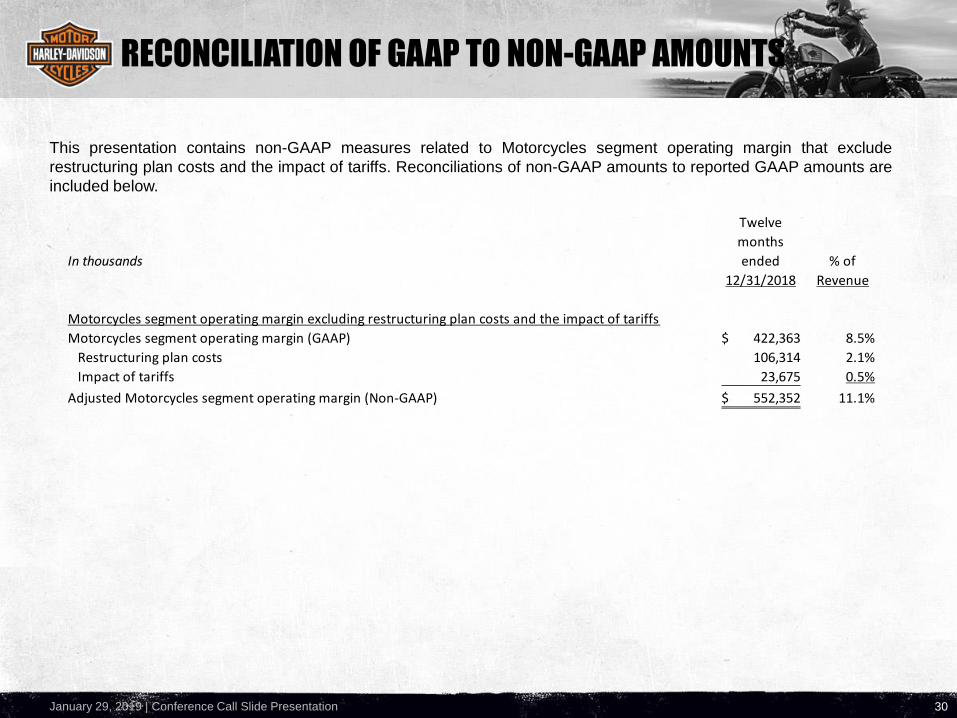
This presentation contains non-GAAP measures related to Motorcycles segment operating margin that exclude
restructuring plan costs and the impact of tariffs. Reconciliations of non-GAAP amounts to reported GAAP amounts are
included below.
In thousands
Twelve
months
ended % of
12/31/2018 Revenue
Motorcycles segment operating margin excluding restructuring plan costs and the impact of tariffs
Motorcycles segment operating margin (GAAP) 422,363$ 8.5%
Restructuring plan costs 106,314 2.1%
Impact of tariffs 23,675 0.5%
Adjusted Motorcycles segment operating margin (Non-GAAP) 552,352$ 11.1%
January 29, 2019 | Conference Call Slide Presentation 31
RECONCILIATION OF GAAP TO NON-GAAP AMOUNTS
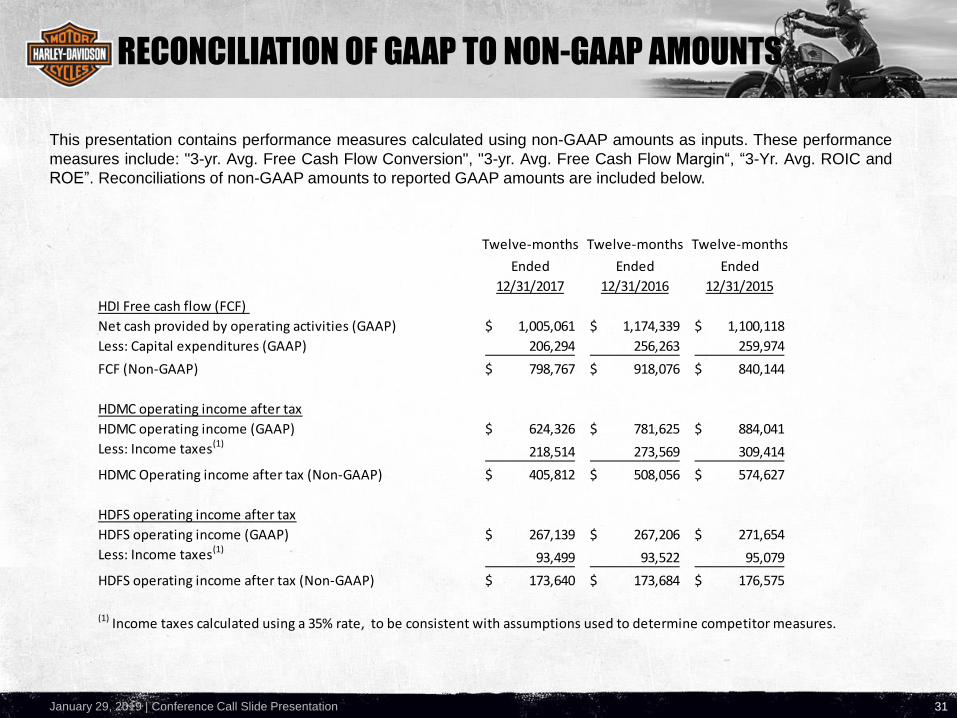
This presentation contains performance measures calculated using non-GAAP amounts as inputs. These performance
measures include: "3-yr. Avg. Free Cash Flow Conversion", "3-yr. Avg. Free Cash Flow Margin“, “3-Yr. Avg. ROIC and
ROE”. Reconciliations of non-GAAP amounts to reported GAAP amounts are included below.
Twelve-months Twelve-months Twelve-months
Ended Ended Ended
12/31/2017 12/31/2016 12/31/2015
HDI Free cash flow (FCF)
Net cash provided by operating activities (GAAP) 1,005,061$ 1,174,339$ 1,100,118$
Less: Capital expenditures (GAAP) 206,294 256,263 259,974
FCF (Non-GAAP) 798,767$ 918,076$ 840,144$
HDMC operating income after tax
HDMC operating income (GAAP) 624,326$ 781,625$ 884,041$
Less: Income taxes(1)218,514 273,569 309,414
HDMC Operating income after tax (Non-GAAP) 405,812$ 508,056$ 574,627$
HDFS operating income after tax
HDFS operating income (GAAP) 267,139$ 267,206$ 271,654$
Less: Income taxes(1)93,499 93,522 95,079
HDFS operating income after tax (Non-GAAP) 173,640$ 173,684$ 176,575$
(1) Income taxes calculated using a 35% rate, to be consistent with assumptions used to determine competitor measures.
January 29, 2019 | Conference Call Slide Presentation
FORWARD-LOOKING STATEMENTS
32
The company intends that certain matters discussed in this presentation are "forward-looking statements" intended to qualify for the safe harbor from liability established by the Private Securities Litigation Reform Act of 1995. These forward-looking statements can generally be identified as such because the context of the statement will include words such as the company "believes", "anticipates", "expects", "plans", “strategy”, “future”, “may”, “goals”, or "estimates" or words of similar meaning. Similarly, statements that describe future plans, strategies, objectives, outlooks, targets, guidance or goals are also forward-looking statements. Such forward-looking statements are subject to certain risks and uncertainties that could cause actual results to differ materially, unfavorably or favorably, from those anticipated as of the date of this presentation. Certain of such risks and uncertainties are described below. Shareholders, potential investors, and other readers are urged to consider these factors in evaluating the forward-looking statements and cautioned not to place undue reliance on such forward-looking statements. The forward-looking statements included in this presentation are only made as of the date of this presentation, and the company disclaims any obligation to publicly update such forward-looking statements to reflect subsequent events or circumstances.
The company's ability to meet the targets and expectations noted above depends upon, among other factors, the company's ability to (i) execute its business plans and strategies, including the elements of the More Roads to Harley-Davidson strategy for growth that the company disclosed on July 30, 2018, and strengthen its existing business while enabling growth, (ii) manage the impact that new or adjusted tariffs may have on the cost of raw materials and components and our ability to sell product internationally, (iii) execute its strategy of growing ridership, globally, (iv) effectively execute the company's manufacturing optimization initiative within expected costs and timing and successfully carry out its global manufacturing and assembly operations, (v) accurately analyze, predict and react to changing market conditions and successfully adjust to shifting global consumer needs and interests, (vi) negotiate and successfully implement a strategic alliance relationship with a local partner in Asia, (vii) develop and introduce products, services and experiences on a timely basis that the market accepts, that enable the company to generate desired sales levels and that provide the desired financial returns, (viii) perform in a manner that enables the company to benefit from market opportunities while competing against existing and new competitors, (ix) realize expectations concerning market demand for electric models, which may depend in part on the building of necessary infrastructure, (x) prevent, detect, and remediate any issues with its motorcycles or any issues associated manufacturing processes to avoid delays in new model launches, recall campaigns, regulatory agency investigations, increased warranty costs or litigation and adverse effects on its reputation and brand strength, and carry out any product programs or recalls within expected costs and timing, (xi) manage supply chain issues, including quality issues and any unexpected interruptions or price increases caused by raw material shortages or natural disasters, (xii) manage the impact that prices for and supply of used motorcycles may have on its business, including on retail sales of new motorcycles, (xiii) reduce other costs to offset costs of the More Roads to Harley-Davidson plan and redirect capital without adversely affecting its existing business, (xiv) balance production volumes for its new motorcycles with consumer demand, (xv) manage risks that arise through expanding international manufacturing, operations and sales, (xvi) manage through changes in general economic and business conditions, including changing capital, credit and retail markets, and the changing political environment, (xvii) continue to manage the relationships and agreements that the company has with its labor unions to help drive long-term competitiveness, (xviii) accurately estimate and adjust to fluctuations in foreign currency exchange rates, interest rates and commodity prices, (xix) continue to develop the capabilities of its distributors and dealers, effectively implement changes relating to its dealers and distribution methods and manage the risks that its independent dealers may have difficulty obtaining capital and managing through changing economic conditions and consumer demand, (xx) retain and attract talented employees, (xxi) prevent a cybersecurity breach involving consumer, employee, dealer, supplier, or company data and respond to evolving regulatory requirements regarding data security, (xxii) manage the credit quality, the loan servicing and collection activities, and the recovery rates of HDFS' loan portfolio, (xxiii) adjust to tax reform, healthcare inflation and reform and pension reform, and successfully estimate the impact of any such reform on the company's business, (xxiv) manage through the effects inconsistent and unpredictable weather patterns may have on retail sales of motorcycles, (xxv) implement and manage enterprise-wide information technology systems, including systems at its manufacturing facilities, (xxvi) manage changes and prepare for requirements in legislative and regulatory environments for its products, services and operations, (xxvii) manage its exposure to product liability claims and commercial or contractual disputes, (xxviii) successfully access the capital and/or credit markets on terms (including interest rates) that are acceptable to the company and within its expectations, and (xxix) lower prices of its motorcycles in certain markets by manufacturing motorcycles in the company’s Thailand facility.
The company could experience delays or disruptions in its operations as a result of work stoppages, strikes, natural causes, terrorism or other factors. Further, actual foreign currency exchange rates may vary from underlying assumptions. Other factors are described in risk factors that the company has disclosed in documents previously filed with the Securities and Exchange Commission. Many of these risk factors are impacted by the current changing capital, credit and retail markets and the company's ability to manage through inconsistent economic conditions.
The company's ability to sell its motorcycles and related products and services and to meet its financial expectations also depends on the ability of the company's independent dealers to sell its motorcycles and related products and services to retail customers. The company depends on the capability and financial capacity of its independent dealers to develop and implement effective retail sales plans to create demand for the motorcycles and related products and services they purchase from the company. In addition, the company's independent dealers and distributors may experience difficulties in operating their businesses and selling Harley-Davidson motorcycles and related products and services as a result of weather, economic conditions or other factors. In recent years, HDFS has experienced historically low levels of retail credit losses, but there is no assurance that this will continue. The company believes that HDFS' retail credit losses may increase over time due to changing consumer credit behavior and HDFS' efforts to increase prudently structured loan approvals to sub-prime borrowers, as well as actions that the company has taken and could take that impact motorcycle values. Refer to "Risk Factors" under Item 1A of the company's Annual Report on Form 10-K for the year ended December 31, 2017 for a discussion of additional risk factors and a more complete discussion of some of the cautionary statements noted above.